phelan piñon hills community services district
TRANSCRIPT

Phelan Piñon Hills Community Services District 4176 Warbler Road • P. O. Box 294049 • Phelan, CA 92329-4049 • (760) 868-1212 Fax (760) 868-2323
Office (760) 868-1212 Phelan Piñon Hills P.O. Box 294049, Phelan, CA 92329
Fax (760) 868-5072 Community Services District E-mail: PPHCSD.org
Agenda materials can be viewed online at http://www.pphcsd.org
FINANCE COMMITTEE MEETING October 9, 2018 – 1:00 p.m.
District Office 4176 Warbler Road, Phelan, CA
AGENDA
1. Call to Order – Pledge of Allegiance
2. Roll Call
3. Approval of Agenda
4. Public Comment – Under this item, any member of the public wishing to directly address theBoard on any item of interest that may or may not be within the subject matter jurisdiction ofthe Board, but not listed on the agenda, may do so at this time. However, the Board isprohibited by law from taking any action on any item not appearing on the agenda unless theaction is otherwise authorized by the Brown Act. Any member of the public wishing to directlyaddress the Board on any item listed on the agenda may do so when the item is beingconsidered by the Board. If you wish to address the Board, please complete a Comment Cardand present it to the Board Secretary. Speakers are requested to be brief in their remarks. TheChair may limit each speaker to a comment period of five (5) minutes.
5. Approval of Minutes – September 17, 2018
6. Review of September Disbursements
7. Review of September Financials
8. Review of Solar Project Credits & Expenses
9. Review of Action Itemsa. Prior Meeting Action Itemsb. Current Meeting Action Items
10. Next Meeting – November 13, 2018
11. Adjournment
Pursuant to Government Code Section 54954.2(a), any request for a disability-related modification or accommodation, including auxiliary aids or services, that is sought in order to participate in the above-agenized public meeting should be directed to the District’s General Manager at (760) 868-1212 at least 24 hours prior to said meeting.
1
Phelan Piñon Hills Community Services District 4176 Warbler Road • P. O. Box 294049 • Phelan, CA 92329-4049 • (760) 868-1212 Fax (760) 868-2323
Office (760) 868-1212 Phelan Piñon Hills P.O. Box 294049, Phelan, CA 92329 Fax (760) 868-5072 Community Services District E-mail: PPHCSD.org
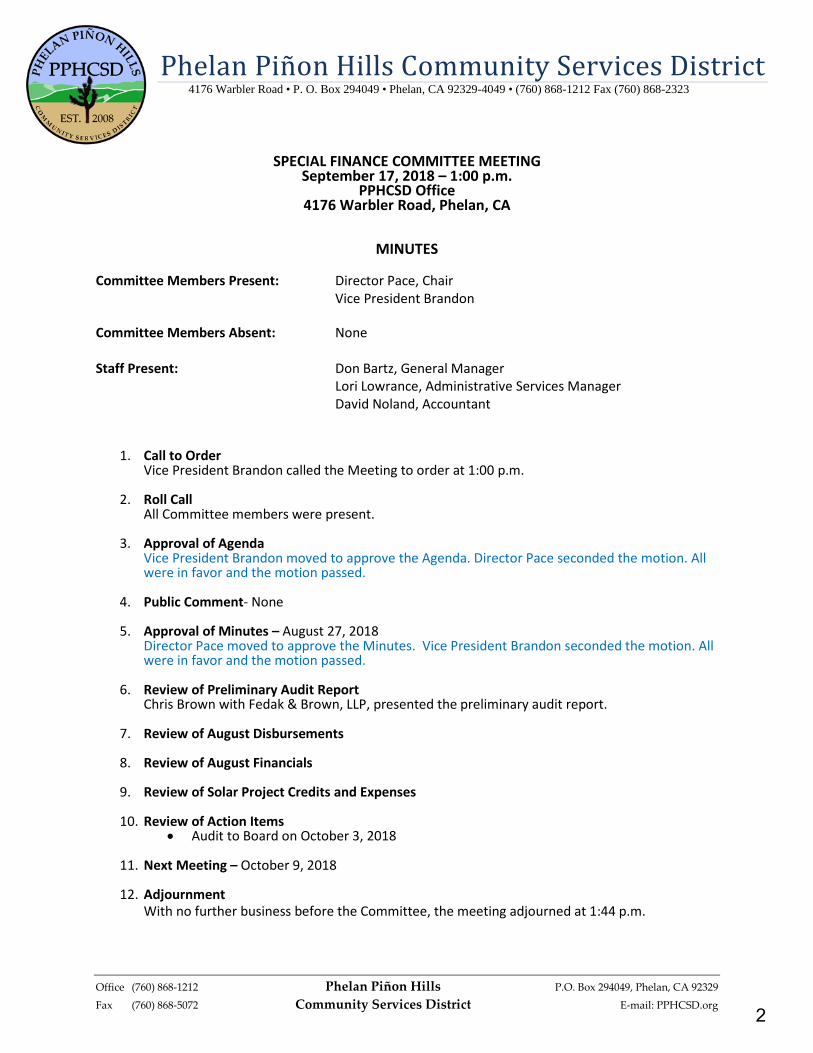
SPECIAL FINANCE COMMITTEE MEETING
September 17, 2018 – 1:00 p.m. PPHCSD Office
4176 Warbler Road, Phelan, CA
MINUTES
Committee Members Present: Director Pace, Chair
Vice President Brandon Committee Members Absent: None Staff Present: Don Bartz, General Manager
Lori Lowrance, Administrative Services Manager David Noland, Accountant
1. Call to Order Vice President Brandon called the Meeting to order at 1:00 p.m.
2. Roll Call All Committee members were present.
3. Approval of Agenda
Vice President Brandon moved to approve the Agenda. Director Pace seconded the motion. All were in favor and the motion passed.
4. Public Comment- None
5. Approval of Minutes – August 27, 2018 Director Pace moved to approve the Minutes. Vice President Brandon seconded the motion. All were in favor and the motion passed.
6. Review of Preliminary Audit Report
Chris Brown with Fedak & Brown, LLP, presented the preliminary audit report.
7. Review of August Disbursements 8. Review of August Financials
9. Review of Solar Project Credits and Expenses 10. Review of Action Items
• Audit to Board on October 3, 2018
11. Next Meeting – October 9, 2018
12. Adjournment With no further business before the Committee, the meeting adjourned at 1:44 p.m.
2

10/3/2018 2:22:55 PM Page 1 of 15
Cash Disbursements ReportPhelan Pinon Hills Community Services District By Payment Number
Payment Dates 09/01/2018 - 09/30/2018
Payment Amount
Payment Number
Payment Date
Account Number
Vendor #
Vendor NamePayable Number Description Item AmountProject Account Key
9/13/2018 Alex Brandon 45.78ALEBRA174
-15.2601-0-1-52210Mileage Reimb. - Aug.20180831
45.7801-0-1-52211Mileage Reimb. - Aug.20180831
7.6322-0-1-52210Mileage Reimb. - Aug.20180831
7.6325-0-1-52210Mileage Reimb. - Aug.20180831
9/13/2018 Aleshire & Wynder, LLP 321.00ALEWYN26101
321.0001-0-1-53120Antelope Valley Legal Svcs. - July47655 C0057 LEGAL
9/13/2018 Apollo Wood Recovery, Inc. 600.00APO WOO26102
600.0022-2-2-53150Wood chip shipping and installation, AV…1101NFL C0061 OUTSIDE SERVIC
9/13/2018 Apple Valley Communications, Inc. 25.00APPVAL26103
25.0001-0-1-53150Security Monitoring - Sept.2336153
9/13/2018 AVCOM Services Inc. 94.50AVCOM26104
94.5001-0-1-53150Answering Svcs. - Aug6076153
9/13/2018 Baldy Mesa Elementary School 1,000.00BAL MESA26105
1,000.0025-0-1-54920Recycling Contest Sponsorship20180904
9/13/2018 Cal Automotive 2,895.76CALAUT26106
2,210.9401-1-8-54710Trk #2 - Brakes Replaced7011
684.8201-1-8-54710Trk #8 - Front Axle Replaced7022
9/13/2018 California Department of Forestry and Fire Protection 2,969.20CA FORREST26107
2,969.2001-1-2-53150Fire Crew at Smithson Springs20180727 C0066 OUTSIDE SERVIC
9/13/2018 California Department of Transportation 6,615.39CALTRANS26108
6,192.5901-1-0-29740Loan15003515016
422.8001-1-1-91010Interest15003515016
9/13/2018 California Turf 178.15CALTUR26109
178.1522-2-2-54620Misc. Repair Parts85872
9/13/2018 CAZCOM, Inc. 175.00CAZCOM26110
175.0001-1-2-53150Site Rent - Sept.37991
9/13/2018 Charter Communications 600.00CHA INT26111
588.0001-0-1-58010Internet Svc. 9/7 - 10/60014069082718
12.0022-0-1-58010Internet Svc. 9/7 - 10/60014069082718
9/13/2018 Core & Main 987.59CORE26112
987.5901-1-0-130101 CTS ClampJ331513
9/13/2018 County of San Bernardino 233.07SBC ISD26113
233.0701-0-1-53150Pager Access - July22508
9/13/2018 County of San Bernardino 4.00SBC PARCELS26114
4.0001-0-1-54830(2) Parcel Map Revisions108322
9/13/2018 County of San Bernardino 160.00SBC LIENS26115
160.0001-1-1-54830(20) Lien Release Docs20180831
9/13/2018 CR&R Incorporated 728.08CR&R26116
217.9622-0-2-58110Trash - Phelan CSD Sept.572848-4538
170.0422-0-2-58110Trash - Pinon Hills Park Sept.573186-1564
340.0822-0-2-58110Trash - Phelan CC Sept.573524-8478
3

Cash Disbursements Report Payment Dates: 09/01/2018 - 09/30/2018
10/3/2018 2:22:55 PM Page 2 of 15
Payment Amount
Payment Number
Payment Date
Account Number
Vendor #
Vendor NamePayable Number Description Item AmountProject Account Key
9/13/2018 High Desert Media Group 468.00DAIPRE26117
468.0001-0-1-54230Subscription Renewal20180904
9/13/2018 Desert Valley Medical Group Inc 435.00DVMG26118
435.0001-0-1-54290MEdical Screening - Gutierrez, Berry & A…6509
9/13/2018 DLT Solutions LLC 2,150.28DLTSOL26119
2,150.2801-1-1-54230Civil 3D Annual Subscription Renewal - 2…4690552A
9/13/2018 Elite Cleaning Pros 1,500.00ELI CLE26120
500.0022-2-2-54620Floor refinishing, Phelan CC001-1
500.0022-2-2-54620Floor refinishing - CSD002
500.0022-2-2-54620Floor refinishing, Pinon Hills CC003
9/13/2018 Eric Barnes 190.00ERIBAR26121
190.0001-1-1-54260Water Dist. (D3) Test & Application Fee20180828
9/13/2018 Fastenal Company 1,204.01FASTEN26122
474.7901-1-5-54500Blue Survey Marking PaintCAVIC61848
112.0001-1-2-54650LED HeadlightCAVIC62059
617.2201-1-5-54500Blue Marking Paint, Qty. (120)CAVIC62217
9/13/2018 Fedak & Brown LLP 6,224.00CHAFED26123
6,224.0001-0-1-53110Professional Svcs. - Aug.20180831
9/13/2018 Frontier Communications 111.32FRO 507226124
111.3201-0-1-58010Oasis Yard Alarm 8/25-9/2420180918
9/13/2018 Frontier Communications 54.39FRO 863726125
54.3922-0-1-58010Phones - PPH Sr. Ctr. 8/19 - 9/1820180912
9/13/2018 G.A. Osborne Pipe & Supply Inc 76.42GAOSBO26126
76.4201-1-2-54500G-Valve394053
9/13/2018 General Pump Company, Inc. 1,200.00GENPUM26127
1,200.0001-1-3-54620Video log well 426621
9/13/2018 High Desert Mountain Water Assn 150.00HDMWA26128
45.0001-1-1-54260Aug. Training - Johnson20180906
85.0001-1-1-54260Review Class - Lewis20180906
20.0001-1-7-54260Aug. Training - Cardenas20180906
9/13/2018 Inland Water Works Supply Co. 5,940.83INLWAT26129
234.1901-1-0-130103/8" ClaVal X43Y StrainerA1015401-002
157.7401-1-0-130108" X101 Position IndicatorA1015401-002
1,034.4001-1-0-130108" G-Valve, S-132 Qty. (1)S1011354-002
431.0001-1-0-1301010"x12" clamp, S-89 Qty. (2)S1014487-001
61.4201-1-0-130101" CTS Coupling, S-2 Qty. (3)S1014844-002
1,697.0601-1-0-130101" Copper 100' blue coated, S-267 Qty. …S1015095-001
429.8401-1-5-54620Full circle clamp for mainline strike by C…S1015260-001
289.4701-1-0-130104" Hytrol Repair KitS1015401-001
408.2001-1-0-130106" ClaVal Hytrol Repair KitS1015401-001
487.8801-1-0-130108" ClaVal Hytrol Repair KitS1015401-001
161.0001-1-0-13010CRL Repair KitS1015401-001
169.1301-1-0-130102" Hytrol Repair KitS1015401-001
170.2101-1-0-130103" Powertrol Repair KitS1015401-001
165.8801-1-0-13010CRDD Repair KitS1015401-001
126.8501-1-0-130106" X101 Position IndicatorS1015401-001
9/13/2018 Lori Lowrance 101.28LORLOW26130
101.2801-0-1-54470GFOA Conf. Travel Reimbursement20180828
4
Cash Disbursements Report Payment Dates: 09/01/2018 - 09/30/2018
10/3/2018 2:22:55 PM Page 3 of 15
Payment Amount
Payment Number
Payment Date
Account Number
Vendor #
Vendor NamePayable Number Description Item AmountProject Account Key
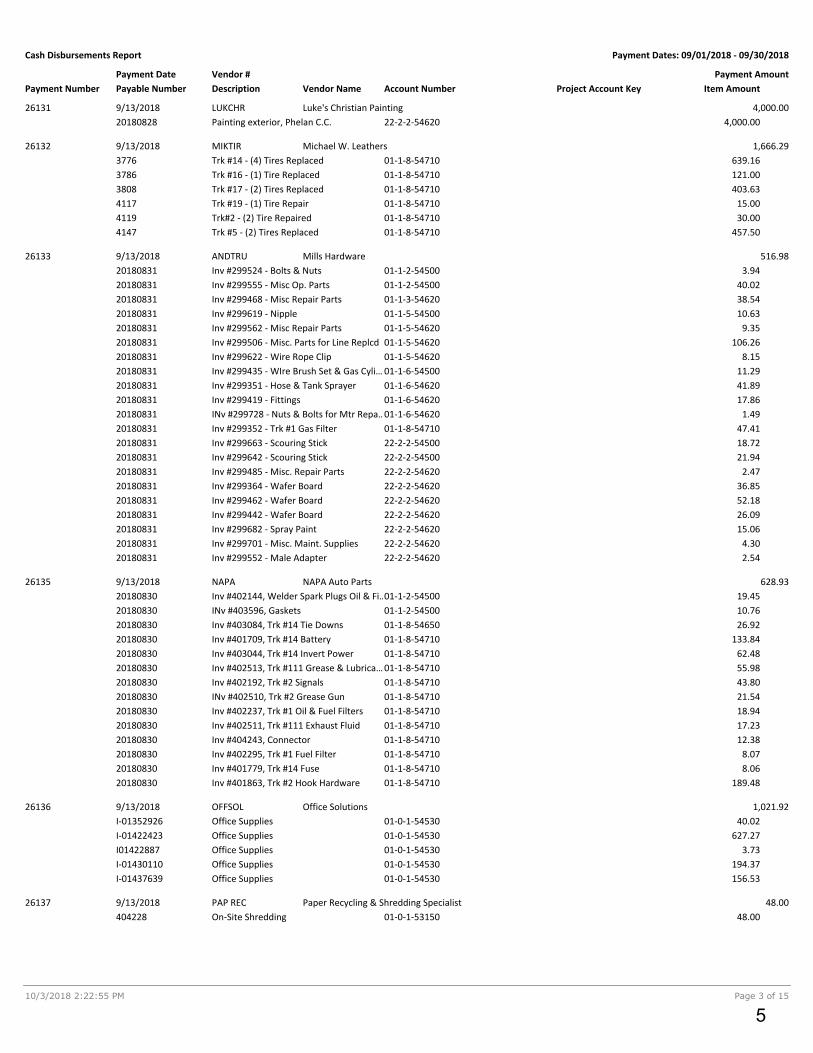
9/13/2018 Luke's Christian Painting 4,000.00LUKCHR26131
4,000.0022-2-2-54620Painting exterior, Phelan C.C.20180828
9/13/2018 Michael W. Leathers 1,666.29MIKTIR26132
639.1601-1-8-54710Trk #14 - (4) Tires Replaced3776
121.0001-1-8-54710Trk #16 - (1) Tire Replaced3786
403.6301-1-8-54710Trk #17 - (2) Tires Replaced3808
15.0001-1-8-54710Trk #19 - (1) Tire Repair4117
30.0001-1-8-54710Trk#2 - (2) Tire Repaired4119
457.5001-1-8-54710Trk #5 - (2) Tires Replaced4147
9/13/2018 Mills Hardware 516.98ANDTRU26133
3.9401-1-2-54500Inv #299524 - Bolts & Nuts20180831
40.0201-1-2-54500Inv #299555 - Misc Op. Parts20180831
38.5401-1-3-54620Inv #299468 - Misc Repair Parts20180831
10.6301-1-5-54500Inv #299619 - Nipple20180831
9.3501-1-5-54620Inv #299562 - Misc Repair Parts20180831
106.2601-1-5-54620Inv #299506 - Misc. Parts for Line Replcd20180831
8.1501-1-5-54620Inv #299622 - Wire Rope Clip20180831
11.2901-1-6-54500Inv #299435 - WIre Brush Set & Gas Cyli…20180831
41.8901-1-6-54620Inv #299351 - Hose & Tank Sprayer20180831
17.8601-1-6-54620Inv #299419 - Fittings20180831
1.4901-1-6-54620INv #299728 - Nuts & Bolts for Mtr Repa…20180831
47.4101-1-8-54710Inv #299352 - Trk #1 Gas Filter20180831
18.7222-2-2-54500Inv #299663 - Scouring Stick20180831
21.9422-2-2-54500Inv #299642 - Scouring Stick20180831
2.4722-2-2-54620Inv #299485 - Misc. Repair Parts20180831
36.8522-2-2-54620Inv #299364 - Wafer Board20180831
52.1822-2-2-54620Inv #299462 - Wafer Board20180831
26.0922-2-2-54620Inv #299442 - Wafer Board20180831
15.0622-2-2-54620Inv #299682 - Spray Paint20180831
4.3022-2-2-54620Inv #299701 - Misc. Maint. Supplies20180831
2.5422-2-2-54620Inv #299552 - Male Adapter20180831
9/13/2018 NAPA Auto Parts 628.93NAPA26135
19.4501-1-2-54500Inv #402144, Welder Spark Plugs Oil & Fi…20180830
10.7601-1-2-54500INv #403596, Gaskets20180830
26.9201-1-8-54650Inv #403084, Trk #14 Tie Downs20180830
133.8401-1-8-54710Inv #401709, Trk #14 Battery20180830
62.4801-1-8-54710Inv #403044, Trk #14 Invert Power20180830
55.9801-1-8-54710Inv #402513, Trk #111 Grease & Lubrica…20180830
43.8001-1-8-54710Inv #402192, Trk #2 Signals20180830
21.5401-1-8-54710INv #402510, Trk #2 Grease Gun20180830
18.9401-1-8-54710Inv #402237, Trk #1 Oil & Fuel Filters20180830
17.2301-1-8-54710Inv #402511, Trk #111 Exhaust Fluid20180830
12.3801-1-8-54710Inv #404243, Connector20180830
8.0701-1-8-54710Inv #402295, Trk #1 Fuel Filter20180830
8.0601-1-8-54710Inv #401779, Trk #14 Fuse20180830
189.4801-1-8-54710Inv #401863, Trk #2 Hook Hardware20180830
9/13/2018 Office Solutions 1,021.92OFFSOL26136
40.0201-0-1-54530Office SuppliesI-01352926
627.2701-0-1-54530Office SuppliesI-01422423
3.7301-0-1-54530Office SuppliesI01422887
194.3701-0-1-54530Office SuppliesI-01430110
156.5301-0-1-54530Office SuppliesI-01437639
9/13/2018 Paper Recycling & Shredding Specialist 48.00PAP REC26137
48.0001-0-1-53150On-Site Shredding404228
5
Cash Disbursements Report Payment Dates: 09/01/2018 - 09/30/2018
10/3/2018 2:22:55 PM Page 4 of 15
Payment Amount
Payment Number
Payment Date
Account Number
Vendor #
Vendor NamePayable Number Description Item AmountProject Account Key
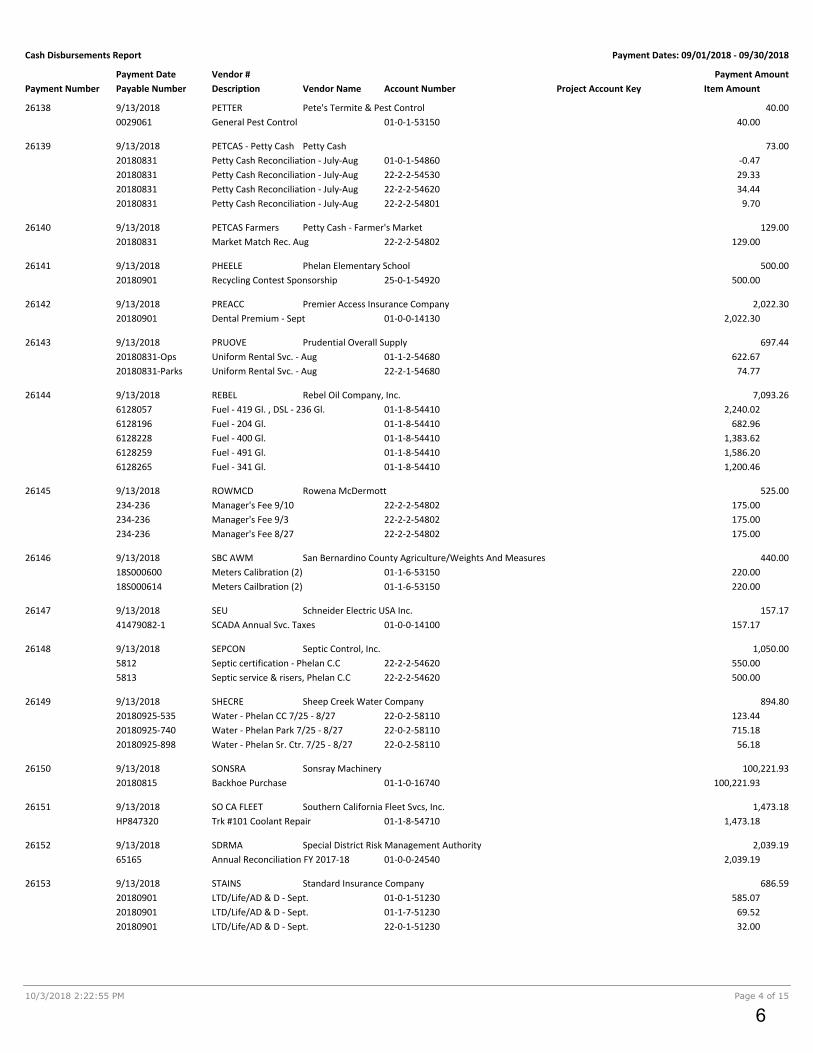
9/13/2018 Pete's Termite & Pest Control 40.00PETTER26138
40.0001-0-1-53150General Pest Control0029061
9/13/2018 Petty Cash 73.00PETCAS - Petty Cash26139
-0.4701-0-1-54860Petty Cash Reconciliation - July-Aug20180831
29.3322-2-2-54530Petty Cash Reconciliation - July-Aug20180831
34.4422-2-2-54620Petty Cash Reconciliation - July-Aug20180831
9.7022-2-2-54801Petty Cash Reconciliation - July-Aug20180831
9/13/2018 Petty Cash - Farmer's Market 129.00PETCAS Farmers26140
129.0022-2-2-54802Market Match Rec. Aug20180831
9/13/2018 Phelan Elementary School 500.00PHEELE26141
500.0025-0-1-54920Recycling Contest Sponsorship20180901
9/13/2018 Premier Access Insurance Company 2,022.30PREACC26142
2,022.3001-0-0-14130Dental Premium - Sept20180901
9/13/2018 Prudential Overall Supply 697.44PRUOVE26143
622.6701-1-2-54680Uniform Rental Svc. - Aug20180831-Ops
74.7722-2-1-54680Uniform Rental Svc. - Aug20180831-Parks
9/13/2018 Rebel Oil Company, Inc. 7,093.26REBEL26144
2,240.0201-1-8-54410Fuel - 419 Gl. , DSL - 236 Gl.6128057
682.9601-1-8-54410Fuel - 204 Gl.6128196
1,383.6201-1-8-54410Fuel - 400 Gl.6128228
1,586.2001-1-8-54410Fuel - 491 Gl.6128259
1,200.4601-1-8-54410Fuel - 341 Gl.6128265
9/13/2018 Rowena McDermott 525.00ROWMCD26145
175.0022-2-2-54802Manager's Fee 9/10234-236
175.0022-2-2-54802Manager's Fee 9/3234-236
175.0022-2-2-54802Manager's Fee 8/27234-236
9/13/2018 San Bernardino County Agriculture/Weights And Measures 440.00SBC AWM26146
220.0001-1-6-53150Meters Calibration (2)18S000600
220.0001-1-6-53150Meters Cailbration (2)18S000614
9/13/2018 Schneider Electric USA Inc. 157.17SEU26147
157.1701-0-0-14100SCADA Annual Svc. Taxes41479082-1
9/13/2018 Septic Control, Inc. 1,050.00SEPCON26148
550.0022-2-2-54620Septic certification - Phelan C.C5812
500.0022-2-2-54620Septic service & risers, Phelan C.C5813
9/13/2018 Sheep Creek Water Company 894.80SHECRE26149
123.4422-0-2-58110Water - Phelan CC 7/25 - 8/2720180925-535
715.1822-0-2-58110Water - Phelan Park 7/25 - 8/2720180925-740
56.1822-0-2-58110Water - Phelan Sr. Ctr. 7/25 - 8/2720180925-898
9/13/2018 Sonsray Machinery 100,221.93SONSRA26150
100,221.9301-1-0-16740Backhoe Purchase20180815
9/13/2018 Southern California Fleet Svcs, Inc. 1,473.18SO CA FLEET26151
1,473.1801-1-8-54710Trk #101 Coolant RepairHP847320
9/13/2018 Special District Risk Management Authority 2,039.19SDRMA26152
2,039.1901-0-0-24540Annual Reconciliation FY 2017-1865165
9/13/2018 Standard Insurance Company 686.59STAINS26153
585.0701-0-1-51230LTD/Life/AD & D - Sept.20180901
69.5201-1-7-51230LTD/Life/AD & D - Sept.20180901
32.0022-0-1-51230LTD/Life/AD & D - Sept.20180901
6
Cash Disbursements Report Payment Dates: 09/01/2018 - 09/30/2018
10/3/2018 2:22:55 PM Page 5 of 15
Payment Amount
Payment Number
Payment Date
Account Number
Vendor #
Vendor NamePayable Number Description Item AmountProject Account Key
9/13/2018 The Heritage School 1,500.00THE HER26154
1,500.0025-0-1-54920Recycling Contest Sponsorship20180904
9/13/2018 Tom Dodson & Associates 2,000.00TOMDOD26155
1,000.0001-0-0-17000Pressure Zone 7 pipeline projects - NOEPPH102 18-1 C0060 OUTSIDE SERVIC
1,000.0001-0-0-17000Pressure Zone 7 pipeline projects - NOEPPH104 18-1 C0060 OUTSIDE SERVIC
9/13/2018 Top Notch Networking, LLC 3,389.83TOPNOT26156
990.1601-0-0-17000Server switch hub and patch panel rack -…002514 C0035 COMPUTER EQUIPMENT
366.8701-0-1-58010Office Phones 8/20 - 9/191080845
2,032.8001-0-1-53170Software Support - Sept.20941
9/13/2018 TRLS Engineering, Inc 3,090.00TRLS26157
850.0001-1-1-53150Survey Services - Monument Reset3032
2,240.0001-1-1-53150Dairy legal description exclusions - lease3033
9/13/2018 Turner Security, Inc 153.80TURSEC26158
153.8001-0-1-53150Monitoring Svcs. - Sept.177009
9/13/2018 Tyler Technologies, Inc 6,596.96TYLTEC26159
6,331.9601-0-0-14100Purchase Order Annual Maint.025-232723
265.0001-1-6-53170UB Online Support025-233749
9/13/2018 Ultimate Internet Access, Inc. 399.00UIA26160
399.0001-0-1-58010Internet - Shop 9/14-10/1494503
9/13/2018 Underground Service Alert of So. Cal. 717.85USA26161
717.8501-1-2-53150(429) Tickets & Maint. Fee82010537
9/13/2018 HD Supply Facilities Maintenance, Ltd 1,022.48USABB26162
1,022.4801-1-3-54620Cl2 pump for well # 5648401
9/13/2018 Weno Office Solutions 28.47WENO26163
28.4701-0-1-53150Copy Machine Maint.5095
9/27/2018 Aleshire & Wynder, LLP 286.88ALEWYN26165
286.8801-0-1-53120Antelope Valley Legal Svcs. - Aug48163 C0057 LEGAL
9/27/2018 Angelica Romero 61.15ANGROM26166
61.1501-0-1-54470Mileage Reimb. Tyler User Group Meeti…20180919
9/27/2018 Arturo & Maria Torres 969.75ARTKIT26167
969.7522-2-2-54801Phelan CC - Senior Lunch20180905
9/27/2018 Brunick, McElhaney & Kennedy 6,350.00BRUMCE26168
5,850.0001-0-1-53120Legal Svcs. - Admin127
62.5001-0-1-53120Legal Svcs. - Sheep Creek127 C0050 OUTSIDE SERVICE
75.0022-0-1-53120Legal Svcs. - Parks127
50.0022-0-1-53120Legal Svcs. - Parks Master Plan127 C0068 OUTSIDE SVCS
312.5025-0-1-53120Legal Svcs. - SW127
9/27/2018 Daniel A. Madora 39.06CARENG26169
39.0601-0-1-54530Name Tags with Logo4485
9/27/2018 Cintas First Aid & Safety 201.89CINFIR26170
109.8201-1-1-54500First Aid Supplies - Shop5011463766
90.2301-0-1-54500First Aid Supplies - CSD5011842220
1.8422-0-1-54500First Aid Supplies - CSD5011842220
9/27/2018 Core & Main 1,975.18CORE26171
987.5901-1-0-130101 CTS ClampJ443888
987.5901-1-0-130101 CTS ClampJ445697
7

Cash Disbursements Report Payment Dates: 09/01/2018 - 09/30/2018
10/3/2018 2:22:55 PM Page 6 of 15
Payment Amount
Payment Number
Payment Date
Account Number
Vendor #
Vendor NamePayable Number Description Item AmountProject Account Key
9/27/2018 County of San Bernardino 233.07SBC ISD26172
233.0701-0-1-53150Pager Access - Aug.22620
9/27/2018 Department of Motor Vehicles 9.00DMV26173
9.0001-0-1-54290(9) Pull Notices5913174
9/27/2018 Fastenal Company 4,102.76FASTEN26174
1,033.3201-1-5-54620Galv. Cable for cable pullerCAVIC62294
1,529.6201-1-5-54650Misc. Power tools for Water OperationsCAVIC62493
568.8201-1-2-54650Small toolsCAVIC62494
823.1701-1-5-54650Misc. small tools for water operationsCAVIC62551
90.5001-1-5-54650Misc. Power tools for Water OperationsCAVIC62552
57.3301-1-3-54500Small Drill BitsCAVIC62641
9/27/2018 Frontier Communications 173.05FRO 343426175
173.0501-1-5-58010Phones - Telemetry 9/10-10/920181004
9/27/2018 Frontier Communications 76.07FRO 574326176
76.0701-0-1-58010Phones - Offie 9/4 - 10/620181001
9/27/2018 G.A. Osborne Pipe & Supply Inc 94.27GAOSBO26177
94.2701-1-3-54500Teflon Tape & Gauges394369
9/27/2018 Garda CL West, Inc 310.33GARDA26178
310.3301-0-1-54200Armored Svcs. - Sept.10424870
9/27/2018 GEO-Monitor, Inc. 935.50GEOMON26179
935.5001-1-4-53140Rountine Samples20942
9/27/2018 Green Play, LLC 6,111.25GRE PLA26180
6,111.2501-0-0-17000Parks Master Plan, Consulting Svcs Parti…6190 C0068 OUTSIDE SVCS
9/27/2018 GreenEarth Landscape 90.00GREEAR26181
90.0022-2-2-54620Phelan Park Maint. - Aug.00223
9/27/2018 Herc Rentals Inc. 503.18HERC26182
503.1801-0-0-17500Asphalt roller for sunnyslope pipeline p…30201835-001 C0067 OUTSIDE SERVICE
9/27/2018 Infosend Inc 10,803.21INFOSE26183
8,630.1201-0-6-54860Postage/Printing - Aug141659
93.7101-0-6-54890Postage/Printing - County Fire Charge141659
798.7001-0-6-54890Postage/Printing - Aug141659
698.5601-1-9-54800Postage/Printing - Aug141659
349.2922-2-2-54802Postage/Printing - Aug141659
232.8325-5-1-54800Postage/Printing - Aug141659
9/27/2018 James C. Loveless 2,404.32SMA FLO26184
2,404.3222-2-2-54620Pinon Hills C.C. carpet replacement20180828
9/27/2018 Jesus Castaneda 410.00JES CAS26185
410.0001-0-1-54530Safety Luncheon20180919
9/27/2018 Richard J. Linsalato 380.00LIN SVC26186
350.0001-0-1-54320Office & Window CleaningINV2018092
30.0022-0-1-54320Window Cleaning CCINV2018092
9/27/2018 Lowe's Credit 108.14LOWES26187
108.1401-1-2-54620Misc. Repair Parts8444740
9/27/2018 Mango Grill 808.13MANGRI26188
808.1322-2-2-54801CSD Sr. Luncheon 9/2020180920
9/27/2018 Michael W. Leathers 511.56MIKTIR26189
380.5601-1-8-54710Trk#110 - (4) Tires Replaced3775
24.0001-1-8-54710Trk #16 - (2) Tires Repair4150
8

Cash Disbursements Report Payment Dates: 09/01/2018 - 09/30/2018
10/3/2018 2:22:55 PM Page 7 of 15
Payment Amount
Payment Number
Payment Date
Account Number
Vendor #
Vendor NamePayable Number Description Item AmountProject Account Key
12.0001-1-8-54710Trk #16 - Tire Repair4249
95.0001-1-8-54710Trk #14 - Front Brakes4293
9/27/2018 Mountaineer Progress Newspaper 500.00MOUPRO26190
500.0022-2-0-17000Ad for parks master plan community wo…2018-10756 C0068 OUTSIDE SVCS
9/27/2018 Office Solutions 148.65OFFSOL26191
35.6101-0-1-54530Office SuppliesI-01442354
138.2301-0-1-54530Office SuppliesI-01443388
-25.1901-0-1-54530CR- Items ReturnedPCR-178542
9/27/2018 Davy R Feller 312.71PHEEXP26192
154.8401-1-8-54710Trk #4 - Oil & Filter Change8974
64.0101-1-8-54710Trk #9 - Oil & Filter Change9206
93.8601-1-8-54710Trk #19 - Oil & Filter Change9280
9/27/2018 Premier Access Insurance Company 2,022.30PREACC26193
2,022.3001-0-0-14130Dental Premium - Oct20181001
9/27/2018 Rebel Oil Company, Inc. 2,082.20REBEL26194
710.2201-1-8-54410Fuel - 200 Gl.6128282
1,371.9801-1-8-54410Fuel - 392 Gl.6163111
9/27/2018 Rowena McDermott 350.00ROWMCD26195
175.0022-2-2-54802Manager's Fee 9/24237-238
175.0022-2-2-54802Manager's Fee 9/17237-238
9/27/2018 Standard Insurance Company 748.80STAINS26196
630.7101-0-1-51230LTD/Life/AD&D - Oct.20181001
78.1701-1-7-51230LTD/Life/AD&D - Oct.20181001
39.9222-0-1-51230LTD/Life/AD&D - Oct.20181001
9/27/2018 Top Notch Networking, LLC 536.86TOPNOT26197
366.8701-0-1-58010Office Phones 9/20-10/191107210
169.9901-0-1-54530Printer Set Up & Network Support20984
9/27/2018 Tyler Technologies, Inc 8,637.28TYLTEC26198
8,372.2801-0-0-14100Software Support - CIS Annual Maint.025-235968
265.0001-1-6-53170UB Online Support025-236470
9/27/2018 UNIVAR INC. 3,160.31UNIVAR26199
1,611.7701-1-3-54500Liquid Chl.LA664235
1,548.5401-1-3-54500Liquid Chl.LA668673
9/27/2018 HD Supply Facilities Maintenance, Ltd 689.55USABB26200
317.9301-1-3-54620Cl2 tubing for wells656625
371.6201-1-5-54620Pulling eye for service line puller661254
9/27/2018 Waxie Enterprises, Inc 1,041.52WAXIE26201
51.9201-0-1-54530Toilet Paper-case77718579
96.2201-0-1-54530Paper Towels-case77718579
12.5001-1-1-54500Street Broom Head-Field77718579
90.0722-2-2-54500Dust Mop Heads-case77718579
192.4322-2-2-54500Paper Towels-case77718579
120.8322-2-2-54500Floor Mop Heads-case77718579
103.8322-2-2-54500Toilet Paper-case77718579
56.3822-2-2-54500Bowl Cleaner-case77718579
212.6922-2-2-54500Trash Bags-case77718579
22.8422-2-2-54500Clorox Bleach-case77718579
19.2022-2-2-54500Broom77718579
7.7522-2-2-54500Fuel Surcharge77718579
54.8622-2-2-54500Windex-case77718579
9
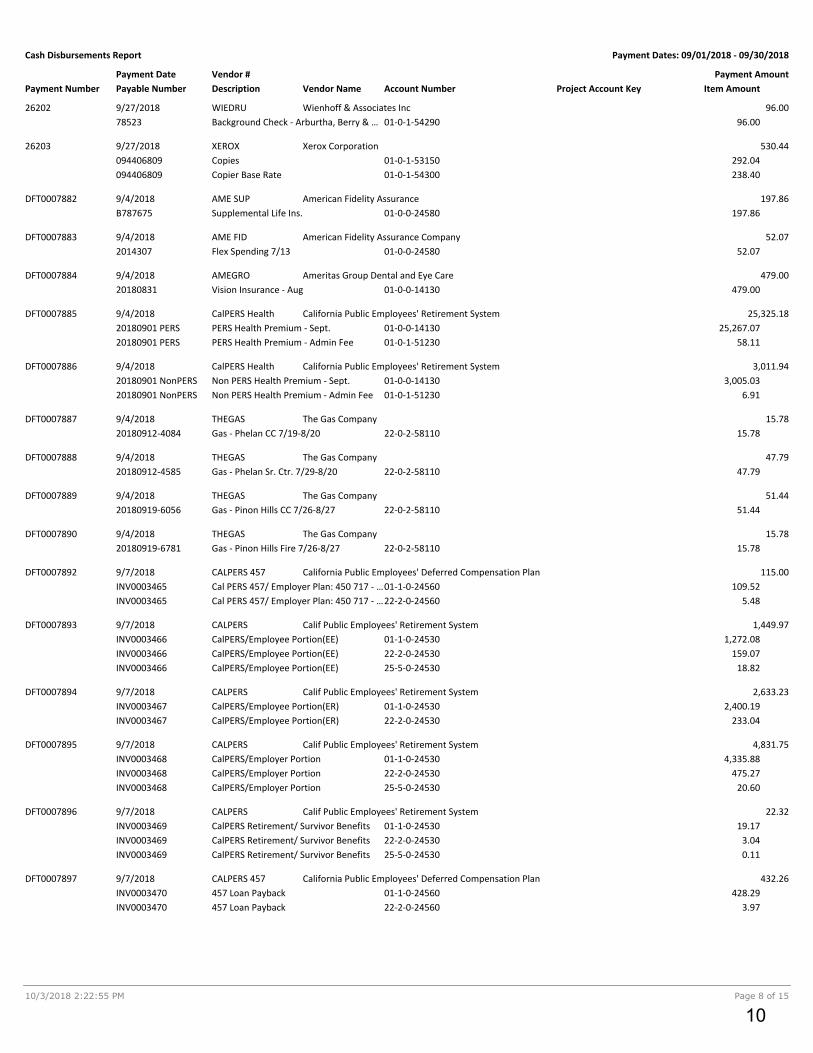
Cash Disbursements Report Payment Dates: 09/01/2018 - 09/30/2018
10/3/2018 2:22:55 PM Page 8 of 15
Payment Amount
Payment Number
Payment Date
Account Number
Vendor #
Vendor NamePayable Number Description Item AmountProject Account Key
9/27/2018 Wienhoff & Associates Inc 96.00WIEDRU26202
96.0001-0-1-54290Background Check - Arburtha, Berry & …78523
9/27/2018 Xerox Corporation 530.44XEROX26203
292.0401-0-1-53150Copies094406809
238.4001-0-1-54300Copier Base Rate094406809
9/4/2018 American Fidelity Assurance 197.86AME SUPDFT0007882
197.8601-0-0-24580Supplemental Life Ins.B787675
9/4/2018 American Fidelity Assurance Company 52.07AME FIDDFT0007883
52.0701-0-0-24580Flex Spending 7/132014307
9/4/2018 Ameritas Group Dental and Eye Care 479.00AMEGRODFT0007884
479.0001-0-0-14130Vision Insurance - Aug20180831
9/4/2018 California Public Employees' Retirement System 25,325.18CalPERS HealthDFT0007885
25,267.0701-0-0-14130PERS Health Premium - Sept.20180901 PERS
58.1101-0-1-51230PERS Health Premium - Admin Fee20180901 PERS
9/4/2018 California Public Employees' Retirement System 3,011.94CalPERS HealthDFT0007886
3,005.0301-0-0-14130Non PERS Health Premium - Sept.20180901 NonPERS
6.9101-0-1-51230Non PERS Health Premium - Admin Fee20180901 NonPERS
9/4/2018 The Gas Company 15.78THEGASDFT0007887
15.7822-0-2-58110Gas - Phelan CC 7/19-8/2020180912-4084
9/4/2018 The Gas Company 47.79THEGASDFT0007888
47.7922-0-2-58110Gas - Phelan Sr. Ctr. 7/29-8/2020180912-4585
9/4/2018 The Gas Company 51.44THEGASDFT0007889
51.4422-0-2-58110Gas - Pinon Hills CC 7/26-8/2720180919-6056
9/4/2018 The Gas Company 15.78THEGASDFT0007890
15.7822-0-2-58110Gas - Pinon Hills Fire 7/26-8/2720180919-6781
9/7/2018 California Public Employees' Deferred Compensation Plan 115.00CALPERS 457DFT0007892
109.5201-1-0-24560Cal PERS 457/ Employer Plan: 450 717 - …INV0003465
5.4822-2-0-24560Cal PERS 457/ Employer Plan: 450 717 - …INV0003465
9/7/2018 Calif Public Employees' Retirement System 1,449.97CALPERSDFT0007893
1,272.0801-1-0-24530CalPERS/Employee Portion(EE)INV0003466
159.0722-2-0-24530CalPERS/Employee Portion(EE)INV0003466
18.8225-5-0-24530CalPERS/Employee Portion(EE)INV0003466
9/7/2018 Calif Public Employees' Retirement System 2,633.23CALPERSDFT0007894
2,400.1901-1-0-24530CalPERS/Employee Portion(ER)INV0003467
233.0422-2-0-24530CalPERS/Employee Portion(ER)INV0003467
9/7/2018 Calif Public Employees' Retirement System 4,831.75CALPERSDFT0007895
4,335.8801-1-0-24530CalPERS/Employer PortionINV0003468
475.2722-2-0-24530CalPERS/Employer PortionINV0003468
20.6025-5-0-24530CalPERS/Employer PortionINV0003468
9/7/2018 Calif Public Employees' Retirement System 22.32CALPERSDFT0007896
19.1701-1-0-24530CalPERS Retirement/ Survivor BenefitsINV0003469
3.0422-2-0-24530CalPERS Retirement/ Survivor BenefitsINV0003469
0.1125-5-0-24530CalPERS Retirement/ Survivor BenefitsINV0003469
9/7/2018 California Public Employees' Deferred Compensation Plan 432.26CALPERS 457DFT0007897
428.2901-1-0-24560457 Loan PaybackINV0003470
3.9722-2-0-24560457 Loan PaybackINV0003470
10

Cash Disbursements Report Payment Dates: 09/01/2018 - 09/30/2018
10/3/2018 2:22:55 PM Page 9 of 15
Payment Amount
Payment Number
Payment Date
Account Number
Vendor #
Vendor NamePayable Number Description Item AmountProject Account Key
9/7/2018 California Public Employees' Deferred Compensation Plan 75.42CALPERS 457DFT0007898
75.4201-1-0-24560457 Loan PaybackINV0003471
9/7/2018 California State Disbursement Unit 46.15CALSTADFT0007899
46.1501-1-0-245200710185587-01INV0003472
9/7/2018 Employment Development Department 576.53EDDDFT0007900
576.5301-0-0-24510State Disability Ins - Payroll TaxesINV0003473
9/7/2018 Internal Revenue Service 134.10IRSDFT0007901
134.1001-0-0-24510Social Security - Payroll TaxesINV0003474
9/7/2018 Employment Development Department 79.37EDDDFT0007902
79.3701-0-0-24510State Unemployment Ins - Payroll TaxesINV0003475
9/7/2018 Employment Development Department 1,963.23EDDDFT0007903
1,963.2301-0-0-24510CA State Income Tax - Payroll TaxesINV0003476
9/7/2018 Internal Revenue Service 1,841.04IRSDFT0007904
1,841.0401-0-0-24510Medicare - Payroll TaxesINV0003477
9/7/2018 Internal Revenue Service 5,258.70IRSDFT0007905
5,258.7001-0-0-24510Federal Income Tax - Payroll TaxesINV0003478
9/5/2018 Southern California Edison 48,549.31SCE 9515DFT0007906
-32,926.6501-0-3-58115Electricity - Solar CR20180920
21,449.1101-1-3-58110Electricity - Wells, Boosters, Tanks20180920
58,938.0301-1-3-58110Electricity - Wells, Boosters & Tanks20180920
1,088.8223-3-2-58210Electricity - St. Lights20180920
9/5/2018 Southern California Edison 2,674.52SCE 9515DFT0007907
2,674.5201-1-3-58110Electricity - Tank 3A20180912
9/5/2018 Southern California Edison 2,101.75SCE 9515DFT0007908
-6,674.4001-0-3-58115Electricity - Solar CR20180919
8,776.1501-1-3-58110Electricity - Wells, Boosters, Tanks20180919
9/5/2018 Southern California Edison 335.91SCE 7441DFT0007909
335.9122-0-2-58110Electricity - Pinon Hills CC20180920
9/5/2018 Southern California Edison 9.98SCE 4241DFT0007910
9.9820-0-0-58110Electricity - S. Dairy Mobile 7/31 - 8/2920180918
9/5/2018 Southern California Edison 23.37SCE 2439DFT0007911
23.3722-0-2-58110Electricity - Phelan Park 7/26 - 8/2420180913
9/5/2018 Southern California Edison 154.24SCE 8092DFT0007912
154.2401-1-3-58110Electricity - N. Dairy Well 7/31 - 8/2920180918
9/5/2018 Southern California Edison 10.08SCE 3752DFT0007913
10.0820-0-0-58110Electricity - N. Daiiry Mobile 7/31 - 8/2920180918
9/5/2018 CalPERS 1,050.00CalPERDFT0007914
1,050.0001-0-1-53110FY 2017-18 GASB 68 Reports & Schedul…15403446
9/5/2018 American Fidelity Assurance Company 52.07AME FIDDFT0007915
52.0701-0-0-24580Flex Spending 8/312017123
9/7/2018 Employment Development Department 5.12EDDDFT0007916
5.1201-0-0-24510State Disability Ins - Payroll TaxesINV0003479
9/7/2018 Employment Development Department 31.74EDDDFT0007917
31.7401-0-0-24510State Unemployment Ins - Payroll TaxesINV0003480
11
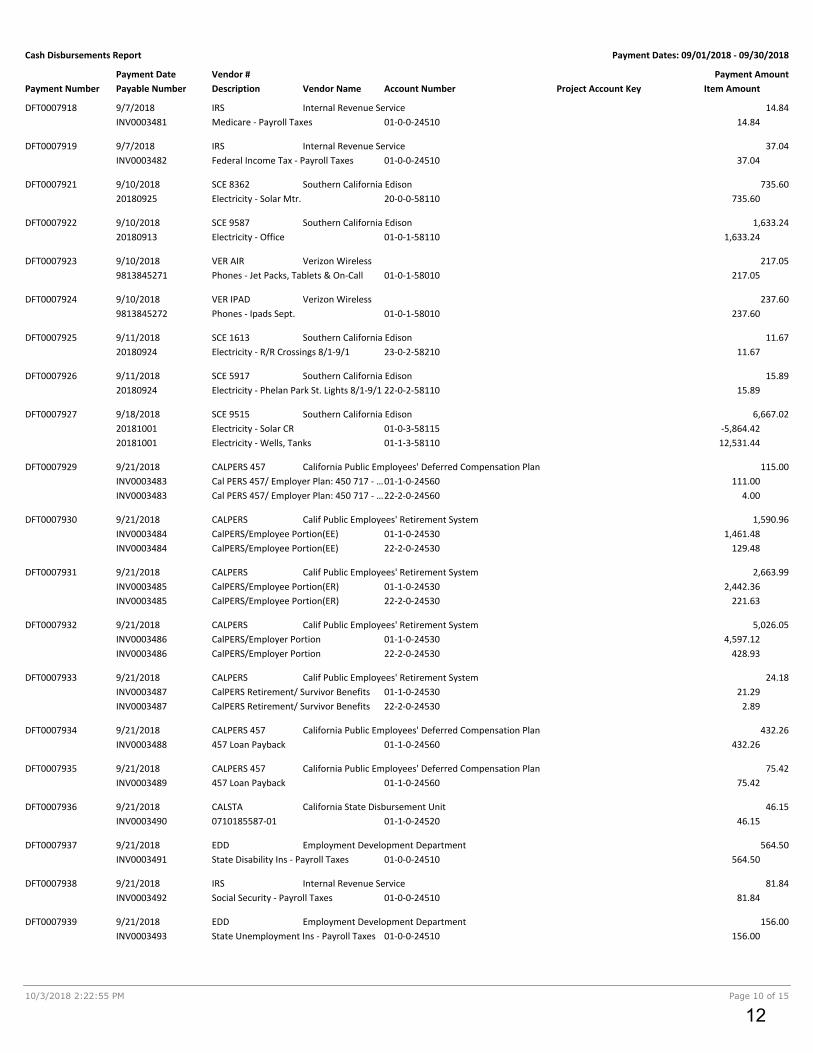
Cash Disbursements Report Payment Dates: 09/01/2018 - 09/30/2018
10/3/2018 2:22:55 PM Page 10 of 15
Payment Amount
Payment Number
Payment Date
Account Number
Vendor #
Vendor NamePayable Number Description Item AmountProject Account Key
9/7/2018 Internal Revenue Service 14.84IRSDFT0007918
14.8401-0-0-24510Medicare - Payroll TaxesINV0003481
9/7/2018 Internal Revenue Service 37.04IRSDFT0007919
37.0401-0-0-24510Federal Income Tax - Payroll TaxesINV0003482
9/10/2018 Southern California Edison 735.60SCE 8362DFT0007921
735.6020-0-0-58110Electricity - Solar Mtr.20180925
9/10/2018 Southern California Edison 1,633.24SCE 9587DFT0007922
1,633.2401-0-1-58110Electricity - Office20180913
9/10/2018 Verizon Wireless 217.05VER AIRDFT0007923
217.0501-0-1-58010Phones - Jet Packs, Tablets & On-Call9813845271
9/10/2018 Verizon Wireless 237.60VER IPADDFT0007924
237.6001-0-1-58010Phones - Ipads Sept.9813845272
9/11/2018 Southern California Edison 11.67SCE 1613DFT0007925
11.6723-0-2-58210Electricity - R/R Crossings 8/1-9/120180924
9/11/2018 Southern California Edison 15.89SCE 5917DFT0007926
15.8922-0-2-58110Electricity - Phelan Park St. Lights 8/1-9/120180924
9/18/2018 Southern California Edison 6,667.02SCE 9515DFT0007927
-5,864.4201-0-3-58115Electricity - Solar CR20181001
12,531.4401-1-3-58110Electricity - Wells, Tanks20181001
9/21/2018 California Public Employees' Deferred Compensation Plan 115.00CALPERS 457DFT0007929
111.0001-1-0-24560Cal PERS 457/ Employer Plan: 450 717 - …INV0003483
4.0022-2-0-24560Cal PERS 457/ Employer Plan: 450 717 - …INV0003483
9/21/2018 Calif Public Employees' Retirement System 1,590.96CALPERSDFT0007930
1,461.4801-1-0-24530CalPERS/Employee Portion(EE)INV0003484
129.4822-2-0-24530CalPERS/Employee Portion(EE)INV0003484
9/21/2018 Calif Public Employees' Retirement System 2,663.99CALPERSDFT0007931
2,442.3601-1-0-24530CalPERS/Employee Portion(ER)INV0003485
221.6322-2-0-24530CalPERS/Employee Portion(ER)INV0003485
9/21/2018 Calif Public Employees' Retirement System 5,026.05CALPERSDFT0007932
4,597.1201-1-0-24530CalPERS/Employer PortionINV0003486
428.9322-2-0-24530CalPERS/Employer PortionINV0003486
9/21/2018 Calif Public Employees' Retirement System 24.18CALPERSDFT0007933
21.2901-1-0-24530CalPERS Retirement/ Survivor BenefitsINV0003487
2.8922-2-0-24530CalPERS Retirement/ Survivor BenefitsINV0003487
9/21/2018 California Public Employees' Deferred Compensation Plan 432.26CALPERS 457DFT0007934
432.2601-1-0-24560457 Loan PaybackINV0003488
9/21/2018 California Public Employees' Deferred Compensation Plan 75.42CALPERS 457DFT0007935
75.4201-1-0-24560457 Loan PaybackINV0003489
9/21/2018 California State Disbursement Unit 46.15CALSTADFT0007936
46.1501-1-0-245200710185587-01INV0003490
9/21/2018 Employment Development Department 564.50EDDDFT0007937
564.5001-0-0-24510State Disability Ins - Payroll TaxesINV0003491
9/21/2018 Internal Revenue Service 81.84IRSDFT0007938
81.8401-0-0-24510Social Security - Payroll TaxesINV0003492
9/21/2018 Employment Development Department 156.00EDDDFT0007939
156.0001-0-0-24510State Unemployment Ins - Payroll TaxesINV0003493
12

Cash Disbursements Report Payment Dates: 09/01/2018 - 09/30/2018
10/3/2018 2:22:55 PM Page 11 of 15
Payment Amount
Payment Number
Payment Date
Account Number
Vendor #
Vendor NamePayable Number Description Item AmountProject Account Key
9/21/2018 Employment Development Department 1,833.17EDDDFT0007940
1,833.1701-0-0-24510CA State Income Tax - Payroll TaxesINV0003494
9/21/2018 Internal Revenue Service 1,843.02IRSDFT0007941
1,843.0201-0-0-24510Medicare - Payroll TaxesINV0003495
9/21/2018 Internal Revenue Service 4,962.38IRSDFT0007942
4,962.3801-0-0-24510Federal Income Tax - Payroll TaxesINV0003496
9/20/2018 First Bank Card 294.46FBC-GEORGEDFT0007943
46.5301-0-1-54440Mexico Lindo - Board Agenda Meeting20180831
34.7101-0-1-54440Ricks Roadside - Edison/ SunnySlope M…20180831
145.6401-0-1-54530My Hero Sub - Employee Luncheon20180831
0.9901-1-2-54530Apple - ICloud Storage20180831
25.0001-1-7-54440HDMWA - Meeting20180831
8.0001-1-8-54710The Speed Wash - Trk #1520180831
33.5922-0-1-54440Chili's Grill Bar - Parking Lot Rehab Meet…20180831
9/20/2018 First Bank Card 121.40FBC-JENNIFERDFT0007944
3.2001-0-1-54530Walmart - Packing Tape20180831
83.4701-1-2-54500Print Runner - Door Hangers20180831
8.0001-1-8-54710THe Speed Wash - Trk #12 Wash20180831
26.7301-1-8-54710A52 Signs & Graphics - Trk #111 EIN Nu…20180831
9/20/2018 First Bank Card 2,119.83FBC-KIMDFT0007945
750.0001-0-1-54260CSDA - Conference Registration K. Ward20180831
37.7001-0-1-54300Pitney Bowes - Postage Mtr. Fee20180831
341.6001-0-1-54470Southwest - CSDA Conference20180831
14.0001-0-1-54530Calendar Wiz - Subscription20180831
9.7801-0-1-54530Target - Office Supplies20180831
6.4401-0-1-54530Amazon - Office Supplies20180831
47.3701-0-1-54530Vista Print - Business Cards20180831
37.4401-0-1-54530Name Badge20180831
94.6001-0-1-54530Staples - Office Supplies20180831
149.0001-0-1-54530Bluehost - SSL Cert20180831
84.0301-0-1-54530Staples - Office Supplies20180831
23.3201-0-1-54530Target - Office Supplies20180831
24.5501-0-1-54530Amazon - Office Supplies20180831
500.0001-0-1-54860Pitney Bowes - Postage Refill Fee20180831
9/20/2018 First Bank Card 515.18FBC-LORIDFT0007946
115.0001-0-1-54260Ed2Go - Leadership Course T. Goodridge20180831
48.6801-0-1-54440Ricks Roadside - Meeting20180831
13.0001-0-1-54470Super Shuttle - GFOA Conf. Expense20180831
15.5001-0-1-54470Super Shuttle - GFOA Conf. Expense20180831
323.0001-0-1-54470Hyatt - GFOA Conf.20180831
9/27/2018 American Fidelity Assurance 197.86AME SUPDFT0007947
197.8601-0-0-24580Supplemental Life Ins.B800529
9/20/2018 Ameritas Group Dental and Eye Care 479.00AMEGRODFT0007948
479.0001-0-0-14130Vision Insurance - Sept.20180920
9/27/2018 California Public Employees' Retirement System 25,325.18CalPERS HealthDFT0007949
25,267.0701-0-0-14130PERS Health Premium - Oct.20180920 PERS
58.1101-0-1-51230Admin Fee20180920 PERS
9/27/2018 California Public Employees' Retirement System 3,011.94CalPERS HealthDFT0007950
3,005.0301-0-0-14130Non PERS Health Premium - Oct20180920 NonPERS
6.9101-0-1-51230Admin Fee20180920 NonPERS
9/20/2018 First Bank Card 315.24FBC-STEVEDFT0007951
91.7422-2-2-54500Webstaurant - Op. Supplies20180831
13

Cash Disbursements Report Payment Dates: 09/01/2018 - 09/30/2018
10/3/2018 2:22:55 PM Page 12 of 15
Payment Amount
Payment Number
Payment Date
Account Number
Vendor #
Vendor NamePayable Number Description Item AmountProject Account Key
106.6422-2-2-54620HD Supply - Maint. Supplies20180831
116.8622-2-2-54801Smart & Final - Sr. Program Supplies20180831
9/20/2018 First Bank Card 371.14FBC-SEANDFT0007952
59.2601-0-0-17500Vulcan - Asphalt for Sunnyslope Project20180831 C0067 OUTSIDE SERVICE
183.8501-0-0-17500Airgas - Sunny Slope Project Line Suppli…20180831 C0067 OUTSIDE SERVICE
50.0001-1-1-54260CA-NV AWWA Water Efficiency Cert. Re…20180831
78.0301-1-1-54530Burger King - Duncan Svc Line Replacem…20180831
9/20/2018 First Bank Card 575.05FBC-ERNESTODFT0007953
30.9901-1-1-54530Little Ceasars - Main Leak Repair20180831
41.5901-1-1-54530Little Ceasars - Night Leak Repair20180831
157.2701-1-2-54500AG Spray20180831
182.1001-1-2-54500The Home Depot - Pressure Washer20180831
45.3501-1-3-54620Airgas - Nitrogen Gas20180831
40.9201-1-8-54710Autozone - Trk #8 Connector20180831
76.8301-1-8-54710Pilot - Vehicle Inspection Booklets20180831
9/24/2018 The Gas Company 14.30THEGASDFT0007954
14.3022-0-2-58110Gas - Phelan CC 8/20-9/1820181010-4084
9/24/2018 The Gas Company 44.91THEGASDFT0007955
44.9122-0-2-58110Gas - Phelan Sr. Ctr. 8/20-9/1820181010-4585
9/12/2018 Southern California Edison -677.01SCE 9587DFT0007956
-677.0101-1-3-58115Electricity - Office Solar CR20180913 CR
9/24/2018 Southern California Edison 584.56SCE 1078DFT0007957
584.5622-0-2-58110Electricity - CC & CSD20181001
9/24/2018 First Bank Card 7,025.11FBC-DONDFT0007958
1,099.0001-0-1-52235ACWA Conference Registration . M. Ro…20180831
68.3501-0-1-54140United Pacific - Fuel20180831
60.4301-0-1-54140Shell - Fuel20180831
58.3401-0-1-54140Shell - Fuel20180831
53.4001-0-1-54140United Pacific - Fuel20180831
36.4401-0-1-54440Ricks Roadside - Staff Meeting20180831
33.0401-0-1-54440Mexico Lindo - Staff Meeting20180831
177.7801-0-1-54680Bass Pro Shop - Sfty. Boots20180831
5,400.0001-1-8-54300Fleetmatics20180831
38.3301-1-9-54440Ricks Roadside - Consevation Meeting20180831
9/25/2018 First Bank Card 729.35FBC-GEORGEDFT0007959
729.3501-0-0-17000Phelan CC Parking Lot Rehab - SBC Plan …20180822 C0064 OUTSIDE SVCS
9/25/2018 First Bank Card 3,288.06FBC-SEANDFT0007960
2,640.4801-1-8-54710Trk #100 - Rims & Tires150247
647.5801-0-0-17500Asphalt for sunnyslope pipeline project19211465 C0067 OUTSIDE SERVICE
418,040.22Payment Total:
14

Cash Disbursements Report Payment Dates: 09/01/2018 - 09/30/2018
10/3/2018 2:22:55 PM Page 13 of 15
Report Summary
Fund Summary
Payment AmountFund
01 - ENTERPRISE FUND 392,921.09
20 - GOV'T GENERAL FUND 755.66
22 - PARKS & RECREATION 19,753.93
23 - STREET LIGHTING 1,100.49
25 - SOLID WASTE 3,592.49
418,123.66Grand Total:
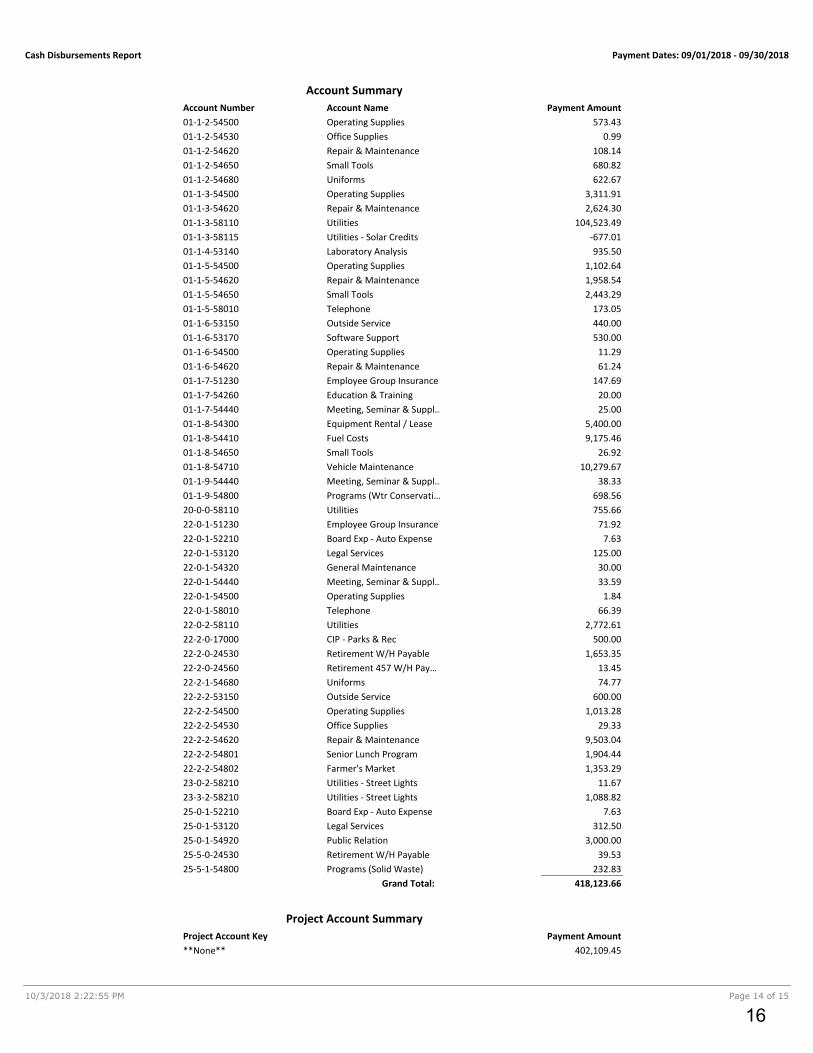
Account Summary
Payment AmountAccount Number Account Name
01-0-0-14100 Prepaid Expense 14,861.41
01-0-0-14130 Prepaid Benefit 61,546.80
01-0-0-17000 CIP Enterprise Funds 9,830.76
01-0-0-17500 WIP - Admin 1,393.87
01-0-0-24510 Payroll Tax Payable 19,382.62
01-0-0-24540 Worker's Compensation P… 2,039.19
01-0-0-24580 Supplemental Ins W/H Pa… 499.86
01-0-1-51230 Employee Group Insurance 1,345.82
01-0-1-52210 Board Exp - Auto Expense -15.26
01-0-1-52211 Board - Auto Expense/Bra… 45.78
01-0-1-52235 Board - Education,Trainin… 1,099.00
01-0-1-53110 Auditing & Accounting Fe… 7,274.00
01-0-1-53120 Legal Services 6,520.38
01-0-1-53150 Outside Service 1,147.95
01-0-1-53170 Software Support 2,032.80
01-0-1-54140 Auto Expense 240.52
01-0-1-54200 Credit Card Fee & Bank C… 310.33
01-0-1-54230 Dues & Subscriptions 468.00
01-0-1-54260 Education & Training 865.00
01-0-1-54290 Employment Expense 540.00
01-0-1-54300 Equipment Rental / Lease 276.10
01-0-1-54320 General Maintenance 350.00
01-0-1-54440 Meeting, Seminar & Suppl… 199.40
01-0-1-54470 Travel Expense 855.53
01-0-1-54500 Operating Supplies 90.23
01-0-1-54530 Office Supplies 2,577.13
01-0-1-54680 Uniforms 177.78
01-0-1-54830 State & County Fees & Se… 4.00
01-0-1-54860 Postage & Mailing 499.53
01-0-1-58010 Telephone 2,362.78
01-0-1-58110 Utilities 1,633.24
01-0-3-58115 Utilities - Solar Credits -45,465.47
01-0-6-54860 Postage & Mailing 8,630.12
01-0-6-54890 Printing 892.41
01-1-0-13010 Inventory - Water Field Pa… 8,557.20
01-1-0-16740 Backhoe/Loader & Trailer 100,221.93
01-1-0-24520 Garnishment Payable 92.30
01-1-0-24530 Retirement W/H Payable 16,549.57
01-1-0-24560 Retirement 457 W/H Pay… 1,231.91
01-1-0-29740 Loan Payable - CalTrans 6,192.59
01-1-1-53150 Outside Service 3,090.00
01-1-1-54230 Dues & Subscriptions 2,150.28
01-1-1-54260 Education & Training 370.00
01-1-1-54500 Operating Supplies 122.32
01-1-1-54530 Office Supplies 150.61
01-1-1-54830 State & County Fees & Se… 160.00
01-1-1-91010 Interest Expense 422.80
01-1-2-53150 Outside Service 3,862.05
15
Cash Disbursements Report Payment Dates: 09/01/2018 - 09/30/2018
10/3/2018 2:22:55 PM Page 14 of 15
Account Summary
Payment AmountAccount Number Account Name
01-1-2-54500 Operating Supplies 573.43
01-1-2-54530 Office Supplies 0.99
01-1-2-54620 Repair & Maintenance 108.14
01-1-2-54650 Small Tools 680.82
01-1-2-54680 Uniforms 622.67
01-1-3-54500 Operating Supplies 3,311.91
01-1-3-54620 Repair & Maintenance 2,624.30
01-1-3-58110 Utilities 104,523.49
01-1-3-58115 Utilities - Solar Credits -677.01
01-1-4-53140 Laboratory Analysis 935.50
01-1-5-54500 Operating Supplies 1,102.64
01-1-5-54620 Repair & Maintenance 1,958.54
01-1-5-54650 Small Tools 2,443.29
01-1-5-58010 Telephone 173.05
01-1-6-53150 Outside Service 440.00
01-1-6-53170 Software Support 530.00
01-1-6-54500 Operating Supplies 11.29
01-1-6-54620 Repair & Maintenance 61.24
01-1-7-51230 Employee Group Insurance 147.69
01-1-7-54260 Education & Training 20.00
01-1-7-54440 Meeting, Seminar & Suppl… 25.00
01-1-8-54300 Equipment Rental / Lease 5,400.00
01-1-8-54410 Fuel Costs 9,175.46
01-1-8-54650 Small Tools 26.92
01-1-8-54710 Vehicle Maintenance 10,279.67
01-1-9-54440 Meeting, Seminar & Suppl… 38.33
01-1-9-54800 Programs (Wtr Conservati… 698.56
20-0-0-58110 Utilities 755.66
22-0-1-51230 Employee Group Insurance 71.92
22-0-1-52210 Board Exp - Auto Expense 7.63
22-0-1-53120 Legal Services 125.00
22-0-1-54320 General Maintenance 30.00
22-0-1-54440 Meeting, Seminar & Suppl… 33.59
22-0-1-54500 Operating Supplies 1.84
22-0-1-58010 Telephone 66.39
22-0-2-58110 Utilities 2,772.61
22-2-0-17000 CIP - Parks & Rec 500.00
22-2-0-24530 Retirement W/H Payable 1,653.35
22-2-0-24560 Retirement 457 W/H Pay… 13.45
22-2-1-54680 Uniforms 74.77
22-2-2-53150 Outside Service 600.00
22-2-2-54500 Operating Supplies 1,013.28
22-2-2-54530 Office Supplies 29.33
22-2-2-54620 Repair & Maintenance 9,503.04
22-2-2-54801 Senior Lunch Program 1,904.44
22-2-2-54802 Farmer's Market 1,353.29
23-0-2-58210 Utilities - Street Lights 11.67
23-3-2-58210 Utilities - Street Lights 1,088.82
25-0-1-52210 Board Exp - Auto Expense 7.63
25-0-1-53120 Legal Services 312.50
25-0-1-54920 Public Relation 3,000.00
25-5-0-24530 Retirement W/H Payable 39.53
25-5-1-54800 Programs (Solid Waste) 232.83
Grand Total: 418,123.66
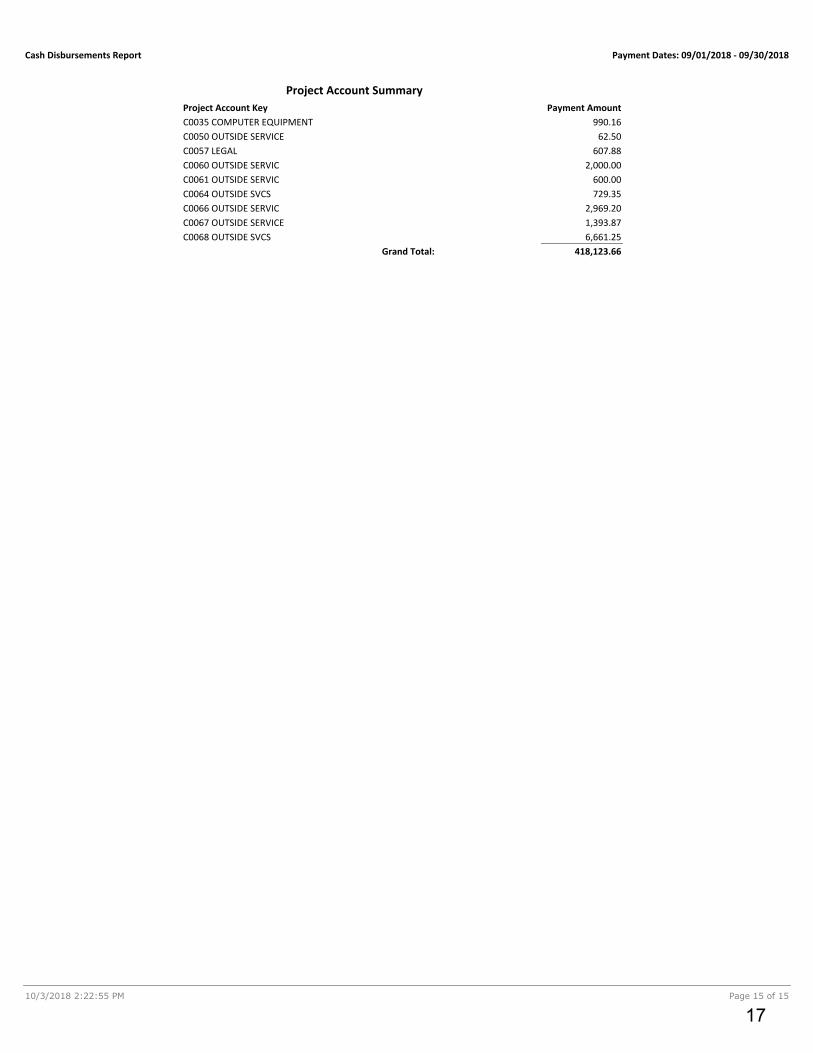
Project Account Summary
Payment AmountProject Account Key
**None** 402,109.45
16
Cash Disbursements Report Payment Dates: 09/01/2018 - 09/30/2018
10/3/2018 2:22:55 PM Page 15 of 15
Project Account Summary
Payment AmountProject Account Key
C0035 COMPUTER EQUIPMENT 990.16
C0050 OUTSIDE SERVICE 62.50
C0057 LEGAL 607.88
C0060 OUTSIDE SERVIC 2,000.00
C0061 OUTSIDE SERVIC 600.00
C0064 OUTSIDE SVCS 729.35
C0066 OUTSIDE SERVIC 2,969.20
C0067 OUTSIDE SERVICE 1,393.87
C0068 OUTSIDE SVCS 6,661.25
Grand Total: 418,123.66
17
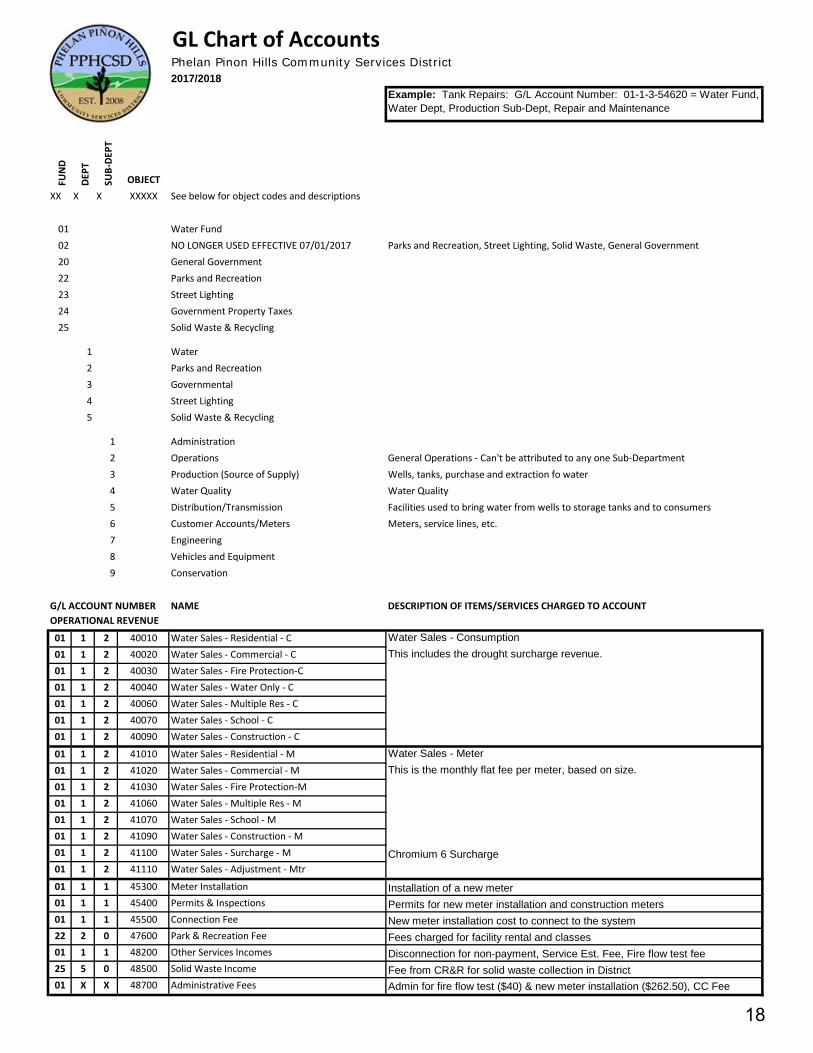
GL Chart of AccountsPhelan Pinon Hills Community Services District2017/2018
FUN
D
DEPT
SUB-
DEPT
OBJECTXX X X XXXXX See below for object codes and descriptions
01 Water Fund02 NO LONGER USED EFFECTIVE 07/01/2017 Parks and Recreation, Street Lighting, Solid Waste, General Government20 General Government22 Parks and Recreation23 Street Lighting24 Government Property Taxes25 Solid Waste & Recycling
1 Water2 Parks and Recreation3 Governmental4 Street Lighting5 Solid Waste & Recycling
1 Administration2 Operations General Operations - Can't be attributed to any one Sub-Department3 Production (Source of Supply) Wells, tanks, purchase and extraction fo water4 Water Quality Water Quality5 Distribution/Transmission Facilities used to bring water from wells to storage tanks and to consumers6 Customer Accounts/Meters Meters, service lines, etc.7 Engineering8 Vehicles and Equipment9 Conservation
G/L ACCOUNT NUMBER NAME DESCRIPTION OF ITEMS/SERVICES CHARGED TO ACCOUNTOPERATIONAL REVENUE
01 1 2 40010 Water Sales - Residential - C Water Sales - Consumption
01 1 2 40020 Water Sales - Commercial - C This includes the drought surcharge revenue.
01 1 2 40030 Water Sales - Fire Protection-C01 1 2 40040 Water Sales - Water Only - C01 1 2 40060 Water Sales - Multiple Res - C01 1 2 40070 Water Sales - School - C01 1 2 40090 Water Sales - Construction - C
01 1 2 41010 Water Sales - Residential - M Water Sales - Meter
01 1 2 41020 Water Sales - Commercial - M This is the monthly flat fee per meter, based on size.
01 1 2 41030 Water Sales - Fire Protection-M01 1 2 41060 Water Sales - Multiple Res - M01 1 2 41070 Water Sales - School - M01 1 2 41090 Water Sales - Construction - M01 1 2 41100 Water Sales - Surcharge - M Chromium 6 Surcharge
01 1 2 41110 Water Sales - Adjustment - Mtr
01 1 1 45300 Meter Installation Installation of a new meter
01 1 1 45400 Permits & Inspections Permits for new meter installation and construction meters
01 1 1 45500 Connection Fee New meter installation cost to connect to the system
22 2 0 47600 Park & Recreation Fee Fees charged for facility rental and classes
01 1 1 48200 Other Services Incomes Disconnection for non-payment, Service Est. Fee, Fire flow test fee
25 5 0 48500 Solid Waste Income Fee from CR&R for solid waste collection in District
01 X X 48700 Administrative Fees Admin for fire flow test ($40) & new meter installation ($262.50), CC Fee
Example: Tank Repairs: G/L Account Number: 01-1-3-54620 = Water Fund,
Water Dept, Production Sub-Dept, Repair and Maintenance
18

G/L ACCOUNT NUMBER NAME DESCRIPTION OF ITEMS/SERVICES CHARGED TO ACCOUNTOPERATIONAL EXPENSE
XX X X 50010 MWA WM Admin. & Bio Fee Fees charged by MWA per acre foot of water we pump out of ground
XX X X 50020 MWA WM Make Up Water If we pump more than our allowance, we have to replace the water
XX X X 50040 Water Purchases - Other Water used through emergency connections as necessary
XX X X 51110 Salaries & Wages Salaries for Staff
XX X X 51120 VacationsXX X X 51130 HolidayXX X X 51140 Sick PayXX X X 51150 Misc Earn Jury Duty, Bereavement Leave, etc.
XX X X 51170 OvertimeXX X X 51190 Contra Wages (towards projects) Reclassification of wages to cip projects at year end
XX X X 51210 Payroll Taxes Medicare and Social Security
XX X X 51220 Worker's CompensationXX X X 51230 Employee Group Insurance Employers share of medical/dental/vision insurance
XX X X 51240 Retirement CalPers retirement
XX X X 51290 Contra Benes (towards projects) Reclassification of benefits to cip projects at year end
XX X X 51295 Contra Retirement GASB68 YE Adjustments for Retirement per GASB
XX X X 52110 Board Director's Fee Board Stipends
XX X X 52210 Board Exp - Auto ExpenseXX X X 52211 Board - Auto Expense/BrandonXX X X 52214 Board - Auto Expense/MorrissetteXX X X 52215 Board - Auto Expense/RobertsXX X X 52216 Board-Auto Expense/PaceXX X X 52217 Board-Auto Expense/WhalenXX X X 52220 Board Exp - Meals & LodgingXX X X 52221 Board - Meals,Travel Expenses/BrandonXX X X 52224 Board - Meals,Travel Expenses/MorrissetteXX X X 52225 Board - Meals,Travel Expenses/RobertsXX X X 52226 Board-Meals,Travel Expenses/PaceXX X X 52227 Board-Meals,Travel Expenses/WhalenXX X X 52230 Board Exp - Education/TrainingXX X X 52231 Board - Education,Training/BrandonXX X X 52234 Board - Education,Training/MorrissetteXX X X 52235 Board - Education,Training/RobertsXX X X 52236 Board-Education,Training/PaceXX X X 52237 Board-Education,Training/WhalenXX X X 52240 Board Expense - InsuranceXX X X 52245 Board Expense - Payroll TaxesXX X X 52250 Board Expense - Worker's Comp
XX X X 53110 Auditing & Accounting FeesXX X X 53120 Legal ServicesXX X X 53130 Engineering Contracts, plans, RFPs, GIS, mapping - o/s contractor
XX X X 53140 Laboratory Analysis Tests required by law for water quality
XX X X 53150 Outside Service Rate Study, security, copy machine maintenance, answering service, pager
service, pest control, engineering services (standby, etc), asphalt patching,
underground service alerts, etc.
XX X X 53160 Permits & Fees Hazardous materials, water system, water rights, excavation, inspection fees
(County), health permits, etc.
XX X X 53170 Software Support Website, enterprise system, network, etc.
XX X X 54110 Advertising Ads in local papers, legal notifications, etc.
XX X X 54140 Auto Expense Fuel, etc.
XX X X 54170 Auto Allowance GM auto allowance per contract
XX X X 54200 Credit Card Fee & Bank Charges Fees for processing customer credit cards, bank charges, etc.
XX X X 54230 Dues & Subscriptions Calendar, newspaper, ACWA, Chamber, CMTA, GFOA, etc.
XX X X 54260 Education & Training Certification classes, governance events, conferences, safety awards,
seminars, association events, college classes, etc.
XX X X 54290 Employment Expense Physical, Drug Screening, DOT testing, background check, etc.
XX X X 54300 Equipment Rental / Lease Copy machines, equipment, Site rental (radio repeater), etc.
XX X X 54320 General Maintenance Building maintenance, windows, cleaning, etc.
19

G/L ACCOUNT NUMBER NAME DESCRIPTION OF ITEMS/SERVICES CHARGED TO ACCOUNTXX X X 54350 Insurance Property, Plant, Equipment, Liability, General, etc. for all facilities (wells,
buildings, pumps, etc.)
XX X X 54380 Insurance - VehicleXX X X 54410 Fuel Costs Fuel for District vehicles. Diesel and Gas.
XX X X 54440 Meeting, Seminar & Supplies Staff meetings
XX X X 54470 Travel Expense Mileage, hotel, air, etc.
XX X X 54500 Operating Supplies Batteries, fuses, paint, fans, electric supplies, plumbing supplies, winterization
items, degreaser, compressors, oil for wells, log books, safety supplies and
materials, Chlorine, etc.
XX X X 54530 Office Supplies Paper, toner, pens, pencils, checks, forms, toiletries, paper clips, folders, filing
cabinets, note pads, storage boxes, highlighters, markers, keyboards,
software, binders, etc.
XX X X 54620 Repair & Maintenance Inventory to repair and replace service lines, chlorinators, sample stations,
roof repair at well sites, SCADA repair, electrical to motors, repair motors,
plumbing, electrical, etc. for facilities
XX X X 54650 Small Tools Hand tools for repair and maintenance of facilities, meters, waterlines, etc.;
Shovels, measuring wheels, cable pull kit, man hole hooks, air compressors,
hydrant wrenches, pipe cutter, flash lights, tie-downs, tap and die sets,
extension cords, cutting wheels, utility pumps, etc.
XX X X 54680 Uniforms
XX X X 54710 Vehicle MaintenanceXX X X 54740 Easement Lease Railroad easement where pipeline goes under tracks.
XX X X 54770 Computer & Equip MaintenanceXX X X 54800 Programs (Wtr Conservation, Parks, etc) Cash for Grass program (w/MWA), AWAC, workshops, seminars, Community
Services Awareness Day, literature, etc. Parks events and programs, etc.
XX X X 54801 Senior Lunch ProgramXX X X 54802 Farmer's MarketXX X X 54803 Fall FestivalXX X X 54804 Farmers Market MM ProgramXX X X 54830 State & County Fees & ServicesXX X X 54831 SB County Fees & Services LAFCO, Assessment Reports, Lien release fees (offset by paid water acct),
parcel map updates, etc.
XX X X 54860 Postage & Mailing Postage machine in office, postage for bills (bulk rates), etc.
XX X X 54890 Printing Printing of bills, CCR, posters, flyers, envelopes, etc.
XX X X 54920 Public Relation Chamber events, Kiwanis, sporting events, school events, etc.
XX X X 57210 RentXX X X 58010 TelephoneXX X X 58110 Utilities Water, trash, electricity, gas, etc.
XX X X 58115 Utilities - Solar CreditsXX X X 58210 Utilities - Street Lights Electricity, repair and maintenance for street lights
XX X X 59100 Bad Debt Uncollectable water accounts
XX X X 59110 Property Taxes Well #14, Dairy Property, Home Field, & Georges Field
XX X X 59120 Depreciation & AmortizationXX X X 59310 Other Operating ExpensesXX X X 59400 Capital Outlay
NON-OPERATIONAL REVENUE
24 4 0 71110 Property Taxes - Curr Sec24 4 0 71120 Property Taxes - Curr Unsec24 4 0 71130 Property Taxes - Curr Supplimen24 4 0 71140 Property Taxes - Curr Unitary24 4 0 71150 Property Taxes - Curr OtherXX X X 71500 Property Tax Revenue24 4 0 72110 Property Taxes - Prior Sec24 4 0 72120 Property Taxes - Prior Unsec24 4 0 72130 Property Taxes - Prior Supplimn24 4 0 72150 Property Taxes - Prior Other24 4 0 73160 Property Taxes - HomeownerXX X X 73170 Tax Penalties & Others01 1 0 74110 Special Assessments Standby - fees on properties within 600' of a waterline without a meter.
XX X X 83110 State Assistance 20
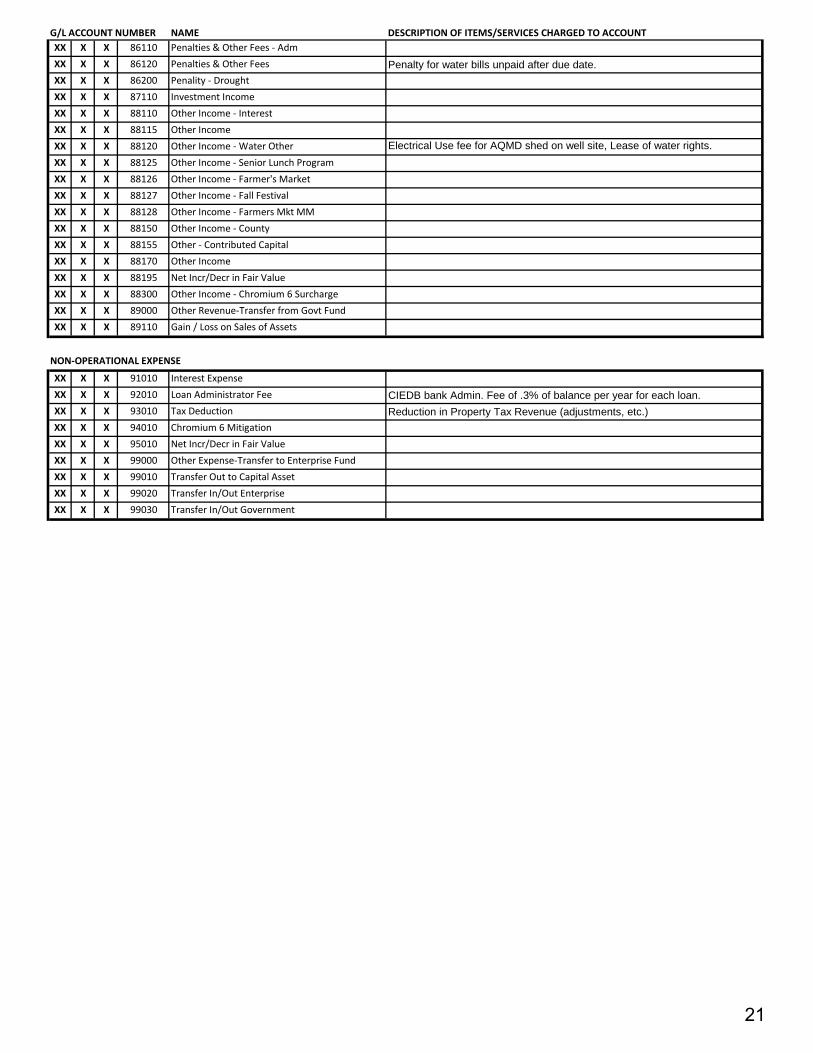
G/L ACCOUNT NUMBER NAME DESCRIPTION OF ITEMS/SERVICES CHARGED TO ACCOUNTXX X X 86110 Penalties & Other Fees - AdmXX X X 86120 Penalties & Other Fees Penalty for water bills unpaid after due date.
XX X X 86200 Penality - DroughtXX X X 87110 Investment IncomeXX X X 88110 Other Income - InterestXX X X 88115 Other IncomeXX X X 88120 Other Income - Water Other Electrical Use fee for AQMD shed on well site, Lease of water rights.
XX X X 88125 Other Income - Senior Lunch ProgramXX X X 88126 Other Income - Farmer's MarketXX X X 88127 Other Income - Fall FestivalXX X X 88128 Other Income - Farmers Mkt MMXX X X 88150 Other Income - CountyXX X X 88155 Other - Contributed CapitalXX X X 88170 Other IncomeXX X X 88195 Net Incr/Decr in Fair ValueXX X X 88300 Other Income - Chromium 6 SurchargeXX X X 89000 Other Revenue-Transfer from Govt FundXX X X 89110 Gain / Loss on Sales of Assets
NON-OPERATIONAL EXPENSE
XX X X 91010 Interest ExpenseXX X X 92010 Loan Administrator Fee CIEDB bank Admin. Fee of .3% of balance per year for each loan.
XX X X 93010 Tax Deduction Reduction in Property Tax Revenue (adjustments, etc.)
XX X X 94010 Chromium 6 MitigationXX X X 95010 Net Incr/Decr in Fair ValueXX X X 99000 Other Expense-Transfer to Enterprise FundXX X X 99010 Transfer Out to Capital AssetXX X X 99020 Transfer In/Out EnterpriseXX X X 99030 Transfer In/Out Government
21

10/3/2018 2:23:42 PM Page 1 of 10
Balance Sheet - By FundsPhelan Pinon Hills Community Services District Account Summary
As Of 09/30/2018
09/30/2018Beginning Balance
07/01/2018 Change
Fund: 01 - ENTERPRISE FUND
Assets
Current Assets
11 - Cash
11000 - Cash in Bank 797,153.04413,963.75 383,189.29
11201 - Cash-Operating Reserves 1,186,507.001,186,507.00 0.00
11202 - Cash-Replacement Reserves 3,350,810.803,350,810.80 0.00
11203 - Cash-Disaster Reserves 2,267,308.792,267,308.79 0.00
11204 - Cash-Debt Service 941,441.00941,441.00 0.00
Total 11 - Cash 8,543,220.638,160,031.34 383,189.29
12 - Accounts Receivable
12010 - Accounts Receivable - Water 648,474.50692,889.22 -44,414.72
12020 - AR Accounts Receivable 1,206.61514.68 691.93
12150 - A/R - Accrual 207,275.05169,688.48 37,586.57
12610 - Delinquent Accounts to Tax Roll 88,515.3842,594.39 45,920.99
12630 - Water Availability Receivable - WC13 69,480.5069,480.50 0.00
12640 - Water Availability Receivable - UD60 234.03234.03 0.00
12910 - Accrued Interest Receivable-GF 0.0049,381.78 -49,381.78
Total 12 - Accounts Receivable 1,015,186.071,024,783.08 -9,597.01
13 - Inventory
13010 - Inventory - Water Field Parts 224,579.15194,474.41 30,104.74
Total 13 - Inventory 224,579.15194,474.41 30,104.74
14 - Other Current Assets
14100 - Prepaid Expense 120,701.13119,598.05 1,103.08
14120 - Prepaid - Worker's Comp 36,634.3445,835.54 -9,201.20
14130 - Pre Paid Benefit 31,025.8326,862.82 4,163.01
14300 - Deferred Outflows of Resources 377,132.00377,132.00 0.00
Total 14 - Other Current Assets 565,493.30569,428.41 -3,935.11
Total Current Assets 10,348,479.159,948,717.24 399,761.91
Fixed Assets
15 - Fixed Assets
15100 - Land 1,283,434.001,283,434.00 0.00
15110 - Land 439,390.36439,390.36 0.00
15150 - Water Rights 16,371,782.8016,371,782.80 0.00
15160 - Planning and Development 2,745,558.312,745,558.31 0.00
15200 - Bldg & Facilities -Pump Station 4,114,807.944,114,807.94 0.00
15230 - Bldg & Facilities 5,879,603.635,879,603.63 0.00
15410 - Wells 5,071,216.905,071,216.90 0.00
15420 - Reservoirs 4,187,496.004,187,496.00 0.00
15430 - Tanks 2,184,312.252,184,312.25 0.00
15440 - Hydrants Telemetry & Control 191,669.94191,669.94 0.00
15450 - Transmission & Dist. Mains 18,144,343.6118,144,343.61 0.00
15480 - Meters 1,921,145.781,921,145.78 0.00
Total 15 - Fixed Assets 62,534,761.5262,534,761.52 0.00
16 - Equipment
16620 - Equipment - Computer 1,173,652.941,167,082.58 6,570.36
16630 - Equipment-Office Furnitures &Eq 24,914.9224,914.92 0.00
16640 - Equipment - Operation 126,621.93126,621.93 0.00
16730 - Trucks 536,662.34536,662.34 0.00
16740 - Backhoe & Trailer 151,064.9451,700.01 99,364.93
16750 - Dump Truck 33,300.0033,300.00 0.00
22
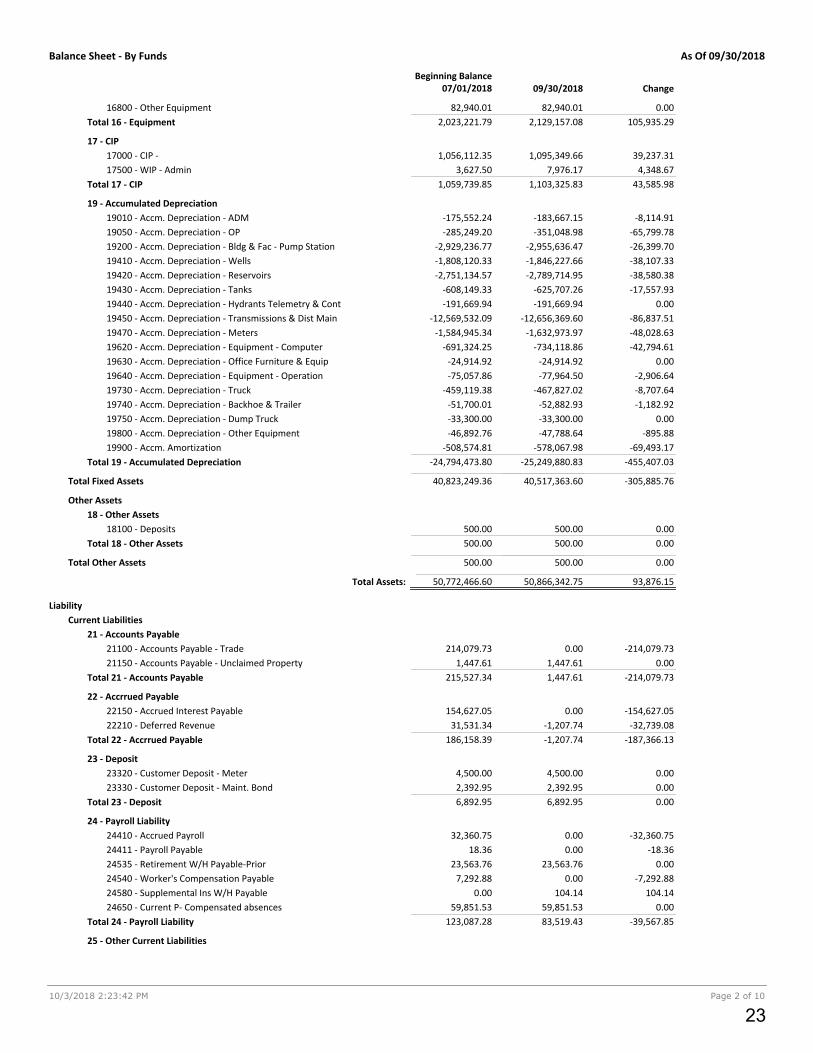
Balance Sheet - By Funds As Of 09/30/2018
10/3/2018 2:23:42 PM Page 2 of 10
09/30/2018Beginning Balance
07/01/2018 Change
16800 - Other Equipment 82,940.0182,940.01 0.00
Total 16 - Equipment 2,129,157.082,023,221.79 105,935.29
17 - CIP
17000 - CIP - 1,095,349.661,056,112.35 39,237.31
17500 - WIP - Admin 7,976.173,627.50 4,348.67
Total 17 - CIP 1,103,325.831,059,739.85 43,585.98
19 - Accumulated Depreciation
19010 - Accm. Depreciation - ADM -183,667.15-175,552.24 -8,114.91
19050 - Accm. Depreciation - OP -351,048.98-285,249.20 -65,799.78
19200 - Accm. Depreciation - Bldg & Fac - Pump Station -2,955,636.47-2,929,236.77 -26,399.70
19410 - Accm. Depreciation - Wells -1,846,227.66-1,808,120.33 -38,107.33
19420 - Accm. Depreciation - Reservoirs -2,789,714.95-2,751,134.57 -38,580.38
19430 - Accm. Depreciation - Tanks -625,707.26-608,149.33 -17,557.93
19440 - Accm. Depreciation - Hydrants Telemetry & Cont -191,669.94-191,669.94 0.00
19450 - Accm. Depreciation - Transmissions & Dist Main -12,656,369.60-12,569,532.09 -86,837.51
19470 - Accm. Depreciation - Meters -1,632,973.97-1,584,945.34 -48,028.63
19620 - Accm. Depreciation - Equipment - Computer -734,118.86-691,324.25 -42,794.61
19630 - Accm. Depreciation - Office Furniture & Equip -24,914.92-24,914.92 0.00
19640 - Accm. Depreciation - Equipment - Operation -77,964.50-75,057.86 -2,906.64
19730 - Accm. Depreciation - Truck -467,827.02-459,119.38 -8,707.64
19740 - Accm. Depreciation - Backhoe & Trailer -52,882.93-51,700.01 -1,182.92
19750 - Accm. Depreciation - Dump Truck -33,300.00-33,300.00 0.00
19800 - Accm. Depreciation - Other Equipment -47,788.64-46,892.76 -895.88
19900 - Accm. Amortization -578,067.98-508,574.81 -69,493.17
Total 19 - Accumulated Depreciation -25,249,880.83-24,794,473.80 -455,407.03
Total Fixed Assets 40,517,363.6040,823,249.36 -305,885.76
Other Assets
18 - Other Assets
18100 - Deposits 500.00500.00 0.00
Total 18 - Other Assets 500.00500.00 0.00
Total Other Assets 500.00500.00 0.00
50,866,342.75Total Assets: 50,772,466.60 93,876.15
Liability
Current Liabilities
21 - Accounts Payable
21100 - Accounts Payable - Trade 0.00214,079.73 -214,079.73
21150 - Accounts Payable - Unclaimed Property 1,447.611,447.61 0.00
Total 21 - Accounts Payable 1,447.61215,527.34 -214,079.73
22 - Accrrued Payable
22150 - Accrued Interest Payable 0.00154,627.05 -154,627.05
22210 - Deferred Revenue -1,207.7431,531.34 -32,739.08
Total 22 - Accrrued Payable -1,207.74186,158.39 -187,366.13
23 - Deposit
23320 - Customer Deposit - Meter 4,500.004,500.00 0.00
23330 - Customer Deposit - Maint. Bond 2,392.952,392.95 0.00
Total 23 - Deposit 6,892.956,892.95 0.00
24 - Payroll Liability
24410 - Accrued Payroll 0.0032,360.75 -32,360.75
24411 - Payroll Payable 0.0018.36 -18.36
24535 - Retirement W/H Payable-Prior 23,563.7623,563.76 0.00
24540 - Worker's Compensation Payable 0.007,292.88 -7,292.88
24580 - Supplemental Ins W/H Payable 104.140.00 104.14
24650 - Current P- Compensated absences 59,851.5359,851.53 0.00
Total 24 - Payroll Liability 83,519.43123,087.28 -39,567.85
25 - Other Current Liabilities
23

Balance Sheet - By Funds As Of 09/30/2018
10/3/2018 2:23:42 PM Page 3 of 10
09/30/2018Beginning Balance
07/01/2018 Change
25500 - Deferred Inflows of Resources 7,991.007,991.00 0.00
Total 25 - Other Current Liabilities 7,991.007,991.00 0.00
Total Current Liabilities 98,643.25539,656.96 -441,013.71
Long Term Liabilities
29 - Long Term Liability
29710 - Loan Payable - CIEDB 2,088,145.332,088,145.33 0.00
29720 - CIEDB Loan 6,377,697.596,575,493.34 -197,795.75
29730 - City National Bank Loan 4,273,271.744,370,127.49 -96,855.75
29740 - Loan Payable - CalTrans 154,389.02160,581.61 -6,192.59
29800 - Compensated absences 59,851.5259,851.52 0.00
29850 - Net Pension Liability 75,906.0075,906.00 0.00
Total 29 - Long Term Liability 13,029,261.2013,330,105.29 -300,844.09
Total Long Term Liabilities 13,029,261.2013,330,105.29 -300,844.09
13,127,904.45Total Liability: 13,869,762.25 -741,857.80
Equity
31 - Board Designated Reserves
31110 - Operating Reserve - Water&Adm 1,186,507.001,186,507.00 0.00
31210 - Debt Service Reserve - CEIDB 941,441.00941,441.00 0.00
31310 - Replacement Reserve - Water&Adm 3,350,810.803,350,810.80 0.00
31410 - Disaster Reserve-Water&Adm 2,267,308.792,267,308.79 0.00
Total 31 - Board Designated Reserves 7,746,067.597,746,067.59 0.00
32 - Unrestricted
32000 - Unrestricted Net Assets 5,392,507.375,392,507.37 0.00
Total 32 - Unrestricted 5,392,507.375,392,507.37 0.00
33 - Investment in Plant
33110 - Investments in Utility Plant-OP 23,764,129.3923,764,129.39 0.00
Total 33 - Investment in Plant 23,764,129.3923,764,129.39 0.00
36,902,704.35Total Beginning Equity: 36,902,704.35 0.00
Total Revenue 2,117,526.150.00 2,141,441.87
Total Expense 1,281,792.200.00 1,281,772.20
Total Liabilities, Equity and Current Surplus (Deficit):
Total Equity and Current Surplus (Deficit): 37,738,438.30
50,866,342.75
36,902,704.35
50,772,466.60
835,733.95
93,876.15
24

Balance Sheet - By Funds As Of 09/30/2018
10/3/2018 2:23:42 PM Page 4 of 10
09/30/2018Beginning Balance
07/01/2018 Change
Fund: 20 - GOV'T GENERAL FUND
Assets
Current Assets
11 - Cash
11000 - Cash in Bank 267,976.79268,138.48 -161.69
11201 - Cash-Operating Reserves 7,506.007,506.00 0.00
11202 - Cash-Replacement Reserves 118,844.00118,844.00 0.00
11203 - Cash-Disaster Reserves 65,222.0065,222.00 0.00
Total 11 - Cash 459,548.79459,710.48 -161.69
Total Current Assets 459,548.79459,710.48 -161.69
Fixed Assets
15 - Fixed Assets
15110 - Land 1,389,000.001,389,000.00 0.00
15160 - Planning and Development 68,381.7268,381.72 0.00
15230 - Bldg & Facilities 540,000.00540,000.00 0.00
15410 - Wells 24,840.0024,840.00 0.00
Total 15 - Fixed Assets 2,022,221.722,022,221.72 0.00
16 - Equipment
16645 - Equipment 19,000.0019,000.00 0.00
Total 16 - Equipment 19,000.0019,000.00 0.00
17 - CIP
17000 - CIP - 8,945.250.00 8,945.25
Total 17 - CIP 8,945.250.00 8,945.25
19 - Accumulated Depreciation
19040 - Accm. Depreciation - Parks -518,958.39-510,730.37 -8,228.02
19645 - Accm. Depreciation - Equipment Gov't -15,516.68-14,566.69 -949.99
Total 19 - Accumulated Depreciation -534,475.07-525,297.06 -9,178.01
Total Fixed Assets 1,515,691.901,515,924.66 -232.76
1,975,240.69Total Assets: 1,975,635.14 -394.45
Liability
Current Liabilities
21 - Accounts Payable
21100 - Accounts Payable - Trade 0.00716.59 -716.59
Total 21 - Accounts Payable 0.00716.59 -716.59
23 - Deposit
23310 - Customer Deposits 5,000.005,000.00 0.00
Total 23 - Deposit 5,000.005,000.00 0.00
Total Current Liabilities 5,000.005,716.59 -716.59
5,000.00Total Liability: 5,716.59 -716.59
Equity
31 - Board Designated Reserves
31150 - Operating Reserve - Govt Fund 7,506.007,506.00 0.00
31350 - Replacement Reserve - Govt Fund 118,844.00118,844.00 0.00
31450 - Disaster Reserve - Govt Fund 65,222.0065,222.00 0.00
Total 31 - Board Designated Reserves 191,572.00191,572.00 0.00
32 - Unrestricted
32000 - Unrestricted Net Assets 1,778,346.551,778,346.55 0.00
Total 32 - Unrestricted 1,778,346.551,778,346.55 0.00
1,969,918.55Total Beginning Equity: 1,969,918.55 0.00
25

Balance Sheet - By Funds As Of 09/30/2018
10/3/2018 2:23:42 PM Page 5 of 10
09/30/2018Beginning Balance
07/01/2018 Change
Total Revenue 11,264.260.00 11,264.26
Total Expense 10,942.120.00 10,942.12
Total Liabilities, Equity and Current Surplus (Deficit):
Total Equity and Current Surplus (Deficit): 1,970,240.69
1,975,240.69
1,969,918.55
1,975,635.14
322.14
-394.45
26
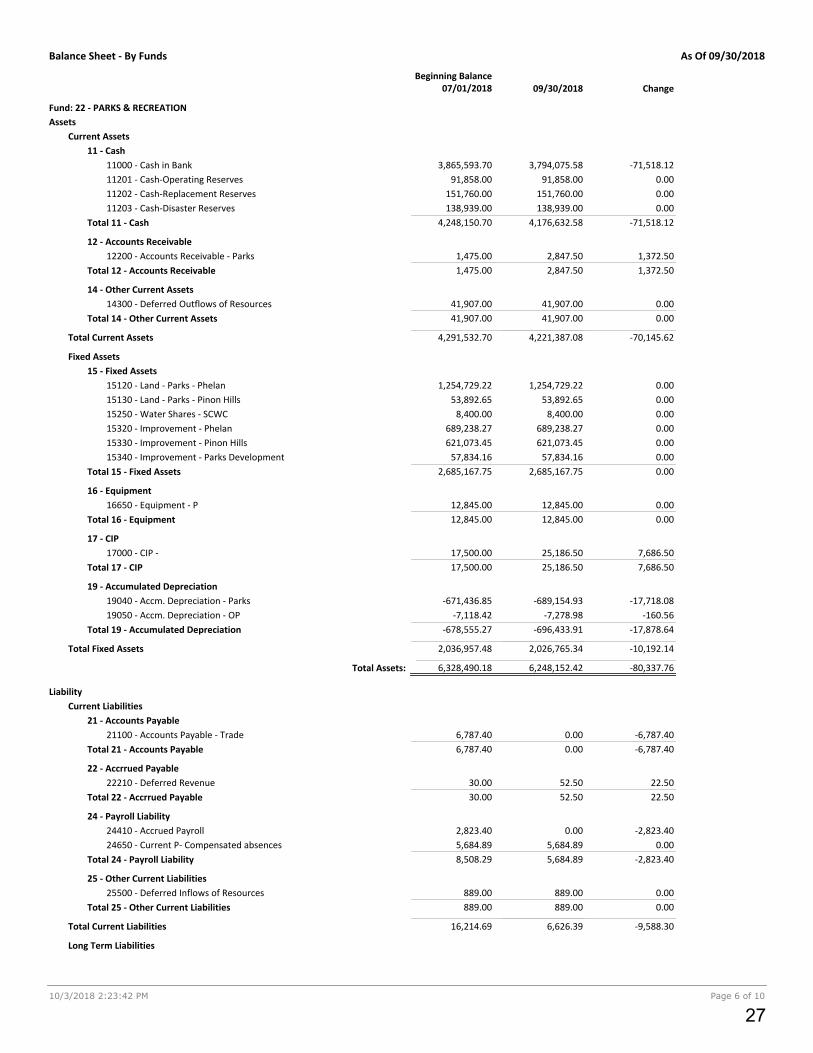
Balance Sheet - By Funds As Of 09/30/2018
10/3/2018 2:23:42 PM Page 6 of 10
09/30/2018Beginning Balance
07/01/2018 Change
Fund: 22 - PARKS & RECREATION
Assets
Current Assets
11 - Cash
11000 - Cash in Bank 3,794,075.583,865,593.70 -71,518.12
11201 - Cash-Operating Reserves 91,858.0091,858.00 0.00
11202 - Cash-Replacement Reserves 151,760.00151,760.00 0.00
11203 - Cash-Disaster Reserves 138,939.00138,939.00 0.00
Total 11 - Cash 4,176,632.584,248,150.70 -71,518.12
12 - Accounts Receivable
12200 - Accounts Receivable - Parks 2,847.501,475.00 1,372.50
Total 12 - Accounts Receivable 2,847.501,475.00 1,372.50
14 - Other Current Assets
14300 - Deferred Outflows of Resources 41,907.0041,907.00 0.00
Total 14 - Other Current Assets 41,907.0041,907.00 0.00
Total Current Assets 4,221,387.084,291,532.70 -70,145.62
Fixed Assets
15 - Fixed Assets
15120 - Land - Parks - Phelan 1,254,729.221,254,729.22 0.00
15130 - Land - Parks - Pinon Hills 53,892.6553,892.65 0.00
15250 - Water Shares - SCWC 8,400.008,400.00 0.00
15320 - Improvement - Phelan 689,238.27689,238.27 0.00
15330 - Improvement - Pinon Hills 621,073.45621,073.45 0.00
15340 - Improvement - Parks Development 57,834.1657,834.16 0.00
Total 15 - Fixed Assets 2,685,167.752,685,167.75 0.00
16 - Equipment
16650 - Equipment - P 12,845.0012,845.00 0.00
Total 16 - Equipment 12,845.0012,845.00 0.00
17 - CIP
17000 - CIP - 25,186.5017,500.00 7,686.50
Total 17 - CIP 25,186.5017,500.00 7,686.50
19 - Accumulated Depreciation
19040 - Accm. Depreciation - Parks -689,154.93-671,436.85 -17,718.08
19050 - Accm. Depreciation - OP -7,278.98-7,118.42 -160.56
Total 19 - Accumulated Depreciation -696,433.91-678,555.27 -17,878.64
Total Fixed Assets 2,026,765.342,036,957.48 -10,192.14
6,248,152.42Total Assets: 6,328,490.18 -80,337.76
Liability
Current Liabilities
21 - Accounts Payable
21100 - Accounts Payable - Trade 0.006,787.40 -6,787.40
Total 21 - Accounts Payable 0.006,787.40 -6,787.40
22 - Accrrued Payable
22210 - Deferred Revenue 52.5030.00 22.50
Total 22 - Accrrued Payable 52.5030.00 22.50
24 - Payroll Liability
24410 - Accrued Payroll 0.002,823.40 -2,823.40
24650 - Current P- Compensated absences 5,684.895,684.89 0.00
Total 24 - Payroll Liability 5,684.898,508.29 -2,823.40
25 - Other Current Liabilities
25500 - Deferred Inflows of Resources 889.00889.00 0.00
Total 25 - Other Current Liabilities 889.00889.00 0.00
Total Current Liabilities 6,626.3916,214.69 -9,588.30
Long Term Liabilities
27
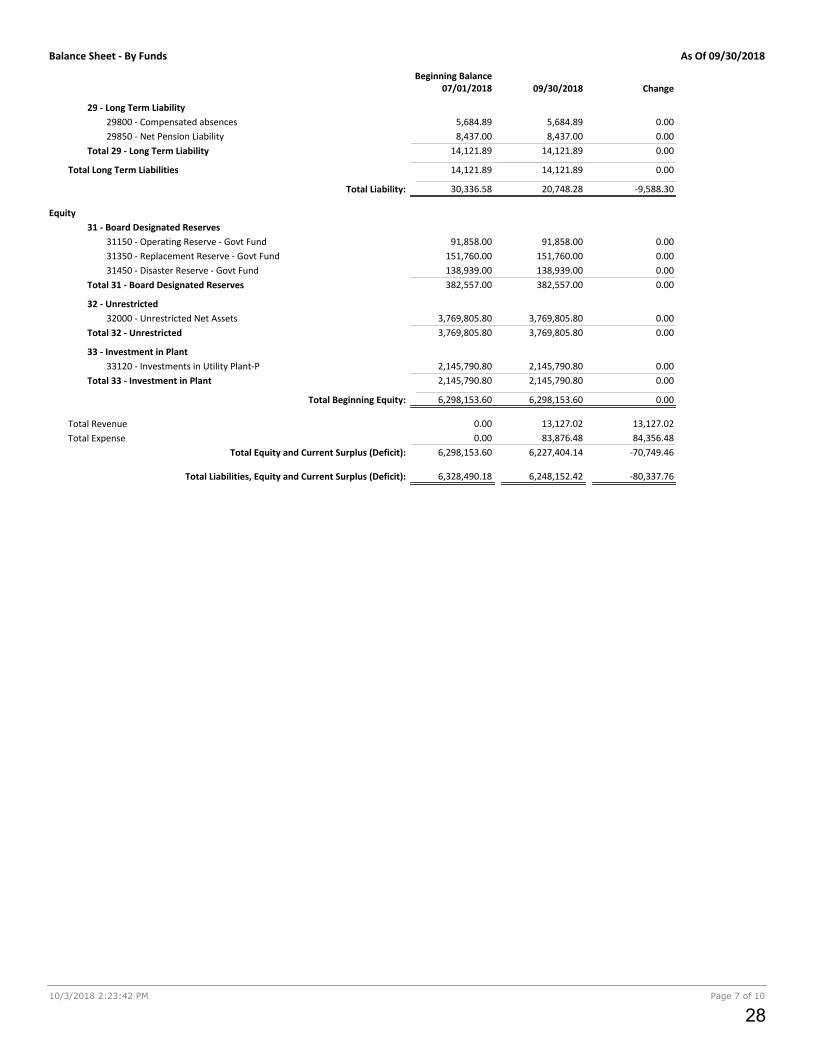
Balance Sheet - By Funds As Of 09/30/2018
10/3/2018 2:23:42 PM Page 7 of 10
09/30/2018Beginning Balance
07/01/2018 Change
29 - Long Term Liability
29800 - Compensated absences 5,684.895,684.89 0.00
29850 - Net Pension Liability 8,437.008,437.00 0.00
Total 29 - Long Term Liability 14,121.8914,121.89 0.00
Total Long Term Liabilities 14,121.8914,121.89 0.00
20,748.28Total Liability: 30,336.58 -9,588.30
Equity
31 - Board Designated Reserves
31150 - Operating Reserve - Govt Fund 91,858.0091,858.00 0.00
31350 - Replacement Reserve - Govt Fund 151,760.00151,760.00 0.00
31450 - Disaster Reserve - Govt Fund 138,939.00138,939.00 0.00
Total 31 - Board Designated Reserves 382,557.00382,557.00 0.00
32 - Unrestricted
32000 - Unrestricted Net Assets 3,769,805.803,769,805.80 0.00
Total 32 - Unrestricted 3,769,805.803,769,805.80 0.00
33 - Investment in Plant
33120 - Investments in Utility Plant-P 2,145,790.802,145,790.80 0.00
Total 33 - Investment in Plant 2,145,790.802,145,790.80 0.00
6,298,153.60Total Beginning Equity: 6,298,153.60 0.00
Total Revenue 13,127.020.00 13,127.02
Total Expense 83,876.480.00 84,356.48
Total Liabilities, Equity and Current Surplus (Deficit):
Total Equity and Current Surplus (Deficit): 6,227,404.14
6,248,152.42
6,298,153.60
6,328,490.18
-70,749.46
-80,337.76
28
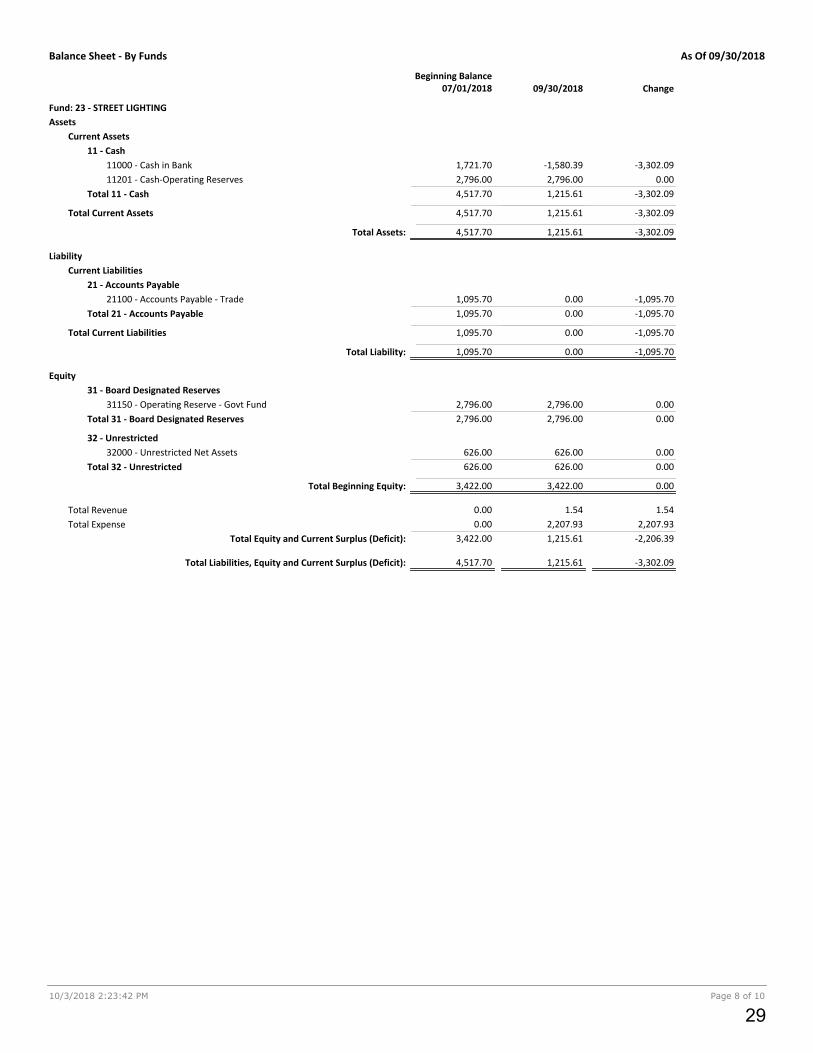
Balance Sheet - By Funds As Of 09/30/2018
10/3/2018 2:23:42 PM Page 8 of 10
09/30/2018Beginning Balance
07/01/2018 Change
Fund: 23 - STREET LIGHTING
Assets
Current Assets
11 - Cash
11000 - Cash in Bank -1,580.391,721.70 -3,302.09
11201 - Cash-Operating Reserves 2,796.002,796.00 0.00
Total 11 - Cash 1,215.614,517.70 -3,302.09
Total Current Assets 1,215.614,517.70 -3,302.09
1,215.61Total Assets: 4,517.70 -3,302.09
Liability
Current Liabilities
21 - Accounts Payable
21100 - Accounts Payable - Trade 0.001,095.70 -1,095.70
Total 21 - Accounts Payable 0.001,095.70 -1,095.70
Total Current Liabilities 0.001,095.70 -1,095.70
0.00Total Liability: 1,095.70 -1,095.70
Equity
31 - Board Designated Reserves
31150 - Operating Reserve - Govt Fund 2,796.002,796.00 0.00
Total 31 - Board Designated Reserves 2,796.002,796.00 0.00
32 - Unrestricted
32000 - Unrestricted Net Assets 626.00626.00 0.00
Total 32 - Unrestricted 626.00626.00 0.00
3,422.00Total Beginning Equity: 3,422.00 0.00
Total Revenue 1.540.00 1.54
Total Expense 2,207.930.00 2,207.93
Total Liabilities, Equity and Current Surplus (Deficit):
Total Equity and Current Surplus (Deficit): 1,215.61
1,215.61
3,422.00
4,517.70
-2,206.39
-3,302.09
29
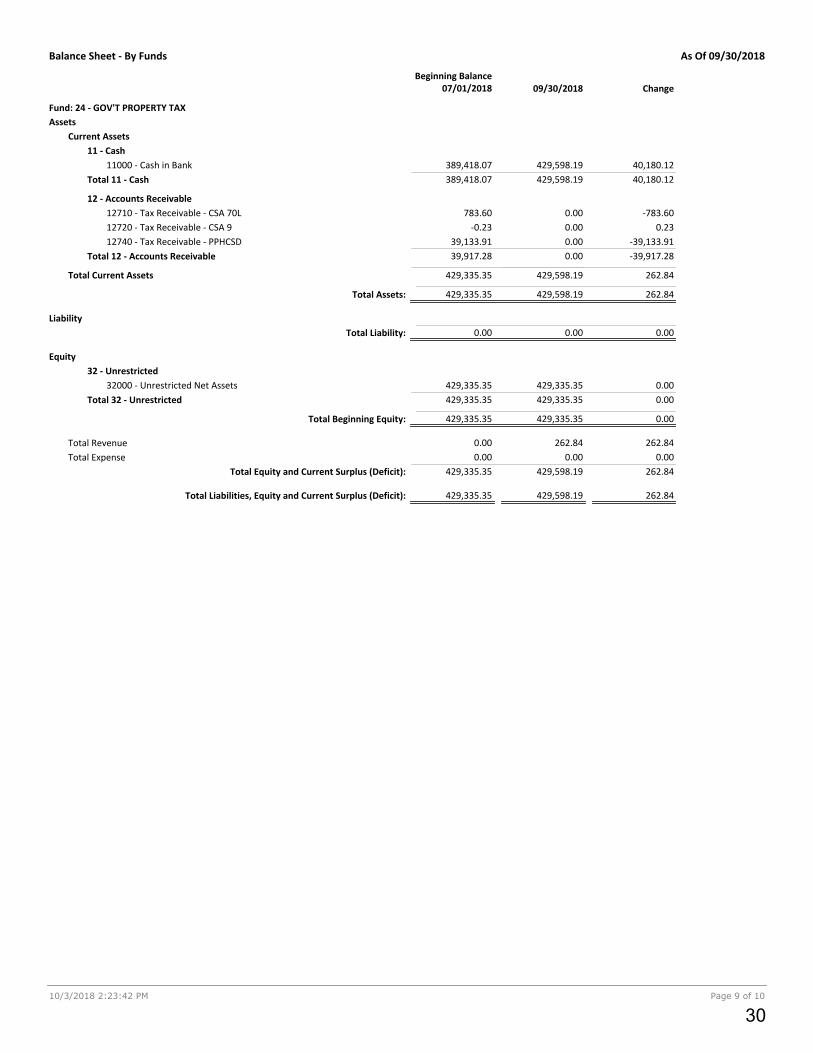
Balance Sheet - By Funds As Of 09/30/2018
10/3/2018 2:23:42 PM Page 9 of 10
09/30/2018Beginning Balance
07/01/2018 Change
Fund: 24 - GOV'T PROPERTY TAX
Assets
Current Assets
11 - Cash
11000 - Cash in Bank 429,598.19389,418.07 40,180.12
Total 11 - Cash 429,598.19389,418.07 40,180.12
12 - Accounts Receivable
12710 - Tax Receivable - CSA 70L 0.00783.60 -783.60
12720 - Tax Receivable - CSA 9 0.00-0.23 0.23
12740 - Tax Receivable - PPHCSD 0.0039,133.91 -39,133.91
Total 12 - Accounts Receivable 0.0039,917.28 -39,917.28
Total Current Assets 429,598.19429,335.35 262.84
429,598.19Total Assets: 429,335.35 262.84
Liability
0.00Total Liability: 0.00 0.00
Equity
32 - Unrestricted
32000 - Unrestricted Net Assets 429,335.35429,335.35 0.00
Total 32 - Unrestricted 429,335.35429,335.35 0.00
429,335.35Total Beginning Equity: 429,335.35 0.00
Total Revenue 262.840.00 262.84
Total Expense 0.000.00 0.00
Total Liabilities, Equity and Current Surplus (Deficit):
Total Equity and Current Surplus (Deficit): 429,598.19
429,598.19
429,335.35
429,335.35
262.84
262.84
30
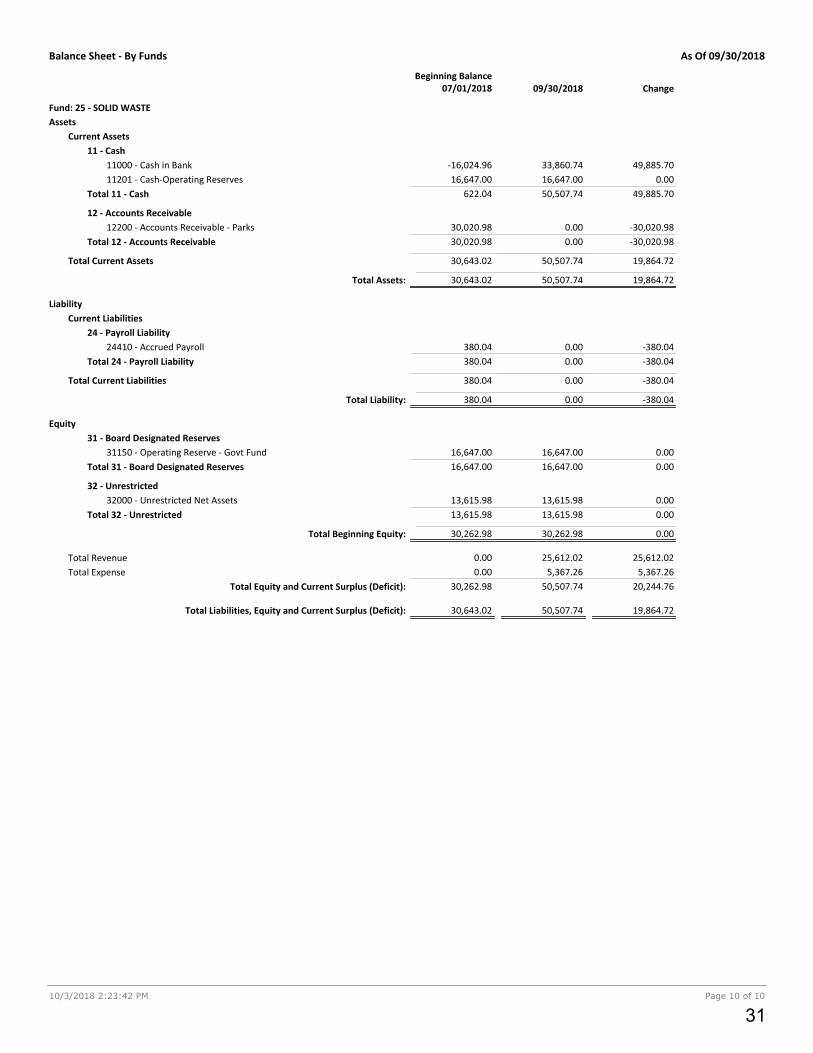
Balance Sheet - By Funds As Of 09/30/2018
10/3/2018 2:23:42 PM Page 10 of 10
09/30/2018Beginning Balance
07/01/2018 Change
Fund: 25 - SOLID WASTE
Assets
Current Assets
11 - Cash
11000 - Cash in Bank 33,860.74-16,024.96 49,885.70
11201 - Cash-Operating Reserves 16,647.0016,647.00 0.00
Total 11 - Cash 50,507.74622.04 49,885.70
12 - Accounts Receivable
12200 - Accounts Receivable - Parks 0.0030,020.98 -30,020.98
Total 12 - Accounts Receivable 0.0030,020.98 -30,020.98
Total Current Assets 50,507.7430,643.02 19,864.72
50,507.74Total Assets: 30,643.02 19,864.72
Liability
Current Liabilities
24 - Payroll Liability
24410 - Accrued Payroll 0.00380.04 -380.04
Total 24 - Payroll Liability 0.00380.04 -380.04
Total Current Liabilities 0.00380.04 -380.04
0.00Total Liability: 380.04 -380.04
Equity
31 - Board Designated Reserves
31150 - Operating Reserve - Govt Fund 16,647.0016,647.00 0.00
Total 31 - Board Designated Reserves 16,647.0016,647.00 0.00
32 - Unrestricted
32000 - Unrestricted Net Assets 13,615.9813,615.98 0.00
Total 32 - Unrestricted 13,615.9813,615.98 0.00
30,262.98Total Beginning Equity: 30,262.98 0.00
Total Revenue 25,612.020.00 25,612.02
Total Expense 5,367.260.00 5,367.26
Total Liabilities, Equity and Current Surplus (Deficit):
Total Equity and Current Surplus (Deficit): 50,507.74
50,507.74
30,262.98
30,643.02
20,244.76
19,864.72
31

10/3/2018 2:24:23 PM Page 1 of 8
Revenue and Expense - Ent & Gvmt FundsPhelan Pinon Hills Community Services District Summary
For the Period Ending 09/30/2018
Jul - SepBudget $ (Unfav) Budget
Total ENTERPRISE FUNDS
Budget Jul - Sep $ (Unfav) Budget Annual Budget
TOTAL
Jul - SepBudget $ (Unfav) Budget
Total GOVERNMENT FUNDS
Operational
Revenue
Total 40 - Water Consumption 1,159,389.44 67,013.401,092,376.04 3,045,580.901,092,376.04 0.001,159,389.44 0.0067,013.40 0.00
Total 41 - Water Meter Charges 534,996.89 6,936.86528,060.03 2,118,100.42528,060.03 0.00534,996.89 0.006,936.86 0.00
Total 45 - Meter Installation/Fees/Connection 95,867.99 -38,332.06134,200.05 537,015.21134,200.05 0.0095,867.99 0.00-38,332.06 0.00
Total 47 - Parks 7,180.00 568.606,611.40 26,456.250.00 6,611.400.00 7,180.000.00 568.60
Total 48 - Other Income 74,199.22 -22,364.9096,564.12 386,411.2950,341.80 46,222.3248,617.44 25,581.78-1,724.36 -20,640.54
1,871,633.54 13,821.901,857,811.64 6,113,564.07Total Revenue 52,833.72 32,761.78 -20,071.941,804,977.92 1,838,871.76 33,893.84
Expense
Total 50 - Water 569.93 3,116.323,686.25 10,937.973,686.25 0.00569.93 0.003,116.32 0.00
Total 51 - Salary & Benefits 488,588.44 125,200.76613,789.20 2,456,144.71559,444.56 54,344.64448,460.28 40,128.16110,984.28 14,216.48
Total 52 - Board 8,434.43 18,657.5227,091.95 108,412.1723,812.35 3,279.608,221.57 212.8615,590.78 3,066.74
Total 53 - Professional Fee 54,925.90 40,191.8695,117.76 380,624.3789,442.93 5,674.8353,091.93 1,833.9736,351.00 3,840.86
Total 54 - Service and Supplies 160,428.77 277,757.64438,186.41 1,763,734.88390,080.90 48,105.51137,769.86 22,658.91252,311.04 25,446.60
Total 58 - Utilities 156,792.11 -83,468.0973,324.02 288,989.4061,863.87 11,460.15146,288.87 10,503.24-84,425.00 956.91
Total 59 - Other Expenses-Depreciation/Amort/Other 483,401.89 37,619.21521,021.10 2,087,915.04488,544.51 32,476.59456,345.24 27,056.6532,199.27 5,419.94
1,353,141.47 419,075.221,772,216.69 7,096,758.54Total Expense 155,341.32 102,393.79 52,947.531,616,875.37 1,250,747.68 366,127.69
Net Operational Income 518,492.07 432,897.1285,594.95 -983,194.47-102,507.60 -69,632.01 32,875.59188,102.55 588,124.08 400,021.53
Non-Operational
70 - Property Tax Revenue
Total 71 - Property Tax Revenue - Current 0.00 0.000.00 1,073,896.300.00 0.000.00 0.000.00 0.00
Total 72 - Property Tax Revenue - Prior Years 0.00 0.000.00 30,176.190.00 0.000.00 0.000.00 0.00
Total 73 - Property Tax Revenue - Other 0.00 0.000.00 29,797.090.00 0.000.00 0.000.00 0.00
Total 74 - Special Assessments 0.00 0.000.00 294,640.300.00 0.000.00 0.000.00 0.00
Total 70 - Property Tax Revenue 0.00 0.000.00 1,428,509.880.00 0.00 0.000.00 0.00 0.00
80 - Other Revenue
Total 86 - Penalty & Other Fees 31,238.15 -6,210.9137,449.06 116,618.1437,449.06 0.0031,238.15 0.00-6,210.91 0.00
Total 88 - Other 264,922.14 -83,177.04348,099.18 1,392,954.40325,519.74 22,579.44247,416.24 17,505.90-78,103.50 -5,073.54
Total 80 - Other Revenue 296,160.29 -89,387.95385,548.24 1,509,572.5422,579.44 17,505.90 -5,073.54362,968.80 278,654.39 -84,314.41
296,160.29 -89,387.95385,548.24 2,938,082.42Total Revenue 22,579.44 17,505.90 -5,073.54362,968.80 278,654.39 -84,314.41
32

10/3/2018 2:24:23 PM Page 2 of 8
Jul - SepBudget $ (Unfav) Budget
Total ENTERPRISE FUNDS
Budget Jul - Sep $ (Unfav) Budget Annual Budget
TOTAL
Jul - SepBudget $ (Unfav) Budget
Total GOVERNMENT FUNDS
90 - Other Expense
Total 91 - Interest Expense 31,348.21 60,791.7292,139.93 368,707.3292,139.93 0.0031,348.21 0.0060,791.72 0.00
Total 92 - Loan Expense 19,726.48 -13,231.366,495.12 25,990.926,495.12 0.0019,726.48 0.00-13,231.36 0.00
Total 93 - Other Expense - Tax Processing 0.00 624.99624.99 2,500.970.00 624.990.00 0.000.00 624.99
Total 94 - Other Expense - CIP 0.00 199,437.12199,437.12 798,067.77199,437.12 0.000.00 0.00199,437.12 0.00
Total 95 - Fair Market Value -20,030.17 16,488.82-3,541.35 -14,171.13-3,541.35 0.00-20,030.17 0.0016,488.82 0.00
Total 99 - Other 0.00 0.000.00 0.00-90,683.70 90,683.700.00 0.00-90,683.70 90,683.70
Total 90 - Other Expense 31,044.52 264,111.29295,155.81 1,181,095.8591,308.69 0.00 91,308.69203,847.12 31,044.52 172,802.60
31,044.52 264,111.29295,155.81 1,181,095.85Total Expense 91,308.69 0.00 91,308.69203,847.12 31,044.52 172,802.60
Net Non-Operational Income 265,115.77 174,723.3490,392.43 1,756,986.57-68,729.25 17,505.90 86,235.15159,121.68 247,609.87 88,488.19
Net Income 783,607.84 607,620.46175,987.38 773,792.10-171,236.85 -52,126.11 119,110.74347,224.23 835,733.95 488,509.72
33

10/3/2018 2:24:23 PM Page 3 of 8
Revenue and Expense - Ent & Gvmt FundsPhelan Pinon Hills Community Services District Detail
For the Period Ending 09/30/2018
Jul - SepBudget $ (Unfav) Budget
Total ENTERPRISE FUNDS
Budget Jul - Sep $ (Unfav) Budget Annual Budget
TOTAL
Jul - SepBudget $ (Unfav) Budget
Total GOVERNMENT FUNDS
Operational
Operational Revenue
40 - Water Consumption
40010 - Water Sales - Residential - C 993,779.91 34,170.23959,609.68 2,680,441.53959,609.68 0.00993,779.91 0.0034,170.23 0.00
40020 - Water Sales - Commercial - C 22,534.01 16,132.026,401.99 17,188.766,401.99 0.0022,534.01 0.0016,132.02 0.00
40030 - Water Sales - Fire Protection-C 0.00 -781.79781.79 2,267.96781.79 0.000.00 0.00-781.79 0.00
40060 - Water Sales - Multiple Res - C 631.08 -100.35731.43 2,619.87731.43 0.00631.08 0.00-100.35 0.00
40070 - Water Sales - School - C 135,705.10 29,885.14105,819.96 277,374.46105,819.96 0.00135,705.10 0.0029,885.14 0.00
40090 - Water Sales - Construction - C 5,229.84 -13,801.3519,031.19 58,672.2919,031.19 0.005,229.84 0.00-13,801.35 0.00
40095 - Water Sales - Construction Non Potable- C 1,509.50 1,509.500.00 7,016.030.00 0.001,509.50 0.001,509.50 0.00
Total 40 - Water Consumption 1,159,389.44 67,013.401,092,376.04 3,045,580.901,092,376.04 0.001,159,389.44 0.0067,013.40 0.00
41 - Water Meter Charges
41010 - Water Sales - Residential - M 519,216.02 3,667.91515,548.11 2,068,032.57515,548.11 0.00519,216.02 0.003,667.91 0.00
41020 - Water Sales - Commercial - M 3,844.22 225.203,619.02 14,481.903,619.02 0.003,844.22 0.00225.20 0.00
41030 - Water Sales - Fire Protection-M 567.00 567.000.00 0.000.00 0.00567.00 0.00567.00 0.00
41060 - Water Sales - Multiple Res - M 578.85 0.45578.40 2,314.53578.40 0.00578.85 0.000.45 0.00
41070 - Water Sales - School - M 7,018.78 485.026,533.76 26,145.506,533.76 0.007,018.78 0.00485.02 0.00
41090 - Water Sales - Construction - M 3,772.02 1,991.281,780.74 7,125.921,780.74 0.003,772.02 0.001,991.28 0.00
Total 41 - Water Meter Charges 534,996.89 6,936.86528,060.03 2,118,100.42528,060.03 0.00534,996.89 0.006,936.86 0.00
45 - Meter Installation/Fees/Connection
45300 - Meter Installation 20,028.66 -4,169.8824,198.54 96,833.0024,198.54 0.0020,028.66 0.00-4,169.88 0.00
45400 - Permits & Inspections 1,545.00 633.12911.88 3,649.05911.88 0.001,545.00 0.00633.12 0.00
45500 - Connection Fee 74,294.33 -34,795.30109,089.63 436,533.16109,089.63 0.0074,294.33 0.00-34,795.30 0.00
Total 45 - Meter Installation/Fees/Connection 95,867.99 -38,332.06134,200.05 537,015.21134,200.05 0.0095,867.99 0.00-38,332.06 0.00
47 - Parks
47600 - Park & Recreation Fee 7,180.00 568.606,611.40 26,456.250.00 6,611.400.00 7,180.000.00 568.60
Total 47 - Parks 7,180.00 568.606,611.40 26,456.250.00 6,611.400.00 7,180.000.00 568.60
48 - Other Income
48200 - Other Services Incomes 34,400.94 -2,299.8936,700.83 146,862.1036,700.83 0.0034,400.94 0.00-2,299.89 0.00
48500 - Solid Waste Income 25,581.78 -20,640.5446,222.32 184,963.320.00 46,222.320.00 25,581.780.00 -20,640.54
34

10/3/2018 2:24:23 PM Page 4 of 8
Jul - SepBudget $ (Unfav) Budget
Total ENTERPRISE FUNDS
Budget Jul - Sep $ (Unfav) Budget Annual Budget
TOTAL
Jul - SepBudget $ (Unfav) Budget
Total GOVERNMENT FUNDS
48700 - Administrative Fees 14,216.50 575.5313,640.97 54,585.8713,640.97 0.0014,216.50 0.00575.53 0.00
Total 48 - Other Income 74,199.22 -22,364.9096,564.12 386,411.2950,341.80 46,222.3248,617.44 25,581.78-1,724.36 -20,640.54
Total Operational Revenue 1,871,633.54 13,821.901,857,811.64 6,113,564.0752,833.72 32,761.78 -20,071.941,804,977.92 1,838,871.76 33,893.84
Operational Expense
50 - Water
50010 - MWA WM Admin. & Bio Fee 569.93 2,841.433,411.36 9,837.973,411.36 0.00569.93 0.002,841.43 0.00
50020 - MWA WM Make Up Water 0.00 274.89274.89 1,100.00274.89 0.000.00 0.00274.89 0.00
Total 50 - Water 569.93 3,116.323,686.25 10,937.973,686.25 0.00569.93 0.003,116.32 0.00
51 - Salary & Benefits
51110 - Salaries & Wages 285,399.11 79,705.15365,104.26 1,461,002.16330,433.77 34,670.49257,719.35 27,679.7672,714.42 6,990.73
51120 - Vacations 13,340.26 9,786.4123,126.67 92,544.1421,117.84 2,008.8312,717.24 623.028,400.60 1,385.81
51130 - Holiday 11,507.56 5,306.4216,813.98 67,283.4415,422.31 1,391.6710,719.96 787.604,702.35 604.07
51140 - Sick Pay 5,090.58 13,251.9918,342.57 73,400.1116,824.39 1,518.185,028.50 62.0811,795.89 1,456.10
51150 - Misc Earn 17,012.93 -516.2316,496.70 66,013.4915,986.91 509.7916,637.71 375.22-650.80 134.57
51170 - Overtime 36,162.01 -7,721.6228,440.39 113,807.6527,119.43 1,320.9635,273.92 888.09-8,154.49 432.87
51210 - Payroll Taxes 5,859.36 4,754.7910,614.15 42,474.269,521.73 1,092.425,413.94 445.424,107.79 647.00
51220 - Worker's Compensation 3,947.51 6,680.7710,628.28 42,530.168,402.10 2,226.182,417.24 1,530.275,984.86 695.91
51230 - Employee Group Insurance 68,939.07 5,658.6374,597.70 298,511.0469,477.63 5,120.0764,920.67 4,018.404,556.96 1,101.67
51240 - Retirement 41,345.73 8,278.7749,624.50 198,578.2645,138.45 4,486.0537,627.43 3,718.307,511.02 767.75
51290 - Contra Benes (towards projects) -15.68 15.680.00 0.000.00 0.00-15.68 0.0015.68 0.00
Total 51 - Salary & Benefits 488,588.44 125,200.76613,789.20 2,456,144.71559,444.56 54,344.64448,460.28 40,128.16110,984.28 14,216.48
52 - Board
52110 - Board Director's Fee 1,459.69 9,043.5210,503.21 42,030.009,183.78 1,319.432,090.00 -630.317,093.78 1,949.74
52210 - Board Exp - Auto Expense 0.00 -65.76-65.76 -263.23-65.76 0.00-37.73 37.73-28.03 -37.73
52211 - Board - Auto Expense/Brandon 136.73 118.96255.69 1,023.17255.69 0.00136.73 0.00118.96 0.00
52214 - Board - Auto Expense/Morrissette 0.00 220.50220.50 882.43220.50 0.000.00 0.00220.50 0.00
52215 - Board - Auto Expense/Roberts 0.00 175.05175.05 700.50175.05 0.000.00 0.00175.05 0.00
52216 - Board-Auto Expense/Pace 0.00 133.11133.11 532.75133.11 0.000.00 0.00133.11 0.00
52217 - Board-Auto Expense/Whalen 0.00 236.79236.79 947.54236.79 0.000.00 0.00236.79 0.00
52221 - Board - Meals,Travel Expenses/Brandon 0.00 1,314.451,314.45 5,259.911,314.45 0.000.00 0.001,314.45 0.00
52224 - Board - Meals,Travel Expenses/Morrissette 0.00 454.47454.47 1,818.63454.47 0.000.00 0.00454.47 0.00
52225 - Board - Meals,Travel Expenses/Roberts 0.00 951.09951.09 3,805.92951.09 0.000.00 0.00951.09 0.00
52226 - Board-Meals,Travel Expenses/Pace 0.00 529.11529.11 2,117.38529.11 0.000.00 0.00529.11 0.00
52227 - Board-Meals,Travel Expenses/Whalen 0.00 220.38220.38 881.89220.38 0.000.00 0.00220.38 0.00
52231 - Board - Education,Training/Brandon 0.00 23.9423.94 95.9223.94 0.000.00 0.0023.94 0.00
52234 - Board - Education,Training/Morrissette 32.00 -152.60-120.60 -482.63-120.60 0.0032.00 0.00-152.60 0.00
52235 - Board - Education,Training/Roberts 1,099.00 -783.22315.78 1,263.68315.78 0.001,099.00 0.00-783.22 0.00
52236 - Board-Education,Training/Pace 0.00 510.45510.45 2,042.63510.45 0.000.00 0.00510.45 0.00
35

10/3/2018 2:24:23 PM Page 5 of 8
Jul - SepBudget $ (Unfav) Budget
Total ENTERPRISE FUNDS
Budget Jul - Sep $ (Unfav) Budget Annual Budget
TOTAL
Jul - SepBudget $ (Unfav) Budget
Total GOVERNMENT FUNDS
52240 - Board Expense - Insurance 5,707.01 5,727.2811,434.29 45,755.689,474.12 1,960.174,901.57 805.444,572.55 1,154.73
Total 52 - Board 8,434.43 18,657.5227,091.95 108,412.1723,812.35 3,279.608,221.57 212.8615,590.78 3,066.74
53 - Professional Fee
53110 - Auditing & Accounting Fees 7,274.00 -2,234.005,040.00 20,168.264,800.00 240.007,274.00 0.00-2,474.00 240.00
53120 - Legal Services 18,136.63 10,803.2628,939.89 115,806.0825,822.41 3,117.4817,561.63 575.008,260.78 2,542.48
53130 - Engineering 0.00 74.9774.97 300.000.00 74.970.00 0.000.00 74.97
53140 - Laboratory Analysis 1,223.50 2,025.203,248.70 13,000.003,248.70 0.001,223.50 0.002,025.20 0.00
53150 - Outside Service 11,923.42 12,211.1624,134.58 96,577.2022,636.53 1,498.0511,323.42 600.0011,313.11 898.05
53160 - Permits & Fees 1,772.00 7,425.469,197.46 36,804.828,785.14 412.321,192.00 580.007,593.14 -167.68
53170 - Software Support 14,596.35 9,885.8124,482.16 97,968.0124,150.15 332.0114,517.38 78.979,632.77 253.04
Total 53 - Professional Fee 54,925.90 40,191.8695,117.76 380,624.3789,442.93 5,674.8353,091.93 1,833.9736,351.00 3,840.86
54 - Service and Supplies
54110 - Advertising 2,113.36 316.822,430.18 9,724.671,304.31 1,125.871,872.16 241.20-567.85 884.67
54140 - Auto Expense 664.52 155.11819.63 3,280.02743.64 75.99664.52 0.0079.12 75.99
54170 - Auto Allowance 1,631.61 317.611,949.22 7,800.001,949.22 0.001,631.61 0.00317.61 0.00
54200 - Credit Card Fee & Bank Charges 12,432.96 -792.6911,640.27 46,579.9311,640.27 0.0012,432.96 0.00-792.69 0.00
54230 - Dues & Subscriptions 4,620.28 -2,396.962,223.32 19,180.231,998.86 224.464,540.28 80.00-2,541.42 144.46
54260 - Education & Training 1,555.00 6,623.878,178.87 32,728.677,544.13 634.741,555.00 0.005,989.13 634.74
54290 - Employment Expense 603.00 -207.69395.31 1,581.88395.31 0.00603.00 0.00-207.69 0.00
54300 - Equipment Rental / Lease 5,960.19 -2,808.693,151.50 12,611.362,523.99 627.515,960.19 0.00-3,436.20 627.51
54320 - General Maintenance 1,550.00 -155.031,394.97 5,582.281,330.11 64.861,460.00 90.00-129.89 -25.14
54350 - Insurance 21,836.52 -588.3921,248.13 85,026.5820,806.65 441.4821,378.30 458.22-571.65 -16.74
54380 - Insurance - Vehicle 4,873.53 235.175,108.70 20,443.054,806.03 302.674,581.09 292.44224.94 10.23
54410 - Fuel Costs 16,392.97 -3,162.4313,230.54 52,943.4512,840.21 390.3316,392.97 0.00-3,552.76 390.33
54440 - Meeting, Seminar & Supplies 163.20 1,368.871,532.07 6,131.061,457.97 74.1094.98 68.221,362.99 5.88
54470 - Travel Expense 5,814.78 1,046.856,861.63 27,457.676,343.20 518.435,814.78 0.00528.42 518.43
54500 - Operating Supplies 12,599.70 14,554.5327,154.23 108,660.9224,542.79 2,611.4411,525.85 1,073.8513,016.94 1,537.59
54530 - Office Supplies 5,154.07 1,521.356,675.42 26,712.866,348.06 327.365,084.12 69.951,263.94 257.41
54620 - Repair & Maintenance 10,742.12 230,226.19240,968.31 964,259.06230,156.07 10,812.24148.13 10,593.99230,007.94 218.25
54650 - Small Tools 3,493.04 2,183.715,676.75 22,716.275,426.85 249.903,493.04 0.001,933.81 249.90
54680 - Uniforms 1,712.56 1,094.032,806.59 11,231.202,321.73 484.861,561.54 151.02760.19 333.84
54710 - Vehicle Maintenance 14,490.41 -2,704.4311,785.98 47,162.9510,912.35 873.6314,490.41 0.00-3,578.06 873.63
54740 - Easement Lease 0.00 253.14253.14 1,013.04253.14 0.000.00 0.00253.14 0.00
54770 - Computer & Equip Maintenance 0.00 1,554.241,554.24 6,219.591,554.24 0.000.00 0.001,554.24 0.00
54800 - Programs (Wtr Conservation, Parks, etc) 1,539.51 18,513.6020,053.11 80,244.705,851.32 14,201.791,229.01 310.504,622.31 13,891.29
54801 - Senior Lunch Program 2,774.23 2,518.885,293.11 21,180.940.00 5,293.110.00 2,774.230.00 2,518.88
54802 - Farmer's Market 3,075.29 2,071.035,146.32 20,593.620.00 5,146.320.00 3,075.290.00 2,071.03
54804 - Farmers Market MM Program 180.00 -130.2649.74 199.140.00 49.740.00 180.000.00 -130.26
54830 - State & County Fees & Services 10,526.60 -1,190.099,336.51 37,361.079,260.43 76.0810,326.60 200.00-1,066.17 -123.92
54860 - Postage & Mailing 10,045.02 1,471.3211,516.34 46,083.8111,516.34 0.0010,045.02 0.001,471.32 0.00
54890 - Printing 884.30 4,810.095,694.39 22,786.785,694.39 0.00884.30 0.004,810.09 0.00
36

10/3/2018 2:24:23 PM Page 6 of 8
Jul - SepBudget $ (Unfav) Budget
Total ENTERPRISE FUNDS
Budget Jul - Sep $ (Unfav) Budget Annual Budget
TOTAL
Jul - SepBudget $ (Unfav) Budget
Total GOVERNMENT FUNDS
54920 - Public Relation 3,000.00 1,057.894,057.89 16,238.08559.29 3,498.600.00 3,000.00559.29 498.60
Total 54 - Service and Supplies 160,428.77 277,757.64438,186.41 1,763,734.88390,080.90 48,105.51137,769.86 22,658.91252,311.04 25,446.60
58 - Utilities
58010 - Telephone 6,159.11 203.986,363.09 25,462.696,281.40 81.696,026.12 132.99255.28 -51.30
58110 - Utilities 238,662.81 -81,348.00157,314.81 625,086.85148,492.89 8,821.92230,500.49 8,162.32-82,007.60 659.60
58115 - Utilities - Solar Credits -90,237.74 -2,672.68-92,910.42 -371,790.40-92,910.42 0.00-90,237.74 0.00-2,672.68 0.00
58210 - Utilities - Street Lights 2,207.93 348.612,556.54 10,230.260.00 2,556.540.00 2,207.930.00 348.61
Total 58 - Utilities 156,792.11 -83,468.0973,324.02 288,989.4061,863.87 11,460.15146,288.87 10,503.24-84,425.00 956.91
59 - Other Expenses-Depreciation/Amort/Other
59100 - Bad Debt 938.21 -611.66326.55 1,306.76326.55 0.00938.21 0.00-611.66 0.00
59110 - Property Taxes 0.00 0.000.00 2,996.440.00 0.000.00 0.000.00 0.00
59120 - Depreciation & Amortization 482,463.68 38,230.87520,694.55 2,083,611.84488,217.96 32,476.59455,407.03 27,056.6532,810.93 5,419.94
Total 59 - Other Expenses-Depreciation/Amort/Other 483,401.89 37,619.21521,021.10 2,087,915.04488,544.51 32,476.59456,345.24 27,056.6532,199.27 5,419.94
Total Operational Expense 1,353,141.47 419,075.221,772,216.69 7,096,758.54155,341.32 102,393.79 52,947.531,616,875.37 1,250,747.68 366,127.69
Net Operational Income 518,492.07 432,897.1285,594.95 -983,194.47-102,507.60 -69,632.01 32,875.59188,102.55 588,124.08 400,021.53
Non-Operational
Non-Operational Revenue
70 - Property Tax Revenue
71 - Property Tax Revenue - Current
71110 - Property Taxes - Curr Sec 0.00 0.000.00 951,044.410.00 0.000.00 0.000.00 0.00
71120 - Property Taxes - Curr Unsec 0.00 0.000.00 61,188.600.00 0.000.00 0.000.00 0.00
71130 - Property Taxes - Curr Supplimen 0.00 0.000.00 10,460.490.00 0.000.00 0.000.00 0.00
71140 - Property Taxes - Curr Unitary 0.00 0.000.00 36,347.760.00 0.000.00 0.000.00 0.00
71150 - Property Taxes - Curr Other 0.00 0.000.00 14,855.040.00 0.000.00 0.000.00 0.00
Total 71 - Property Tax Revenue - Current 0.00 0.000.00 1,073,896.300.00 0.000.00 0.000.00 0.00
72 - Property Tax Revenue - Prior Years
72110 - Property Taxes - Prior Sec 0.00 0.000.00 20,061.020.00 0.000.00 0.000.00 0.00
72120 - Property Taxes - Prior Unsec 0.00 0.000.00 335.770.00 0.000.00 0.000.00 0.00
72130 - Property Taxes - Prior Supplimn 0.00 0.000.00 8,036.560.00 0.000.00 0.000.00 0.00
72150 - Property Taxes - Prior Other 0.00 0.000.00 1,742.840.00 0.000.00 0.000.00 0.00
Total 72 - Property Tax Revenue - Prior Years 0.00 0.000.00 30,176.190.00 0.000.00 0.000.00 0.00
73 - Property Tax Revenue - Other
73160 - Property Taxes - Homeowner 0.00 0.000.00 7,903.640.00 0.000.00 0.000.00 0.00
73170 - Tax Penalties & Others 0.00 0.000.00 21,893.450.00 0.000.00 0.000.00 0.00
Total 73 - Property Tax Revenue - Other 0.00 0.000.00 29,797.090.00 0.000.00 0.000.00 0.00
37
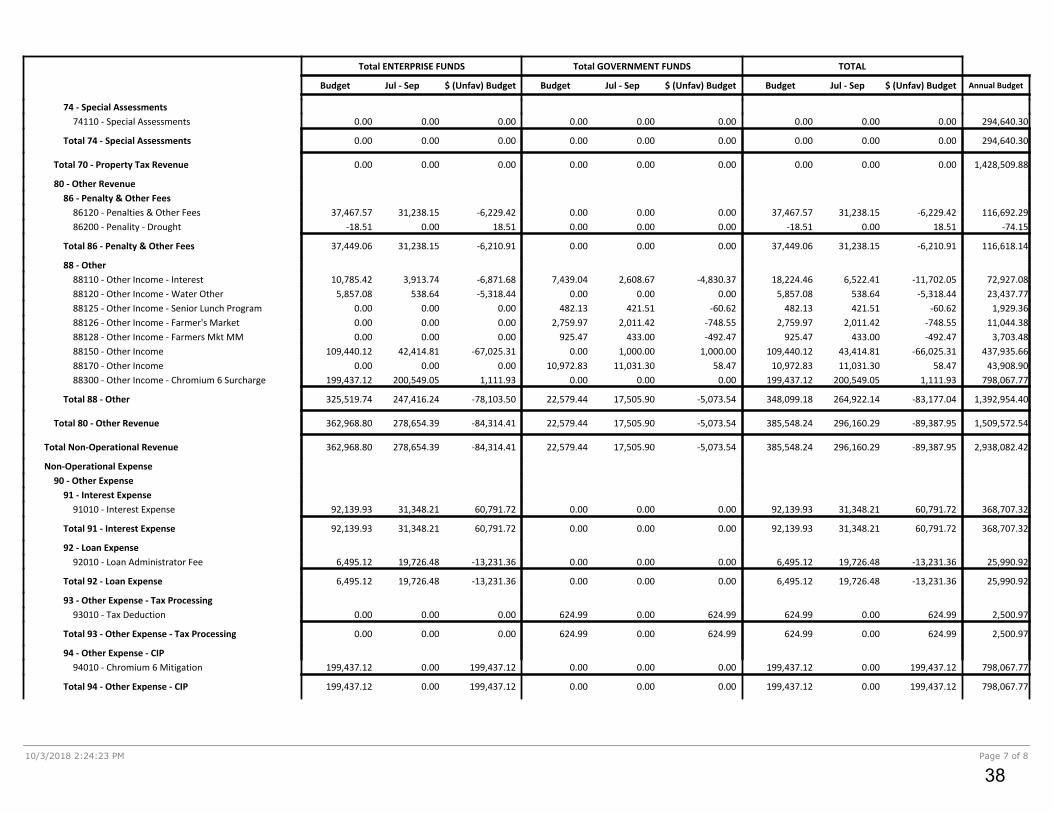
10/3/2018 2:24:23 PM Page 7 of 8
Jul - SepBudget $ (Unfav) Budget
Total ENTERPRISE FUNDS
Budget Jul - Sep $ (Unfav) Budget Annual Budget
TOTAL
Jul - SepBudget $ (Unfav) Budget
Total GOVERNMENT FUNDS
74 - Special Assessments
74110 - Special Assessments 0.00 0.000.00 294,640.300.00 0.000.00 0.000.00 0.00
Total 74 - Special Assessments 0.00 0.000.00 294,640.300.00 0.000.00 0.000.00 0.00
Total 70 - Property Tax Revenue 0.00 0.000.00 1,428,509.880.00 0.00 0.000.00 0.00 0.00
80 - Other Revenue
86 - Penalty & Other Fees
86120 - Penalties & Other Fees 31,238.15 -6,229.4237,467.57 116,692.2937,467.57 0.0031,238.15 0.00-6,229.42 0.00
86200 - Penality - Drought 0.00 18.51-18.51 -74.15-18.51 0.000.00 0.0018.51 0.00
Total 86 - Penalty & Other Fees 31,238.15 -6,210.9137,449.06 116,618.1437,449.06 0.0031,238.15 0.00-6,210.91 0.00
88 - Other
88110 - Other Income - Interest 6,522.41 -11,702.0518,224.46 72,927.0810,785.42 7,439.043,913.74 2,608.67-6,871.68 -4,830.37
88120 - Other Income - Water Other 538.64 -5,318.445,857.08 23,437.775,857.08 0.00538.64 0.00-5,318.44 0.00
88125 - Other Income - Senior Lunch Program 421.51 -60.62482.13 1,929.360.00 482.130.00 421.510.00 -60.62
88126 - Other Income - Farmer's Market 2,011.42 -748.552,759.97 11,044.380.00 2,759.970.00 2,011.420.00 -748.55
88128 - Other Income - Farmers Mkt MM 433.00 -492.47925.47 3,703.480.00 925.470.00 433.000.00 -492.47
88150 - Other Income 43,414.81 -66,025.31109,440.12 437,935.66109,440.12 0.0042,414.81 1,000.00-67,025.31 1,000.00
88170 - Other Income 11,031.30 58.4710,972.83 43,908.900.00 10,972.830.00 11,031.300.00 58.47
88300 - Other Income - Chromium 6 Surcharge 200,549.05 1,111.93199,437.12 798,067.77199,437.12 0.00200,549.05 0.001,111.93 0.00
Total 88 - Other 264,922.14 -83,177.04348,099.18 1,392,954.40325,519.74 22,579.44247,416.24 17,505.90-78,103.50 -5,073.54
Total 80 - Other Revenue 296,160.29 -89,387.95385,548.24 1,509,572.5422,579.44 17,505.90 -5,073.54362,968.80 278,654.39 -84,314.41
Total Non-Operational Revenue 296,160.29 -89,387.95385,548.24 2,938,082.4222,579.44 17,505.90 -5,073.54362,968.80 278,654.39 -84,314.41
Non-Operational Expense
90 - Other Expense
91 - Interest Expense
91010 - Interest Expense 31,348.21 60,791.7292,139.93 368,707.3292,139.93 0.0031,348.21 0.0060,791.72 0.00
Total 91 - Interest Expense 31,348.21 60,791.7292,139.93 368,707.3292,139.93 0.0031,348.21 0.0060,791.72 0.00
92 - Loan Expense
92010 - Loan Administrator Fee 19,726.48 -13,231.366,495.12 25,990.926,495.12 0.0019,726.48 0.00-13,231.36 0.00
Total 92 - Loan Expense 19,726.48 -13,231.366,495.12 25,990.926,495.12 0.0019,726.48 0.00-13,231.36 0.00
93 - Other Expense - Tax Processing
93010 - Tax Deduction 0.00 624.99624.99 2,500.970.00 624.990.00 0.000.00 624.99
Total 93 - Other Expense - Tax Processing 0.00 624.99624.99 2,500.970.00 624.990.00 0.000.00 624.99
94 - Other Expense - CIP
94010 - Chromium 6 Mitigation 0.00 199,437.12199,437.12 798,067.77199,437.12 0.000.00 0.00199,437.12 0.00
Total 94 - Other Expense - CIP 0.00 199,437.12199,437.12 798,067.77199,437.12 0.000.00 0.00199,437.12 0.00
38

10/3/2018 2:24:23 PM Page 8 of 8
Jul - SepBudget $ (Unfav) Budget
Total ENTERPRISE FUNDS
Budget Jul - Sep $ (Unfav) Budget Annual Budget
TOTAL
Jul - SepBudget $ (Unfav) Budget
Total GOVERNMENT FUNDS
95 - Fair Market Value
95010 - Net Incr/Decr in Fair Value -20,030.17 16,488.82-3,541.35 -14,171.13-3,541.35 0.00-20,030.17 0.0016,488.82 0.00
Total 95 - Fair Market Value -20,030.17 16,488.82-3,541.35 -14,171.13-3,541.35 0.00-20,030.17 0.0016,488.82 0.00
99 - Other
99020 - Transfer In/Out Enterprise 0.00 90,683.7090,683.70 362,880.000.00 90,683.700.00 0.000.00 90,683.70
99030 - Transfer In/Out Government 0.00 -90,683.70-90,683.70 -362,880.00-90,683.70 0.000.00 0.00-90,683.70 0.00
Total 99 - Other 0.00 0.000.00 0.00-90,683.70 90,683.700.00 0.00-90,683.70 90,683.70
Total 90 - Other Expense -31,044.52 264,111.29-295,155.81 -1,181,095.85-91,308.69 0.00 91,308.69-203,847.12 -31,044.52 172,802.60
Total Non-Operational Expense 31,044.52 264,111.29295,155.81 1,181,095.8591,308.69 0.00 91,308.69203,847.12 31,044.52 172,802.60
Net Non-Operational Income 265,115.77 174,723.3490,392.43 1,756,986.57-68,729.25 17,505.90 86,235.15159,121.68 247,609.87 88,488.19
Net Income 783,607.84 607,620.46175,987.38 773,792.10-171,236.85 -52,126.11 119,110.74347,224.23 835,733.95 488,509.72
39
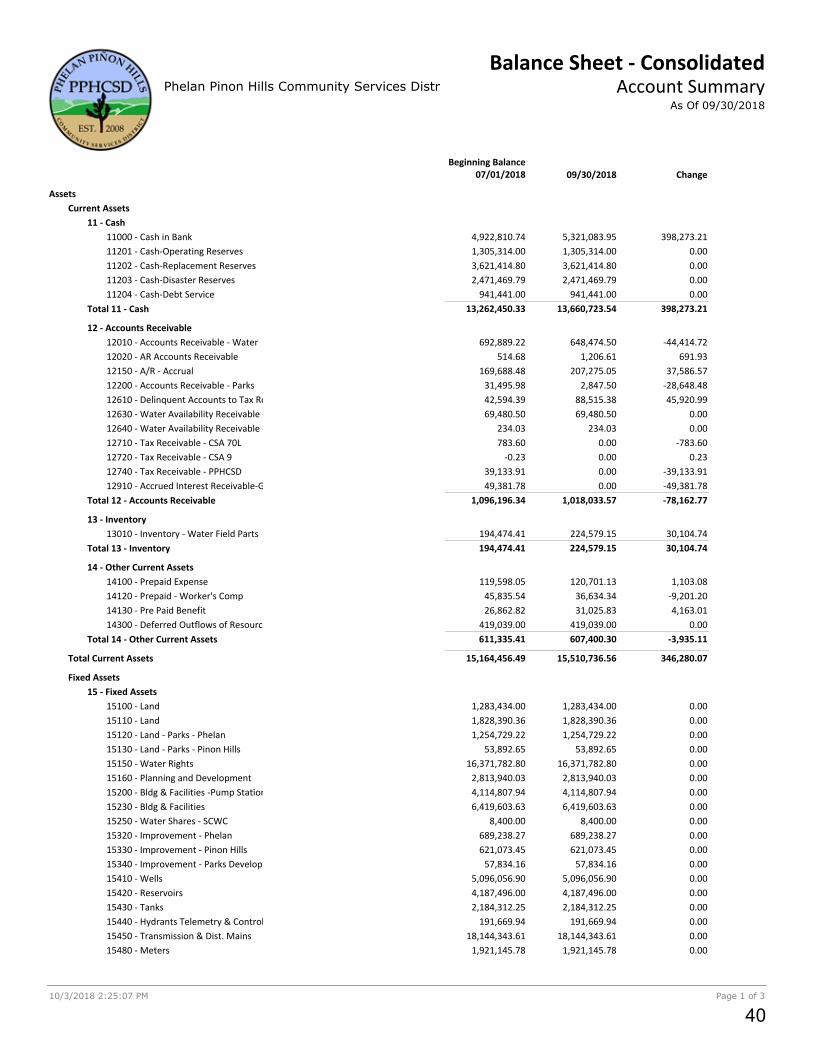
10/3/2018 2:25:07 PM Page 1 of 3
Balance Sheet - ConsolidatedPhelan Pinon Hills Community Services District Account Summary
As Of 09/30/2018
09/30/2018Beginning Balance
07/01/2018 Change
Assets
Current Assets
11 - Cash
11000 - Cash in Bank 5,321,083.954,922,810.74 398,273.21
11201 - Cash-Operating Reserves 1,305,314.001,305,314.00 0.00
11202 - Cash-Replacement Reserves 3,621,414.803,621,414.80 0.00
11203 - Cash-Disaster Reserves 2,471,469.792,471,469.79 0.00
11204 - Cash-Debt Service 941,441.00941,441.00 0.00
Total 11 - Cash 13,660,723.5413,262,450.33 398,273.21
12 - Accounts Receivable
12010 - Accounts Receivable - Water 648,474.50692,889.22 -44,414.72
12020 - AR Accounts Receivable 1,206.61514.68 691.93
12150 - A/R - Accrual 207,275.05169,688.48 37,586.57
12200 - Accounts Receivable - Parks 2,847.5031,495.98 -28,648.48
12610 - Delinquent Accounts to Tax Roll 88,515.3842,594.39 45,920.99
12630 - Water Availability Receivable - WC13 69,480.5069,480.50 0.00
12640 - Water Availability Receivable - UD60 234.03234.03 0.00
12710 - Tax Receivable - CSA 70L 0.00783.60 -783.60
12720 - Tax Receivable - CSA 9 0.00-0.23 0.23
12740 - Tax Receivable - PPHCSD 0.0039,133.91 -39,133.91
12910 - Accrued Interest Receivable-GF 0.0049,381.78 -49,381.78
Total 12 - Accounts Receivable 1,018,033.571,096,196.34 -78,162.77
13 - Inventory
13010 - Inventory - Water Field Parts 224,579.15194,474.41 30,104.74
Total 13 - Inventory 224,579.15194,474.41 30,104.74
14 - Other Current Assets
14100 - Prepaid Expense 120,701.13119,598.05 1,103.08
14120 - Prepaid - Worker's Comp 36,634.3445,835.54 -9,201.20
14130 - Pre Paid Benefit 31,025.8326,862.82 4,163.01
14300 - Deferred Outflows of Resources 419,039.00419,039.00 0.00
Total 14 - Other Current Assets 607,400.30611,335.41 -3,935.11
Total Current Assets 15,510,736.5615,164,456.49 346,280.07
Fixed Assets
15 - Fixed Assets
15100 - Land 1,283,434.001,283,434.00 0.00
15110 - Land 1,828,390.361,828,390.36 0.00
15120 - Land - Parks - Phelan 1,254,729.221,254,729.22 0.00
15130 - Land - Parks - Pinon Hills 53,892.6553,892.65 0.00
15150 - Water Rights 16,371,782.8016,371,782.80 0.00
15160 - Planning and Development 2,813,940.032,813,940.03 0.00
15200 - Bldg & Facilities -Pump Station 4,114,807.944,114,807.94 0.00
15230 - Bldg & Facilities 6,419,603.636,419,603.63 0.00
15250 - Water Shares - SCWC 8,400.008,400.00 0.00
15320 - Improvement - Phelan 689,238.27689,238.27 0.00
15330 - Improvement - Pinon Hills 621,073.45621,073.45 0.00
15340 - Improvement - Parks Development 57,834.1657,834.16 0.00
15410 - Wells 5,096,056.905,096,056.90 0.00
15420 - Reservoirs 4,187,496.004,187,496.00 0.00
15430 - Tanks 2,184,312.252,184,312.25 0.00
15440 - Hydrants Telemetry & Control 191,669.94191,669.94 0.00
15450 - Transmission & Dist. Mains 18,144,343.6118,144,343.61 0.00
15480 - Meters 1,921,145.781,921,145.78 0.00
40
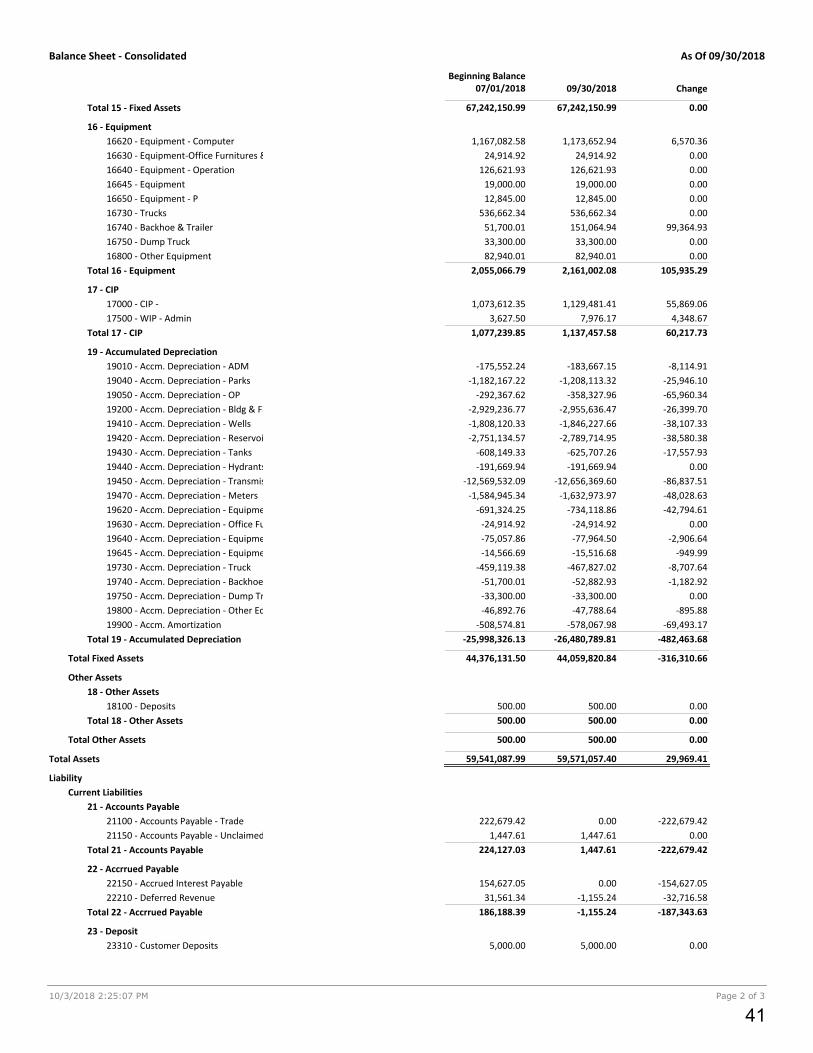
Balance Sheet - Consolidated As Of 09/30/2018
10/3/2018 2:25:07 PM Page 2 of 3
09/30/2018Beginning Balance
07/01/2018 Change
Total 15 - Fixed Assets 67,242,150.9967,242,150.99 0.00
16 - Equipment
16620 - Equipment - Computer 1,173,652.941,167,082.58 6,570.36
16630 - Equipment-Office Furnitures &Eq 24,914.9224,914.92 0.00
16640 - Equipment - Operation 126,621.93126,621.93 0.00
16645 - Equipment 19,000.0019,000.00 0.00
16650 - Equipment - P 12,845.0012,845.00 0.00
16730 - Trucks 536,662.34536,662.34 0.00
16740 - Backhoe & Trailer 151,064.9451,700.01 99,364.93
16750 - Dump Truck 33,300.0033,300.00 0.00
16800 - Other Equipment 82,940.0182,940.01 0.00
Total 16 - Equipment 2,161,002.082,055,066.79 105,935.29
17 - CIP
17000 - CIP - 1,129,481.411,073,612.35 55,869.06
17500 - WIP - Admin 7,976.173,627.50 4,348.67
Total 17 - CIP 1,137,457.581,077,239.85 60,217.73
19 - Accumulated Depreciation
19010 - Accm. Depreciation - ADM -183,667.15-175,552.24 -8,114.91
19040 - Accm. Depreciation - Parks -1,208,113.32-1,182,167.22 -25,946.10
19050 - Accm. Depreciation - OP -358,327.96-292,367.62 -65,960.34
19200 - Accm. Depreciation - Bldg & Fac - Pump Station -2,955,636.47-2,929,236.77 -26,399.70
19410 - Accm. Depreciation - Wells -1,846,227.66-1,808,120.33 -38,107.33
19420 - Accm. Depreciation - Reservoirs -2,789,714.95-2,751,134.57 -38,580.38
19430 - Accm. Depreciation - Tanks -625,707.26-608,149.33 -17,557.93
19440 - Accm. Depreciation - Hydrants Telemetry & Cont -191,669.94-191,669.94 0.00
19450 - Accm. Depreciation - Transmissions & Dist Main -12,656,369.60-12,569,532.09 -86,837.51
19470 - Accm. Depreciation - Meters -1,632,973.97-1,584,945.34 -48,028.63
19620 - Accm. Depreciation - Equipment - Computer -734,118.86-691,324.25 -42,794.61
19630 - Accm. Depreciation - Office Furniture & Equip -24,914.92-24,914.92 0.00
19640 - Accm. Depreciation - Equipment - Operation -77,964.50-75,057.86 -2,906.64
19645 - Accm. Depreciation - Equipment Gov't -15,516.68-14,566.69 -949.99
19730 - Accm. Depreciation - Truck -467,827.02-459,119.38 -8,707.64
19740 - Accm. Depreciation - Backhoe & Trailer -52,882.93-51,700.01 -1,182.92
19750 - Accm. Depreciation - Dump Truck -33,300.00-33,300.00 0.00
19800 - Accm. Depreciation - Other Equipment -47,788.64-46,892.76 -895.88
19900 - Accm. Amortization -578,067.98-508,574.81 -69,493.17
Total 19 - Accumulated Depreciation -26,480,789.81-25,998,326.13 -482,463.68
Total Fixed Assets 44,059,820.8444,376,131.50 -316,310.66
Other Assets
18 - Other Assets
18100 - Deposits 500.00500.00 0.00
Total 18 - Other Assets 500.00500.00 0.00
Total Other Assets 500.00500.00 0.00
Total Assets 59,571,057.4059,541,087.99 29,969.41
Liability
Current Liabilities
21 - Accounts Payable
21100 - Accounts Payable - Trade 0.00222,679.42 -222,679.42
21150 - Accounts Payable - Unclaimed Property 1,447.611,447.61 0.00
Total 21 - Accounts Payable 1,447.61224,127.03 -222,679.42
22 - Accrrued Payable
22150 - Accrued Interest Payable 0.00154,627.05 -154,627.05
22210 - Deferred Revenue -1,155.2431,561.34 -32,716.58
Total 22 - Accrrued Payable -1,155.24186,188.39 -187,343.63
23 - Deposit
23310 - Customer Deposits 5,000.005,000.00 0.00
41
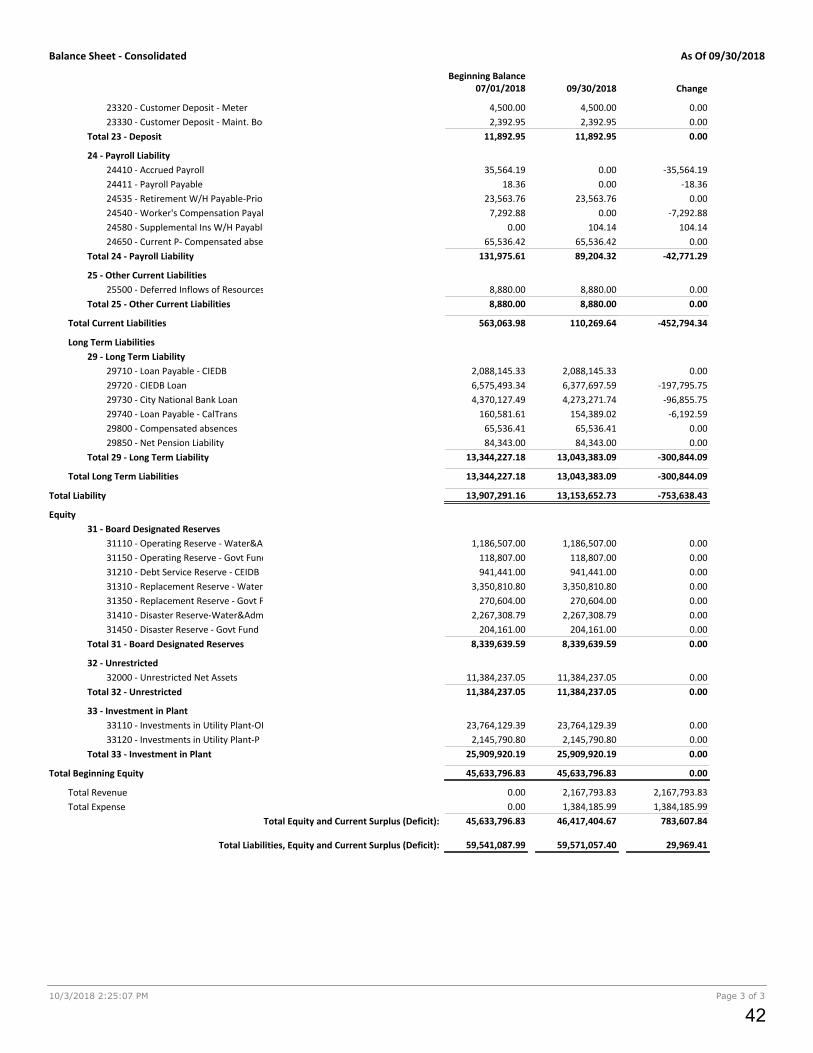
Balance Sheet - Consolidated As Of 09/30/2018
10/3/2018 2:25:07 PM Page 3 of 3
09/30/2018Beginning Balance
07/01/2018 Change
23320 - Customer Deposit - Meter 4,500.004,500.00 0.00
23330 - Customer Deposit - Maint. Bond 2,392.952,392.95 0.00
Total 23 - Deposit 11,892.9511,892.95 0.00
24 - Payroll Liability
24410 - Accrued Payroll 0.0035,564.19 -35,564.19
24411 - Payroll Payable 0.0018.36 -18.36
24535 - Retirement W/H Payable-Prior 23,563.7623,563.76 0.00
24540 - Worker's Compensation Payable 0.007,292.88 -7,292.88
24580 - Supplemental Ins W/H Payable 104.140.00 104.14
24650 - Current P- Compensated absences 65,536.4265,536.42 0.00
Total 24 - Payroll Liability 89,204.32131,975.61 -42,771.29
25 - Other Current Liabilities
25500 - Deferred Inflows of Resources 8,880.008,880.00 0.00
Total 25 - Other Current Liabilities 8,880.008,880.00 0.00
Total Current Liabilities 110,269.64563,063.98 -452,794.34
Long Term Liabilities
29 - Long Term Liability
29710 - Loan Payable - CIEDB 2,088,145.332,088,145.33 0.00
29720 - CIEDB Loan 6,377,697.596,575,493.34 -197,795.75
29730 - City National Bank Loan 4,273,271.744,370,127.49 -96,855.75
29740 - Loan Payable - CalTrans 154,389.02160,581.61 -6,192.59
29800 - Compensated absences 65,536.4165,536.41 0.00
29850 - Net Pension Liability 84,343.0084,343.00 0.00
Total 29 - Long Term Liability 13,043,383.0913,344,227.18 -300,844.09
Total Long Term Liabilities 13,043,383.0913,344,227.18 -300,844.09
Total Liability 13,153,652.7313,907,291.16 -753,638.43
Equity
31 - Board Designated Reserves
31110 - Operating Reserve - Water&Adm 1,186,507.001,186,507.00 0.00
31150 - Operating Reserve - Govt Fund 118,807.00118,807.00 0.00
31210 - Debt Service Reserve - CEIDB 941,441.00941,441.00 0.00
31310 - Replacement Reserve - Water&Adm 3,350,810.803,350,810.80 0.00
31350 - Replacement Reserve - Govt Fund 270,604.00270,604.00 0.00
31410 - Disaster Reserve-Water&Adm 2,267,308.792,267,308.79 0.00
31450 - Disaster Reserve - Govt Fund 204,161.00204,161.00 0.00
Total 31 - Board Designated Reserves 8,339,639.598,339,639.59 0.00
32 - Unrestricted
32000 - Unrestricted Net Assets 11,384,237.0511,384,237.05 0.00
Total 32 - Unrestricted 11,384,237.0511,384,237.05 0.00
33 - Investment in Plant
33110 - Investments in Utility Plant-OP 23,764,129.3923,764,129.39 0.00
33120 - Investments in Utility Plant-P 2,145,790.802,145,790.80 0.00
Total 33 - Investment in Plant 25,909,920.1925,909,920.19 0.00
Total Beginning Equity 45,633,796.8345,633,796.83 0.00
2,167,793.83Total Revenue 0.00 2,167,793.83
1,384,185.99Total Expense 0.00 1,384,185.99
Total Liabilities, Equity and Current Surplus (Deficit):
Total Equity and Current Surplus (Deficit): 46,417,404.67
59,571,057.40
45,633,796.83
59,541,087.99
783,607.84
29,969.41
42

10/3/2018 2:26:26 PM Page 1 of 8
Revenue and Expense - ConsolidatedPhelan Pinon Hills Community Services District Summary
For the Period Ending 09/30/2018
SepBudget $ (Unfav) Budget
CURRENT
YTD Budget Jul - Sep $ (Unfav) Budget Annual Budget 25.00%
YEAR TO DATE
Operational
Revenue
Total 40 - Water Consumption 284,910.68 317,610.62 32,699.94 1,159,389.44 67,013.401,092,376.04 3,045,580.90 38.07 % 2.20 %
Total 41 - Water Meter Charges 176,123.71 178,658.86 2,535.15 534,996.89 6,936.86528,060.03 2,118,100.42 25.26 % 0.33 %
Total 45 - Meter Installation/Fees/Connection 44,733.35 40,995.76 -3,737.59 95,867.99 -38,332.06134,200.05 537,015.21 17.85 % -7.14 %
Total 47 - Parks 2,203.80 2,847.50 643.70 7,180.00 568.606,611.40 26,456.25 27.14 % 2.15 %
Total 48 - Other Income 32,188.04 37,557.66 5,369.62 74,199.22 -22,364.9096,564.12 386,411.29 19.20 % -5.79 %
540,159.58 577,670.40 37,510.82 1,871,633.54 13,821.901,857,811.64 6,113,564.07 30.61 % 0.23 %Total Revenue
Expense
Total 50 - Water 3,502.99 0.00 3,502.99 569.93 3,116.323,686.25 10,937.97 5.21 % 28.49 %
Total 51 - Salary & Benefits 204,596.40 90,620.37 113,976.03 488,588.44 125,200.76613,789.20 2,456,144.71 19.89 % 5.10 %
Total 52 - Board 9,030.65 1,759.00 7,271.65 8,434.43 18,657.5227,091.95 108,412.17 7.78 % 17.21 %
Total 53 - Professional Fee 31,705.92 30,744.44 961.48 54,925.90 40,191.8695,117.76 380,624.37 14.43 % 10.56 %
Total 54 - Service and Supplies 145,477.46 87,431.29 58,046.17 160,428.77 277,757.64438,186.41 1,763,734.88 9.10 % 15.75 %
Total 58 - Utilities 24,114.62 67,300.67 -43,186.05 156,792.11 -83,468.0973,324.02 288,989.40 54.26 % -28.88 %
Total 59 - Other Expenses-Depreciation/Amort/Other 173,673.70 161,702.59 11,971.11 483,401.89 37,619.21521,021.10 2,087,915.04 23.15 % 1.80 %
592,101.74 439,558.36 152,543.38 1,353,141.47 419,075.221,772,216.69 7,096,758.54 19.07 % 5.91 %Total Expense
Net Operational Income -51,942.16 138,112.04 190,054.20 518,492.07 432,897.1285,594.95 -983,194.47 -52.74 % -44.03 %
Non-Operational
70 - Property Tax Revenue
Total 71 - Property Tax Revenue - Current 0.00 0.00 0.00 0.00 0.000.00 1,073,896.30 0.00 % 0.00 %
Total 72 - Property Tax Revenue - Prior Years 0.00 0.00 0.00 0.00 0.000.00 30,176.19 0.00 % 0.00 %
Total 73 - Property Tax Revenue - Other 0.00 0.00 0.00 0.00 0.000.00 29,797.09 0.00 % 0.00 %
Total 74 - Special Assessments 0.00 0.00 0.00 0.00 0.000.00 294,640.30 0.00 % 0.00 %
Total 70 - Property Tax Revenue 0.00 0.00 0.00 0.00 0.000.00 1,428,509.88 0.00 % 0.00 %
80 - Other Revenue
Total 86 - Penalty & Other Fees 12,786.85 11,879.63 -907.22 31,238.15 -6,210.9137,449.06 116,618.14 26.79 % -5.33 %
Total 88 - Other 116,033.06 88,382.02 -27,651.04 264,922.14 -83,177.04348,099.18 1,392,954.40 19.02 % -5.97 %
Total 80 - Other Revenue 128,819.91 100,261.65 -28,558.26 296,160.29 -89,387.95385,548.24 1,509,572.54 19.62 % -5.92 %
128,819.91 100,261.65 -28,558.26 296,160.29 -89,387.95385,548.24 2,938,082.42 10.08 % -3.04 %Total Revenue
43

10/3/2018 2:26:26 PM Page 2 of 8
SepBudget $ (Unfav) Budget
CURRENT
YTD Budget Jul - Sep $ (Unfav) Budget Annual Budget 25.00%
YEAR TO DATE
90 - Other Expense
Total 91 - Interest Expense 30,713.31 422.80 30,290.51 31,348.21 60,791.7292,139.93 368,707.32 8.50 % 16.49 %
Total 92 - Loan Expense 2,165.04 0.00 2,165.04 19,726.48 -13,231.366,495.12 25,990.92 75.90 % -50.91 %
Total 93 - Other Expense - Tax Processing 208.33 0.00 208.33 0.00 624.99624.99 2,500.97 0.00 % 24.99 %
Total 94 - Other Expense - CIP 66,479.04 0.00 66,479.04 0.00 199,437.12199,437.12 798,067.77 0.00 % 24.99 %
Total 95 - Fair Market Value -1,180.45 0.00 -1,180.45 -20,030.17 16,488.82-3,541.35 -14,171.13 141.34 % -116.36 %
Total 99 - Other 0.00 0.00 0.00 0.00 0.000.00 0.00 0.00 % 0.00 %
Total 90 - Other Expense 98,385.27 422.80 97,962.47 31,044.52 264,111.29295,155.81 1,181,095.85 2.63 % 22.36 %
98,385.27 422.80 97,962.47 31,044.52 264,111.29295,155.81 1,181,095.85 2.63 % 22.36 %Total Expense
Net Non-Operational Income 30,434.64 99,838.85 69,404.21 265,115.77 174,723.3490,392.43 1,756,986.57 15.09 % 9.94 %
Net Income -21,507.52 237,950.89 259,458.41 783,607.84 607,620.46175,987.38 773,792.10 101.27 % 78.53 %
44

10/3/2018 2:26:26 PM Page 3 of 8
Revenue and Expense - ConsolidatedPhelan Pinon Hills Community Services District Detail
For the Period Ending 09/30/2018
SepBudget $ (Unfav) Budget
CURRENT
YTD Budget Jul - Sep $ (Unfav) Budget Annual Budget
YEAR TO DATE
25.00%
Operational
Operational Revenue
40 - Water Consumption
251,152.83 272,795.70 21,642.87 993,779.91 34,170.23959,609.68 2,680,441.53 37.08 % 1.27 %40010 - Water Sales - Residential - C
1,825.47 4,760.01 2,934.54 22,534.01 16,132.026,401.99 17,188.76 131.10 % 93.85 %40020 - Water Sales - Commercial - C
288.03 0.00 -288.03 0.00 -781.79781.79 2,267.96 0.00 % -34.47 %40030 - Water Sales - Fire Protection-C
219.08 198.42 -20.66 631.08 -100.35731.43 2,619.87 24.09 % -3.83 %40060 - Water Sales - Multiple Res - C
25,956.64 37,070.67 11,114.03 135,705.10 29,885.14105,819.96 277,374.46 48.92 % 10.77 %40070 - Water Sales - School - C
5,468.63 1,787.94 -3,680.69 5,229.84 -13,801.3519,031.19 58,672.29 8.91 % -23.52 %40090 - Water Sales - Construction - C
0.00 997.88 997.88 1,509.50 1,509.500.00 7,016.03 21.52 % 21.52 %40095 - Water Sales - Construction Non Potable- C
Total 40 - Water Consumption 284,910.68 317,610.62 32,699.94 1,159,389.44 67,013.401,092,376.04 3,045,580.90 38.07 % 2.20 %
41 - Water Meter Charges
171,953.07 173,151.73 1,198.66 519,216.02 3,667.91515,548.11 2,068,032.57 25.11 % 0.18 %41010 - Water Sales - Residential - M
1,206.34 1,430.88 224.54 3,844.22 225.203,619.02 14,481.90 26.54 % 1.56 %41020 - Water Sales - Commercial - M
0.00 189.00 189.00 567.00 567.000.00 0.00 0.00 % 0.00 %41030 - Water Sales - Fire Protection-M
192.80 192.95 0.15 578.85 0.45578.40 2,314.53 25.01 % 0.02 %41060 - Water Sales - Multiple Res - M
2,177.92 2,453.68 275.76 7,018.78 485.026,533.76 26,145.50 26.85 % 1.86 %41070 - Water Sales - School - M
593.58 1,240.62 647.04 3,772.02 1,991.281,780.74 7,125.92 52.93 % 27.94 %41090 - Water Sales - Construction - M
Total 41 - Water Meter Charges 176,123.71 178,658.86 2,535.15 534,996.89 6,936.86528,060.03 2,118,100.42 25.26 % 0.33 %
45 - Meter Installation/Fees/Connection
8,066.18 6,341.02 -1,725.16 20,028.66 -4,169.8824,198.54 96,833.00 20.68 % -4.31 %45300 - Meter Installation
303.96 300.00 -3.96 1,545.00 633.12911.88 3,649.05 42.34 % 17.35 %45400 - Permits & Inspections
36,363.21 34,354.74 -2,008.47 74,294.33 -34,795.30109,089.63 436,533.16 17.02 % -7.97 %45500 - Connection Fee
Total 45 - Meter Installation/Fees/Connection 44,733.35 40,995.76 -3,737.59 95,867.99 -38,332.06134,200.05 537,015.21 17.85 % -7.14 %
47 - Parks
2,203.80 2,847.50 643.70 7,180.00 568.606,611.40 26,456.25 27.14 % 2.15 %47600 - Park & Recreation Fee
Total 47 - Parks 2,203.80 2,847.50 643.70 7,180.00 568.606,611.40 26,456.25 27.14 % 2.15 %
48 - Other Income
12,233.61 7,491.88 -4,741.73 34,400.94 -2,299.8936,700.83 146,862.10 23.42 % -1.57 %48200 - Other Services Incomes
15,407.44 25,581.78 10,174.34 25,581.78 -20,640.5446,222.32 184,963.32 13.83 % -11.16 %48500 - Solid Waste Income
45

10/3/2018 2:26:26 PM Page 4 of 8
SepBudget $ (Unfav) Budget
CURRENT
YTD Budget Jul - Sep $ (Unfav) Budget Annual Budget
YEAR TO DATE
25.00%
4,546.99 4,484.00 -62.99 14,216.50 575.5313,640.97 54,585.87 26.04 % 1.05 %48700 - Administrative Fees
Total 48 - Other Income 32,188.04 37,557.66 5,369.62 74,199.22 -22,364.9096,564.12 386,411.29 19.20 % -5.79 %
Total Operational Revenue 540,159.58 577,670.40 37,510.82 1,871,633.54 13,821.901,857,811.64 6,113,564.07 30.61 % 0.23 %
Operational Expense
50 - Water
3,411.36 0.00 3,411.36 569.93 2,841.433,411.36 9,837.97 5.79 % 28.88 %50010 - MWA WM Admin. & Bio Fee
91.63 0.00 91.63 0.00 274.89274.89 1,100.00 0.00 % 24.99 %50020 - MWA WM Make Up Water
Total 50 - Water 3,502.99 0.00 3,502.99 569.93 3,116.323,686.25 10,937.97 5.21 % 28.49 %
51 - Salary & Benefits
121,701.42 45,085.47 76,615.95 285,399.11 79,705.15365,104.26 1,461,002.16 19.53 % 5.46 %51110 - Salaries & Wages
7,708.89 4,676.59 3,032.30 13,340.26 9,786.4123,126.67 92,544.14 14.42 % 10.57 %51120 - Vacations
5,604.66 5,628.65 -23.99 11,507.56 5,306.4216,813.98 67,283.44 17.10 % 7.89 %51130 - Holiday
6,114.19 883.58 5,230.61 5,090.58 13,251.9918,342.57 73,400.11 6.94 % 18.05 %51140 - Sick Pay
5,498.90 4,553.41 945.49 17,012.93 -516.2316,496.70 66,013.49 25.77 % -0.78 %51150 - Misc Earn
9,480.13 5,430.38 4,049.75 36,162.01 -7,721.6228,440.39 113,807.65 31.77 % -6.78 %51170 - Overtime
3,538.05 1,157.59 2,380.46 5,859.36 4,754.7910,614.15 42,474.26 13.80 % 11.19 %51210 - Payroll Taxes
3,542.76 3,293.60 249.16 3,947.51 6,680.7710,628.28 42,530.16 9.28 % 15.71 %51220 - Worker's Compensation
24,865.90 12,226.47 12,639.43 68,939.07 5,658.6374,597.70 298,511.04 23.09 % 1.90 %51230 - Employee Group Insurance
16,541.50 7,690.04 8,851.46 41,345.73 8,278.7749,624.50 198,578.26 20.82 % 4.17 %51240 - Retirement
0.00 -5.41 5.41 -15.68 15.680.00 0.00 0.00 % 0.00 %51290 - Contra Benes (towards projects)
Total 51 - Salary & Benefits 204,596.40 90,620.37 113,976.03 488,588.44 125,200.76613,789.20 2,456,144.71 19.89 % 5.10 %
52 - Board
3,501.07 660.00 2,841.07 1,459.69 9,043.5210,503.21 42,030.00 3.47 % 21.52 %52110 - Board Director's Fee
-21.92 0.00 -21.92 0.00 -65.76-65.76 -263.23 0.00 % 24.98 %52210 - Board Exp - Auto Expense
85.23 0.00 85.23 136.73 118.96255.69 1,023.17 13.36 % 11.63 %52211 - Board - Auto Expense/Brandon
73.50 0.00 73.50 0.00 220.50220.50 882.43 0.00 % 24.99 %52214 - Board - Auto Expense/Morrissette
58.35 0.00 58.35 0.00 175.05175.05 700.50 0.00 % 24.99 %52215 - Board - Auto Expense/Roberts
44.37 0.00 44.37 0.00 133.11133.11 532.75 0.00 % 24.99 %52216 - Board-Auto Expense/Pace
78.93 0.00 78.93 0.00 236.79236.79 947.54 0.00 % 24.99 %52217 - Board-Auto Expense/Whalen
438.15 0.00 438.15 0.00 1,314.451,314.45 5,259.91 0.00 % 24.99 %52221 - Board - Meals,Travel Expenses/Brandon
151.49 0.00 151.49 0.00 454.47454.47 1,818.63 0.00 % 24.99 %52224 - Board - Meals,Travel Expenses/Morrissette
317.03 0.00 317.03 0.00 951.09951.09 3,805.92 0.00 % 24.99 %52225 - Board - Meals,Travel Expenses/Roberts
176.37 0.00 176.37 0.00 529.11529.11 2,117.38 0.00 % 24.99 %52226 - Board-Meals,Travel Expenses/Pace
73.46 0.00 73.46 0.00 220.38220.38 881.89 0.00 % 24.99 %52227 - Board-Meals,Travel Expenses/Whalen
7.98 0.00 7.98 0.00 23.9423.94 95.92 0.00 % 24.96 %52231 - Board - Education,Training/Brandon
-40.20 0.00 -40.20 32.00 -152.60-120.60 -482.63 -6.63 % 31.62 %52234 - Board - Education,Training/Morrissette
105.26 1,099.00 -993.74 1,099.00 -783.22315.78 1,263.68 86.97 % -61.98 %52235 - Board - Education,Training/Roberts
170.15 0.00 170.15 0.00 510.45510.45 2,042.63 0.00 % 24.99 %52236 - Board-Education,Training/Pace
46

10/3/2018 2:26:26 PM Page 5 of 8
SepBudget $ (Unfav) Budget
CURRENT
YTD Budget Jul - Sep $ (Unfav) Budget Annual Budget
YEAR TO DATE
25.00%
3,811.43 0.00 3,811.43 5,707.01 5,727.2811,434.29 45,755.68 12.47 % 12.52 %52240 - Board Expense - Insurance
Total 52 - Board 9,030.65 1,759.00 7,271.65 8,434.43 18,657.5227,091.95 108,412.17 7.78 % 17.21 %
53 - Professional Fee
1,680.00 7,274.00 -5,594.00 7,274.00 -2,234.005,040.00 20,168.26 36.07 % -11.08 %53110 - Auditing & Accounting Fees
9,646.63 6,957.88 2,688.75 18,136.63 10,803.2628,939.89 115,806.08 15.66 % 9.33 %53120 - Legal Services
24.99 0.00 24.99 0.00 74.9774.97 300.00 0.00 % 24.99 %53130 - Engineering
1,082.90 935.50 147.40 1,223.50 2,025.203,248.70 13,000.00 9.41 % 15.58 %53140 - Laboratory Analysis
8,044.86 10,423.33 -2,378.47 11,923.42 12,211.1624,134.58 96,577.20 12.35 % 12.64 %53150 - Outside Service
3,065.82 0.00 3,065.82 1,772.00 7,425.469,197.46 36,804.82 4.81 % 20.18 %53160 - Permits & Fees
8,160.72 5,153.73 3,006.99 14,596.35 9,885.8124,482.16 97,968.01 14.90 % 10.09 %53170 - Software Support
Total 53 - Professional Fee 31,705.92 30,744.44 961.48 54,925.90 40,191.8695,117.76 380,624.37 14.43 % 10.56 %
54 - Service and Supplies
810.06 118.80 691.26 2,113.36 316.822,430.18 9,724.67 21.73 % 3.26 %54110 - Advertising
273.21 240.52 32.69 664.52 155.11819.63 3,280.02 20.26 % 4.73 %54140 - Auto Expense
649.74 325.00 324.74 1,631.61 317.611,949.22 7,800.00 20.92 % 4.07 %54170 - Auto Allowance
3,880.09 4,276.52 -396.43 12,432.96 -792.6911,640.27 46,579.93 26.69 % -1.70 %54200 - Credit Card Fee & Bank Charges
156.43 2,618.28 -2,461.85 4,620.28 -2,396.962,223.32 19,180.23 24.09 % -12.50 %54230 - Dues & Subscriptions
2,726.29 1,255.00 1,471.29 1,555.00 6,623.878,178.87 32,728.67 4.75 % 20.24 %54260 - Education & Training
131.77 540.00 -408.23 603.00 -207.69395.31 1,581.88 38.12 % -13.13 %54290 - Employment Expense
1,050.50 5,676.10 -4,625.60 5,960.19 -2,808.693,151.50 12,611.36 47.26 % -22.27 %54300 - Equipment Rental / Lease
464.99 380.00 84.99 1,550.00 -155.031,394.97 5,582.28 27.77 % -2.78 %54320 - General Maintenance
7,082.71 7,278.84 -196.13 21,836.52 -588.3921,248.13 85,026.58 25.68 % -0.69 %54350 - Insurance
1,702.90 1,624.51 78.39 4,873.53 235.175,108.70 20,443.05 23.84 % 1.15 %54380 - Insurance - Vehicle
4,410.18 9,175.46 -4,765.28 16,392.97 -3,162.4313,230.54 52,943.45 30.96 % -5.97 %54410 - Fuel Costs
510.69 296.32 214.37 163.20 1,368.871,532.07 6,131.06 2.66 % 22.33 %54440 - Meeting, Seminar & Supplies
2,287.21 855.53 1,431.68 5,814.78 1,046.856,861.63 27,457.67 21.18 % 3.81 %54470 - Travel Expense
9,051.41 6,226.94 2,824.47 12,599.70 14,554.5327,154.23 108,660.92 11.60 % 13.39 %54500 - Operating Supplies
2,225.14 2,728.73 -503.59 5,154.07 1,521.356,675.42 26,712.86 19.29 % 5.70 %54530 - Office Supplies
80,322.77 14,212.86 66,109.91 10,742.12 230,226.19240,968.31 964,259.06 1.11 % 23.88 %54620 - Repair & Maintenance
1,892.25 3,151.03 -1,258.78 3,493.04 2,183.715,676.75 22,716.27 15.38 % 9.61 %54650 - Small Tools
935.53 875.22 60.31 1,712.56 1,094.032,806.59 11,231.20 15.25 % 9.74 %54680 - Uniforms
3,928.66 8,375.19 -4,446.53 14,490.41 -2,704.4311,785.98 47,162.95 30.72 % -5.73 %54710 - Vehicle Maintenance
84.38 0.00 84.38 0.00 253.14253.14 1,013.04 0.00 % 24.99 %54740 - Easement Lease
518.08 0.00 518.08 0.00 1,554.241,554.24 6,219.59 0.00 % 24.99 %54770 - Computer & Equip Maintenance
6,684.37 931.39 5,752.98 1,539.51 18,513.6020,053.11 80,244.70 1.92 % 23.07 %54800 - Programs (Wtr Conservation, Parks, etc)
1,764.37 1,894.74 -130.37 2,774.23 2,518.885,293.11 21,180.94 13.10 % 11.89 %54801 - Senior Lunch Program
1,715.44 1,224.29 491.15 3,075.29 2,071.035,146.32 20,593.62 14.93 % 10.06 %54802 - Farmer's Market
16.58 61.20 -44.62 180.00 -130.2649.74 199.14 90.39 % -65.41 %54804 - Farmers Market MM Program
3,112.17 160.00 2,952.17 10,526.60 -1,190.099,336.51 37,361.07 28.18 % -3.19 %54830 - State & County Fees & Services
3,838.78 9,130.12 -5,291.34 10,045.02 1,471.3211,516.34 46,083.81 21.80 % 3.19 %54860 - Postage & Mailing
1,898.13 798.70 1,099.43 884.30 4,810.095,694.39 22,786.78 3.88 % 21.11 %54890 - Printing
47
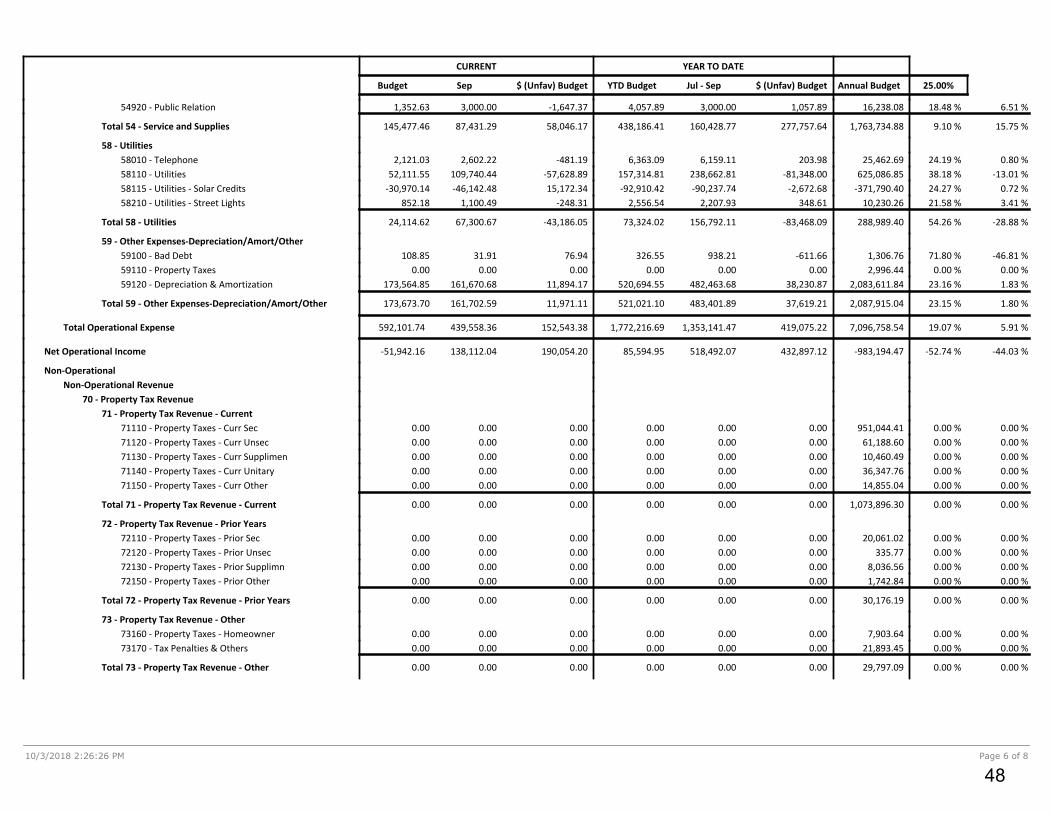
10/3/2018 2:26:26 PM Page 6 of 8
SepBudget $ (Unfav) Budget
CURRENT
YTD Budget Jul - Sep $ (Unfav) Budget Annual Budget
YEAR TO DATE
25.00%
1,352.63 3,000.00 -1,647.37 3,000.00 1,057.894,057.89 16,238.08 18.48 % 6.51 %54920 - Public Relation
Total 54 - Service and Supplies 145,477.46 87,431.29 58,046.17 160,428.77 277,757.64438,186.41 1,763,734.88 9.10 % 15.75 %
58 - Utilities
2,121.03 2,602.22 -481.19 6,159.11 203.986,363.09 25,462.69 24.19 % 0.80 %58010 - Telephone
52,111.55 109,740.44 -57,628.89 238,662.81 -81,348.00157,314.81 625,086.85 38.18 % -13.01 %58110 - Utilities
-30,970.14 -46,142.48 15,172.34 -90,237.74 -2,672.68-92,910.42 -371,790.40 24.27 % 0.72 %58115 - Utilities - Solar Credits
852.18 1,100.49 -248.31 2,207.93 348.612,556.54 10,230.26 21.58 % 3.41 %58210 - Utilities - Street Lights
Total 58 - Utilities 24,114.62 67,300.67 -43,186.05 156,792.11 -83,468.0973,324.02 288,989.40 54.26 % -28.88 %
59 - Other Expenses-Depreciation/Amort/Other
108.85 31.91 76.94 938.21 -611.66326.55 1,306.76 71.80 % -46.81 %59100 - Bad Debt
0.00 0.00 0.00 0.00 0.000.00 2,996.44 0.00 % 0.00 %59110 - Property Taxes
173,564.85 161,670.68 11,894.17 482,463.68 38,230.87520,694.55 2,083,611.84 23.16 % 1.83 %59120 - Depreciation & Amortization
Total 59 - Other Expenses-Depreciation/Amort/Other 173,673.70 161,702.59 11,971.11 483,401.89 37,619.21521,021.10 2,087,915.04 23.15 % 1.80 %
Total Operational Expense 592,101.74 439,558.36 152,543.38 1,353,141.47 419,075.221,772,216.69 7,096,758.54 19.07 % 5.91 %
Net Operational Income -51,942.16 138,112.04 190,054.20 518,492.07 432,897.1285,594.95 -983,194.47 -52.74 % -44.03 %
Non-Operational
Non-Operational Revenue
70 - Property Tax Revenue
71 - Property Tax Revenue - Current
0.00 0.00 0.00 0.00 0.000.00 951,044.41 0.00 % 0.00 %71110 - Property Taxes - Curr Sec
0.00 0.00 0.00 0.00 0.000.00 61,188.60 0.00 % 0.00 %71120 - Property Taxes - Curr Unsec
0.00 0.00 0.00 0.00 0.000.00 10,460.49 0.00 % 0.00 %71130 - Property Taxes - Curr Supplimen
0.00 0.00 0.00 0.00 0.000.00 36,347.76 0.00 % 0.00 %71140 - Property Taxes - Curr Unitary
0.00 0.00 0.00 0.00 0.000.00 14,855.04 0.00 % 0.00 %71150 - Property Taxes - Curr Other
Total 71 - Property Tax Revenue - Current 0.00 0.00 0.00 0.00 0.000.00 1,073,896.30 0.00 % 0.00 %
72 - Property Tax Revenue - Prior Years
0.00 0.00 0.00 0.00 0.000.00 20,061.02 0.00 % 0.00 %72110 - Property Taxes - Prior Sec
0.00 0.00 0.00 0.00 0.000.00 335.77 0.00 % 0.00 %72120 - Property Taxes - Prior Unsec
0.00 0.00 0.00 0.00 0.000.00 8,036.56 0.00 % 0.00 %72130 - Property Taxes - Prior Supplimn
0.00 0.00 0.00 0.00 0.000.00 1,742.84 0.00 % 0.00 %72150 - Property Taxes - Prior Other
Total 72 - Property Tax Revenue - Prior Years 0.00 0.00 0.00 0.00 0.000.00 30,176.19 0.00 % 0.00 %
73 - Property Tax Revenue - Other
0.00 0.00 0.00 0.00 0.000.00 7,903.64 0.00 % 0.00 %73160 - Property Taxes - Homeowner
0.00 0.00 0.00 0.00 0.000.00 21,893.45 0.00 % 0.00 %73170 - Tax Penalties & Others
Total 73 - Property Tax Revenue - Other 0.00 0.00 0.00 0.00 0.000.00 29,797.09 0.00 % 0.00 %
48
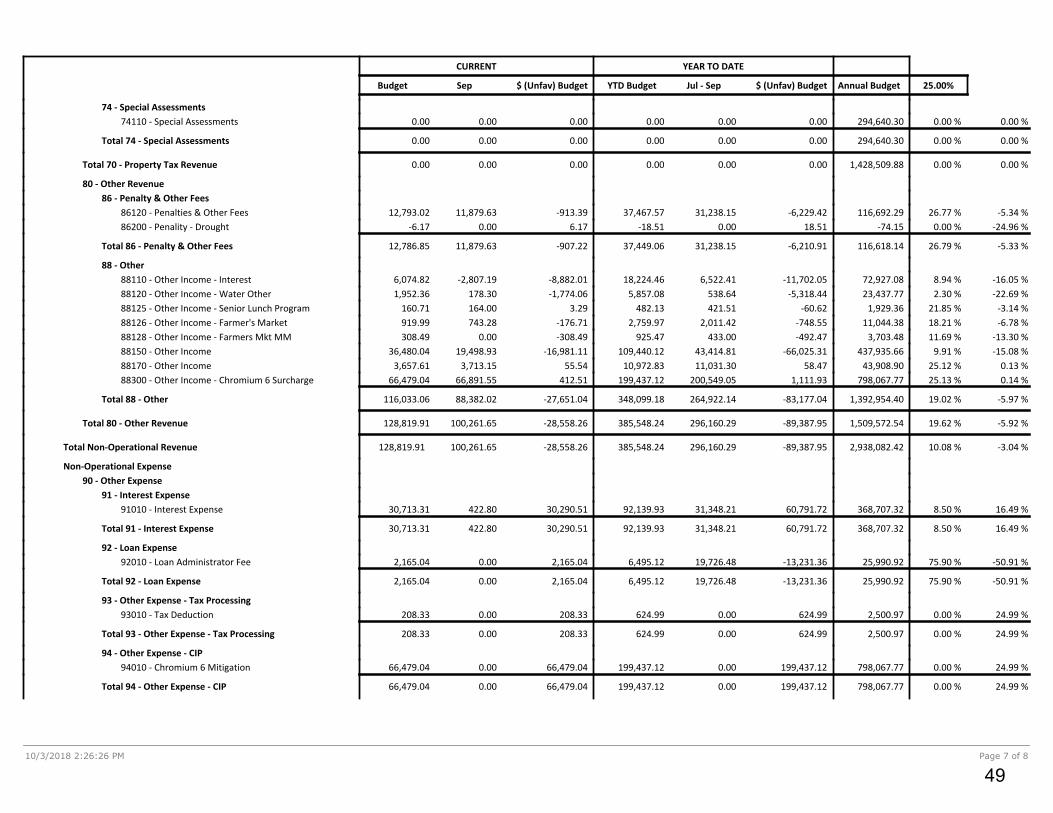
10/3/2018 2:26:26 PM Page 7 of 8
SepBudget $ (Unfav) Budget
CURRENT
YTD Budget Jul - Sep $ (Unfav) Budget Annual Budget
YEAR TO DATE
25.00%
74 - Special Assessments
0.00 0.00 0.00 0.00 0.000.00 294,640.30 0.00 % 0.00 %74110 - Special Assessments
Total 74 - Special Assessments 0.00 0.00 0.00 0.00 0.000.00 294,640.30 0.00 % 0.00 %
Total 70 - Property Tax Revenue 0.00 0.00 0.00 0.00 0.000.00 1,428,509.88 0.00 % 0.00 %
80 - Other Revenue
86 - Penalty & Other Fees
12,793.02 11,879.63 -913.39 31,238.15 -6,229.4237,467.57 116,692.29 26.77 % -5.34 %86120 - Penalties & Other Fees
-6.17 0.00 6.17 0.00 18.51-18.51 -74.15 0.00 % -24.96 %86200 - Penality - Drought
Total 86 - Penalty & Other Fees 12,786.85 11,879.63 -907.22 31,238.15 -6,210.9137,449.06 116,618.14 26.79 % -5.33 %
88 - Other
6,074.82 -2,807.19 -8,882.01 6,522.41 -11,702.0518,224.46 72,927.08 8.94 % -16.05 %88110 - Other Income - Interest
1,952.36 178.30 -1,774.06 538.64 -5,318.445,857.08 23,437.77 2.30 % -22.69 %88120 - Other Income - Water Other
160.71 164.00 3.29 421.51 -60.62482.13 1,929.36 21.85 % -3.14 %88125 - Other Income - Senior Lunch Program
919.99 743.28 -176.71 2,011.42 -748.552,759.97 11,044.38 18.21 % -6.78 %88126 - Other Income - Farmer's Market
308.49 0.00 -308.49 433.00 -492.47925.47 3,703.48 11.69 % -13.30 %88128 - Other Income - Farmers Mkt MM
36,480.04 19,498.93 -16,981.11 43,414.81 -66,025.31109,440.12 437,935.66 9.91 % -15.08 %88150 - Other Income
3,657.61 3,713.15 55.54 11,031.30 58.4710,972.83 43,908.90 25.12 % 0.13 %88170 - Other Income
66,479.04 66,891.55 412.51 200,549.05 1,111.93199,437.12 798,067.77 25.13 % 0.14 %88300 - Other Income - Chromium 6 Surcharge
Total 88 - Other 116,033.06 88,382.02 -27,651.04 264,922.14 -83,177.04348,099.18 1,392,954.40 19.02 % -5.97 %
Total 80 - Other Revenue 128,819.91 100,261.65 -28,558.26 296,160.29 -89,387.95385,548.24 1,509,572.54 19.62 % -5.92 %
Total Non-Operational Revenue 128,819.91 100,261.65 -28,558.26 296,160.29 -89,387.95385,548.24 2,938,082.42 10.08 % -3.04 %
Non-Operational Expense
90 - Other Expense
91 - Interest Expense
30,713.31 422.80 30,290.51 31,348.21 60,791.7292,139.93 368,707.32 8.50 % 16.49 %91010 - Interest Expense
Total 91 - Interest Expense 30,713.31 422.80 30,290.51 31,348.21 60,791.7292,139.93 368,707.32 8.50 % 16.49 %
92 - Loan Expense
2,165.04 0.00 2,165.04 19,726.48 -13,231.366,495.12 25,990.92 75.90 % -50.91 %92010 - Loan Administrator Fee
Total 92 - Loan Expense 2,165.04 0.00 2,165.04 19,726.48 -13,231.366,495.12 25,990.92 75.90 % -50.91 %
93 - Other Expense - Tax Processing
208.33 0.00 208.33 0.00 624.99624.99 2,500.97 0.00 % 24.99 %93010 - Tax Deduction
Total 93 - Other Expense - Tax Processing 208.33 0.00 208.33 0.00 624.99624.99 2,500.97 0.00 % 24.99 %
94 - Other Expense - CIP
66,479.04 0.00 66,479.04 0.00 199,437.12199,437.12 798,067.77 0.00 % 24.99 %94010 - Chromium 6 Mitigation
Total 94 - Other Expense - CIP 66,479.04 0.00 66,479.04 0.00 199,437.12199,437.12 798,067.77 0.00 % 24.99 %
49
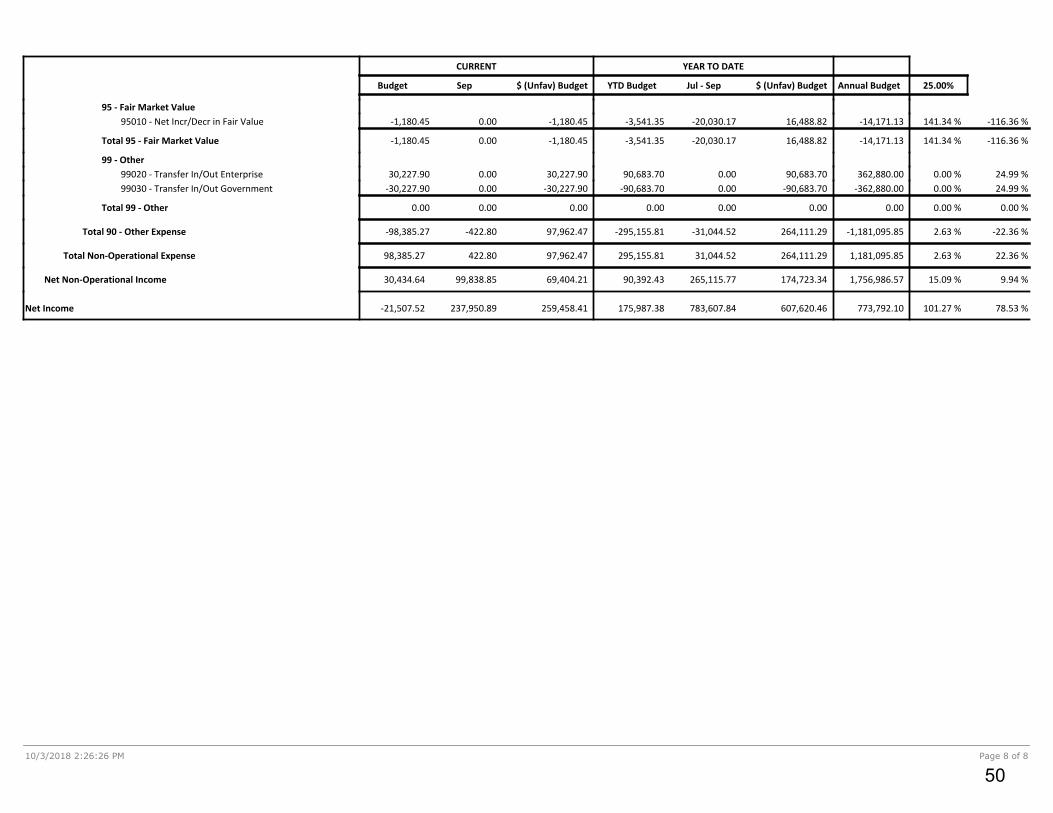
10/3/2018 2:26:26 PM Page 8 of 8
SepBudget $ (Unfav) Budget
CURRENT
YTD Budget Jul - Sep $ (Unfav) Budget Annual Budget
YEAR TO DATE
25.00%
95 - Fair Market Value
-1,180.45 0.00 -1,180.45 -20,030.17 16,488.82-3,541.35 -14,171.13 141.34 % -116.36 %95010 - Net Incr/Decr in Fair Value
Total 95 - Fair Market Value -1,180.45 0.00 -1,180.45 -20,030.17 16,488.82-3,541.35 -14,171.13 141.34 % -116.36 %
99 - Other
30,227.90 0.00 30,227.90 0.00 90,683.7090,683.70 362,880.00 0.00 % 24.99 %99020 - Transfer In/Out Enterprise
-30,227.90 0.00 -30,227.90 0.00 -90,683.70-90,683.70 -362,880.00 0.00 % 24.99 %99030 - Transfer In/Out Government
Total 99 - Other 0.00 0.00 0.00 0.00 0.000.00 0.00 0.00 % 0.00 %
Total 90 - Other Expense -98,385.27 -422.80 97,962.47 -31,044.52 264,111.29-295,155.81 -1,181,095.85 2.63 % -22.36 %
Total Non-Operational Expense 98,385.27 422.80 97,962.47 31,044.52 264,111.29295,155.81 1,181,095.85 2.63 % 22.36 %
Net Non-Operational Income 30,434.64 99,838.85 69,404.21 265,115.77 174,723.3490,392.43 1,756,986.57 15.09 % 9.94 %
Net Income -21,507.52 237,950.89 259,458.41 783,607.84 607,620.46175,987.38 773,792.10 101.27 % 78.53 %
50

10/3/2018 2:28:09 PM Page 1 of 6
Statement of Cash Flows - Phelan Pinon HillsPhelan Pinon Hills Community Services District 07/01/2018 - 09/30/2018
01 - ENTERPRISE FUND
Cash Flows From Operating Activities
2,117,526.15Total Revenue
1,281,792.20Total Expense
835,733.95Net Income
Adjustments to Net Income
Depr Amort Exp Accts - Depreciation & Amortization Expense Accounts 455,407.03
Net Income After Adjustments 1,291,140.98
Adjustments to reconcile Net Income to net cashprovided by Operating Activities
12010 - Accounts Receivable - Water -44,414.72
12150 - A/R - Accrual 37,586.57
12610 - Delinquent Accounts to Tax Roll 45,920.99
12910 - Accrued Interest Receivable-GF -49,381.78
13010 - Inventory - Water Field Parts 30,104.74
14100 - Prepaid Expense 1,103.08
14120 - Prepaid - Workers Comp -9,201.20
14130 - Prepaid Benefit 4,163.01
21100 - Accounts Payable - Trade 214,079.73
22150 - Accrued Interest Payable 154,627.05
22210 - Deferred Revenue 32,739.08
24410 - Accrued Payroll 32,360.75
24540 - Workers Comp Payable 7,292.88
24580 - Supplemental Ins Payable -104.14
Net cash provided by Operating Activities 834,264.94
Cash Flows From Investing Activities
16620 - Equipment - Computer -6,570.36
17000 - CIP -39,237.31
Net cash provided by Investing Activities -45,807.67
Cash Flows From Financing Activities
29720 - CIEDB Loan 2012 -197,795.75
29730 - City National Bank Loan 2014 -96,855.75
29740 - Loan Payable Cal Trans -6,192.59
Net cash provided by Financing Activities -300,844.09
Net Change in Cash 487,613.18
Beginning Cash Balance 8,160,012.98
8,647,626.16Ending Cash Balance
51

Statement of Cash Flows - Phelan Pinon Hills 07/01/2018 - 09/30/2018
10/3/2018 2:28:09 PM Page 2 of 6
20 - GOV'T GENERAL FUND
Cash Flows From Operating Activities
11,264.26Total Revenue
10,942.12Total Expense
322.14Net Income
Adjustments to Net Income
Depr Amort Exp Accts - Depreciation & Amortization Expense Accounts 9,178.01
Net Income After Adjustments 9,500.15
Adjustments to reconcile Net Income to net cashprovided by Operating Activities
21100 - Accounts Payable - Trade 716.59
Net cash provided by Operating Activities 8,783.56
Cash Flows From Investing Activities
17000 - CIP -8,945.25
Net cash provided by Investing Activities -8,945.25
Net Change in Cash -161.69
Beginning Cash Balance 459,710.48
459,548.79Ending Cash Balance
52

Statement of Cash Flows - Phelan Pinon Hills 07/01/2018 - 09/30/2018
10/3/2018 2:28:09 PM Page 3 of 6
22 - PARKS & RECREATION
Cash Flows From Operating Activities
13,127.02Total Revenue
83,876.48Total Expense
-70,749.46Net Income
Adjustments to Net Income
Depr Amort Exp Accts - Depreciation & Amortization Expense Accounts 17,878.64
Net Income After Adjustments -52,870.82
Adjustments to reconcile Net Income to net cashprovided by Operating Activities
12200 - Accounts Receivable - Gov't 1,372.50
21100 - Accounts Payable - Trade 6,787.40
22210 - Deferred Revenue -22.50
Net cash provided by Operating Activities -61,008.22
Cash Flows From Investing Activities
17000 - CIP -7,686.50
Net cash provided by Investing Activities -7,686.50
Net Change in Cash -68,694.72
Beginning Cash Balance 4,248,150.70
4,179,455.98Ending Cash Balance
53
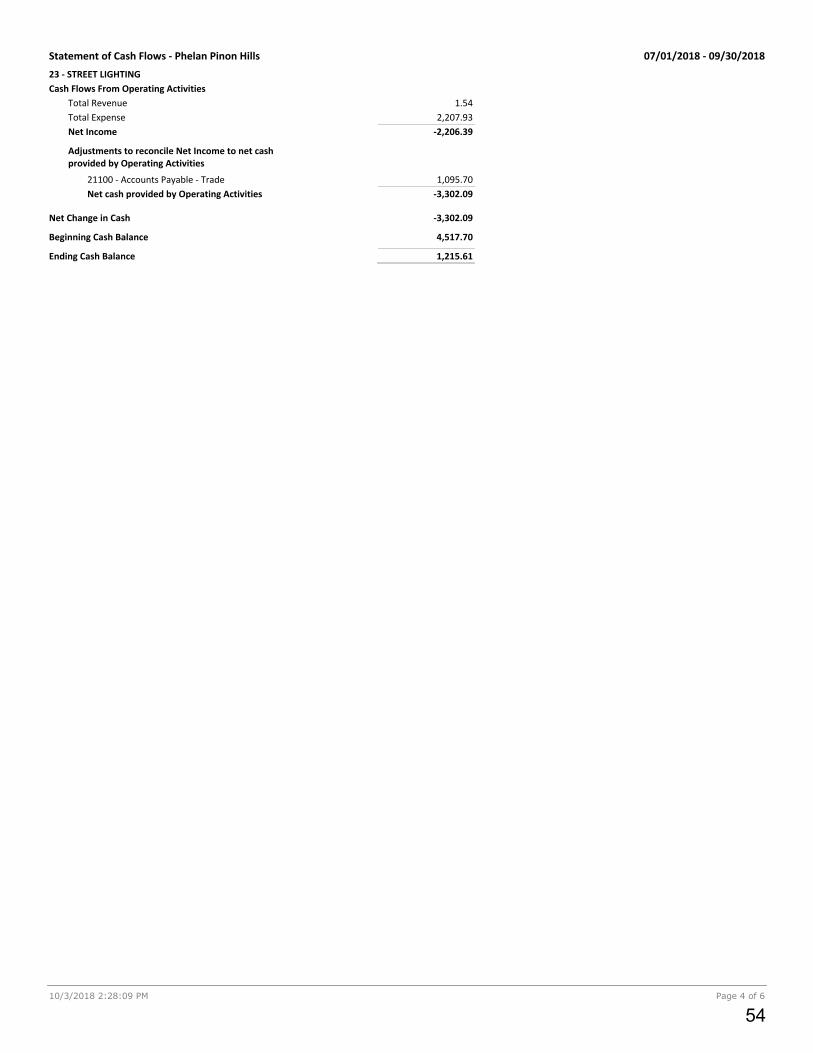
Statement of Cash Flows - Phelan Pinon Hills 07/01/2018 - 09/30/2018
10/3/2018 2:28:09 PM Page 4 of 6
23 - STREET LIGHTING
Cash Flows From Operating Activities
1.54Total Revenue
2,207.93Total Expense
-2,206.39Net Income
Adjustments to reconcile Net Income to net cashprovided by Operating Activities
21100 - Accounts Payable - Trade 1,095.70
Net cash provided by Operating Activities -3,302.09
Net Change in Cash -3,302.09
Beginning Cash Balance 4,517.70
1,215.61Ending Cash Balance
54

Statement of Cash Flows - Phelan Pinon Hills 07/01/2018 - 09/30/2018
10/3/2018 2:28:09 PM Page 5 of 6
24 - GOV'T PROPERTY TAX
Cash Flows From Operating Activities
262.84Total Revenue
262.84Net Income
Adjustments to reconcile Net Income to net cashprovided by Operating Activities
12710 - Tax Receivable - CSA 70L -783.60
12720 - Tax Receivable - CSA 9 0.23
12740 - Tax Receivable - PPHCSD -39,133.91
Net cash provided by Operating Activities 40,180.12
Net Change in Cash 40,180.12
Beginning Cash Balance 389,418.07
429,598.19Ending Cash Balance
55

Statement of Cash Flows - Phelan Pinon Hills 07/01/2018 - 09/30/2018
10/3/2018 2:28:09 PM Page 6 of 6
25 - SOLID WASTE
Cash Flows From Operating Activities
25,612.02Total Revenue
5,367.26Total Expense
20,244.76Net Income
Adjustments to reconcile Net Income to net cashprovided by Operating Activities
12200 - Accounts Receivable - Gov't -30,020.98
Net cash provided by Operating Activities 50,265.74
Net Change in Cash 50,265.74
Beginning Cash Balance 622.04
50,887.78Ending Cash Balance
56
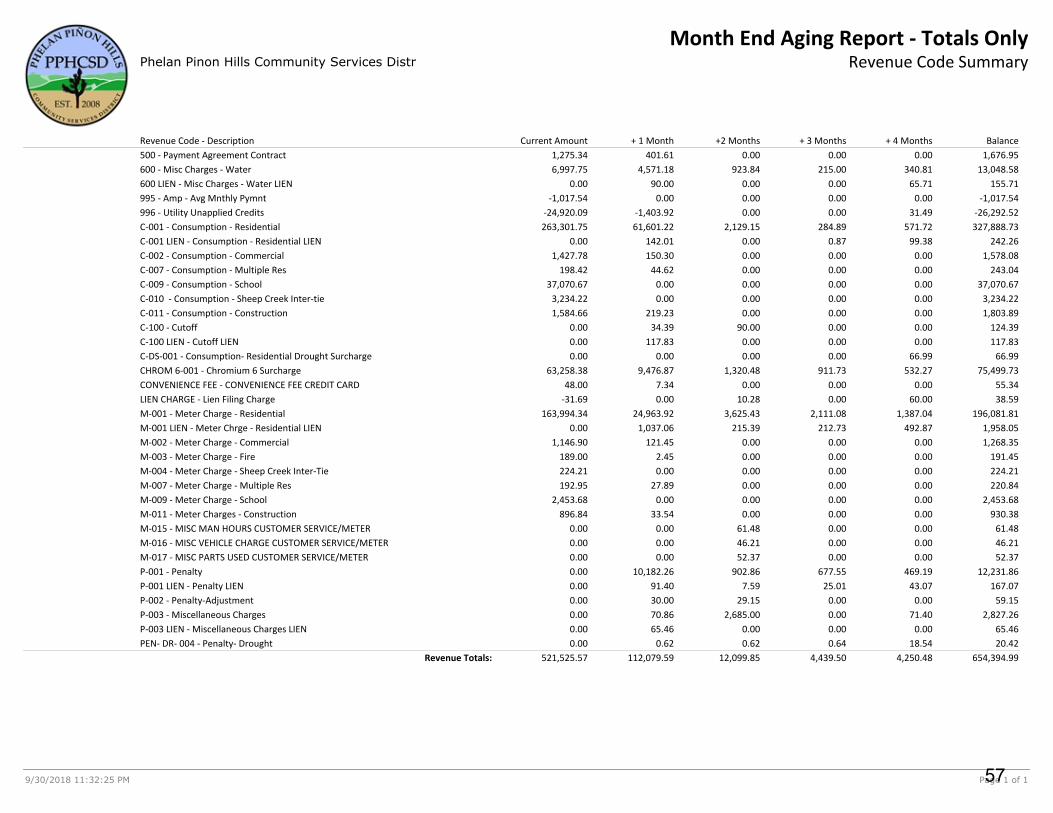
9/30/2018 11:32:25 PM Page 1 of 1
Month End Aging Report - Totals OnlyPhelan Pinon Hills Community Services District Revenue Code Summary
Current Amount + 1 Month + 3 Months + 4 Months Balance+2 MonthsRevenue Code - Description
1,275.34 401.61 0.00 0.00 0.00 1,676.95500 - Payment Agreement Contract
6,997.75 4,571.18 923.84 215.00 340.81 13,048.58600 - Misc Charges - Water
0.00 90.00 0.00 0.00 65.71 155.71600 LIEN - Misc Charges - Water LIEN
-1,017.54 0.00 0.00 0.00 0.00 -1,017.54995 - Amp - Avg Mnthly Pymnt
-24,920.09 -1,403.92 0.00 0.00 31.49 -26,292.52996 - Utility Unapplied Credits
263,301.75 61,601.22 2,129.15 284.89 571.72 327,888.73C-001 - Consumption - Residential
0.00 142.01 0.00 0.87 99.38 242.26C-001 LIEN - Consumption - Residential LIEN
1,427.78 150.30 0.00 0.00 0.00 1,578.08C-002 - Consumption - Commercial
198.42 44.62 0.00 0.00 0.00 243.04C-007 - Consumption - Multiple Res
37,070.67 0.00 0.00 0.00 0.00 37,070.67C-009 - Consumption - School
3,234.22 0.00 0.00 0.00 0.00 3,234.22C-010 - Consumption - Sheep Creek Inter-tie
1,584.66 219.23 0.00 0.00 0.00 1,803.89C-011 - Consumption - Construction
0.00 34.39 90.00 0.00 0.00 124.39C-100 - Cutoff
0.00 117.83 0.00 0.00 0.00 117.83C-100 LIEN - Cutoff LIEN
0.00 0.00 0.00 0.00 66.99 66.99C-DS-001 - Consumption- Residential Drought Surcharge
63,258.38 9,476.87 1,320.48 911.73 532.27 75,499.73CHROM 6-001 - Chromium 6 Surcharge
48.00 7.34 0.00 0.00 0.00 55.34CONVENIENCE FEE - CONVENIENCE FEE CREDIT CARD
-31.69 0.00 10.28 0.00 60.00 38.59LIEN CHARGE - Lien Filing Charge
163,994.34 24,963.92 3,625.43 2,111.08 1,387.04 196,081.81M-001 - Meter Charge - Residential
0.00 1,037.06 215.39 212.73 492.87 1,958.05M-001 LIEN - Meter Chrge - Residential LIEN
1,146.90 121.45 0.00 0.00 0.00 1,268.35M-002 - Meter Charge - Commercial
189.00 2.45 0.00 0.00 0.00 191.45M-003 - Meter Charge - Fire
224.21 0.00 0.00 0.00 0.00 224.21M-004 - Meter Charge - Sheep Creek Inter-Tie
192.95 27.89 0.00 0.00 0.00 220.84M-007 - Meter Charge - Multiple Res
2,453.68 0.00 0.00 0.00 0.00 2,453.68M-009 - Meter Charge - School
896.84 33.54 0.00 0.00 0.00 930.38M-011 - Meter Charges - Construction
0.00 0.00 61.48 0.00 0.00 61.48M-015 - MISC MAN HOURS CUSTOMER SERVICE/METER
0.00 0.00 46.21 0.00 0.00 46.21M-016 - MISC VEHICLE CHARGE CUSTOMER SERVICE/METER
0.00 0.00 52.37 0.00 0.00 52.37M-017 - MISC PARTS USED CUSTOMER SERVICE/METER
0.00 10,182.26 902.86 677.55 469.19 12,231.86P-001 - Penalty
0.00 91.40 7.59 25.01 43.07 167.07P-001 LIEN - Penalty LIEN
0.00 30.00 29.15 0.00 0.00 59.15P-002 - Penalty-Adjustment
0.00 70.86 2,685.00 0.00 71.40 2,827.26P-003 - Miscellaneous Charges
0.00 65.46 0.00 0.00 0.00 65.46P-003 LIEN - Miscellaneous Charges LIEN
0.00 0.62 0.62 0.64 18.54 20.42PEN- DR- 004 - Penalty- Drought
521,525.57 112,079.59 12,099.85 4,439.50 4,250.48 654,394.99Revenue Totals:
57

Number Name Type Type Description Status Project Description
C0002 ADMINISTRATIVE PROPERTY CIP Construction in Progress ACTIVE Future Administrative Building
C0009 GIS/MAPPING CIP Construction in Progress ACTIVE GIS/Mapping
C0035 COMPUTER EQUIPMENT CIP Construction in Progress ACTIVE Computer Equipment
C0049 Drought Mandated Costs SPT Special Project Tracking ACTIVE Drought Mandated Costs
C0050 SCMWC Water Exchange SPT Special Project Tracking ACTIVE SCMWC Water Exchange Agreement
C0051 Farmers Market Grant SPT Special Project Tracking ACTIVE Farmers Market Grant
C0053 Snowline USD Connection SPT Special Project Tracking ACTIVE Snowline USD Connection (80 acre parcel)
C0054 St. Mary Nutrition Grant SPT Special Project Tracking ACTIVE St. Mary Nutrition Grant
C0055 State Water Audit Reporting SPT Special Project Tracking ACTIVE State Water Audit Reporting
C0056 APN #3066-191-04 Potential to Serve SPT Special Project Tracking ACTIVE Potential out of service agreement - 76 station
C0057 Adjudication of Water Rights (Non-CIP) SPT Special Project Tracking ACTIVE Adjudication of Water Rights (Non-CIP)
C0058 GIS Maintenance SPT Special Project Tracking ACTIVE GIS Maintenance
C0059 Solar Related Costs SPT Special Project Tracking ACTIVE Solar Related Costs
C0060 PZ6 - Pipeline Project CIP Construction in Progress ACTIVE Pressure Zone 6 - Pipeline Project
C0061 Veteran's Wall SPT Special Project Tracking ACTIVE Veteran's Wall - Memorial Weekend 2018
C0062 Race Comm USA's SPT Special Project Tracking ACTIVE Race Communication USA's
C0063 Hydraulic Model Update CIP Construction in Progress ACTIVE Hydraulic Model Update
C0064 New Parking Lot - Comm. Ctr & Admin Bldg CIP Construction in Progress ACTIVE New Parking Lot - Comm. Ctr & Admin Bldg
C0065 APN #3069-221-04 Potential to Serve SPT Special Project Tracking ACTIVE Potential out of service agreement - Beekley Rd
C0066 Smithson Springs - Site clean-up SPT Special Project Tracking ACTIVE Smithson Springs - Site clean-up
C0067 Sunnyslope Pipeline for SJUSD WIP Work in Progress ACTIVE Sunnyslope Pipeline for SJUSD
C0068 Parks Master Plan CIP Construction in Progress ACTIVE Parks Master Plan
C0001 MODULAR BUILDING CIP Construction in Progress COMPLETE Modular Building
C0003 ERM COMPUTER SYSTEM CIP Construction in Progress COMPLETE Tyler Computer System
C0004 WELL #11 CIP Construction in Progress COMPLETE Well #11
C0005 SCADA UPGRADE CIP Construction in Progress COMPLETE SCADA System Upgrade
C0006 ADJUDICATION/ WATER RIGHTS CIP Construction in Progress COMPLETE Adjudication of Water Rights
C0007 MASTER PLAN CIP Construction in Progress COMPLETE Water Master Plan
C0010 TANK REHAB CIP Construction in Progress COMPLETE Tank Rehabilition
C0011 EMERGENCY POWER PLUGS CIP Construction in Progress COMPLETE Emergency Power Plugs
C0012 EMERGENCY BY-PASS PRVs CIP Construction in Progress COMPLETE Emergency By-Pass PRVs
C0013 WELL #6B REHAB CIP Construction in Progress COMPLETE Well #6B Rehab
C0014 WELL #6A REHAB CIP Construction in Progress COMPLETE Well #6A Rehab
C0015 PRV AND PUMP CIP Construction in Progress COMPLETE PRV and Pump
C0016 WELL #2 CIP Construction in Progress COMPLETE Well #2
C0018 PINON HILLS PARK CIP Construction in Progress COMPLETE Pinon Hills Park
C0019 WELL #11 CIP Construction in Progress COMPLETE Well #11
C0020 WELL #2A CIP Construction in Progress COMPLETE Well #2A
C0021 WELL 9B REHAB CIP Construction in Progress COMPLETE Well 9B Rehab
C0022 NEW WELLS CIP Construction in Progress COMPLETE New Wells
C0023 5B BOOSTER C CIP Construction in Progress COMPLETE 5B Booster C
C0024 CIP - PARKS DEVELOPMENT CIP Construction in Progress COMPLETE CIP - Parks Development
C0027 WELL #5 REHAB CIP Construction in Progress COMPLETE Well #5 Rehab
C0028 VALVE MAINTENANCE TRAILER CIP Construction in Progress COMPLETE Valve Maintenance Trailer
C0029 LED SIGN CIP Construction in Progress COMPLETE C0029 LED SIGN
C0030 WATER RIGHTS ACQUISITION PROJECT CIP Construction in Progress COMPLETE Water Rights Acquisition Project
C0031 DAIRY FACILITIES CIP Construction in Progress COMPLETE Dairy Facilities
C0032 COMPUTER EQUIPMENT CIP Construction in Progress COMPLETE Computer Equipment
C0033 PHELAN PARK SHELTER PROJECT CIP Construction in Progress COMPLETE Phelan Park Shelter Project
C0036 HWY 138 (PPHCSD) PIPELINE RELOCATION CIP Construction in Progress COMPLETE Hwy 138 (PPHCSD) Pipeline Relocation Project
C0037 DAIRY WELLS CIP Construction in Progress COMPLETE Dairy Wells
C0038 EXTERIOR TANK REHAB CIP Construction in Progress COMPLETE Exterior Tank Rehab
C0039 DAIRY ANNEXATION CIP Construction in Progress COMPLETE Dairy Annexation
C0041 HWY 138-CALTRANS WIP Work in Progress COMPLETE Hwy 138-Caltrans
C0043 PARKING LOT REPAIR/REPAVE-PINON HILLS P CIP Construction in Progress COMPLETE Parking Lot Repair/Repave-Pinon Hills Park
C0044 WHITE RD WATER RELOCATION WIP Work in Progress COMPLETE White Road Water Relocation
C0045 Duncan Rd Water Serv Relocation WIP Work in Progress COMPLETE Duncan Road Water Service Relocation
C0046 Oasis Yard 10x30 Modular Office CIP Construction in Progress COMPLETE Oasis Yard 10x30 Modular Office
C0047 URBAN WATER MANAGEMENT PLAN 2016 CIP Construction in Progress COMPLETE Urban Water Management Plan 2016
C0008 BOOSTER PUMPS CIP Construction in Progress INACTIVE Booster Pumps
C0017 LEVEL CONTROL VALVES CIP Construction in Progress INACTIVE Level Control Valves
C0025 SOLAR PROJECT CIP Construction in Progress INACTIVE Solar Project
C0026 SMITHSON SPRINGS RENOVATION CIP Construction in Progress INACTIVE Smithson Springs Renovation
C0034 EXTERIOR TANK REHAB CIP Construction in Progress INACTIVE Exterior Tank Rehab
C0040 DAIRY WELLS CONNECTION CIP Construction in Progress INACTIVE Dairy Wells Connection
C0042 Chromium-6 Mitigation Project CIP Construction in Progress INACTIVE Chromium-6 Mitigation
C0048 Mobile Service Order Application Development CIP Construction in Progress INACTIVE Sedaru Application Developmenet
C0052 Chromium-6 Mitigation Project Engineering Design CIP Construction in Progress INACTIVE Chromium-6 Mitigation Engineering Design
58

Total Activity
ActivityItem Number
Page 1 of 310/3/2018 2:30:10 PM
Project Balance ReportPhelan Pinon Hills Community Services District By Project Number
Report Dates: 07/01/2008 - 09/30/2018
Project Number Project Name Group Type Status
C0002 ADMINISTRATIVE PROPERTY Adminstration Construction in Prog… Active
Expenses
Account NameAccount Key Category Beginning Balance Activity Ending Balance
C0002 ARCHITECT C0002 ARCHITECT OUTSIDE SERVICES 0.00 36,108.95 36,108.95
C0002 BUILD C0002 MODULAR BUILDING Buildings 0.00 93.34 93.34
C0002 COUNTY FEES C0002 COUNTY FEES Fees/License 0.00 38,241.88 38,241.88
C0002 IMPROVE C0002 IMPROVEMENTS OUTSIDE SERVICES 0.00 32,889.26 32,889.26
C0002 OUTSIDE SVCS C0002 OUTSIDE SVCS OUTSIDE SERVICES 0.00 36,597.95 36,597.95
Total Expenses: 0.00 143,931.38 143,931.38
Total C0002: 0.00 143,931.38 143,931.38
C0035 COMPUTER EQUIPMENT Adminstration Construction in Prog… Active
Expenses
Account NameAccount Key Category Beginning Balance Activity Ending Balance
C0035 COMPUTER EQUIPMENT C0035 COMPUTER EQUIPMENT Computer 0.00 16,552.85 16,552.85
Total Expenses: 0.00 16,552.85 16,552.85
Total C0035: 0.00 16,552.85 16,552.85
C0036 HWY 138 (PPHCSD) PIPELINE REL… Water Distribution Construction in Prog… COMPLETE
Expenses
Account NameAccount Key Category Beginning Balance Activity Ending Balance
C0036 LABOR C0036 LABOR FOR HWY 138-PPHCSD LABOR 0.00 -8,956.25 -8,956.25
C0036 LEGAL C0036 LEGAL FOR HWY 138-PPHCSD OUTSIDE SERVICES 0.00 8,956.25 8,956.25
Total Expenses: 0.00 0.00 0.00
Total C0036: 0.00 0.00 0.00
C0042 Chromium-6 Mitigation Project Study & Design Construction in Prog… Active
Expenses
Account NameAccount Key Category Beginning Balance Activity Ending Balance
C0042 OUTSIDE SVCS C0042 OUTSIDE SVCS OUTSIDE SERVICES 0.00 896,861.52 896,861.52
Total Expenses: 0.00 896,861.52 896,861.52
Total C0042: 0.00 896,861.52 896,861.52
C0060 PZ6 - Pipeline Project Study & Design Construction in Prog… Active
Expenses
Account NameAccount Key Category Beginning Balance Activity Ending Balance
C0060 LABOR C0060 LABOR - PZ6 Pipeline Project LABOR 0.00 1,766.94 1,766.94
C0060 OUTSIDE SERVIC C0060 OUTSIDE SERVIC - PZ6 Pipeline P… OUTSIDE SERVICES 0.00 6,700.00 6,700.00
Total Expenses: 0.00 8,466.94 8,466.94
Total C0060: 0.00 8,466.94 8,466.94
C0063 Hydraulic Model Update Water Distribution Construction in Prog… Active
Expenses
Account NameAccount Key Category Beginning Balance Activity Ending Balance
C0063 LABOR C0063 LABOR - HYDRAULIC MODEL UP… LABOR 0.00 1,080.07 1,080.07
C0063 OUTSIDE SVCS C0063 OUTSIDE SVCS - HYDRAULIC MO… OUTSIDE SERVICES 0.00 19,111.39 19,111.39
Total Expenses: 0.00 20,191.46 20,191.46
Total C0063: 0.00 20,191.46 20,191.46
C0064 New Parking Lot - Comm. Ctr & A… Adminstration Construction in Prog… Active
Expenses
Account NameAccount Key Category Beginning Balance Activity Ending Balance
C0064 LABOR C0064 LABOR - PARKING LOT LABOR 0.00 369.53 369.53
C0064 OUTSIDE SVCS C0064 OUTSIDE SVCS - PARKING LOT OUTSIDE SERVICES 0.00 3,379.35 3,379.35
59
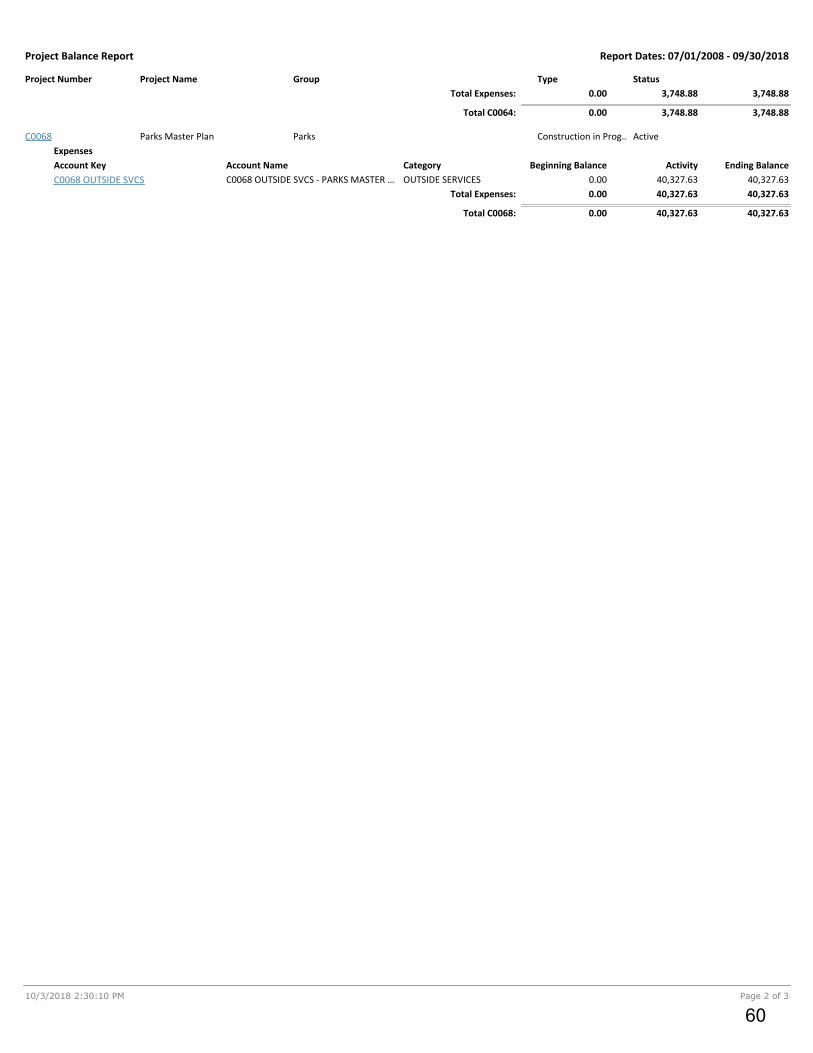
Total Activity
ActivityItem Number
Report Dates: 07/01/2008 - 09/30/2018Project Balance Report
Page 2 of 310/3/2018 2:30:10 PM
Project Number Project Name Group Type Status
Total Expenses: 0.00 3,748.88 3,748.88
Total C0064: 0.00 3,748.88 3,748.88
C0068 Parks Master Plan Parks Construction in Prog… Active
Expenses
Account NameAccount Key Category Beginning Balance Activity Ending Balance
C0068 OUTSIDE SVCS C0068 OUTSIDE SVCS - PARKS MASTER … OUTSIDE SERVICES 0.00 40,327.63 40,327.63
Total Expenses: 0.00 40,327.63 40,327.63
Total C0068: 0.00 40,327.63 40,327.63
60
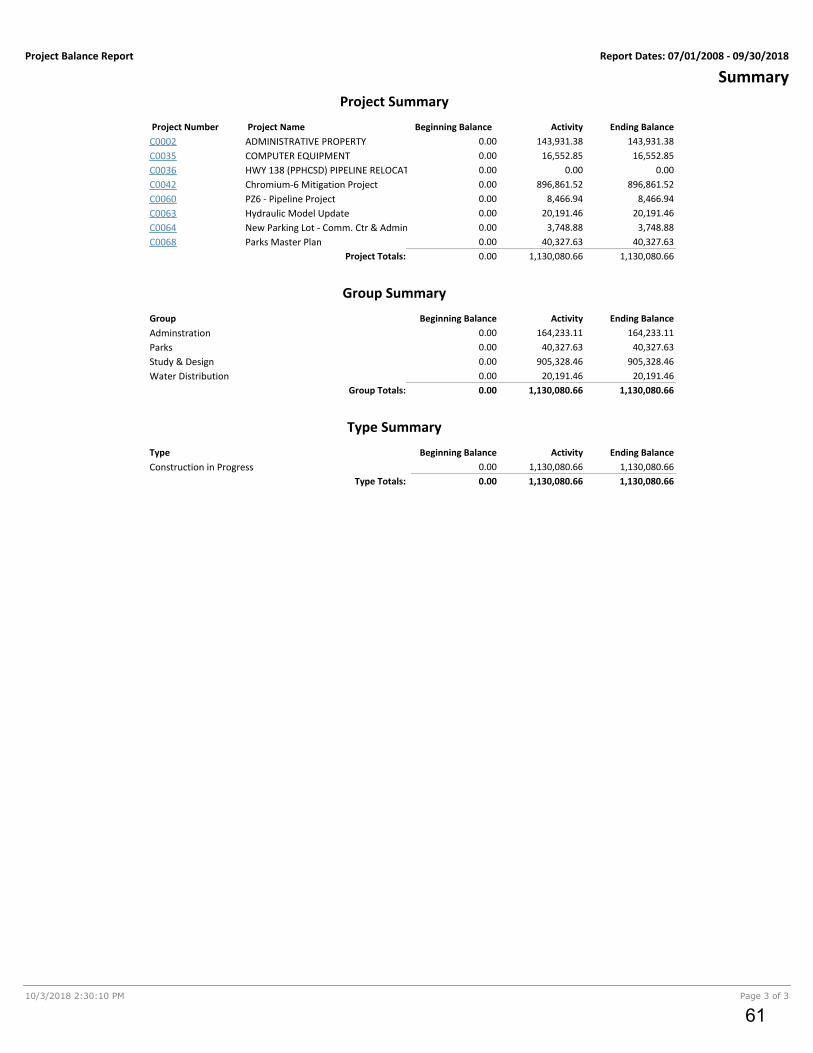
Report Dates: 07/01/2008 - 09/30/2018Project Balance Report
Page 3 of 310/3/2018 2:30:10 PM
Summary
Project Name Project Number
Project Summary
Beginning Balance Activity Ending Balance
ADMINISTRATIVE PROPERTYC0002 0.00 143,931.38 143,931.38
COMPUTER EQUIPMENTC0035 0.00 16,552.85 16,552.85
HWY 138 (PPHCSD) PIPELINE RELOCATIONC0036 0.00 0.00 0.00
Chromium-6 Mitigation ProjectC0042 0.00 896,861.52 896,861.52
PZ6 - Pipeline ProjectC0060 0.00 8,466.94 8,466.94
Hydraulic Model UpdateC0063 0.00 20,191.46 20,191.46
New Parking Lot - Comm. Ctr & Admin BldgC0064 0.00 3,748.88 3,748.88
Parks Master PlanC0068 0.00 40,327.63 40,327.63
Project Totals: 0.00 1,130,080.66 1,130,080.66
Group Summary
Group Beginning Balance Activity Ending Balance
Adminstration 0.00 164,233.11 164,233.11
Parks 0.00 40,327.63 40,327.63
Study & Design 0.00 905,328.46 905,328.46
Water Distribution 0.00 20,191.46 20,191.46
Group Totals: 0.00 1,130,080.66 1,130,080.66
Type Summary
Type Beginning Balance Activity Ending Balance
Construction in Progress 0.00 1,130,080.66 1,130,080.66
Type Totals: 0.00 1,130,080.66 1,130,080.66
61
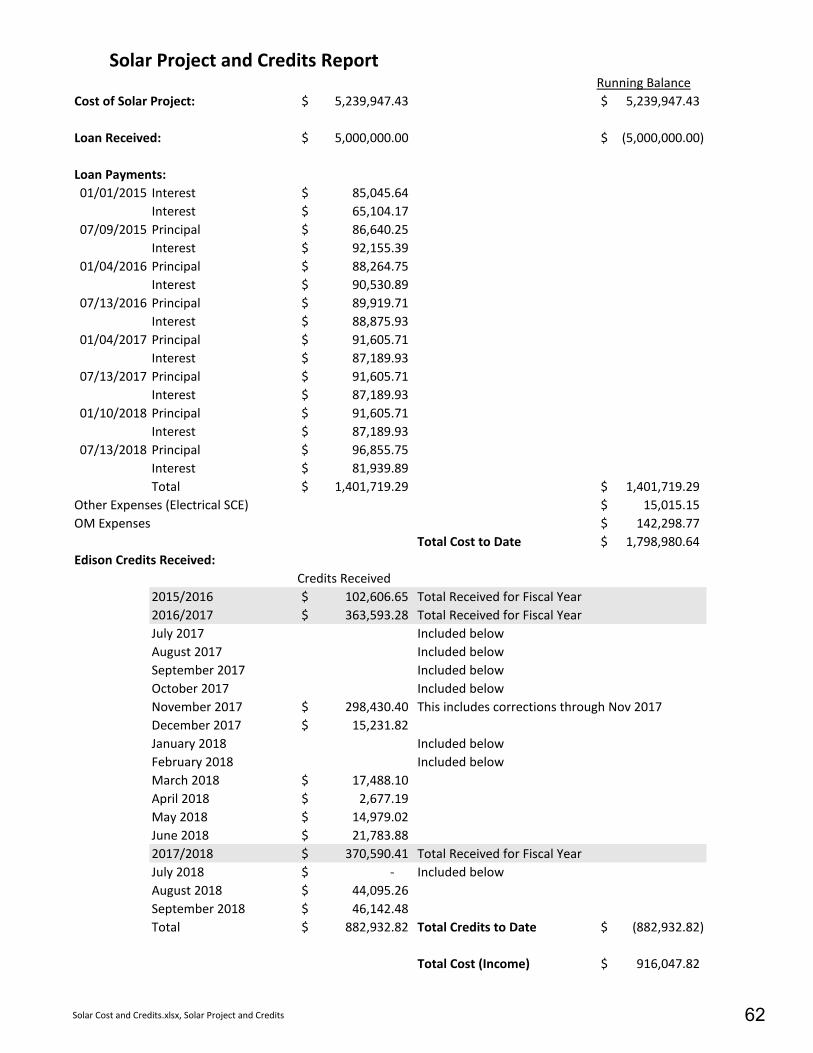
Solar Cost and Credits.xlsx, Solar Project and Credits
Running Balance5,239,947.43$ 5,239,947.43$
Loan Received: 5,000,000.00$ (5,000,000.00)$
Loan Payments:01/01/2015 Interest 85,045.64$
Interest 65,104.17$ 07/09/2015 Principal 86,640.25$
Interest 92,155.39$ 01/04/2016 Principal 88,264.75$
Interest 90,530.89$ 07/13/2016 Principal 89,919.71$
Interest 88,875.93$ 01/04/2017 Principal 91,605.71$
Interest 87,189.93$ 07/13/2017 Principal 91,605.71$
Interest 87,189.93$ 01/10/2018 Principal 91,605.71$
Interest 87,189.93$ 07/13/2018 Principal 96,855.75$
Interest 81,939.89$ Total 1,401,719.29$ 1,401,719.29$
Other Expenses (Electrical SCE) 15,015.15$ OM Expenses 142,298.77$
Total Cost to Date 1,798,980.64$
Credits Received2015/2016 102,606.65$ Total Received for Fiscal Year2016/2017 363,593.28$ Total Received for Fiscal YearJuly 2017 Included belowAugust 2017 Included belowSeptember 2017 Included belowOctober 2017 Included belowNovember 2017 298,430.40$ This includes corrections through Nov 2017December 2017 15,231.82$ January 2018 Included belowFebruary 2018 Included belowMarch 2018 17,488.10$ April 2018 2,677.19$ May 2018 14,979.02$ June 2018 21,783.88$ 2017/2018 370,590.41$ Total Received for Fiscal YearJuly 2018 -$ Included belowAugust 2018 44,095.26$ September 2018 46,142.48$ Total 882,932.82$ Total Credits to Date (882,932.82)$
Total Cost (Income) 916,047.82$
Solar Project and Credits Report
Cost of Solar Project:
Edison Credits Received:
62

Solar Cost and Credits.xlsx, Proforma SunPower Est vs actual
Scenario 09/11/2014Terms Turnkey System, Annual O&M, 10 Year Performance Guarantee @90%Terms 25 Year Module Warranty, 10 Year Balance of System Warranty, 30 Year Lifecycle
Financing Structure 20 Yr Loan Term, 3.75% interest rate, Origination Fees and Financing Fees May Apply, $0 Annual Payment Escalation
Estimate
EOY
Y0 -$ -$ -$ (198,821)$ (198,821)$ 5,000,000$ (198,821)$
Y1 416,265$ 3,484$ (35,575)$ -$ 384,174$ 4,828,314$ (171,686)$ (185,905)$ (357,591)$ 107% 26,583$
Y2 431,833$ 3,623$ (35,575)$ -$ 399,882$ 4,650,130$ (178,184)$ (179,407)$ (357,591)$ 112% 42,290$
Y3 447,984$ 3,768$ (35,575)$ -$ 416,177$ 4,465,201$ (184,929)$ (172,662)$ (357,591)$ 116% 58,586$
Y4 464,738$ 3,919$ (35,575)$ -$ 433,082$ 4,273,272$ (191,929)$ (165,662)$ (357,591)$ 121% 75,491$
Y5 482,119$ 4,076$ (35,575)$ -$ 450,620$ 4,074,078$ (199,194)$ (158,398)$ (357,591)$ 126% 93,029$
Y6 500,151$ 4,239$ (35,575)$ -$ 468,815$ 3,867,345$ (206,733)$ (150,858)$ (357,591)$ 131% 111,223$
Y7 518,856$ 4,408$ (35,575)$ -$ 487,690$ 3,652,786$ (214,559)$ (143,033)$ (357,591)$ 136% 130,099$
Y8 538,261$ 4,585$ (35,575)$ -$ 507,271$ 3,430,106$ (222,680)$ (134,911)$ (357,591)$ 142% 149,680$
Y9 558,392$ 4,768$ (35,575)$ -$ 527,586$ 3,198,997$ (231,109)$ (126,482)$ (357,591)$ 148% 169,994$
Y10 579,276$ 4,959$ (35,575)$ -$ 548,660$ 2,959,140$ (239,857)$ (117,735)$ (357,591)$ 153% 191,069$
Y11 600,941$ 5,157$ (31,946)$ -$ 574,152$ 2,710,205$ (248,936)$ (108,656)$ (357,591)$ 161% 216,561$
Y12 623,416$ 5,363$ (32,905)$ -$ 595,875$ 2,451,847$ (258,358)$ (99,233)$ (357,591)$ 167% 238,284$
Y13 646,732$ 5,578$ (33,892)$ -$ 618,418$ 2,183,709$ (268,137)$ (89,454)$ (357,591)$ 173% 260,827$
Y14 670,920$ 5,801$ (34,909)$ -$ 641,812$ 1,905,422$ (278,287)$ (79,304)$ (357,591)$ 179% 284,221$
Y15 696,012$ 6,033$ (167,208)$ -$ 534,838$ 1,616,602$ (288,820)$ (68,771)$ (357,591)$ 150% 177,246$
Y16 722,043$ 6,274$ (37,035)$ -$ 691,283$ 1,316,849$ (299,753)$ (57,838)$ (357,591)$ 193% 333,692$
Y17 749,048$ 6,525$ (38,146)$ -$ 717,427$ 1,005,750$ (311,099)$ (46,492)$ (357,591)$ 201% 359,836$
Y18 777,062$ 6,786$ (39,290)$ -$ 744,558$ 682,875$ (322,874)$ (34,717)$ (357,591)$ 208% 386,967$
Y19 806,124$ 7,058$ (40,469)$ -$ 772,713$ 347,780$ (335,096)$ (22,495)$ (357,591)$ 216% 415,122$
Y20 836,273$ 7,340$ (41,683)$ -$ 801,931$ (0)$ (347,780)$ (9,812)$ (357,591)$ 224% 444,339$
Y21 867,550$ 7,634$ (42,933)$ -$ 832,250$ (0)$ (0)$ 0$ -$ 0% 832,250$
Y22 899,996$ 7,939$ (44,221)$ -$ 863,714$ (0)$ -$ -$ -$ 0% 863,714$
Y23 933,656$ 8,257$ (45,548)$ -$ 896,365$ (0)$ -$ -$ -$ 0% 896,365$
Y24 968,575$ 8,587$ (46,914)$ -$ 930,247$ (0)$ -$ -$ -$ 0% 930,247$
Y25 1,004,800$ 8,930$ (48,322)$ -$ 965,408$ (0)$ -$ -$ -$ 0% 965,408$
Y26 1,042,379$ 9,288$ (49,771)$ -$ 1,001,895$ (0)$ -$ -$ -$ 0% 1,001,895$
Y27 1,081,364$ 9,659$ (51,265)$ -$ 1,039,759$ (0)$ -$ -$ -$ 0% 1,039,759$
Y28 1,121,807$ 10,045$ (52,802)$ -$ 1,079,050$ (0)$ -$ -$ -$ 0% 1,079,050$
Y29 1,163,763$ 10,447$ (54,387)$ -$ 1,119,823$ (0)$ -$ -$ -$ 0% 1,119,823$
Y30 1,207,287$ 10,865$ (56,018)$ -$ 1,162,134$ (0)$ -$ -$ -$ 0% 1,162,134$
TOTAL 22,357,626$ 195,396$ (1,345,410)$ (198,821)$ 21,008,790$ (5,000,000)$ (2,151,826)$ (7,151,826)$ 13,856,965$
Actual
EOY
Y0 -$ -$ -$ (239,947)$ (239,947)$ 5,000,000$ (85,046)$ (65,104)$ (150,150)$ (390,097)$
Y1 102,607$ -$ (35,575)$ -$ 67,032$ 4,914,954$ (174,905)$ (182,686)$ (357,591)$ 19% (290,559)$
Y2 363,593$ -$ (35,575)$ (24,528)$ 303,491$ 4,740,049$ (181,525)$ (176,066)$ (357,591)$ 85% (54,101)$
Y3 370,590$ -$ (35,575)$ -$ 335,016$ 4,558,524$ (188,396)$ (169,195)$ (357,591)$ 94% (22,576)$
Y4 90,238$ -$ (35,575)$ -$ 54,663$ 4,370,127$ (195,528)$ (162,064)$ (357,591)$ 0% (302,928)$
Y5 -$ -$ -$ -$ -$ -$ -$ -$ -$ 0% -$
Y6 -$ -$ -$ -$ -$ -$ -$ -$ -$ 0% -$
Y7 -$ -$ -$ -$ -$ -$ -$ -$ -$ 0% -$
Y8 -$ -$ -$ -$ -$ -$ -$ -$ -$ 0% -$
Y9 -$ -$ -$ -$ -$ -$ -$ -$ -$ 0% -$
Y10 -$ -$ -$ -$ -$ -$ -$ -$ -$ 0% -$
Y11 -$ -$ -$ -$ -$ -$ -$ -$ -$ 0% -$
Y12 -$ -$ -$ -$ -$ -$ -$ -$ -$ 0% -$
Y13 -$ -$ -$ -$ -$ -$ -$ -$ -$ 0% -$
Y14 -$ -$ -$ -$ -$ -$ -$ -$ -$ 0% -$
Y15 -$ -$ -$ -$ -$ -$ -$ -$ -$ 0% -$
Y16 -$ -$ -$ -$ -$ -$ -$ -$ -$ 0% -$
Y17 -$ -$ -$ -$ -$ -$ -$ -$ -$ 0% -$
Y17 -$ -$ -$ -$ -$ -$ -$ -$ -$ 0% -$
Y18 September 2018 46,142$ -$ -$ 46,142$ -$ -$ -$ -$ 0% 46,142$
Y19 -$ -$ -$ -$ -$ -$ -$ -$ -$ 0% -$
Y20 -$ -$ -$ -$ -$ -$ -$ -$ -$ 0% -$
Y21 -$ -$ -$ -$ -$ -$ -$ -$ -$ 0% -$
Y22 -$ -$ -$ -$ -$ -$ -$ -$ -$ 0% -$
Y23 -$ -$ -$ -$ -$ -$ -$ -$ -$ 0% -$
Y24 -$ -$ -$ -$ -$ -$ -$ -$ -$ 0% -$
Y25 -$ -$ -$ -$ -$ -$ -$ -$ -$ 0% -$
Y26 -$ -$ -$ -$ -$ -$ -$ -$ -$ 0% -$
Y27 -$ -$ -$ -$ -$ -$ -$ -$ -$ 0% -$
Y28 -$ -$ -$ -$ -$ -$ -$ -$ -$ 0% -$
Y29 -$ -$ -$ -$ -$ -$ -$ -$ -$ 0% -$
Y30 -$ -$ -$ -$ -$ -$ -$ -$ -$ 0% -$
TOTAL 927,028$ 46,142$ (142,299)$ (264,475)$ 566,396$ (825,400)$ (755,115)$ (1,580,515)$ (1,014,118)$
Total Debt Service
Utility Savings REC Sales O&M Expense
Net Cash Flow
DSCR Net Cash Flow
Utility Savings REC Sales O&M Expense Other ExpNet Operating
Savings
Pre-CODNet Operating
SavingsPrincipal Balance
Principal Payment
Interest Payment
Principal BalancePrincipal Payment
Interest Payment
Total Debt Service
DSCR
63