phases of rti implementationpages.uoregon.edu/spsy/workshops/phases u of o 2007.hos.pdf · phases...
TRANSCRIPT

Phases of RtI Implementation
University of Oregon
W. David Tilly IIIHeartland Area Education Agency 11
Johnston, Iowa
November 9, 2007
Correspondence about this presentation should be directed to David Tilly, Heartland AEA 11, 6500 Corporate Dr., Johnston, IA 50131. Email is [email protected], (515) 360-6532.

Implementing Problem-Solving/Response to Intervention (PSM/RtI):
This Presentation and Your School
Three Phases of ImplementationConsensus Building (Commitment)Infrastructure DevelopmentImplementation

Implementing Problem-Solving/Response to Intervention (PSM/RtI):
This Workshop
Phase 1: Consensus BuildingRationale and HistoryStatutes and RegulationsResearch on existing programs/servicesLooking at your dataThinking differently

The significant problems we have cannot be solved at the same level of thinking with which we created them.
Albert Einstein (1879 – 1955)

Strategies for Building Consensus
Study Groups – Read the literature and discussWatch Introductory Videos http://www4.scoe.net/rti/programs.cfm?menuChoice=3Discussion of barriers to achieving better results for all students Examination of local dataThree Consensus Building Tools listed next in this presentation

Thinking Differently: Your Data
What percentage of students at each grade are proficient in mathematics?What percentage are proficient in reading?What are the trajectories required by NCLB?How long do you have until these two lines cross at the current rate of progress?

Consensus Building Tool 1: Thinking Differently
Time for a Survey!

Consensus Building Tool 1: RtI Survey – Examining our old beliefs
Examine the RtI Survey ‘07.

If we can really understand the problem, the answer will come out of it, because
the answer is not separate from the problem.
-Krishnamurti

Consensus Building Tool 2: Thinking Differently and Facilitating Others to Do the Same
SummaryAYP Applies to ALL StudentsRegardless of who or “what” you are, progress in the academic curriculum or interpersonal behavior is what matters mostBeing “disabled” is less likely than simply not having sufficient exposure to the curriculum or appropriate models for behaviorResearch supports that supplemental and intensive interventions, delivered with fidelity, are more likely than notto workAuthentic assessment links to and informs interventions in the most direct way

Adapted from Florida Reading First (Torgesen, 2003)
Consensus Building Tool #2: School-Wide Systems Provide a Formula for Success
BI + ii + 3a + si + iii = Achievement for all Students
Big Ideas in a Content DomainInitial Instruction3 Assessments (Screening, Diagnostic, Progress Monitoring)Strategic InstructionIntensive Instruction/Intervention

“Big Ideas” in a Content Domain
Research-derived components/skills within a content domain that are imperative to student success in the domain overallWe have these for Reading (Phonemic Awareness, Phonics, Fluency, Vocabulary, Comprehension)Continuing research and synthesis is needed in Math, Social Behavior, Written language etc.

“Initial Instruction”
Instruction provided to all students at a grade levelTypically oriented to teach a set of standards and benchmarksShould be effective for a large majority of students (judged by student performance)80% has been suggested by some as a target to shoot for

3 Types of Assessment
1. Screening Assessments – assessments used to determine if additional investigation is warranted
Focused on extremely important indicatorsTypically short in durationTypically few itemsTypically overidentified persons for further assessmentAnswers the question: is there a possible problem?Examples: State CR tests, Nationally normed achievement tests, CBM tests, DIBELS etc.

3 Types of Assessment2. Diagnostic Assessments: Assessment conducted at any time during the school year when more in-depth analysis of a student’s strengths and weaknesses is needed to guide instruction (Institute for the Development of Educational Achievement, 2003)
Assessments conducted to pinpoint reasons why specific types of problems are occurringTypically many items in each sub-area related to the problemYields testable hypotheses about problem etiologyLeads directly to teaching recommendations with a good likelihood of successExamples: MASI, Curriculum-Based Evaluation, FBA, Gray Oral Reading Test IV (GORT-IV), Woodcock Reading Mastery Test -Revised (WRMT-R)
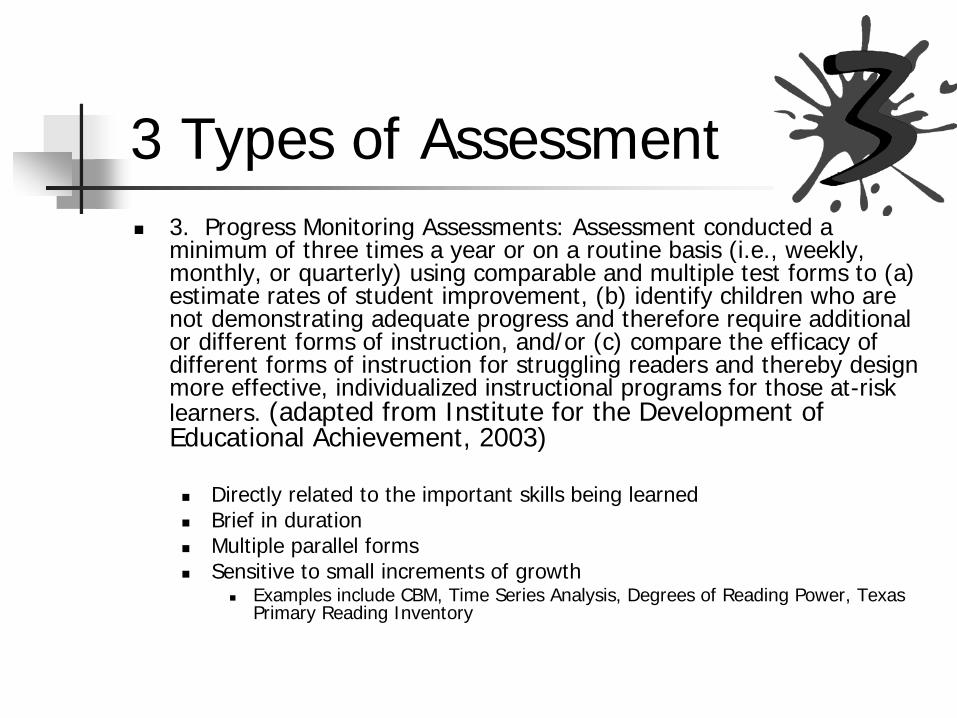
3 Types of Assessment3. Progress Monitoring Assessments: Assessment conducted a minimum of three times a year or on a routine basis (i.e., weekly, monthly, or quarterly) using comparable and multiple test forms to (a) estimate rates of student improvement, (b) identify children who are not demonstrating adequate progress and therefore require additional or different forms of instruction, and/or (c) compare the efficacy of different forms of instruction for struggling readers and thereby design more effective, individualized instructional programs for those at-risk learners. (adapted from Institute for the Development of Educational Achievement, 2003)
Directly related to the important skills being learnedBrief in durationMultiple parallel formsSensitive to small increments of growth
Examples include CBM, Time Series Analysis, Degrees of Reading Power, Texas Primary Reading Inventory

Consensus Building Tool #2 RtI Activity
As a table, turn in your activity packet to RtIActivity As a group, examine the matrixDiscuss, item by item, what the result of implementing a school wide model, missing any individual component, is likely to produce in practice. Have one person capture your responses line-by-line on their activity page

5Big Ideas
iiInitial Instruction
siStrategic
Instruction
iiiIntensive
Instruction/Intervention
Efforts lack focus and priority. There is not a
focus on important priority skills for
improvement.+ +3
Assessments(Screening, diagnostic,
progress)+ + =
5Big Ideas
iiInitial Instruction
siStrategic
Instruction
iiiIntensive
Instruction/Intervention
Overall low achievement. Student
learning problems across all subgroup
areas.+ +3
Assessments(Screening, diagnostic,
progress)+ + =
5Big Ideas
iiInitial Instruction
siStrategic
Instruction
iiiIntensive
Instruction/Intervention
Lack of direction to know what needs to be
improved, which students need
intervention, and whether or not
interventions have been effective.
+ +3
Assessments(Screening, diagnostic,
progress)+ + =
5Big Ideas
iiInitial Instruction
siStrategic
Instruction
iiiIntensive
Instruction/Intervention
Lack of resources due to attempts to provide
intensive interventions for those students
whose needs could be met through strategic
interventions.+ +
3Assessments
(Screening, diagnostic, progress)
+ + =
5Big Ideas
iiInitial Instruction
siStrategic
Instruction
iiiIntensive
Instruction/Intervention
Gap increases between average and "at risk students" Continued low performance for
some subgroups.+ +3
Assessments(Screening, diagnostic,
progress)+ + =
5Big Ideas
iiInitial Instruction
siStrategic
Instruction
iiiIntensive
Instruction/Intervention
NCLBSuccess+ +
3Assessments
(Screening, diagnostic, progress)
+ + =

RtI Consensus Activity #3
Number off from one to sevenEveryone read pages 1 to 3 of the article “Beyond Islands of Excellence”Each person read corresponding numbered finding (persons number 1, read finding 1, etc…)Make notes on the top points from your section

RtI Consensus Activity #3
Come back together as a groupBegin with #1 sharing out the major points from their sectionContinue till all individuals have shared their contentGiven the findings from this study, what are the similarities/difference between the findings and Response to Instruction?

Phase 2 Building An RtI Infrastructure

Infrastructure ComponentsUnderstanding of The Blueprint of Putting RtI In PlaceThe Initial Structures to Put in Place Before Attacking the Questions (e.g., what teams do you need, what do they need to do etc.) and expectations for how long, how much, how fastUnderstand the 13 questions that need to be answered in order to build the infrastructure to implement
Build (or find) the tools to answer each of the questions – these are your building materials
Build skills in staff to implement a problem solving/data based decision making model

Infrastructure Component 1: Understanding the Blueprint
TimeframeBuilding the initial infrastructure will probably take 6 months to a yearGetting it really up and running will take probably about a year to 18 monthsBusiness as usual comes in year 3 or 4Punch line, this is second-order change. Don’t expect it overnight.

Infrastructure Component 1 : Understanding the Blueprint
You build the RtI infrastructure in phasesPhase 1: Look at your corePhase 2: Build/modify supplemental infrastructuresPhase 3: Build/modify intensive supports
You also must build the process skills to run the infrastructure. This means learning about systematic problem solving or data based-decision making

Infrastructure Component 2: The Initial Structures to Put in Place Before Attacking the Questions

Infrastructure Component 2: Initial Structures
RtI/Problem Solving Leadership TeamA team is presentAppropriate representation (incl. building principal)
Data mentorCurriculum ExpertFacilitatorRepresentative Teachers
Role of team is clearClear processes to follow

Infrastructure Component 2: Initial Structures:
RtI/Problem Solving Leadership Team RolesParticipate in ongoing learningWork on building the RtI infrastructureCommunicate with school staff and parents about the processCommit to learn the skills necessary to implement RtI once the infrastructure is put in place

Infrastructure Component 2: Initial Structures
Universal Screening measurement system
Screening MeasuresEfficient Administration and scoringData management system to store/display data

Infrastructure Component 2: Initial Structures
Solid Core CurriculumScientifically Research-Based CurriculumMethod for monitoring the effectiveness of the core curriculumProcess to augment the core as necessary based and student performance resultsTeachers implement effective instructional practices uniformly

Infrastructure Component 2: Initial Structures
Supplemental InstructionTeam has a way to identify which students need supplemental instruction in addition to the coreTeam has systematic methods to identify what supplemental instruction is needed and a process to match students’ needs to this instructionSchool has selected research-based strategies, aligned with critical components, to provide supplemental instructionSufficient teachers are trained to implement these supplemental instructional strategiesLogistics for providing supplemental instruction have been addressed and resolved (who will provide what, when, where, to whom?)

Infrastructure Component 2: Initial Structures
Intensive InstructionA method for identifying students who need intensive instruction has been identifiedSystematic methods to identify what intensive instruction is needed and a process to match students’ needs to this instructionSchool has selected research-based strategies, aligned with critical components, to provide supplemental instructionSufficient teachers are trained to implement these supplemental instructional strategiesLogistics for providing supplemental instruction have been addressed and resolved (who will provide what, when, where, to whom?)


Infrastructure Component 2: Initial Structures
Framework to Guide the WorkThis will look different in each buildingThe issues are similar everywhereThe principles for solving them are the same everywhereHowever, every building is different, and these differences must be accounted for in implementationRtI does not tell people what to think, it tells them what to think about!Best way to do this is with QUESTIONS rather than ANSWERS

Infrastructure Component 3: 13 Question Activity (This is the Guts of It)
Take out the handout titled “Heartland AEA - 13 Guiding Questions for RtI Implementation”Read through the first page (this is just the questions, without the steps)

The Process Side of RtI: Systematic Problem Solving

Infrastructure Component 4: Problem Solving Process
EvaluateResponse to
Intervention (RtI)
Problem AnalysisValidating ProblemIdent Variables that
Contribute to ProblemDevelop Plan
Define the ProblemDefine the ProblemDefining Problem/Directly Measuring BehaviorDefining Problem/Directly Measuring Behavior
Implement PlanImplement As Intended
Progress MonitorModify as Necessary

“Stop asking me if we’re almost there; we’re Nomads, for crying out loud.”
People see change as an event: “But we just changed last year.”

Problem Solving: Strengths
Can be applied to the student, classroom, building, district, and problem levels
Student- academic and/or behavior problemClassroom- discipline, returning homeworkBuilding- bullying, attendanceDistrict- over-/under-representationProblem- problem common to students in building

Problem Solving: Strengths
SystematicFocused on outcomesTailored to specific situations
“unlimited” range of hypothesesEvidence-based

Problem Solving and RtI
I really just want to be able to use RtIwithout all of that problem-solving stuff--can I do that?

Implementation: What Does It Look Like?
Thanks to Joe Kovaleski and Ed Shapiro for some case examplesPA State-wide RtIInitiative

Implementation Basics
Integrate with Core Instructional Programs and Activities in the District
Reading First, Early Intervention, Positive Behavior Support
3-4 Tiered Model of Service Delivery and Decision-Making“Universal”--What all students get“Supplemental”--additional focus and intensity“Intensive”--modifying instructional strategies“Extraordinary”-- highly specialized methods
Problem-SolvingCan occur at any levelIncreases in intensity across levels

Academic Systems Behavioral Systems
1-5%
Tier 3: Intensive, Individual InterventionsIndividual StudentsAssessment-basedHigh IntensityOf longer duration
1-5%Tier 3: Intensive, Individual InterventionsIndividual StudentsAssessment-basedIntense, durable procedures
5-10%Tier 2: Targeted Group InterventionsSome students (at-risk)High efficiencyRapid response
5-10%Tier 2: Targeted Group InterventionsSome students (at-risk)High efficiencyRapid response
80-90%Tier 1: Universal InterventionsAll studentsPreventive, proactive
80-90% Tier 1: Universal InterventionsAll settings, all studentsPreventive, proactive
Three Tiered Model of School Supports
Students

How the Tiers WorkGoal: Student is successful with Tier 1 level of support-academic or behavioralGreater the tier, greater support and “severity”Increase level of support (Tier level) until you identify an intervention that results in a positive response to interventionContinue until student strengthens response significantlySystematically reduce support (Lower Tier Level)Determine the relationship between sustained growth and sustained support.

Tier One
Tier Two
Tier Three
Assessments Interventions•Universal/Benchmarks•AYP•District-Wide Assessments•DIBELS/CBM•ODRs
•Core Curriculum•Evidence-Based•School-Wide PBSDATA
DATADATA
DATADATA
DATA
DATADATA
DATADATA
DATADATAAssessments Interventions
•Diagnostic•Comprehensive (RIOT)•Directly related to problem•Linked to Interventions•Evaluate intervention
•Intense•Limiting curriculum•Specialized Instruction•Possible eligibility•Frequency/Intensity are extraordinary
Assessments Interventions•DIBELS/CBM•Classroom Observations•Work Samples•Rating Scales•Frequent/Authentic
•Supplemental•AET/Focused Instruction•Social Skills Training•Behavior Plans•AIPs

Example of Tier Level Interventions
Time
Curricular Focus
Curricular Breadth
Frequency of Progress Monitoring
Tier I
90
5 areas
Core
Yearly or greater
Tier 2
120
Less than 5
Core+
Supplemental
Monthly or
greater
Tier 3
180
2 or less
Core+
Supplemental+
Intensive
Weekly
Reading

Criteria for Evaluating Response to Intervention
Is the gap between desired/current rate or gap between slopes of current and benchmark converging? If yes, this is a POSITIVE RtIIs the gap closing but not converging (e.g., parallel)? If yes, this is a QUESTIONABLE RtIIf the rate/slope remains unchanged OR if there is improvement but shows no evidence of closing the gap, then this is a POOR RtI

Looking at Benchmark Data
0
10
20
30
40
50
60
70
80
90
100
Sept Oct No
v
Dec
Jan
Feb
Mar Apr
May
June
School Weeks
Wor
ds C
orre
ct P
Benchmark is Top of Box
Some Risk is inside the box
At Risk is Below the box

LISA
50
0
10
20
30
40
50
60
70
80
90
100
Sept Oct Nov Dec Jan Feb
School Weeks
Wor
ds C
orre
ct P
er M
in
Benchmark

Decision Model at Tier 1- General Education Instruction
Step 1: ScreeningORF = 50 wcpm, fall benchmark for some risk = 44 wcpmComprehension skills are judged as at levels equal to ORF by her teacher Is this student at risk?
No YesMove to Tier 2: Strategic Interventions
Continue Tier 1 Instruction
Lisa
Current Gen Ed Instruction is Working

Latana Grade 2 Tier 1 Oral Reading Fluency
48
71
93
0
10
20
30
40
50
60
70
80
90
100
Sept Oct No
v
Dec
Jan
Feb
Mar Apr
May June
School Weeks
Wor
ds C
orre
ct P

Decision Model at Tier 1- General Education Instruction
Step 1: ScreeningORF at end of 2nd grade is 93 cwpm, end of 2nd benchmark for some risk is 90 cwpmReading comprehension skills are judged as adequate by her teacher. Is this student at risk?
NoYesMove to Tier 2: Strategic Interventions
Continue Tier 1 Instruction
Latana
Current Gen Ed Instruction is Working

Rita
Second grade studentBeginning of school yearRegular EducationScores at 20 wcpm in second grade materialTeacher judges (based on in-class observation/evaluation) comprehension to not be substantially different from ORF

Rita
20
0
10
20
30
40
50
60
70
80
90
100
Sept Oct Nov Dec Jan Feb
School Weeks
Wor
ds C
orre
ct P
er M
in
Benchmark

Decision Model at Tier 1- General Education Instruction
Step 1: ScreeningORF = 20 wcpm, fall benchmark for some risk = 44 wcpmComprehension deficits in all 4 of 5 areas are notedIs this student at risk?
No YesMove to Tier 2: Strategic InterventionsRita
Continue Tier 1 Instruction
Rita
Current Gen Ed Instruction is NOT Working

Data-Based Determination of Expectations: Rita
Benchmark Level: 54 WCPMCurrent Level: 20 WCPMDifference to Feb Benchmark (Gap): 34 WCPMTime to Benchmark: 20 WeeksRate of Growth Required:
34/20= 1.70 WCPM for RitaPeer Group Rate = 1.20 WCPM growth (at benchmark) 1.40 WCMP (for “some risk” benchmark)REALISTIC? Not unless you increase AET

Rita
20
0
10
20
30
40
50
60
70
80
90
100
Sept Oct Nov Dec Jan Feb
School Weeks
Wor
ds C
orre
ct P
er M
Aimline
20 Weeks
34 WCPM
1.70 WCPM

Decision Model at Tier 2- Strategic Interventions & Instruction
Supplemental, small group instruction (3-4 students with similar skill levels)Standard protocol intervention3x per week, 30 minutes eachTeam selects PALS (Peer Tutoring Strategy)Implemented by 2 different available instructional personnelImplemented for 8 weeksProgress monitoring once every 2 weeks

Rita- Tier 2
2024
2835 34
0
10
20
30
40
50
60
70
80
90
100
Sept Oct Nov Dec Jan Feb
School Weeks
Wor
ds C
orre
ct P
er M
Tier 2: Strategic -PALS
Trendline = 1.85 words/week
Aimline= 1.70 words/week
Good RtI

Decision Model at Tier 2- Strategic Intervention & Instruction
ORF = 34 wcpm, winter benchmark (still 8 weeks away) for some risk = 52 wcpmTarget rate of gain over Tier 1 assessment is 1.70 words/week Actual attained rate of gain was 1.85 words/weekGains above benchmark in 4 of 5 comprehension areasStudent on target to attain benchmarkStep 2: Is student responsive to intervention?
NoYesMove to Tier 3: Intensive Interventions
Continue monitoring or return to Tier 1
Rita
Student is Responsive to Intervention

Elsie
Second grade studentEnd of School YearRegular EducationScores at 62 wcpm in second grade materialTeacher judges (based on in-class observation/evaluation) comprehension to not be substantially different from ORF – not great, not terrible

Elsie Grade 2 Tier 1 Oral Reading Fluency
39
53
62
0
10
20
30
40
50
60
70
80
90
100
Sept Oct No
v
Dec
Jan
Feb
Mar Apr
May
June
School Weeks
Wor
ds C
orre
ct P
Benchmark

Decision Model at Tier 1- General Education InstructionStep 1: Screening
ORF = 62 wcpm, end of second grade benchmark for at risk is 70 wcpm (see bottom of box)Compared to other Heartland students, Elsie scores around the 12th percentile + or -Elsie’s teacher reports that she struggles with multisyllabic words and that she makes many decoding errors when she reads Is this student at risk?
No YesMove to Tier 2: Strategic Interventions
This Student is at Risk, General Education Not Working
Elsie
Continue Tier 1 Instruction

Decision Model at Tier 2- Supplemental Instruction
Supplemental, small group instruction will be provided to ElsieShe will participate in two different supplemental groups, one focused on Decoding (Phonics for Reading; Archer) and one focused on fluency building (Read Naturally; Imholt)She will participate in small group instruction 3x per week, 30 minutes each – and she will also continue with her core instructionSupplemental instruction implemented by certified teachers in her school (2 different teachers)Progress monitoring about every 2 weeks

Elsie Tier 2 (Results 2)End of Grade 2 and Grade 3
0
10
20
30
40
50
60
70
80
90
100
110
May
June
Sept Oct No
v
Dec
Jan
Feb
Mar
April
May Jun
School Weeks
Wor
ds C
orre
ct P
Tier 2: Supplemental
Note: Third Grade Msmt.Materials used at end of Second grade and throughThird grade
Aimline = .83 words per week
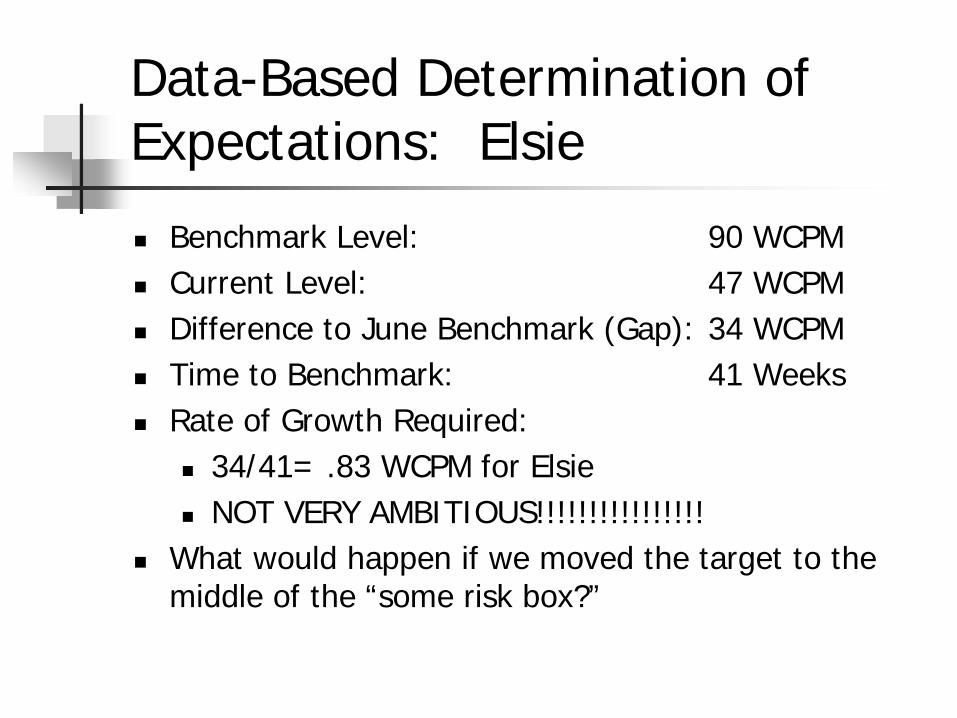
Data-Based Determination of Expectations: Elsie
Benchmark Level: 90 WCPMCurrent Level: 47 WCPMDifference to June Benchmark (Gap): 34 WCPMTime to Benchmark: 41 WeeksRate of Growth Required:
34/41= .83 WCPM for ElsieNOT VERY AMBITIOUS!!!!!!!!!!!!!!!!
What would happen if we moved the target to the middle of the “some risk box?”

Elsie Tier 2 (Results 2)End of Grade 2 and Grade 3
0
10
20
30
40
50
60
70
80
90
100
110
May
June
Sept Oct No
v
Dec
Jan
Feb
Mar
April
May Jun
School Weeks
Wor
ds C
orre
ct P
Tier 2: Supplemental -
Note: Third Grade Msmt.Materials used at end of Second grade and throughThird grade
Aimline = 1.29 words per week

Data-Based Determination of Expectations: Elsie
Benchmark Level: 100 WCPMCurrent Level: 47 WCPMDifference to June Benchmark (Gap): 53 WCPMTime to Benchmark: 41 WeeksRate of Growth Required:
53/41= 1.29 WCPM for ElsiePeer Group Rate = about 1.1 WCPM growth (at benchmark) 1.2 WCMP (for “some risk” benchmark)REALISTIC? Not unless you increase AET

Elsie Tier 2 (Results 2)End of Grade 2 and Grade 3
62
4752
56 58 55 5662
0
10
20
30
40
50
60
70
80
90
100
110
May
June
Sept Oct No
v
Dec
Jan
Feb
Mar
April
May Jun
School Weeks
Wor
ds C
orre
ct P
Tier 2: Supplemental -
Trendline = 1.07 words/week
Note: Third Grade Msmt.Materials used at end of Second grade and throughThird grade
Aimline = 1.29 words per week
Questionable RtI

Tier 2- Supplemental Instruction - Revision
The intervention appeared to be working. What the teachers thought was needed was increased time in supplemental instruction. They worked together and found a way to give Elsie 30 minutes of supplemental instruction, on phonics and fluency, 5x per week.

Data-Based Determination of Expectations: Elsie
Benchmark Level: 100 WCPMCurrent Level: 56 WCPMDifference to June Benchmark (Gap): 44 WCPMTime to Benchmark: 27 WeeksRate of Growth Required:
44/27= 1.62 WCPM for ElsiePeer Group Rate = 1.1 WCPM growth (at benchmark) 1.2 WCMP (for “some risk” benchmark)REALISTIC? Not unless you increase AET

Elsie Tier 2 (Results 2)End of Grade 2 and Grade 3
62
4752
56 58 55 5662
0
10
20
30
40
50
60
70
80
90
100
110
May
June
Sept Oct No
v
Dec
Jan
Feb
Mar
April
May Jun
School Weeks
Wor
ds C
orre
ct P
Tier 2: Supplemental -
Trendline = 1.07 words/week
Note: Third Grade Msmt.Materials used at end of Second grade and throughThird grade
Aimline = 1.62 words per week

Elsie Tier 2 (Results 2)End of Grade 2 and Grade 3
62
4752
56 58 55 5662
65 6673
77 75 76
8982
8892 90
0
10
20
30
40
50
60
70
80
90
100
110
May June
Sept Oct No
v
Dec
Jan
Feb
Mar
April
May Jun
School Weeks
Wor
ds C
orre
ct P
Tier 2: Supplemental -
Trendline = 1.07 words/week
Note: Third Grade Msmt.Materials used at end of Second grade and throughThird grade
Trendline = 1.51words/week
Supplemental Revised
Aimline = 1.62words/week
Good RtI

By the Spring of Third Grade
Elsie’s reading accuracy had improved significantly. Her average % correct hovers around 95 percent.She still struggles with multisyllabic wordsNormatively, at periodic and annual review time, she is now performing at about the 19th
percentile compared to peers from Heartland AEA. She is catching up!Elsie is not a student with a disability

Decision Model at Tier 1- General Education InstructionStep 1: Screening
ORF = on track for 100 wcpm, end of third grade benchmark for some risk is 110 wcpm (see top of box)Compared to other Heartland students, Elsie scores around the 19th percentile + or -Is this student at risk?Still a bit of risk, maintain Tier II instruction for another benchmark period, if progress continues, move to tier 1
No YesMaintain Tier 2: Strategic Interventions
Elsie
Continue Monitoring or Move Back to Tier 1

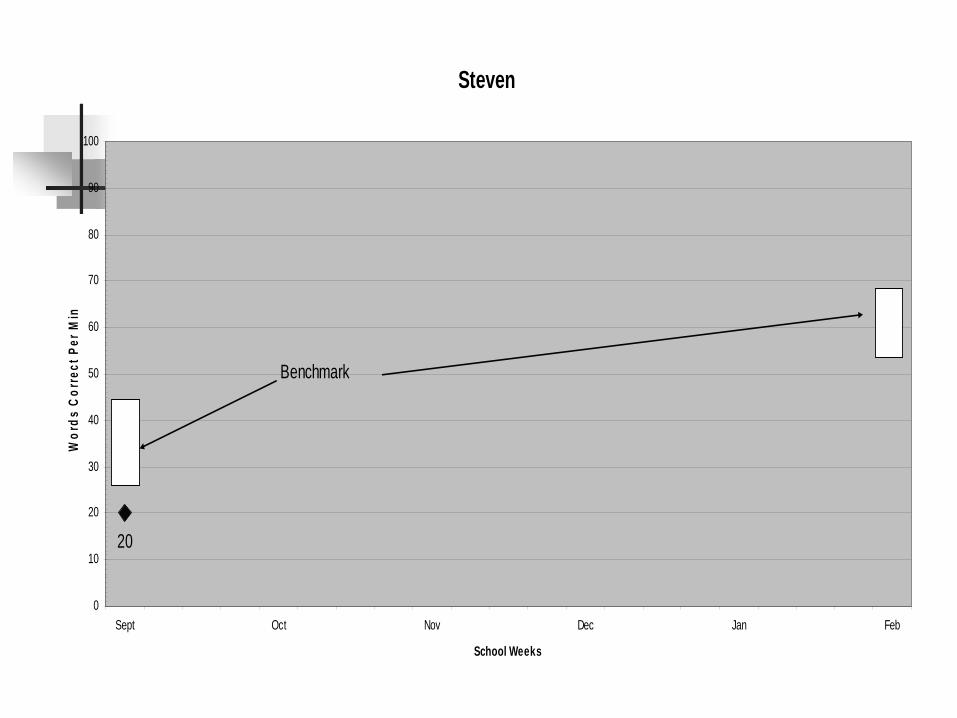
Steven
Second grade studentBeginning of school yearRegular EducationScores at 20 wcpm in second grade materialTeacher judges (based on in-class observation/evaluation) comprehension to not be substantially different from ORF
Steven
20
0
10
20
30
40
50
60
70
80
90
100
Sept Oct Nov Dec Jan Feb
School Weeks
Wor
ds C
orre
ct P
er M
in
Benchmark

Decision Model at Tier 1- General Education Instruction
Step 1: ScreeningORF = 20 wcpm, fall benchmark for some risk = 44 wcpmComprehension screen also shows deficits in all 5 areasCurrent Gen Ed Instruction is NOT WorkingIs this student at risk?
No YesMove to Tier 2: Strategic InterventionsRita
Steven
Continue Tier 1 Instruction

Decision Model at Tier 2- Strategic Interventions & Instruction
Supplemental, small group instruction in Rita’s group (3-4 students with similar skill levels)Standard protocol implementation3x per week, 30 minutes eachTeam selects PALS (Peer Tutoring Strategy)Implemented by 2 different available instructional personnelImplemented for 8 weeksProgress monitoring once every 2 weeks

Steven
20 1822 21
24
0
10
20
30
40
50
60
70
80
90
100
Sept Oct Nov Dec Jan Feb
School Weeks
Wor
ds C
orre
ct P
er M
in
Tier 2: Strategic -PALS
Aimline= 1.50 words/week
Trendline = 0.55 words/week
Poor RtI

Decision Model at Tier 2- Strategic Intervention & Instruction
Step 2: Is student responsive to intervention?ORF = 24 wcpm, winter benchmark (still 8 weeks away) for some risk = 52 wcpmTarget rate of gain over Tier 1 assessment is 1.5 words/week Actual attained rate of gain was 0.55 words/weekBelow comprehension benchmarks in 4 of 5 areasStudent NOT on target to attain benchmarkIs student responsive to intervention at Tier 2?
NoYesMove to Tier 3: Intensive Interventions
Steven
Continue monitoring or return to Tier 1

Decision Model at Tier 3- Intensive Interventions & Instruction
Supplemental, 1:3, pull-out instructionIndividualized Problem-Solving, Targeted InstructionSpecific decoding and analysis strategies Emphasis on comprehension strategies5x per week, 30 minutes eachImplemented by 2 different available instructional personnelImplemented for 8 weeksProgress monitoring once every week
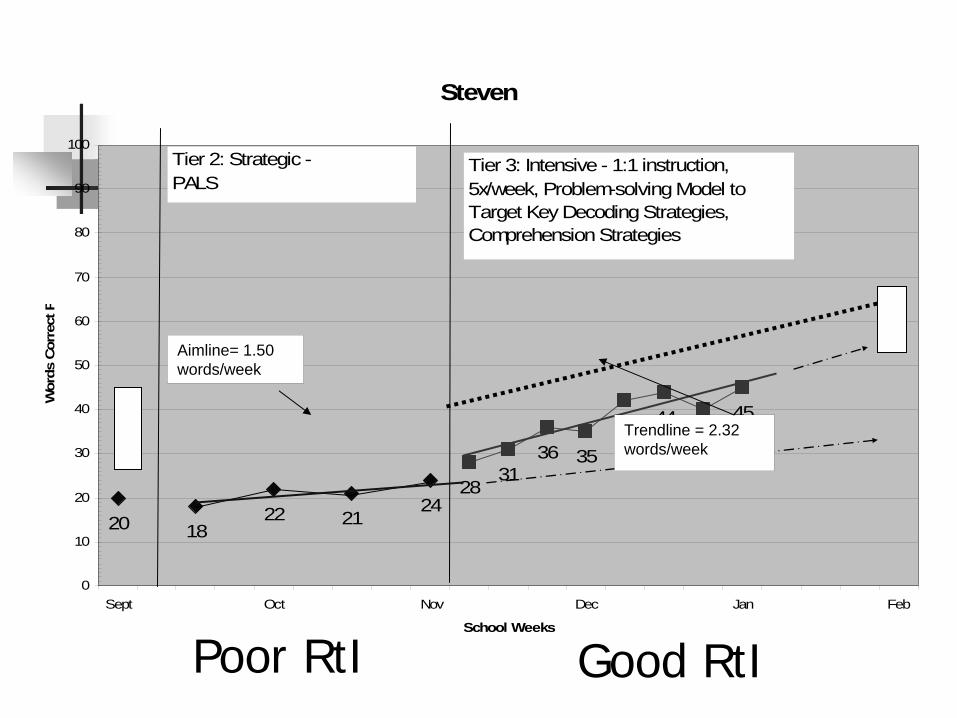
Steven
20 1822 21
2428
3136 35
42 4440
45
0
10
20
30
40
50
60
70
80
90
100
Sept Oct Nov Dec Jan Feb
School Weeks
Wor
ds C
orre
ct P
Tier 2: Strategic -PALS
Tier 3: Intensive - 1:1 instruction, 5x/week, Problem-solving Model to Target Key Decoding Strategies, Comprehension Strategies
Aimline= 1.50 words/week
Trendline = 2.32 words/week
Good RtIPoor RtI

Decision Model at Tier 3- Intensive Intervention & Instruction
Step 3: Is student responsive to intervention at Tier 3?ORF = 45 wcpm, winter benchmark (still 4 weeks away) for some risk = 52 wcpmTarget rate of gain over Tier 2 assessment is 1.5 words/week Actual attained rate of gain was 2.32 words/weekAt or above comprehension benchmarks in 4 of 5 areasStudent on target to attain benchmarkStep 3: Is student responsive to intervention?Move student back to Strategic intervention
NoYesMove to Sp Ed Eligibility Determination
Steven
Continue monitoring or return to Tier 2

Criteria for Evaluating Response to Intervention: Dilemmas
Currently, many educators “understand” the ability/achievement discrepancy concept.Unless this concept is replaced with another one that makes MORE sense to them, the old concept will prevail.We have to guard against the, “of course they do not have a good RtI…we cannot expect them to…that’s why I referred them.”A positive response IS WHAT WE EXPECT, we just have to problem-solve until we get it.

IMPLEMENTATION

Change is Hard for Some

Outline – Implementing An RtI System
Tier 1 Decision MakingCollect and evaluate universal screening data against criterion for successful Core (many suggest 80% proficiency based on Core instruction)If modification of the Core is needed
Conduct curriculum diagnostic assessment – compare core curriculum against a standard if available (e.g., Kame’enui & Simmons) or evaluate core using problem analysis proceduresCreate hypotheses and predictionsModify curriculum and instructionEvaluate curriculum and instruction modifications
Monitor sufficiency of core each time universal screening is completed – modify as necessary

Outline – Implementing An RtI System
Tier 2 Decision Making – Dx Assm’t OptionIdentify less than proficient studentsAdminister additional brief assessments to examine performance profilesGroup students with like performance profiles for supplemental instructionProvide supplemental instruction based on skill needsMonitor progressReview student progress monitoring data at scheduled intervalsModify supplemental instruction as necessaryMove students across tiers as data warrant

Outline – Implementing An RtI System
Tier 2 Decision Making – Standard TxIdentify less than proficient studentsGroup students for supplemental instruction and provide supplemental instructionMonitor progress about 1 time every 2 weeksReview student progress monitoring data at scheduled intervalsModify supplemental instruction as necessary based on progress monitoring dataMove students across tiers as data warrant

Outline – Implementing An RtI System
Tier 3 Decision MakingConduct additional, instructionally relevant diagnostic assessments to determine more precisely student performance profileCreate individual hypotheses and predictions based on student performanceMatch intensive instruction to student performance needs (identify resources within the school to support intensive instruction, e.g., title 1, ELL, SPED)Monitor progress at least once a weekModify intensive instruction as necessary based on progress monitoring dataMove students across tiers as data warrant

RtI: Lynnville-Sully Elementary
Vision: Meeting all kids’ needs in a timely,
proactive manner.

All About Lynnville-Sully Elementary
Students203 students k-52 sections per grade level
Additional Staff1/2 time TAG/4-5th gr. Reading Support Teacher1/2 time K-3rd gr. Reading SupportTitle One Teacher (k-3)Two 1/2 time associates2 Special Ed. Associates

Needs DeterminedCore was not meeting needs of 30% of kidsNo time for teachers to collaborateInterventions lacked focus and documentationMany individual student referralsTeachers unclear on grade level expectations

Response to NeedsReading inventory completed Staff development providedShifts in core instructionRevisions of reading standards and benchmarks and addition of indicatorsDaily schedule revised
Collaboration time plannedDiagnostic assessments usedFocus on group interventions with written plans and progress monitoring

Data: Role at Lynnville- Sully Elementary
“Data Days” began Fall 20063 times a yearGrade level teams meet- 1 hour
Review all screening, diagnostic, and progress monitoring assessment dataDetermine core needs (if any)Determine group interventions, fill out forms, plan for progress monitoring, and set date to meet back

RtI Reading Process Sample
Addl.Diagnostic
Assessment
InstructionResults
Monitoring
IndividualDiagnostic
IndividualizedIntensive
weekly
All Students at a grade level
Fall Winter Spring
screening
None ContinueWithCore
Instruction
GradesClassroom
AssessmentsYearly ITBS/ITED
GroupDiagnostic
SmallGroupDifferen-tiatedBy Skill
2 times/month
Step 1Step 2 Step 3 Step 4
Supplemental
1-5%
5-10%
80-90%
Core
Intensive
Teacher will make sure:1. All students have beengiven the DIBELS assessment2. All data has been entered3. A copy of the class-wide datais printedQuestions/concerns: ContactBuilding Principal
Teacher will:1.Calculate what percentof the class is at benchmark2. If below 80%, determine“core” instructional needs(Beef-up based on data)Questions/Concerns: K-3 Contact Reading
Teachers4-6 Contact ____-building
teacher w/reading background
Teacher will:1.Place all non-proficientstudents into the 4-Boxes2.Determine if there is a need for additional diagnostic assessment(s)-see grade level sheet3.Ensure diagnosticassessments are given4.Bring all data to grade level meetingsQuestions/Concerns:K-3 Contact Reading
Teachers4-6 Contact _____ Building
Teacher with Rdg. Background
Grade Level Data Meetings:1.Disiuss briefly additions/changesmade to core2.Share 4-Box data and other diagnosticdata results.3. Group kids with similar instructional needs.(COMPARE TO PRIOR GROUPING-
IF AVAILABLE)4. Complete the group interventionPlan form.(one per group)-Who, what, when, where of instruction-Who, what, when, where of monitoring-Who and when of parent notificationNOTE: if any changes are made duringIntervention period, document on form.5. Attach an implementation logand graphs6. Set date to meet back for check-in(4-6 weeks)Questions/Concerns: District BasedTeam& IDM Team, Content Specialist
Prior to Grade Level Data Meetings

Keys to Success: Tier 2 and 3 Interventions
Screening, diagnostic, progress monitoring assessmentsInstruction/Materials matched to instructional needs of students
Examples: Read Naturally, Great Leaps, Quick Reads, REWARDS, Corrective Reading, Reading Mastery, Phonics for Reading, etc.
Training for interventionistsFlexibility of groups

RESULTS:1 Year of ImplementationLynnville-Sully Elementary Proficiency DataTarget Assessment Chosen: DIBELS (At Benchmark)Spring Data- 2005-06 2006-07
1st Grade 79% 83%2nd Grade 48% 81%3rd Grade 39% 79%4th Grade 50% 58%5th Grade 56% 80%

Response to Intervention:
A thinking process as well as a doing process.A systemic approach.Proactive rather than reactive.A journey of continuous improvement.