phase ii-8 - scholarspace.manoa.hawaii.edu · marine conditions 3 ... crevice corrosion data from...
TRANSCRIPT

LIBRARY STAT.: OF HAWAII
DEPARTMENT OF OUS!NESS AND ECONOMIC DEVEI.O?MENT & TOURISM
P. 0. Box 23S9 ttano.ulu. Hawau 8680t
HAWAII DEEP WATER CABLE PROGRAM
PHASE II-8
TASK 3
CABLE MATERIALS CORROSION
AND ABRASION TESTING
TK3351 Larsen- Basse, J. + H35 University of Hawaii at PIIB t'lanoa. Hawai i Natural i3 Energy i nstltute
Cable t·1aterials Corrosion and Abrasion Testing g and Economic Development

HAWAII DEEP WATER CABLE PROGRAM
PHASE li-B
TASK 3
CABLE MATERIALS CORROSION
AND ABRASION TESTING
Prepared by
J. Larsen-Basse
Hawaii Natural Energy Labratory
for
Parsons Hawaii
Hawaiian Electric Company, Inc.
and the
State of Hawaii
Department of Planning and Economic Development
OCTOBER 1986

List of Tables • List of Figures Abstract • • • • 1.0 PUrpose •••
TABLE OF CONTENTS
2.0 Relationship to overall HDWC Program 3. 0 Technical Tasks . • • • 3.1 General Conditions
3.1.1 Time Period covered 3.1.2 Materials ••••• 3.1.3 Test Sites and Environments
3.2 Subtask (a): Long-Term corrosion Tests 3.2.1 Background ••••• 3.2.2 Experimental Details 3. 2.3 Results 3.2.4 Discussion •••.• 3.2.5 conclusions •••• 3.2.6 References to Subtask (a)
3.3 Subtask (b): Crevice Corrosion Testing of Stainless Steels 3.3.1 Background .............•• 3.3.2 crevice Corrosion Theory; Brief outline 3.3.3 Experimental Details 3.3.4 Results 3.3.5 Discussion ••••• 3.3.6 Conclusions •.•• 3.3.7 References to Subtask (b) .•••••••••••
3.4 Subtask (c): Abrasion of cable Materials Under Simulated Marine conditions 3.4.1 Background • • ••.•• 3.4.2 Brief Review of the Literature 3.4.3 Experimental •••••• 3.4.4 Results and Discussions 3.4.5 conclusions •••••. 3.4.6 References to Subtask (c) • • • • • •
3.5 Subtask (d): Corrosion Fatigue of Lead in Seawater 3.5.1 Background •.......... 3.5.2 Fatigue of Lead; Brief survey of the Literature 3.5.3 Experimental Details ••• 3.5.4 Results and Discussion •• 3.5.5 Conclusions ••••••• 3.5.6 References to Subtask (d).
4.0 Personnel •• 5.0 Publications
Page -i-
iii vi 1 1 1 1 1 1 2 2 2 3 4 5
10 10 74 74 74 78 79 79 82 83
123
123 123 126 129 131 132 163 163 163 164 166 167 168 180 180
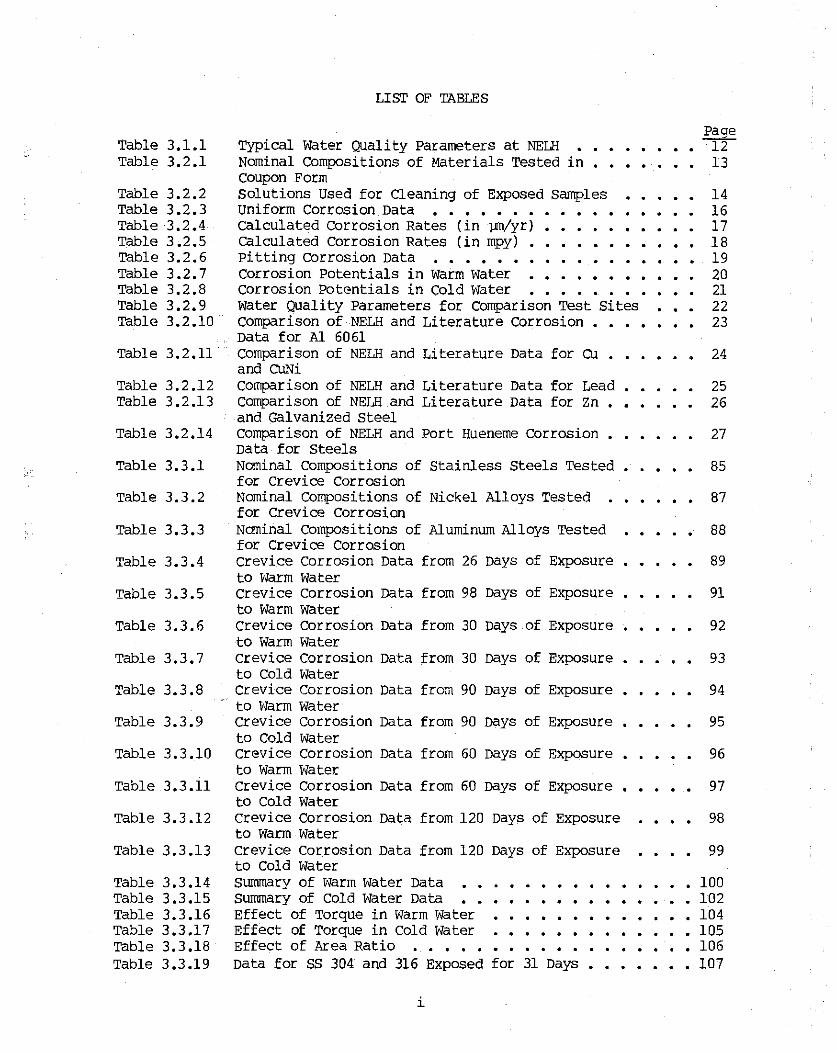
Table 3,1.1 Table 3.2.1
Table 3.2.2 Table 3.2.3 Table 3.2.4 Table 3.2.5 Table 3.2.6 Table 3.2.7 Table 3.2.8 Table 3.2.9 Table 3.2.10
Table 3.2.11 ·
Table 3. 2.12 Table 3.2.13
Table 3.2.14
Table 3.3.1
Table 3.3.2
Table 3.3.3
Table 3.3.4
Table 3.3.5
LIST OF TABLES
Typical water Quality Parameters at NELH Nominal compositions of Materials Tested in coupon Form Solutions Used for Cleaning of Exposed Samples Uniform Corrosion Data • • • • • • • calculated Corrosion Rates (in ~yr) calculated Corrosion Rates (in mpy) Pitting corrosion Data •••••• corrosion Potentials in warm water corrosion Potentials in Cold Water Water Quality Parameters for Comparison Test Sites comparison of NELH and Literature corrosion • Data for Al 6061 comparison of NELH and Literature Data for cu and CUNi Comparison of NELH and Literature Data for Lead comparison of NELH and Literature Data for zn and Galvanized steel Comparison of NELH and Port Hueneme Corrosion nata for steels Nominal Compositions of Stainless Steels Tested for Crevice Corrosion Nominal Compositions of Nickel Alloys Tested for Crevice Corrosion Nominal compositions of Aluminum Alloys Tested for Crevice Corrosion crevice corrosion Data from 26 nays of Exposure to Warm Water crevice corrosion Data from 98 Days of Exposure to Warm water
Table 3.3.6 crevice Corrosion Data from 30 nays of Exposure to Warm water
Table 3.3.7 crevice Corrosion Data from 30 Days of Exposure to Cold water
Table 3.3.8 Crevice Corrosion Data from 90 Days of Exposure to Warm water
Table 3.3.9 crevice Corrosion Data from 90 nays of Exposure to Cold water
Table 3.3.10 Crevice Corrosion Data from 60 Days of Exposure to warm water
Table 3.3.11 crevice Corrosion Data from 60 Days of Exposure to Cold Water
Table 3.3.12 crevice Corrosion Data from 120 Days of Exposure to warm water
Table 3.3.13 crevice Corrosion Data from 120 Days of Exposure to Cold Water
Table 3.3.14 Table 3.3.15 Table 3.3.16 Table 3.3 .17 Table 3.3.18 Table 3.3.19
summary of warm water Data summary of Cold Water Data Effect of Torque in warm water Effect of Torque in Cold water Effect of Area Ratio • • • • Data for SS 304 and 316 Exposed for 31 Days
i
Page 12
13
14 16 17 18 19 20 21 22 23
24
25 26
27
85
87
88
89
91
92
93
94
95
96
97
98
99
100 102 104 105 106 107
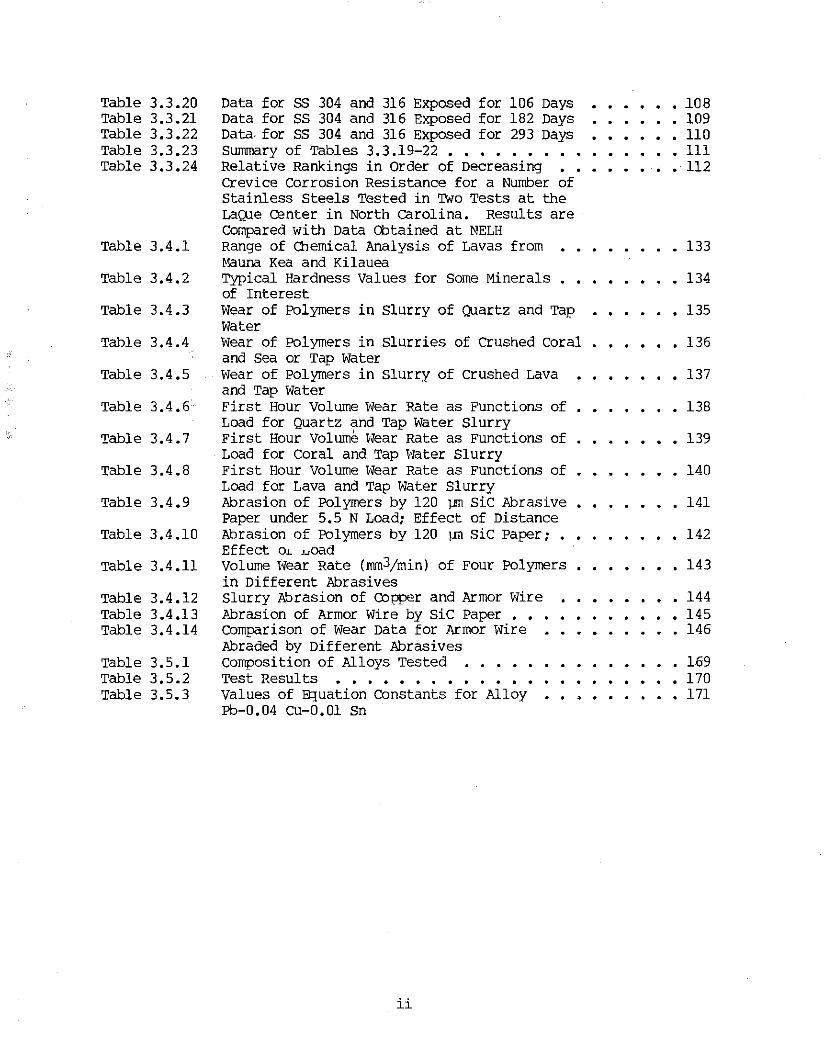
Table 3.3.20 Table 3.3.21 Table 3.3.22 Table 3.3.23 Table 3.3.24
Table 3.4.1
Table 3.4.2
Table 3.4.3
Table 3.4.4
Table 3.4 .5
Table 3.4.6
Table 3.4.7
Table 3.4.8
Table 3.4 .9
Table 3.4.10
Table 3.4 .11
Table 3.4.12 Table 3.4.13 Table 3.4 .14
Table 3.5.1 Table 3.5.2 Table 3.5.3
Data for ss 304 and 316 Exposed for 106 Days Data for ss 304 and 316 Exposed for 182 Days Data. for ss 304 and 316 Exposed for 293 Days Summary of Tables 3.3.19-22 •• Relative Rankings in Order of Decreasing Crevice Corrosion Resistance for a Number of stainless Steels Tested in TWo Tests at the LaQue center in North carolina. Results are Compared with Data Obtained at NELH Range of Chemical Analysis of Lavas from ~launa Kea and Kilauea Typical Hardness Values for Some Minerals of Interest Wear of Polymers in Slurry of Quartz and Tap Water Wear of Polymers in slurries of Crushed coral and sea or Tap water Wear of Polymers in Slurry of crushed Lava and Tap water First Hour Volume Wear Rate as Functions of Load for Quartz and Tap Water Slurry First Hour Volume vJear Rate as Functions of Load for Coral and Tap Water Slurry First Hour Volume Wear Rate as Functions of Load for Lava and Tap Water Slurry Abrasion of Polymers by 120 ~ sic Abrasive Paper under 5.5 N Load; Effect of Distance Abrasion of Polymers by 120 ].Ill sic Paper; • Effect OL .woad volume wear Rate (mm3/min) of Four Polymers in Different Abrasives Slurry Abrasion of Cbpper and Armor Wire Abrasion of Armor Wire by SiC Paper • • Comparison of Wear Data for Armor Wire Abraded by Different Abrasives Composition of Alloys Tested Test Results •..•••.••. Values of Equation Constants for Alloy Pb-0.04 cu-0.01 sn
ii
108 109 110 111 112
133
134
135
136
137
138
139
140
141
142
143
144 145 146
169 170 171

Lisr OF FIGURES
Figure 3.1.1 General Lay-out of the water Supply systems at NELH
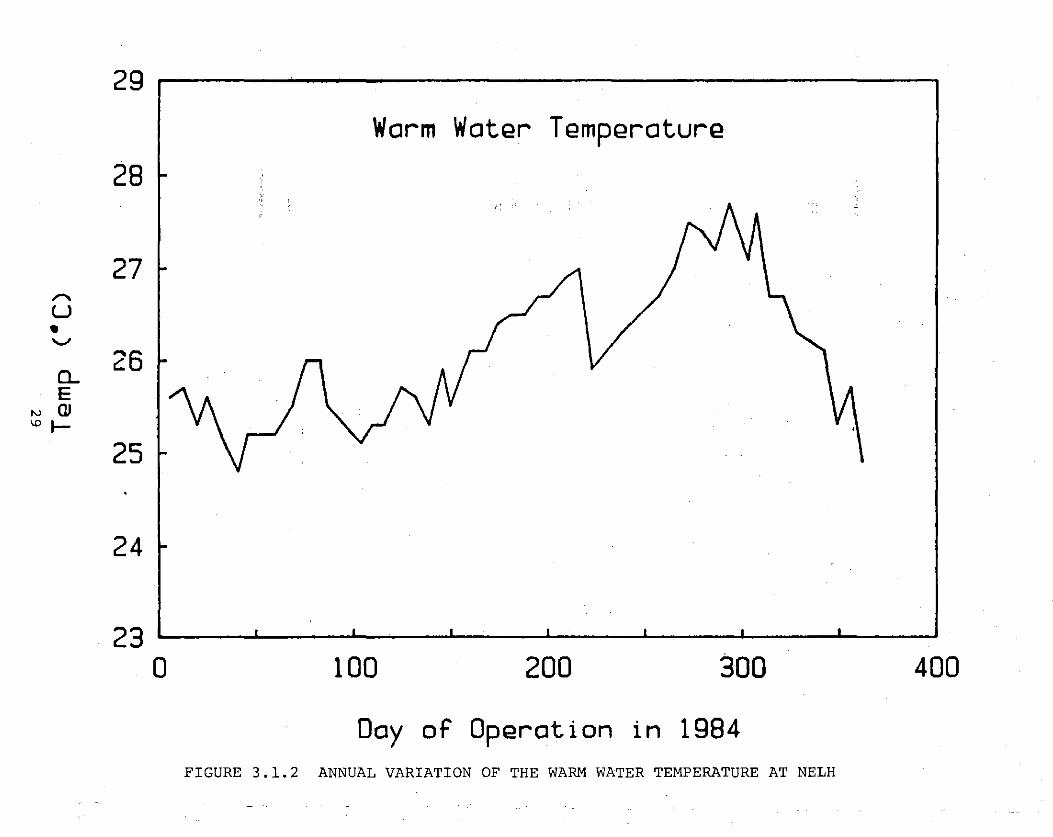
Figure 3.1.2 Annual Variation of the warm Water
Figure 3.2.1
Figure 3.2.2 Figure 3.2.3 Figure 3.2.4 Figure 3.2.5 Figure 3.2.6 Figure 3,2. 7 Figure 3.2.8 Figure 3,2.9 Figure 3.2.10 Figure 3.2.11 Figure 3.2.12 Figure 3.2.13
Figure 3.2.14
Figure 3.2.15
Figure 3.2.16
Figure 3.2.17 Figure 3.2 .18 Figure 3.2.19 Figure 3.2.20 Figure 3.2.21 Figure 3.2.22 Figure 3.2.23 Figure 3.2 .24 Figure 3.2.25 Figure 3.2.26 Figure 3.2.27
Figure 3.2.28
Figure 3.2.29
Figure 3.2.30
Figure 3.2 .31 Figure 3.2.32 Figure 3.2.33 Figure 3.2.34 Figure 3.2.35 Figure 3.2.36 Figure 3.2.37 Figure 3.2.38 Figure 3.2.39
Temperature at NELH Dimensions of Wooden Troughs Used for corrosion Tests General Lay-out of the Test Troughs • Average Penetration Data for Al 606l-T6 Average Penetration Data for: Copper • Average Penetration Data for cu-30Ni Average Penetration Data for Lead • • Average Penetration Data for Zinc • • Average Penetration Data for Galvanized Steel Average Penetration Data for Low-carbon Steel Average Penetration Data for High-carbon Steel Average Penetration Data for Low-Alloy steel 4130 Average Penetration Data for: Low-Alloy Steel 4340 Average Penetration Data for Plain Samples of Stainless steel 304 Average Penetration Data for Plain Samples of stainless "Steel 316 Average Penetration Data for stainless steel 304 Exposed as crevice Corrosion Specimen Average Penetration Data for: Stainless Steel 316 Exposed as crevice Corrosion Specimen Corrosion Rate Data for Al 6061-T6 corrosion Rate Data for: Copper corrosion Rate Data for cu-30Ni corrosion Rate Data for: Lead corrosion Rate Data for Zinc corrosion Rate Data for Galvanized Steel corrosion Rate Data for: Low-carbon steel Corrosion Rate Data for High-carbon steel Corrosion Rate Data for: Law-Alloy steel 4130 corrosion Rate Data for: Low-Alloy Steel 4340 Corrosion Rate Data for Plain Samples of Stainless steel 304 Corrosion Rate Data for Plain Samples of stainless Steel 316 Corrosion Rate Data for Stainless Steel 304 Exposed as crevice Corrosion Sample corrosion Rate Data for stainless steel 316 Exposed as crevice corrosion Sample corrosion Potentials of Al 606l-T6 corrosion Potentials of Copper corrosion Potentials of cu-30Ni corrosion Potentials of Lead corrosion Potentials of Zinc • • corrosion Potentials of Galvanized steel Corrosion Potentials of Law-carbon Steel Corrosion Potentials of High-carbon steel Corrosion Potentials of Law-Alloy steel 4130
iii
•
Page 28
29
30
31 32 33 34 35 36 37 38 39 40 41 42
43
44
45
46 47 48 49 50 51 52 53 54 55 56
57
58
59
60 61 62 63 64 65 66 67 68

Figure 3.2.40 Figure 3.2 .41
Figure 3.2.42
Figure 3.2.43
Figure 3.2.44
Figure 3.3.1 Figure 3.3.2 Figure 3.3.3
Figure 3 .3 .4 Figure 3.3.5
Figure 3.3.6 Figure 3.3.7 Figure 3.3. 8
Figre 3.3.9
Figure 3.3.10
Figure 3.3.11
Figure 3.4.1
Figure 3.4.2
Figure 3.4.3
Figure 3.4 .4
Figure 3.4.5
Figure 3.4. 6
Figure 3.4. 7
Figure 3.4.8
Figure 3.4. 9
Figure 3.4.10
Figure 3.4.11
corrosion Potentials of Low-Alloy steel 4340 corrosion Potentials of Plain Samples of stainless .steel 304 Corrosion Potentials of Plain Samples of Stainless steel 316 corrosion Potentials of crevice Corrosion Test Samples of Stainless Steel 304 corrosion Potentials of crevice corrosion Test Samples of Stainless Steel 316 The Four stages of crevice Corrosion • • Factor Affecting crevice Corrosion • • Model Predictions of Geometric Limitations to the Resistance of SS 304 and SS 316 to crevice Corrosion Attack in seawater Details of Multiple crevice Assembly Effect of Exposure Time on the Number of Sites Attacked in Warm Water. ~1aximum
Possible = 40 Sites Maximum Depth of Attack in vJarm water . • • • • Average Depth of Attack in Warm Water • • • • • Maximum Depth of Attack in warm and Cold water for ss 304 Exposed in the Second set of Tests Average Depth of Attack in warm and Cold Water for ss 304 Exposed in the Second Set of Tests Maximum Depth of Attack in warm and cold water for ss 316 Exposed in the Second set of Tests Average Depth of Attack in warm and Cold Water for ss 316 Exposed in the Second set of Tests Volume wear of Plexiglas With Time in Three Different Tap Water Slurries, 5.5 N Load Volume wear of PVC With Time in Three •• Different Tap Water Slurries, 5.5 N Load Volume wear of Delrin With Time in Three Different Tap water Slurries, 5.5 N Load Long-term wear of Plexiglas in TWo Different Tap water Slurries, 5.5 N Load Long-term wear of High Density Polyethylene • in Two Different Tap Water Slurries, 5.5 N Load wear of Plexiglas in Tap Water and Seawater Slurries with Crushed Coral, 5.5 N Load wear of Polypropylene in Tap water and seawater Slurries with crushed coral, 5.5 N Load wear of Delrin in Tap water and seawater slurries with Crushed coral, 5.5 N Load wear-load nata for one Hour Abrasion of • Delrin in coral and Quartz Slurries wear-load nata for One Hour of High Density Polyethylene in coral and Quartz Slurries wear-load nata for One Hour of PVC in Coral and Lava Slurries
.
69 70
71
72
73
113 113 114
115 116
117 118 119
120
121
122
147
148
149
150
151
152
153
154
155
156
157
Figure 3.4.12 wear-distance curves for Abrasion of Plexiglas 158 and Polypropylene Against 120 ]JI1 SiC Abrasive Paper at 5.5 N Load
Figure 3.4.13 >~ar Rate-load curves for Abrasion of Plexiglas ••• 159 and Polypropylene Against 120 ]JI1 SiC Abrasive Paper
iv

Figure 3.4.14
Figure 3.4.15
Figure 3.4.16
Figure 3.5.1
Figure 3.5.2
Figure 3.5.3
Figure 3.5.4 Figure 3.5.5
Figure 3.5.6
Figure 3.5.7
Figure 3.5.8
Wear-time curves for Abrasion of Armor Wire in Crushed coral Slurries Wear-time curves for Abrasion of Armor Wire in Lava Slurries Wear-distance CUrves for Abrasion of Armor Wire by SiC Abrasive Paper Influence of Strain and Frequency on the Number of cycles Required to cause Failure in Acid Lead [ 4] Variation in Strain of Outer Fibers Due to • • • • • the Complete cycle of the Moveable Arm in the Tester Strain Calibration for Different Lengths of • U-bend Samples. Strains are also Compared with the Values 11easured by Eckel [ 4]; All Samples with 0.125" Thickness. U-bend Fatigue Specimen • • • • • • • • • • • Fatigue Data for Alloy Pb-0.04 cu-0.01 su •• in Various Environments, Showing the Total Range of Data Obtained Fatigue Data for Alloy Pb-0.04 cu-0.01 Su ••• in Air and in Various Fresh Water Environments Fatigue Data for Both Alloys in various • Seawater Environments Fatigue Data for Samples Pre-corroded in NELH Seawater for 225 Days Before Testing in Air at 25°C. Data for Samples Tested in Air Directly After Preparation are Shown for comparison
v
160
161
162
172
173
174
175 176
177
178
179

Abstract
This report presents data on the resistance of some typical power cable materials and common reference materials to deterioration in the marine environment as it exists in the general region of the proposed route of the Hawaii Deep water Cable (HDWC). The work was divided into four tasks:
o long-term corrosion tests in Hawaiian surface and deep ocean seawater,
o crevice corrosion testing of stainless steels in these waters, o abrasion testing against slurries of Hawaiian marine rock
fragments, and o corrosion-fatigue testing of lead in seawater and other
environments,
The work was performed in the Marine Materials Laboratory on the campus of the University of Hawaii in Honolulu and at the Natural Energy Laboratory of Hawaii (NELH) on the island of Hawaii. All corrosion tests and all other tests in flowing seawater were conducted at NELH where two seawater systems are available side by side. One system pumps clean off-shore surface seawater to the laboratory. The water temperature ranges between 25 and 28°C over the year and the water is typical of open ocean tropical seawater, The other system brings in seawater from a depth of about 600 m (2,000 feet). This water has a temperature of 7-l0°C and has lower pH and oxygen content than the warm water. It is typical of OTEC-type condenser cooling water.
corrosion Tests
Coupons of test materials were exposed in slowly flowing warm surface and cold deep ocean seawater at NELH. Exposure periods of 1, 3, 6 and 10 months were used. Sample potentials versus Ag/AgCl reference electrode were measured at intervals. After removal the samples were evaluated by standard techniques. The results can be summarized as follows,
Aluminum 6061-T6: Corrosion in the surface water is in general agreement with rates found in other parts of the world, The samples showed some pitting, which also is in agreement with data from other locations but which is at variance with results from tests of similar alloys in the OTEC program at NELH and in other tropical seas. The reason for the difference is not clear at this stage,
In the cold water the aluminum alloy corrodes 4-6 times faster than in the warm and is rapidly destroyed by pitting and edge attack, This is consistent with results from NELH and from around the world.
cu and Cu-lONi: behave almost identically. The cold water is slighly more corrosive than the warm but gives a more uniform attack. There is some tendency for crevice corrosion in the warm water, overall corrosion rates are low (10-20 ~m after one year) and are in general agreement with data from elsewhere.
Lead: corrodes uniformly and at a low rate (-lo~m/y after one year) in both waters.
vi

Zinc: the warm water samples initially corrode slightly faster than the cold water samples but after one month the ranking is reversed. At ten months the average corrosion rates were 55 prn/y in the cold water and 40 prn/y in the warm. The samples showed minor pitting and crevice corrosion and exhibited a very constant corrosion potential during the entire test period. The corrosion data fall in the general band of results reported from around the world.
Galvanized Steel: showed corrosion-time curves similar to those found for pure zinc but at lower values with corrosion rates of 30 prn/y in cold water and 25 pm/y in warm.
Carbon and Low Alloy Steels: steels 1090, 4130 and 4340 showed almost identical corrosion behavior and had corrosion rates in the warm water which are 3.5-5 times greater than in the cold. Low carbon steel 1006 corroded considerably less in both waters. Penetration values after ten months of exposure were 30 and 70 pm for steel 1006 in cold and warm water, respectively, 25 and 130 pm for the two alloy steels in these two waters, and 30 and 160 pm for steel 1090. Hawaiian surface seawater appears to be more corrosive than seawater at other test sites around the world, generally, while the deep water data are similar to the (few} others reported in the literature. Sulfate reducing bacteria are very evident in the warm water corrosion products and appear to also participate in the cold water corrosion reactions.
Stainless Steels 304 and 316: corrode by pitting which is more severe for ss 304 and more severe in the warm water than in the cold. SS 316 appears to establish maximum pit depths of 50 pm in cold water and 100 pm in warm during the early part of the exposure with little growth with time. For ss 304 the maximum pit depth increases with time to 120 pm in cold water and 410 pm in warm after ten months of exposure.
In general, the results have shown that the Hawaiian surface seawater is quite similar in corrosiveness (within a factor of two or three} to seawaters elsewhere; and that the deep ocean seawater is generally less corrosive than the surface water. Exceptions are shown by aluminum alloys, for which pitting is much more pronounced in the cold water, and zinc and galvanized coatings, which corrode about 50% faster in the deep ocean seawater.
Crevice Corrosion of Stainless Steels
standard multiple-crevice-assembly (MCA} test samples were used. The materials included two common standard austenitic stainless steels for comparison purposes (SS 304 and 316}; higher alloyed austenitic steels with 20% cr and 12-26% Ni and with additions of 1.5-7% Mo and 0-2% cu (Nitronic 50, 254 SMO, Al-6X, Al-6XN, Jessup 700 and Jessup 777}; a high alloy, Me-containing ferritic stainless steel (29-4C} and a duplex austenitic-ferritic (50-50%} steel (Ferralium 255}. For comparison two high-nickel alloys (Hastelloy G3 and Hastelloy 276} were also tested as were several aluminum alloys.
The samples were exposed in slowly flowing warm surface and cold deep ocean seawaters at NELH for periods of 26 to 120 days.
vii

In general, crevice corrosion rates were significantly lower in the cold water than in the warm. While the results showed considerable scatter, the severity of attack generally increased with exposure time and with the cathode:anode area ratio (area of boldly exposed surface: area of crevices). The general ranking of the alloys is given below:
warm Water
Aluminum 2024 Fully resistant Aluminum 3003
Aluminum 5456 Aluminum 6061-T6
stainless steel 29-4C stainless Steel Jessup 700 Ni-alloy Hastelloy 276
Rank Attacked Stainless steel Jessup 277 2
Stainless steel 254 SMO 3 stainless Steel Al-6XN 4 Ni-alloy Hastelloy G-3 5 Stainless steel Ferralium 255 6 stainless steel Al-6X 7 Stainless steel 316 12 Stainless steel Nitronic 50 l3 stainless steel 304 16
Cold Water
Fully resistant Stainless steel 29-4C Stainless Steel Ferralium 255 Stainless Steel Al-6X Ni-alloy Hastelloy 276
Attacked stainless 254 SMO 2 Stainless Al-6XN 3 Ni-alloy Hastelloy G-3 6 Al-alloy 606l-T6 6 Stainless Nitronic 50 7 stainless 304 12 Al-alloy 2024 12 Al-alloy 3003 12 Stainless 316 16
*Ranking based on qualitative scale from 1: fully resistant to 16: worst case, perforation and tunneling.
viii

The results are in general agreement with data obtained elsewhere.
ABRASION TESTS
During deployment of the HDWC it is conceivable that sections of the cable will become suspended between outcroppings of rock on the ocean floor. Tidal currents acting on the suspended sections could result in abrasion of the cable against the rock. The present study was initiated in order to obtain preliminary data on the abrasiveness of typical marine rocks from the Hawaiian area to the commonly used cable materials and to some reference materials.
The rocks used for testing were coral and lava. Both were used in crushed form (300-400 ~m) as slurries in a test modeled on ASTM's Miller Abrasivity Index Test. Loaded samples were moved in reciprocating motion through trays filled with slurries of the abrasive and either fresh water or seawater. The weight loss with time and load was determined. Comparison tests with silica sand abrasive slurries and with dry silicon carbide abrasive papers were also carried out.
A number of polymer materials were tested as was galvanized steel 1025 armor wire (cold drawn).
The results shCMed that the crushed lava gives wear rates which are 2·-3 times greater than for coral when abrading polymers and one order of magnitude greater when abrading armor wire. This is probably due to the hardness of the olivine grains and their tendency to self-sharpen.
The general ranking of the various polymers was the same for all abrasives used, even though the wear rates and the wear mechanisms were significantly different. Ranked according to increasing wear resistance the tested polymers fall on the following list:
Increasing wear resistance
Plexiglas PVC High-Density Polyethylene Delrin Polypropylene Teflon Nylon 6/6
Substitution of seawater for the fresh water in the slurries has no effect on the wear of the polymers while it does result in increased wear of the armor wire. Details of the effects of frequency, exposure period, etc. will have to be determined in future studies.
A rough estimate of the possible long-term effects of abrasion by lava due to tidal forces on the cable shows that this factor, in combination with recurring corrosion of the freshly exposed surfaces, could be life-limiting for the cable under certain conditions. Additional work appears to be warranted.
corrosion Fatigue of Lead
In order to obtain some information on the fatigue behavior of lead
ix

sheathing materials in the deep sea, tests were conducted at various temperatures and in various environments. A U-bend sample configuration was used with a load frequency of 28 cycles per minute. Samples were tested in fully reversed strain cycling in the total strain range of 0,1-0. 7%. Total cycles to failure fell in the range 6,000-12,500 cycles at 0. 7% strain and 15,000-100,000 cycles at 0.25% strain, depending on alloy. The effects of alloying for strengthening have a pronounced effect on fatigue life in the lower strain range while the effect is negligible in the high strain region.
The curves follow the relationship
Ef = E1 - S ln Nf
where Ef is the total cyclic strain for failure in Nf cycles, El is a constant which corresponds approximately to the extrapolated strain in single cycle failure (Nf = 1), and s is a constant which depends on alloy and testing environment and temperature,
Air at 25°C is the most severe of the environments tested, Lowering the temperature to 10-l5°C increases the fatigue life by 20-25%.
In fresh water at room temperature, the fatigue life is 100% greater than in air at 0. 7% strain, 270% greater at 0.2% strain. Bubbling air through the tap water lowers the fatigue life slightly while bubbling of nitrogen results in a minor increase in life.
Fatigue life in the NELH surface seawater is about 60% greater than in fresh water at room temperature for 0. 7% strain, similar at 0.2% strain. In the cold water, longer lives are obtained, especially at the lower strain values.
TWo alloys were tested, a Pb-0,04 CU-0.01 Sn alloy and a cable sheath alloy obtained from Pirelli of the composition Pb-0.16 Sn-0,04Sb. The latter alloy showed superior performance at law strains, while the difference between the two alloys disappeared at strains abvove 0.4-0.5%.
In summary, under the conditions of test used here, the seawater at NELH give the longest fatigue lives of the various environments tested. The cold seawater gives longer lives than the surface seawater at total strains of 0.15-0,5%, while the warm water gives longer lives at greater strains.
X

1.0 PURPOSE
The purpose of this task is to obtain data on the resistance of typical power cable materials and common reference materials to deterioration in the marine environment as it exists in the general region of the proposed Hawaii Deep Water Cable (HDWC) route. It is expected that these data will be of use in selecting materials for the final design and in pinpointing problem areas with long-term materials survival used in this application so that appropriate countermeasures may be taken.
2. 0 RELATIONSHIP 'ID OVERALL HDWC PRCGRAM
This task relates most closely to the cable design, particularly to the selection of materials for components of the outer layers, such as the outer serving and the armour wires.
The data obtained can eventually also be used as input to decisions on whether protection methods, such as cathodic protection, are needed and to what degree, and as input to calculations of probable survival times of the cable.
3.0 TECHNICAL TASKS
The work was divided into four subtasks which are described separately below. They are:
long term corrosion tests in Hawaiian surface and deep ocean seawater, crevice corrosion testing of stainless steels in the same waters, determination of the abrasiveness of Hawaiian marine rocks, and corrosion fatigue studies of lead cable sheath material in seawater.
3.1 General Conditions
3.1.1 Time Period Covered
The work was funded by the HDWC Program during the period December 1, 1984 to December 31, 1985. It continued unfunded through July of 1986 in order to enable the various students involved to obtain their MS degrees and in order to obtain test series of reasonable size.
3 .1. 2 Materials
At the time the early stages and it near-final design.
work was started, the cable design effort was in its was not clear which materials would be selected for the It was therefore decided to test:
1) a number of commonly used metals for comparison with data from other locations,
2) a number of materials typically used in power cable construction, and

3) several high alloy stainless steels which have been considered candidate armor wire materials for the riser cable for floating ocean thermal energy conversion (OTEC) plants.
3.1.3 Test Sites and Environments
Testing was performed both at the Marine Materials Laboratory (MML) in the Department of Mechanical Engineering on the campus of the University of Hawaii at Manoa and at the Natural Energy Laboratory of Hawaii (NELH) at Ke-ahole Point, island of Hawaii. Most exposure testing was performed at NELH while test development, abrasion testing, most fatigue testing, and sample preparation and evaluation was done at MML.
NELH has .two seawater supply systems which provide continual flows of pure seawater to elevated header tanks within the laboratory compound on shore. The warm surface seawater is obtained 100 m (300 ft) from shore, 8 m (25 ft) below the surface and flows through 0.3 m diameter (12 in) plastic pipes to the pumps within the compound, and then into the elevated header tanks which supply the experiments at NELH. The cold water is obtained from a depth of 590 m (1,925 ft) and flows through another 0,3 m diameter (12 in) plastic pipe to a submerged pump located 30 m (100 ft) from the cliff. From there, the two water flows run in parallel to the header tanks. The general layout of the water supply system is shown in Figure 3.1.1.
Typical water quality data of interest in this study are shown in Table 3.1.1. The cold water temperature varies slightly with the total volume of pumping because of slight heating due to friction and heat transfer from the surroundings. It has a lower pH and dissolved oxygen content than the warm water, while the salinities are the same. The warm water shows an annual variation in temperature of 4-5°C (7-8.5°F), as illustrated in Figure 3.1.2. Other parameters remain basically constant over the year.
3.2 Subtask (a): Long-Term corrosion Tests
3.2.1 Background
The long-range purpose of this task is to obtain corrosion data of use in the materials selection for the final HDWC design.
The installed cable will be exposed to a number of different environments over its total route, ranging from reef environments with warm tropical surface water to cold, oxygen-poor deep ocean environments, and probably including various degrees of burial in silt, alternating with bold exposure on rocky sections. At the present time it is not feasible to perform corrosion tests in all of these environments: instead, testing has been confined to the waters available onshore at NELH.
In view of the restrictions on available environments and the uncertainties as to final materials selections, the short-range purposes of the subtask were defined as follows: to obtain corrosion data for typical cable materials and for some common baseline materials in the two seawater environments available at NELH: to compare these data with literature data
2

~-
~.
in order to determine the relative corrosiveness of Hawaiian waters; and to provide the necessary background for planning of future tests with actual cable materials from the final design. Because the time available was relatively brief, the data presented are for relatively short-term exposures only (to 10 months).
3.2.2 Experimental Details
3.2.2.1 Materials
Most of the work was done with sample materials in the form of small test coupons. Towards the end of the contract period, sections of a prototype cable became available. These sections are still being tested and will be described at a later date.
Nominal:cornpositions of the ooter ials used in coupon form are shown in Table 3.2.1. TWelve different materials were used: two common stainless steels, two .. cuprous alloys, low carbon and high carbon steel, two low alloy high strength steels, lead, zinc and galvanized steel, and one aluminum alloy.
3.2.2.2 coupon Size
Duplicate specimens were used for each exposure condition. The coupons of 6061-T6 aluminum, copper, galvanized steel, low carbon steel, and 304 and 316 stainless steels were sheet specimens, nominally 7.5 ern (3 in) square. Zinc and lead samples were 4 ern (1.5 in) square, and samples of the remaining materials (Cu-30Ni and steels 1090, 4130 and 4340) were in the shape of coins, 2.5 ern (1 in) in diameter and 0.6 ern (0.25 in) thick with a central hole for mounting. A few stainless steel samples were tested for crevice corrosion. The specimen configuration and the results are reported in section (b) of this report, except for the calculated uniform corrosion data, which are presented in this section.
3.2.2.3 Specimen Preparation
After cutting to size, the edges were smoothed with fine (grit 600) SiC sandpaper. For the lead and carbon steel samples the surfaces were cleaned with the same sandpaper, while the other materials needed no surface preparation. All samples were finally cleaned in acetone, dried, and carefully measured and weighed (to 0.1 rng).
3.2.2.4 Exposure Conditions
Samples were mounted on non-metallic racks, separated by short sections of plastic tubing, to avoid galvanic coupling. The racks were inserted in wooden troughs located on the outside test pad at NELH. Each trough is approximately 2.4 m (8 ft) long, 0.08 m (3.5 in) wide and has a water depth of approximately 0.20 m (8 in) (see Figure 3.2.1). The troughs are covered with a tightly fitting lid to exclude light and are painted white to
3

minimize the amount of solar heating.
The water is supplied to the troughs in a once-through mode from the lines which provide the water supply to the OTEC heat transfer experiments in the laboratory building at NELH. For the warm water this means from a location between the header tank and the booster pumps; for the cold water it means from a location after the booster pump. Flow through the troughs was controlled by valves to a slow, constant flow of around 0.05 m/s (0.17 fps). The lay-out is shown in Figure 3.2.2.
The temperature in the troughs is essentially identical to the temperature measured in the laboratory; on very sunny days it may be approximately 0.5°C (l°F) higher.
3.2.2.5 Exposure Periods
Samples were retrieved after the following exposure periods:
1 month 3 months 6 months 10 months
(31 days, May 24-June 24, 1985) (106 days, Feb. 7-May 24, 1985) (182 days, Feb. 7-Aug. 7, 1985) (293 days, Aug. 7, 1985-May 28, 1986)
3.2.2.6 Potential Measurements
The potential of the samples against a standard silver/silver chloride (Ag/AgCl) reference electrode was measured at intervals, using an HP 3470 A multimeter.
3.2.2.7 Sample Evaluation
The samples were cleaned by the standard techniques recommended by the American Society of Testing and Materials (ASTM). Details are given in Table 3.2.2.
After cleaning, the samples were weighed and the depths of pits and crevices were measured using the optical focus technique with a surface finish microscope. The deepest pit and the average of the five deepest were determined. The materials loss as uniform corrosion was calculated from the weight loss data.
3.2.3 Results
The calculated uniform corrosion (from weight losses) is shown as average penetration from the surface in Table 3.2.3; the calculated average corrosion rates for each period in question are listed in Table 3.2.4 and 3.2.5. Table 3.2.6 shows data on pit development and Tables 3.2.7-8 show the results of the potential measurements. The data are plotted in Figures 3.2.3-3.2.16 for the uniform corrosion data, Figures 3.2.17-3.2.30 for the corrosion rate data, and in Figures 3.2.31-3.2.44 for the potential data; curves have been drawn in more for emphasis than to suggest functional relationships.
4

3.2.4 Discussion
Performance of the individual alloys is discussed below and, where possible, compared with data from the literature. The quality parameters for the seawater at the quoted sites are given in Table 3.2.9. Comparison data for aluminum (Al) 6061, copper (CU) and cupronickel (CuNi), lead, zinc (Zn) and galvanized steel, and carbon steel are given in Tables 3.2.10-3.2.14. The information was obtained from references 1-15.
3.2.4.1 Aluminum Alloy 6061-T6
This alloy pitted in both waters. The thin sheet samples were completely penetrated in many locations for the worst conditions, which were long-term exposures in the cold water. These samples also showed considerable edge attack, which probably contributes to the scatter in the data. The corrosion rate in the cold water was generally 4-6 times greater than in the warm, and the cold water samples remained at a potential of -0.6 to -0.63, which is consistent with pitting [7]. The corrosion loss and the corrosion rate appear to accelerate with time in the cold water, while the opposite was the case in the warm water. The warm water potential was quite steady at -0.8 to -0.86, which can be considered borderline between uniform attack and pitting [7].
The average corrosion loss after 180 days was 40 ~ in the cold water and 6 ~ in the warm. The values for the cold water exposure are considerably greater than found for similar alloys tested in the OTEC program at NELH, which was 5-10 ~ after 180 days at a flow velocity of 1.8 rn/s (6 fps) [16]. A separate study [17], also conducted at NELH, showed that the tendency to pit and the overall corrosion rate increase sharply as the flow velocity of the cold water is decreased. The present results are not inconsistent with that finding.
The calculated uniform penetration in the warm water is in the low end of the general range observed for warm water exposures of similar alloys under OTEC conditions [16]. These other tests, which were mostly carried out at 1.8 m/s (6 fps) but which did include trough exposures of alloys 1100 and 5052, showed no pitting in the warm water. It is not clear at this stage if the observed pitting of alloy 6061 is the expected behavior of this alloy: under these conditions, or if extraneous factors are partly responsible. One such factor could be the release of cuprous ions from copper samples placed upstream of the aluminum coupons.
Recent seawater exposure tests conducted around the world by ASTM included tests offshore at Ke-ahole Point [18]. Conditions here are similar to conditions in the warm water trough, except that there are substantial currents at the exposure site and the effect of larger swells can be felt. Also, biofouling develops on the offshore samples. Results for half and one year exposure of alloy 5052 have recently become available. They show a corrosion rate at Ke-ahole of 13 ~/y for the first 6 months and a rate of 7 ~y for the samples exposed for a year. These values are in the same general ranges as found in other locations around the world, and similar to the values found for alloy 6061 in the warm water trough. The offshore samples showed very minor pitting, maximum of 30 ~after one year. This is consistent with results from other tropical locations, while temperate
5

waters may give pits which are much deeper in the same period (630 ~ at Port Hueneme, california; 420 ~ at Genoa, Italy; 680 ~ at Studsvile, sweden; 210 ~at Sakata, Japan; etc.).
Comparison of the NELH data with other literature data from various locations in this hemisphere shows that the general corrosion in the surface water at NELH is less than at the othe~ sites, though only slightly so in comparison with other tropical areas. Pitting, however, usually does not appear so early in tropical sites (while it does in temperate zones), This supports the hypothesis advanced above that some extraneous factor, such as cuprous corrosion products from upstream samples, could have been responsible for the pitting.
For the cold water samples a direct comparison is not possible because corrosion was by severe pitting and the thin NELH samples were penetrated and showed edge attack. The only data from comparable environments are tests from Port Hueneme, california, at 1,524 m (5,000 ft) depth. These are in the same general range as found here.
For comparison of the two deep water test sites (NELH and Port Hueneme's offshore test site) the available water quality parameters show that the California site is somewhat lower in temperature (5 vs. 8-9°C) (41 vs. 46,4-48.2°F) and in dissolved oxygen (0.4 vs. 1.1 ppm) but otherwise the two waters are quite similar.
3.2.4.2 Copper and CUpronickel cu-30Ni
These two materials behave almost identically. Generally, the corrosion rate decreases somewhat with time, the CU corrodes faster than the CUNi and the cold water is slightly more corrosive than the warm. The corrosion rate is relatively low (10-20 ~y after one year) and the attack is quite uniform. In the warm seawater the specimens showed some edge attack and minor pitting and crevice corrosion around areas contacted by the PVC spacer.
The factors which generally affect the corrosion of CU and CU-base alloys in seawter are film formation, oxygen content, velocity, temperature, metal-ion concentration and biofouling. In the present experiments two layers of a different color and different degree of coverage formed on the copper. A relatively tenacious reddish to brown thin film of cuprous oxide, cu2o, developed, as well as a blue-green outer film, possibly basic copper carbonate, CUCOJ·3CU(OH)2· The area of the loosely adhering outer film increased with time of exposure and with temperature. In the warm water the outer film covered approximately 70-80% after 31 days, while in the cold water only about 20-30% of the surface was covered with this film after the same period,
On the CUNi a light-green tenacious film formed over the entire surface. This film may be a compound of basic copper carbonate and nickel oxide.
The oxygen level can affect the corrosion of cu and cu-alloys in at least three ways - by depolarizing cathodic areas, by oxidizing cuprous ions to the more corrosive cupric ions and by promoting the formation of a protective film on the surface. In the present case one might expect the
6

'-t '
higher oxygen content of the warm water to promote film formation and thus reduce the corrosion rate.
Generally, at higher temperatures the corrosion rate is higher if other factors remain constant. In the present case both copper and cupronickel showed lower corrosion rates in the warm water than in the cold. 'lherefore, it appears that the beneficial effect of higher oxygen overrode the deleterious effect of higher temperature for the warm water.
The measured potentials moved slowly from about -0.1 V at the beginning to about -0.2 V after 300 days.
In the previously mentioned ASTM experiments [18] alloy CU-lONi was exposed offshore at Ke-ahole. It showed corrosion rates of 16-20 pn/y at 6 months and 6 pmjy at 12 months. 'lhese are similar to the trough values obtained for cu-30Ni in this study. The offshore samples did, however, show pitting and crevice corrosion on the top surface to a depth of 100-120 ).Ill
after 6 months and 200-220 pm after one year. It would appear that the rate of water flow over the surface has a significant influence on the degree of pitting, with greater velocity giving greater pitting in this case.
The comparison data from Port Hueneme showed much the same values with the exception of CU in the warm water, which showed a 30% greater corrosion rate than at NELH, possibly due to the greater flow velocity.
3.2.4.3 Lead
There was very little corrosion of the lead in both waters and the attack was uniform. The weightloss-time curves are almost identical for the two waters and are of a parabolic shape. The final corrosion rate was about 10 pn/yr (0.4 mpy) in both waters; the loss after one year was about 6 )JTI in the warm water and 8 pn in the cold.
The samples had a dark grey tenacious thin surface film which probably protected the metal and resulted in the gradual decrease in corrosion rate with time.
The potentials fell in the range -0.3 to -0.45 V. They showed no clear change with time.
Comparison with data from other locations shows that there is little variation in the corrosion behavior of lead in seawater, regardless of location. The rate of attack is about 10-20 ~yr (0.4-0.8 mpy), with slightly lower values in deep ocean water.
3.2.4.4 Zinc and Galvanized steel
The pure zinc and the zinc coat on the galvanized steel show curves of similar shape. The corrosion rate decreases with time and the pure zinc samples show consistently greater corrosion than the galvanized steel. The warm water samples initially corrode slightly faster than the cold water samples but for longer exposure periods (greater than 1 month) the ranking is reversed. The average corrosion rates at ten months were: for the zinc,
7

55 pn/y in the cold water and 40 pn/y in the warm, and for the zinc coating on the galvanized steel 30 and 25 pn/y, respectively.
The samples became uniformly discolored to grey with scattered patches of white scale. The fraction of area covered by this scale was greater in warm water and for galvanized steel samples. The scale is formed from dissolved carbonate and bicarbonate in-the seawater which tend to deposit films which are adherent, have low solubility in the water, and stifle corrosion.
After the scale had been removed the pure zinc specimens showed minor pitting, crevice corrosion and general corrosion. The crevice corrosion was confined to the area contacted by the spacer. The galvanized steel samples had lost portions of the zinc coating, which was a 1 oz/ft2 coating (45 m thick), and the bare steel was exposed. The area of exposed steel was around 10% after one month in the cold water, around 70% after six months and around 85% after ten months in that water. These values were significantly greater than the values for warm water. The exposed bare steel surfaces showed only negligible attack which means that the zinc coating essentially provided protection.
The initially greater corrosion in the warm surface seawater is most probably due to the greater reaction rate at the higher temperatures and the greater levels of dissolved oxygen. As the surface scale forms the corrosion rate drops and since film formation is more pronounced in warm water and for the galvanized surface, the corrosion rate for these samples falls the most.
The corrosion potentials for the zinc stabilized rapidly at the same level for the two waters: -0.93 to -0.935 V vs. Ag/AgCl, and remained constant for at least six months. Towards the end of the exposure period they dropped to -1 to -1.05 V. The galvanized steel in warm water showed a more erratic potential in the range -0.6 to -0.9 v, while in the cold a steady value of -0.92 was obtained. After 180 days samples in both waters had stabilized at the same potential of -0.915 V, quite close to the potential of the pure zinc.
comparison of NELH data with literature data shows that there is ccnsiderable variation from location to location. The NELH data fall in the general band <.of values as reported in the literature. since the corrosion rate tends to decrease with time and since most of the exposure periods reported in the literature are substantially longer than the ten months used here, it is probably too early to attempt a more detailed ranking of the data.
3.2.4.5 carbon and Low Alloy steels
The 1090, 4130 and 4340 steels all show almost identical corrosion rates in each of the two waters and a corrosion rate in the warm water which is about 3.5-5 times greater than in the cold water. The low carbon steel (1006, ASTM A 366) shows considerably lower corrosion in both waters, again with lower rates in the cold water. Penetration values after ten months are approximately 30 and 70 pn for the low carbon steel in cold and warm water, respectively, 25 and 130 pn in these two waters for the two low
8

alloy steels, and 30 pn and 160 pn for steel 1090. corrosion in both waters appears to decrease with time.
All samples showed two layers of scale: an inner black, fairly tenacious film, most probably ferrous sulfide (FeS) from sulfate reducing bacteria, and an outer film of typical rust, formed by oxidizing of the FeS. In the cold water the FeS film is very thin.
The different alloys all show virtually the same potential which slowly decreases from -0.6 to -0.73 V in both waters. The 1090 and the two low alloy steels initially show higher values, -0.5 V in warm water and -0.4 v in cold.
In the ASTM offshore tests [18] steel 1010 was exposed. Oommon rates were 240 pn/y for six-month exposure and 160 and 530 pn/y for two different samples exposed for 12 months. The latter value was probably due to a very large pit formed under biofouling and may be considered a freak value. By comparison, the trough values for 1090 and the alloy steels are very similar at six months, somewhat higher at around one year.
Comparison of the corrosion data from NELH with values from Port Hueneme shows that basically, the cold water corrosion rates are similar in magnitude at the two sites while the Hawaiian surface water appears to be significantly more corrosive than the waters off california. More long-term data will be needed before a detailed comparison can be made.
3.2.4.6 Stainless Steels AlSl 304 and 316
Two different sets of samples were tested - plain sheet samples and samples which had a multiple crevice washer attached on each side, for testing of their susceptibility to crevice corrosion. Note that the crevice corrosion data will be reported in detail under Subtask (b).
Corrosion results for the plain samples are plotted based on calculated average penetrations. As shown in Table 3.2.6 these metals corrode by pitting, which is evident already after one month of exposure. Therefore, the average numbers have only limited value. They do serve as a simple basis for comparison of the exposure conditions and the alloys. It is seen that the cold water is significantly less corrosive to these metals than is the warm and that ss 304 corrodes much faster than ss 316. After 300 days SS 304 had lost 15 ~ in the warm water and 3 ~ in the cold. SS 316 showed more erratic values; some samples showed no significant loss while one showed 10 pn after 300 days in warm water.
The SS 304 samples showed edge attack in addition to the pitting and the six-month sample also showed tunnel corrosion which originated from the top edge and penetrated part of the sample like a honeycomb. The tunnels were 450 to 1,240 pn deep from the edge. ss 316 showed no such attack and had pits which were considerably more shallow than for SS 304. This is consistent with experience from other test sites.
The pit data show considerable scatter. They indicate that a maximum pit depth of around 50 pn for ss 316 in cold water and 100 pn in warm is established early and does not appear to increase with time. For ss 304, on
9

the other hand, the observed maximum pit depth increases with time, to 120 ~ after 300 days in cold water and 410 ~ after the same period in warm water. The corrosion potentials of the two alloys show no clear trend; they fluctuate around zero with a range of +0.1 to -0.2 v.
The average corrosion data for the crevice corrosion samples show more consistency but fall in the same general ranges. After 300 days ss 304 shows a loss of 16 j.HT1 in warm water and 10 j.HT1 in cold water while ss 316 had lost 15 ~ and 7 j.Hll, respectively. Thus, the corrosion rate is somewhat greater for the crevice corrosion samples in cold water as compared to the plain samples, while the warm water data for ss 304 are the same for both configurations and ss 316 shows the same value in the crevice corrosion configuration. This essentially confirms that these local corrosion processes are under cathodic control and that initiation of the local attack is more difficult in ss 316 than in ss 304.
3.2.5 Conclusions
These relatively short-term tests can only be extrapolated to long exposure times with some caution. The fact that no major surprises have been found is significant. The Hawaiian surface seawater is quite similar in corrosiveness (within a factor of two or three) to seawaters elsewhere and the deep ocean seawater is generally less corrosive than the surface water, except for aluminum alloys, for which pitting is much pronounced in the cold water, and for zinc and galvanized coatings, which corrode about 50% faster in the cold water.
3.2.6 References to Subtask (a)
Note: Comparison data listed in Tables 3.2.9-3.2.14 were obtained from references 1 - 15.
1. F.M. Reinhart, "Corrosion of Materials in Surface Seawater After · 6-rnonths of Exposure", u.s. Civil Engineering Lab., Port Hueneme, CA., Technical Note N-1023 (1969)
2. M. Schumacher, •sea water Corrosion Handbook" (1971)
3. F.L. LaQue, "Marine Corrosion- cause and Prevention", John Wiley & Sons, New York (1975)
4. H.P. Godard, l'I.B. Jepson, M.R. Bothwell, and R.L. Kane, "Corrosion of Light Metals", John Wiley & sons Inc., (1967), pp 129-141
5. c.J. Slunder and W.K. Boyd, "Zinc; Its Corrosion Resistance", pp 111-129
6. M.H. Peterson and T.J. Lennox, Jr., "The Effect of Exposure conditions on the Corrosion of AA 6061-T6 Aluminum in sea water" Materials Performance, Vol. 16, No. 4, (1977), pp 16-19
7. R.E. Groove, T.J. Lennox, Jr., and M.H. Peterson, "cathodic Protection of 19 Aluminum Alloys Exposed to Sea Water-corrosion Behavior", Materials Protection and Performance, Vol. 8, No. 11, (1969) pp 25-30
10

B. C.R. Southwell, A.L. Alexander, and c.w. Hummer, Jr., •corrosion of Materials in Tropical Environments- Aluminum and Magnesium", Materials Protection, Vol. 5, No. 12, (1965), pp 30-34
9. c.v. Brouillette, "Corrosion Rates in Port Hueneme Harbor", corrosion, Vol. 14, No. B, (1958), pp 352-356
10. K.D. Efird and D.B. Anderson, "Sea water corrosion of 90-10 & 70-30 cu-Ni: 14 Year Exposure", Materials Performance, Vol. 14, No. 11, ( 1975), pp 37-40
11. c.w. Hummer, Jr., C.R. Southwell, and A.L. Alexander, "Corrosion of Materials in Tropical Environments- Copper & Wrought Copper Alloys", Materials Protection, Vol. 7, No. 1, (1968), pp 41-47
12. M.H. Peterson and T.J. Lennox, Jr., "The Effects of Exposure condition on the Corrosion of Mild Steel, Copper, and Zinc in Sea Water" International corrosion Forum [NACE], Anaheim, CA., April 18-22, 1983, paper No. 75
13. R.E. Groove, T.J. Lennox, Jr., and M.H. Peterson, "De-Alloying of Copper Alloys and Response to Cathodic Protection in Quiescent Sea water", Material Protection and Performance, Vol. 10, No.7, (1971), pp 31-37
14. C.R. Southwell, B.W. Forgeson, and in Tropical Environments -part 4. No. 11, (1960), pp 512-518
A.L. Alexander, •corrosion of Metals wrought Iron", Corrosion, Vol. 16,
15. J.A. von Fraunhofer, "Lead Corrosion in sea Water", Anti-Corrosion, May 1969, pp 21-26
16. J. Larsen-Basse, "Performance of OTEC Heat Exchanger Materials in Tropical Seawaters", J. Metals, Vol. 37 (1985), pp 24-27
17. s. Jain and J. Larsen-Basse, "Effect of Flow Velocity on the Corrosion of Some Aluminum Alloys in Deep Ocean Seawater", NACE Paper No. 224, CORROSION 86, Houston, March 17-21, 1986
18. T.S. Lee and S.J. Pikul, "Seawater Corrosivity Around the WorldResults of the First Year of Materials Exposures", Draft Report, ASTM Subcommittee G01.09, June 1986
11

TABLE 3.1.1 TYPICAL WATER QUALITY PARAMETERS AT NELH
Sea water as Delivered to the laboratory by 0.3~ Dia. System
(Weekly samples 1983 to 1985) (Values are shown are averages-+/- standard deviation)
Paraoeter Warm Seawoter Cold Seawater
' lemperature oc 25.91 +/- 0.74 9.26 +/- 0.61
lemperature Of 78.75 +/- I.H 48.67 +/- 1.21
Salinity 0/00 34.89 +/- 0.12 34.29 +/- 0.03
pH 8.23 +/- 0.05 7.10 +/- 0.05
Alkalinity meq/1 2.322 +/- 0.019 2.356 +/- 0.016
H03 +NOz •irromolar 0.11 +/- 0.06 38.9 +/- 1.1
P0 4 • 0.16 +/- 0.03 2.96 +/- 0.08
Si • 3.0 t/- 0.90 74.2 +/- uo
HH4 • 0.40 +/- 0.14 0.23 +/- o. 13 Dissolved organic H u +/- 1.40 1.5 +/- 1.0
(mirromolar) p 0.22 +/- 0.05 0.05 +/- 0.04 Dissolved organic
• Dissolved oxygen
• 253. +/- 30 56. +/- 15
lotal organic C 63. +/- 16 30. +/- 13 •
Particulate organic C •
2.8+/-1.3 0.6 +/- 0.3
Intake Location
Warm Vater: 97.6m (320 ft) offshore Vater depth 20m 165ft) 12.2 m (40 ft) above seafloor 7.6 • (25 ft) below surface
Cold Vater: 1615 m 13500 ft) offshore 21 m (10 ft) above seafloor
12
Vater depth 608 m (1995 ff) 586 m (1925 ft) below surface

TABLE 3.2.1 NOMINAL COMPOSITIONS OF MATERIALS TESTED IN COUPON FORM
"aterial
A 1 6061-T6
Copper
Cupron i eke! (CDA 115)
Zinc
GalvanizedSteel
lead
ASTM A366 IA!SI 1009)
Al51 1090
Al51 4130
AJ51 1340
304 55
316 55
Specimen Chemical Co•position(wt.1) Designation
A
c
Cu-Ni
z
G5
l
cs
1090
mo
mo
"g:O.B-1.2,5i:0.4-0.8,Cu:O.I5-0.4 Cr:0.04-0.35,Zn:0.25 ,Ti:O.IS
ma~ max Mn:O.I5
1ax'Fe:0.7max'o her:0.05
Cu:99.99+; [Oxygen-free]
Cu:69.5,Ni:30.0,Fe:0.5
Zn:99.9•in'Cd:0.03~ax'Pb:0.07max Fe:0.02 ;A5TM Bb High Grade max
Thickness of zinc coating:45um (the coating o2 each side of sheet is 1.0 oz/ft or 1.7 mil)
AI:0.001,5b:O.OI5,As:0.006,Bi:O.OI, Cd:O.OO!,Cu:0.03,Fe:O.OOI,Au:O.OI, Ni:O.OI,Zn:O.OOJ,Sn:O.OI, Pb:99.9
C:O.I5 ,"n:0.6 ,P :0.035 5 : o~Hl max max
max
C:O.BS-0.98, "n:0.6-0.9,P :0.04 S :0.05 max oax
C:0.2B-0.33,"n:0.4-0.6,Cr:O.B-I.I, Mo:O.I5-0.25,Si :0. 15-0.3,P :0.035 5 :0.04 !laX oax
C:0.3B-0.43,Mn:0.6-0.B,Ni:l.65-2.0 Cr:O.l-0.9,Mo:0.2-0.3,5i:O.I5-0.3 Paax:0.035,51ax'0.04
SSA(Plain) C:O.OB a ,"n:2.0,Ni:B-IO.S,Cr:IB-20 SSC!Crevice) Si:I.0~~:.,:0.045,S1ax'O.Ol SSB(Plain) C:O.OB
0a•'"n:2.0,Ni:I0-14,Cr:l6-18
SSO(Crevice) Mo:1-3,~•:1.0,P :0.04,5 :0.03 aax aax
13

TABLE 3.2.2 .SOLUTIONS USED FOR CLEANING OF EXPOSED SAMPLES
!.COPPER :
Solution
Teoperature Time
Hydrochloric acid (sp gr 1.19) Water Room I to 3 min.
500 ml 1000 11
• Note To avoid metal loss during cleaning, deaerate solution with purified nitrogen before cleaning sample
Solution ;
Temperature; Time
3.LEAO :
Solution ;
T l!lllperature; Time
l.IROH and STEEL
Chromic acid Phosphoric acid Water BO °C ( 176 °F l 5 to 10 oin. or until clean
Acetic acid Water Boi I ing 5 oin.
Solution ; Hydrochloric acid Antimony trioxide Stannous chloride
Teoperature ; Room Ti•e Up to 25 min.
20 gr 50 gr
1000 ml
10 ml 1000 ml
1.19) 1000 ml 20 gr
50 gr
• Mote ; solution should be vigorously stirred or specimen should be rubbed with a non-abrasive implement of a wood or rubber
14

TABLE 3.2.2 SOLUTIONS USED FOR CLEANING OF EXPOSED SM1PLES (con' t)
5.ZINC :
Solution I ; Ammonium hydroxide Water
Temperature~
Time
Solution 1
Temperature: Time
Room Several min.
Chromic acid Silver nitrate Water Boi I ing !5 to 10 sec.
!50 ml 1000 ml
50 ml 10 gr
1000 ml
Note In making up the chromic acid solution, it is advisable to dissolve the silver nitrate separately and
acid to prevent excessive silver chromate.
add it to the boiling chromic crystallization of
6.STAIHLESS STEEL
Solution ; Nitric acid Water
Temperature : 60 °C [140 °F) Time 10 min .
. 15
I 00 nl 1000 m1

TABLE 3.2.3 UNIFORM CORROSION DATA
Average Penetration, vm
Exposed Duration (days} -------------------------------------
Material Environ. 31 !06 !81 193
AI 6061-TS c~ LI7 !4.51 39.72 ww !.85 3.06 5.37
Cu [CDA !01] cw ~.78 13.0 !6.06 !6.56 ww ~. 0 I 9.59 15.0 13.19
Cu-Ni [CDA 715] cw 3.93 B.~ l 9.90 9.H ww I .!4 5.69 I 0. !'1 U7
Zn cw 7.80 21.61 18. 11 41.! 8 ww 8.48 16.16 23.04 28. 6~
Ga'vanized Steel CW 4.60 12.26 17.90 22.69 ww 6. 95 9.86 12.70 17.64
Pb cw 3.0 4.86 4.86 8.27 ww I. 51 4.09 5.~2 6. 91
Lo• carbon Steel CW 11.36 22.91 16.79 28.43 ASTM A366 ww 19.98 37.0 I 37.17 7!.25
AISI !090 Steel cw 15.91 32.66 3!.33 36.6! ww 35.82 86.69 116.67 165.88
AISI 4!30 Steel cw 15.01 18.31 27.45 3!.44 ww 34.89 76.60 118.26 124.83
AISI 4340 Steel cw 15. !3 17.40 21.79 32.67 ww 32.89 7 !.86 115.41 150.46
Stai"less Steel cw 0.76 I. 54 1.08 3.03 AISl 304 ww 2.05 9.80 13.30 15.47
Stainless Steel cw 0.49 0.19 0.37 0.0!4 A lSI 316 ww 2. II 0.24 0.37 8.10
55 AISI·304 CW 0.~95 2.0 4.98 10.~6
[Crevice] ww 2.H 4. I 0 ll.H 16.13
SS AISI 3!6 cw 0.52 2.01 2.45 B. OI [Crevice] ww 2. 91 10.28 12.78 14.46
16

TABLE 3.2.4 CALCULATED CORROSION RATES (in vm/yr)
Exposed Duration (days) ------------------------------------
~aterial Environ. 31 lOG 182 293
AI 606!-T5 cw 72.6~ 50.0~ 79.76 ww 21.94 lUI 10.67
Cu [CDA ! 02] cw 56.39 45.97 32.26 21.01 ww 47.24 33.02 29.97 16.56
Cu-Ni [CDA 115] cw ~t. 23 28.% 19.81 12.! 3 ww !3.46 19.5£ 20.32 6.06
Zn cw 9!. 95 76.71 56.39 52.62 ww 99.82 15.88 4£.23 35.68
G3lva~ized Steel cw 54.! D 42.16 35.81 28.26 ww BZ.O~ 34.04 25.40 11.59
Pb cw 35.31 1€.16 9.65 I 0. 30 ww 17.18 !4.21 10.92 9.60
Lov carbon Steel cw 145.29 78.99 33.18 35.43 [ASH A365] ww 23 2. 92 117.51 75.69 88.19
A!S! I 090 Stee! cw 188.47 112.52 62.74 45.32 ww ~2!. 89 298.70 254.15 206.31
AISI 4!30 Steel cw 176.78 97.54 55.12 39.17 ww 4!0.91 253.9! 131.24 155.51
AlSI A340 Steel cw 119.31 93.21 55.12 40.12 ww 381.35 20.90 131.65 187.51
Stainless Steel cw 8.89 5.33 4.06 3.78 A!S! 304 ww 1U3 33.78 26.61 19.11
Stainless Steel CW 0.58 0.64 0.74 0. 018 AIS I 316 ww 14.89 0.86 0.74 10.08
55 A!Sl 304 cw 5.84 6.86 9. 9! I 3.01 [Crevice] ww 33.01 !U1 22.13 19.97
55 A!Sl 316 cw 6.!0 7.!! ~.83 9.98 [Crevice] ww 3~.04 35.31 25.65 18.02
17

TABLE 3.2.5 CALCULATED CORROSION RATES (in mpy)
Exposed Duration [days] -------------------------------------
Material Environ. 31 106 182 m
~1 6061-16 cw 1.86 l. 91 3. 14 ww 0.86 0. ~ l 0.41
Cu [COA 101] CW 1.22 1.81 I. 11 0.83 ww 1.86 1.30 1.18 0.65
Cu·Ni [CDA 115] cw 1. e1 l. 14 0.18 0. 48 ww 0.53 0.11 0.80 0.14
Zn cw 3.62 3.02 2.22 1.01 ww 3.93 1.10 l. 81 1.40
Ga!vani:ec Steel CW 1. 13 U6 l.4! l.ll ww 3.13 l. 34 1.00 0.81
Pb cw I. 39 0.66 0.38 0. 41 ww 0.10 0. 56 0.0 0.34
lov carbon Steel cw 5.11 3 .II l. 33 l. 39 ~m ~366 ww 9. 11 5.02 2.99 3.50
~lSI 1090 Steel cw uz 4.43 2.41 1. 80 ww 16.61 11.16 10.01 e. t4
mt mo steel cw 6. 96 3.84 1.11 I. 54 ww 16.18 10.39 9.34 6.12
~lSI 4W Steel CW 1.02 3.61 1.10 l. 60 ww 15.15 9.16 9 .!1 1.38
Stainless Steel cw 0.35 0.11 0. !6 0. !5 ~lSI 304 ww 0. 96 I. 33 I. 05 0.16
Stainless Steel cw 0.023 0.015 0.019 0.0001 ~IS I 316 ww 0.98 0.034 0.029 uo
55 ~lSI 304 cw 0.13 0.11 0.39 0. 51 [Crevice] ww l.JO 0.56 0.90 0.19
55 ~lSI 316 cw 0.14 0.18 0.!9 0.39 [Crevice] ww 1.34 l. 39 l. 0 l 0. 11
18

TABLE 3.2.6 PITTING CORROSION DATA
Pit Depth (urn)
"aximun Penetration .Average of 10 Pits "aterial Thick. Environ. ------------------------- ------------------------- ReBarks.
(CR} Exposed Duration (days} Exposed Duration (days} 31 lOG 182 293 31 106 182 293
A I 60b!T -6 0.048 CV penet. penet. penet. Severe Edge
• • ww 409 penet. penet. 274.7 340.2 304.9 51 ight Edge
Copper 0.05 cw 51 82 65 80 34.7 45.6 49.8 52
• vw 218 274 73 244 173.2 }80.3 56.2 145 Edge Attack
Zinc 0.05 cw 82 344 268 254 55.9 176.8 174.6 212 Randomly Pitted
• • ww 247 242 m 210 153.8 188.4 163.1 lBO •
304 55 0. }44 cv BB 92 91 120 55.0 74.0 66.5 75 Sha 11 o~ Pits
• • vw 195 122 m 410 116.6 93.7 11!. 2 142 •
316 ss 0.!48 CW 50 53 38 54 25.6 22.5 20.7 44 Shallow Pits
• • vw 100 56 37 104 37.2 29.9 24.9 68 •
• Mote !. CV : Specinen exposed in the Cold Sea-water Trough
2. VW : Specimen exposed in the Warm Sea-water Trough
19

TABLE 3.2.7 CORROSION POTENTIALS IN WARM WATER
CORROSION POTENTIAL {V), Ag/AgCl
WARM WATER
CORROSION POTENTIAL (V) vs. Ag/AgCl Exposed Duration {days)
-------------------------------------------------------Material 0 day 31 days 106 days 182 days 293 days LaQue'
Al 6061 0.793 0.864 0.821 0.855 0.714
Cu 0. I27 0.0956 0.325 0. 172 0.254 0.314
Cu-Ni 0.078 0. 12 0.335 0. 139 0.227 0.22
Zinc 0.942 0.934 0.952 0.951 l. 028 0.984
G-Steel 0.937 0.634 0.539 0.915 0.963
Lead 0.402 0.4 0.38 0.403 0.485
C-5tee1 0.579 0.604 0.533 0.633 0.691 0.564
1090 c 0.516 0.559 0.622 0.603 0.608
4130 A 0.499 0.556 0.62 0.557 0.677
4340 A 0.488 0.574 0.610 0.544 0.638
304 55 0.0025 0.0125 0.064 0.0588 0.0816 0.034
316 5S 0.047 +0.085 0.225 +0. I 05 0. 103 0. I34
304 ss• 0.018 +0.024 0.0306 +0.038 0. 12
316 SS** +0.1045 +0.132 +0.0046 +0.0068 0.045
Note 1. • •• indicate the crevice corrosion sample
2. LaQue' shows the steady state potential of the relating metal and alloy in sea water under the
13 ft/sec of flow velocity and 25 C.
20

TABLE-3.2.8 CORROSION POTENTIALS IN COLD WATER
CORROSION POTENTIAL (V), Ag/AgCl
COLD WATER
CORROSION POTENTIAL (V) vs. Ag/AgC! Exposed Duration (days)
Material 0 day 31 days 106 days 182 days 293 days
AI 6061 0.592 0.599 0.616 0.630
Cu o. 135 0. 147 0. 148 0. 133 0.207
Cu-Ni 0. 135 0.21 0. 134 0.087 0.209
Zinc 0.920 0.931 0.931 0.942 I. 069
G-Steel i
0.927 0.902 0.93 0.916 0.692
Lead 0. 422 0.366 0.341 0.285 0.369
C-Steel 0.574 0.604 0.655 0.612 0.719
1090 c 0.403 0.592 0.632 0.604 0.658
4130 A 0.407 0.582 0.628 0.607 0.696
4340 A 0.427 0.586 0.565 0.586 0.681
304 55 0.0236 +0.084 0.066 0. 102 +0.033
3I6 55 +0.0113 0. 105 0.251 +0.0103 0. 132
304 55* 0.0493 +0.0021 0.029 +0.014 0. 121
316 55** 0.043 0.014 0.068 +0.235 0.203
21

TABLE 3.2.9 WATER QUALITY PARAMETERS FOR COMPARISON TEST SITES
0 pH 0 Alkalinity location Condition Temp I C) Salinity Flow rate
(p~m) lm eqfl l (o{oo) (m/sec)
Kea-hole Point,HI Surface 2U-28 8.2-8.3 8.5 2.25-2.35 34.4-34.6 0.05 • Deep(600m) 9.5-10.5 7.5-7.7 I. I 2.36-U2 34.4-34.6
Port Hueneoe, Ca Surface 12.0-19.0 8.1 4.0-6.76 33.51 variable • Oeep(720m) 5.0 7.5 D. 41 2.36 34;36 0.03 • Deep( 1600- 2. 0-1.5 7.75-7.8 I. 5-2.0 2.36 34.5-34.6 0.046
2070m)
Fort Amador, Canal, Surface 15.6-31 7.8-U 5.85-8.8 Zone,Panama
Wrightville Beach, Surface 6.0-29 7.8-8.1 5.0-9.3 N.C.
Kure Beach, N.C Surface 6.0-29.0 7.8-8.1 5.0-9.3
Haber Island, N.C Surface 6.0-29.0 7.8-8.1 5.0-9.3
Key West, Fla Surface 16.0-31.1 8.0-8.3 5.7-8.6
Gulf of ~exico Surface 22.0-30.0 4.6-5.0 33.B-36.A
Hal if ax, Nova - Surface 3.0-23.0 8.25-8.28 5.2-U 32.3-33.58 Scotia,Canada
Esqui~alt,British Surface 10.0-15.0 5.6-6.2 32.0-31.5 -Columbia, Canada
At I antic Ocean Surface 24.08 4.7 36.79 • Oeep(600m) 11.73 3.27 35.55 • Oeep(705m) 10.03 3. IS 35.33 • Oeep(BIOm) 8.09 3.67 • Deep ( !554m) 4.12 5.38 35.0
22

TABLE 3.2.10 COMPARISON OF NELH AND LITERATURE CORROSION DATA FOR A1 6061
location Exposure Condition Corrosion Rate Penetration Depth of Pits(um) Remarks (ucjyr) (urn) Ave. Hax.
Ke-Ahole, HI Surface, 181days 10.6 7 5.37 30U(IO) 480 Slight Edge Attack • Deep • 79.76 39.71 perforation Severe Edge Attack
Port Hueneme,CA Surface, 181 25.40 Incipient [Pacific] m I 7. 78 406.4 Edge
540 7.61 584.2 • Deep 197 3U8 1193.8 713rnldepth)
• 402 40.64 1930.4 • • 123 2.5d-33.02 812.2 1720m
189 1.54 838.2 !BOOm • m 21 .59 1524.0 2066rn
751 46.99 1818.8 mo •. 1064 22.86 1955.8 1615m
fort Amador Surface 365 25.74 7.11 N N [Pacific,1ropical] • 730 44.70 12.19 N N
• 1460 52.83 14. 11 279.4(10) 762 1910 67.63 I 8. 54 584.2(10) 1144.6 584 0 85.34 13. II 355.6 2006.6
Key West,Fla Surface 365 203.20(5) 254 [tropical]
Harbor 1sland,N.C Surface 365 13.74 1701.8 Near Wilmington, N.C 130 11.61 2540 Atlantic,North Ameri
1815 15.01 3657.6 -ca. latitude;35' • 3650 13.70 3301
Hal if ax, Surface 365 31.09 !270 Atlantic, North [Nova Scotia] • 730 11.80 110! .B A~erica, latitudei45'
• 1815 16.59 1286 • 3650 16.00 3098.8
Esq~imalt, B.C Surface 365 33.57 1514 Near Victoria, 8.C • 730 16 .I 0 1540 Pacific, latitude;50'
1815 20.70 3175 • 3650 IUS 3175
23

TABLE 3. 2 .• 11 COMPARISON OF NELH AND LITERATURE DATA FOR Cu AND CuNI
Exposed Condition Carras ion Penetration Depth of Pits(um} Kateriai&Location Rate(um/yr) (um) Ave. Kax.
Cui Ke-l.ho I e, HI Surface, I 82 day~ 29.91 15.DO 56.2(10) 13 • Deep 182 32.26 16.06 49.8(10) 65
Cu-Ni[CDA 706] Surface, 181 16-20 I 00-120
Cu-Ni[COA 715] Surface, I 92 20.32 I 0. 11 • Deep 182 19.81 9.90
Cu,Port Huenemr,Ca Surface, IBI 40.64 559.8 • Deep 191 21.94
Cu-Ni[CDA 706]," Surface, 181 28.00 • Deep 191 20.32
Cu-Ni[CD/.115],' Surface, 181 12.70 • Deep 191 20.32
Cu,Key West,Fia Surface, 735 9.34 25.4 25.4 Cu-Ni[CDA 715] • • 1.19
Cu-Ni[CDA 706] Surface, 365 ll.O Wrightville Beach, • 1095 5.0 N.C Cu-Ni[COA liS] Surface, 365 11.0
• 1095 l.O
24

TABLE 3.2.12 COMPARISON OF NELH AND LITERATURE DATA FOR LEAD
Locatlon Exposed Condition
Ke-Ahole
Port Huneme
Sur-Face. 181 Deep • 181
Sur-Face, 181 " .,365
Deep • 1 97 .,365 ..
San Fr3nc~sco SurFace,lBl
Kure Beach Sur-Face,600
Weston-super Sur-Face,1LI60 -Marc
25
Corrosion Penetration Rate(um/yr) (urn)
10.92 9.65
20.32 12.70 7.62 5.08
10. 16
1 5. 2 4
12.7
Ll.85

TABLE 3.2.13 COMPARISON OF NELH AND LITERATURE DATA FOR Zn AND GALVANIZED STEEL
Material& Location
Zn, Ke-Ahole,HJ
Ga·l .. Steel, "
Zn,Port Hueneme, C2
Zn,Kure beach
Zn,Panama Canal
Exposed Condition
surface,l82 days deep ,!82
surface, 182 deep ' 1 82
surf"ace,IBI deep , I 97 deep , 120
surFace, 181 .. ,4 yr
surf"ace,365
Zn,E~st Port,Maine surfac~,3 yr
Zn,Port /\m3dor, Canal zone
Gw 1 .. Ste~ 1 ., ~"\ure Beach
Ga 1 . Stee 1 , Port HuenemC?,Ca
surf.::Jce,4 yr " ,8 yr
sur~ace, 18 I " " ..
,365 ,3.5 yr ,5 yr
surf"ace, 181 " ,365
deep • 365
26
Corrosion Depth o~ Pits Rate(umjyr) (urn, max)
46.23 56.39
25 .. 40 35.8!
I 14. 3 58.42
170.!8
48.26 20.32
27.94
16.26
21. 08 I 6. 0
48 .. 2f, 22.86 15.24 12.70
53.54 27.94 22.86
247 268
127 50.8
330.2
2844 1788
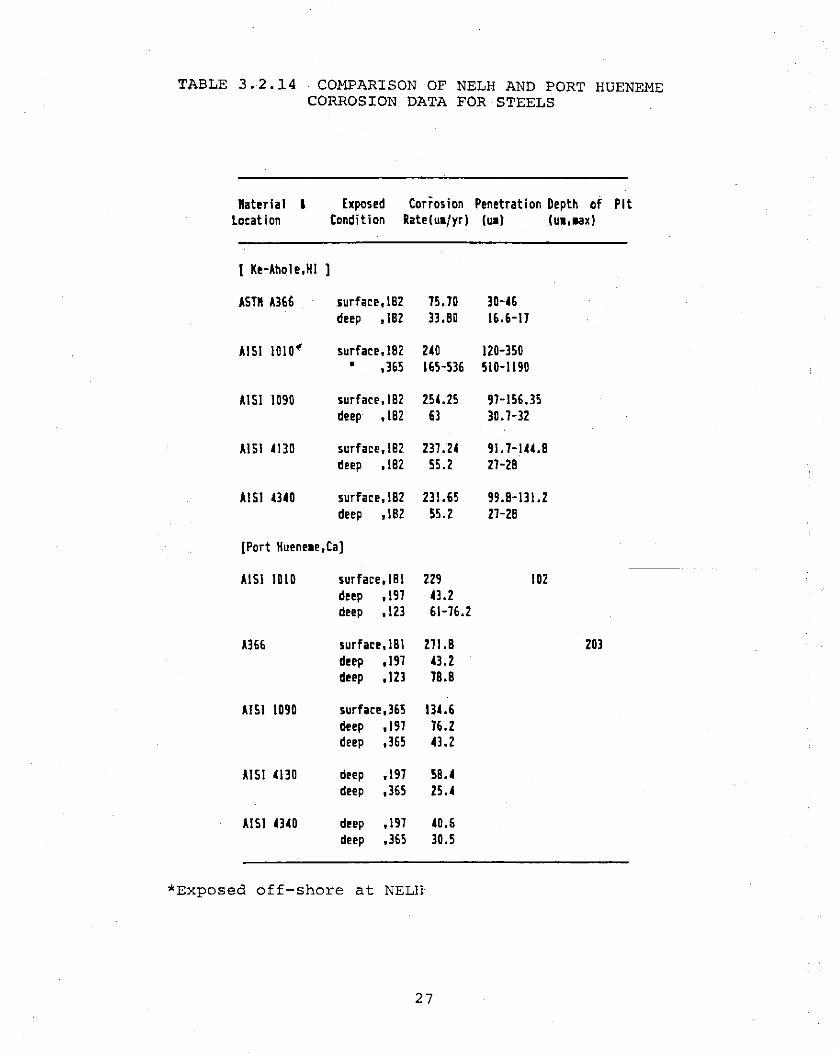
TABLE 3.2.14 COMPARISON OF NELH AND PORT HUENEME CORROSION DATA FOR STEELS
Material l Exposed Corrosion Penetration Depth of Pit location Condition Rate(ua/yr] (UI] (ua,aax]
[ Ke-Ahole,Hl 1
.Am A366 surface,l82 75.70 3H6 deep ,182 33.80 16.6-17
AISI 1010~ surface,l82 w 120-350 • ,365 165-536 510-1190
AISI 1090 surface, 182 254.25 97-156.35 deep ,182 63 30.7-32
AISI mo surface, 182 m.2c 91.7-IU.8 deep ,182 55.2 27-28
AISI CHO surface,l82 231.65 99.8-131.2 deep , I 82 55.2 27-28
[Port Hueneae,Ca]
AISI 1010 surface,l81 229 102 deep ,197 C3.2 deep '123 61-76.2
A366 surface, I 8 I 271.8 203 deep '197 C3.Z deep ,123 78.8
AISI 1090 surface,365 13'-6 deep '197 76.2 deep ,365 CJ.2
AlSI mo deep '197 SB.C deep '365 25.C
AISI nco deep ,197 C0.6 deep ,365 30.5
*Exposed off-shore at NELH
27

HEAD TANKS
1111W
WARM WATEit SYSTEM \ \L ··~
. ~ ~\!iit., ..• ~~ - ' -·· ' . ·- --=- . ' ... - - --·- --- " - - - • . . - ,. IUIUI[ItC(D
\ ·- " ~ "- PUMP~ : ... --S&;J ( .t ~ 1 C;~30Ci11,0LY[THTL[N[ PIPE ..
121W '•·
·f
\ ~
COLD WATEit SYSTEM
FIGURE 3. 1.1 GENERAL LAY-OUT OF THE WATER SUPPLY SYSTEMS AT NELH
29
Worm Water Temperature
28
27 ,...... u • '-' n.. 26 E
N Q) "'I-
25
24
23 0 100 200 300 400
Day of Operation 1n 1984
FIGURE 3.1.2 ANNUAL VARIATION OF THE WARM WATER TEMPERATURE AT NELH

w 0
END VIEW SIDE !LEVATIOH
NOT£1 All piece• an 1/211 thic:lr..
FIGURE 3.2.1 DIMENSIONS OF WOODEN TROUGHS USED FOR CORROSION TESTS

Cold vatar fro• 600 aatera depth
War• water fro• 8 •et•n depth
Wam water : ~ Cold water
' .,.
trouaha troua.bs
J_ ~ 1 • ;. ,_L· ..-L ,-L- r-'-
~ 1 '-r-
l
f
FIGURE 3.2.2 GENERAL LAY-OUT OF THE TEST TROUGHS

50 Aluminum 6061-T6
/ ,...., 40 *• Cold Water * E • ::J o: Warm Water
/ '-/
en en 30 0
_J
• _y w u N ·.-i 20 ..c
1-
• * OJ > 10 <C /: *
4-- 0
0 ----0 60 120 180 240
Days
FIGURE 3.2.3 AVERAGE PENETRATION DATA FOR Al 606l-T6

50 ~-----------------------------------------, Copper ECDA 102J
'"' 40 *• Cold Water E • ::> o: Warm Water ...__,
(/) (/)
30 0 _J
• w ..Y w u
·r-1 20 L. I-
* • -* 0 QJ
~ -----> 10 < ~* 0 / 0_......--
-~~
0 / 0 60 120 180 240 300
Days FIGURE 3.2.4 AVERAGE PENETRATION DATA FOR COPPER

20 ~----------------------------------------~
Cu-N i CCDA 71 SJ
,....... E 15 *• Cold Wat8r • :J
'-" Warm Wat8r O; (j) (j)
0 _j
_Q • 10 * X ------· w u ""' ·rl *
...c. / -- ----I- ----• 0---OJ
/ > 5 .,/"" 0
<C / * / / /
/ 0
0 0 60 120 180 240 300
Days FIGURE 3.2.5 AVERAGE PENETRATION DATA FOR Cu-30Ni

20
,...... E 15 :::> .....,
(/) (/) 0 _j
• 10 ..X u
w ...... Vl .c
1-
• OJ 5 >
<
0 0
*: Cold Water o: Warm Water
Lead
--* .-----*-------- - ---o ------- -- 0--
-------· * -- -- * - .-o
*----- ---. ---/0.....--/
0
60 120 180 240 300 Days
FIGURE 3.2.6 AVERAGE PENETRATION DATA FOR LEAD


50 Galvanized Steel
,...._ 40 1- *· Cold Water E • :J o: Warm Water '-'
(/) (/)
30 0 1-_j
• 1-_y
w u _____-.--....., ·.-I 20 1-...c.
~ I- _o ---------- -• --OJ ------*- -- -
o-> 10 <C 1- ~-o-
-0 1- * / .
0 I I I _l_ I I I I
0 60 120 180 240 300 Days
FIGURE 3.2.8 AVERAGE PENETRATION DATA FOR GALVANIZED STEEL

100~-------------------------------------.
Low-carbon Steel [ASTM A366J
,.... 80 *• Cold Water E • :J Warm Water ~ '--' o: ---(/) ----(/)
60 __.....--
0 __.....--_I
----~ • ~ ..X
w u / ro ·.-I 40 ..r::. ~ 0 1- /
/ * • Cll
0 / *- --> 20 < /- ------ * p---v---
0 0 60 120 180 240 300
Days
FIGURE 3.2.9 AVERAGE PENETRATION DATA FOR LOW-CARBON STEEL

,....., E :::::J
'-../
(f) (f)
0 _j
• ...!::
w u \D .......
...c. f--
• OJ >
<C
300~----------------------------------------~
240
180
120
60
0 0
Carbon-stQQl AISI 1090
*: Cold WatQr o: Warm WatQr
*
60
~:---- --- --- * ---
120 180 240 300
Days FIGURE 3.2.10 AVERAGE PENETRATION FOR HIGH CARBON STEEL

"' E :J .._,
Ul Ul 0
_j
• X
"" u 0 . r-1
L I-
• OJ >
<C
300~--------------------------------------~
240
180
120
60
0 0
Low-olloy StQQl AISI 4130
*; Cold WotQr
o: Worm WotQr
______ -n /
/
0· -----------------
--r---0
o/ / * *--- --- --* ----- -~-- ----·-
/ '*
60 120 180 240 300
Doys FIGURE 3.2.11 AVERAGE PENETRATION DATA FOR LOW-ALLOY STEEL 4130

"" E :J
'--'
(f) (f)
0 _j
• X .... u f-' ....... ...c f-
• OJ > <
300~--------------------------------------,
240
180
120
60
0 0
Low-alloy St88l AISI 4340
*; Cold Wot8r o; Worm Wot8r
// ./'"() --------------
....-- 0....-- ----
0/ ---- _ __..::n*=-- ----·- * ---
/-*-·
60 120 180
Days
-----
240
FIGURE 3.2.12 AVERAGE PENETRATION DATA FOR LOW-ALLOY STEEL 4340
---o
300

20
Stainless Steel 304
*• Cold Water • ""' ----0 E 15 Warm Water ----:::) o: '-' ---
Y- -----(f) (f)
------0 ~ _j
~ 10 • /0 _r
u / ... •r-i
"' L I- /
•
I OJ 5 > <
I * 0 -* ·- *
~*
0 0 60 120 180 240 300
Days
FIGURE 3.2.13 AVERAGE PENETRATION DATA FOR PLAIN SAMPLES OF STAINLESS STEEL 304


20
1-
,.......
5 15 '-'
en en t-o
__J
. 1 0 t-_y u
·.-I
..c ~ I-
• OJ 5 1->
<C
0 0
Stainless Steel 304 [Crevice]
*= Cold Water o= Warm Water
/
0 /
/ o/
/ -~ - "*:.--~ I I
/
60 120
0 ./
/ /
/
I I I
180
Days
/ /
I
240
FIGURE 3.2.15 AVERAGE PENETRATION DATA FOR STAINLESS STEEL 304 EXPOSED AS CREVICE CORROSION SPECIMEN
I
300

(f) (f) 0 _j
20
. 10 ..Y u
....... ..c I-
• OJ >
< 5
0 0
Stainless Steel 316 [Crevice]
*; Cold Water
o; Warm Water
/
/ /
/
...---~
0/
-o
------
----
----/ / *---------- --- *
--* 60 120 180
Days
-
240
FIGURE 3.2.16 AVERAGE PENETRATION DATA FOR STAINLESS STEEL 316 EXPOSED AS CREVICE CORROSION SPECIMEN
*
300

... "'
200~------------------------------------------,
'L 160 >...
" E :J ..._,
OJ +' a 0::::
120
§ 80 •.-I
(/)
0 L L 0 40 u
0 0
'*
-o-
... L ..
Aluminum 6061-T6
-----
*: Cold Water o: Warm Water
~ * ----~ ----*
0 --
60
--0
120 Days
--
180
FIGURE 3.2.17 CORROSION RATE DATA FOR Al 6061-T6
240

... ....,
100~-----------------------------------------.
'L 80 >..
" E :J ...__,
Cl! 60 +> 0
0:::
c 40 0 ·~ (/} 0 L L 0 20 u
0 0
-* ----·*
Copper CCDA 102]
*: Cold Water o: Warm Water
----0, *' "-..........._____ ~
o...__ __ o -............._
-- --------- . . i5 ---- ----------- ---* 0
60 120 180 240 300 Days
FIGURE 3.2.18 CORROSION RATE DATA FOR COPPER

... 00
100~----------------------------------------~
" L 80 >-
""" E :J
OJ 60 +-)
0 0:::
§ 40 . .--1
(f)
0 L
6 20 u
0 0
Cu-N i CCDA 715J
*: Cold Wotr2r
o: Worm Wot12r
........ *--.____ -o-~~-~--------- --------_0 __
·-* 0
60 120 180 240 300
Days FIGURE 3.2.19 CORROSION RATE DATA FOR Cu-30Ni

50 Lead
'L 40 *• Cold Water • >-.. .......... o: Warm Water E * :J \ ...__,
Q} 30 ~
~ 0 0:::
.... c ~ "' 20 0
·.-4 -o-(/) - *-0 -- ------o- -. L - * L - -0 10 --o-_ "--* u * --o
o·
0 0 60 120 180 240 300
Days FIGURE 3.2.20 CORROSION RATE DATA FOR LEAD

LT1 0
200~------------------------------------------~
L: 160 >-. ........_
E :J
OJ 120 +-)
0 0:::
§ 80 (])
0 L L 0 40 u
0 0
0
*~-
Zinc
*: Cold Watf:lr
o; Warm Watf:lr
" ::--- - ---*-----........ ----............__0 --- --0----- --o
-*---- --- ---*
60 120 180 240 300 Days
FIGURE 3.2.21 CORROSION RATE DATA FOR ZINC

1 00 .---------------------~------- -----------------
Galvanized Steel
,....._ 80 ~ Cold Water L *• • >-. \
" o;Warm Water E \ :J
'--' \ 60 QJ
~\ +) 0
0:::: -\_ ~
<.J1 r: ,_. 0 40 "'-~
....... "-a -------- * (f) ......... ___ ---0 -L -- * L -a --0 20 --- 0
u
0 0 60 120 180 240 300
Days
FIGURE 3.2.22 CORROSION RATE DATA FOR GALVANIZED STEEL

300 .---------·
Low-carbon Stee 1 [ASTM A366J
'L 240 0\_
*• Cold Water • >-.. Worm Water ........ o:
E
" :J ....__,
" 180 OJ "' +)
"' 0
*~ 0::
""' lJl c 0 N 0 120 ~
-.......__
·.-I -........... (f)
~.* ---0 -- -- --0 L 0 L ~ 0 60 u ------.....
~- *
0 0 60 120 180 240 300
Days FIGURE 3.2.23 CORROSION RATE DATA FOR LOW-CARBON STEEL

U1 w
500~----------------------------------------~
,.... L 400 >...
'-.,. E :J
'-./
OJ -W 0
0:::
c 0
....... (f)
0 L L 0
u
300
200
100
0 0
\ 0
"
"''
" '-...
Carbon Stggl AISI 1090
"""-.. ............ 0~
"---~
*• •
0;
--o
Cold Wotgr
Worm Wotgr
----- .--o
-~
-~ * ~-----·-*-- --- ---*
60 120 180 240 300
Days FIGURE 3.2.24 CORROSION RATE DATA FOR HIGH CARBON STEEL

t.n
""
500~------------------------------------~
Low-alloy Steel AISI 4130
" \
L 400 ~ *• • Cold Water >-...
.......... E :J
'-./
OJ +> 0
0:::
c 0
....... (f)
0 L L 0
u
300
200
100
0 0
" ""-"-.. '-..,.
""-... .......... o........._
0; Worm Water
......._ 0 ....__....___ -------------o
~-* ....___ ·----* -- ------*
60 120 180 240 300
Days FIGURE 3.2.25 CORROSION RATE DATA FOR LOW-ALLOY STEEL 4130

500 Low-alloy St1212l AISI 4340
,......, L 400 b *;Cold Wat12r >-.
.......... \ o;Warm Wat12r E
""' :J 'O,J
"" 300 OJ ~ +-> "--. 0 0--0::::
---- 0 Ln ---Ln c 200 -0
"'* 0 . .-i
(f) ' . ~ 0
L L
100 "--..._* 0 u --· -----~
*
0 0 60 120 180 240 300
Days FIGURE 3.2.26 CORROSION RATE DATA FOR LOW-ALLOY STEEL 4340

50 -----"·-----"-------------·----
AISI Stainless Steel 304
,.... 40 Cold Water L *• •
>-.
" 0; Warm Water E :J 0
'-/ / --30 / ---OJ ---+) / ---0 0/ 0 --0::: -- -- ---(}1 c
"' 20 ---0 --0 ....... (f)
0 L L 0 10
I
u *----- I ~-* *I -*
0 I 0 60 120 180 240 300
Days
FIGURE 3.2.27 CORROSION RATE DATA FOR PLAIN SAMPLES OF STAINLESS STEEL 304
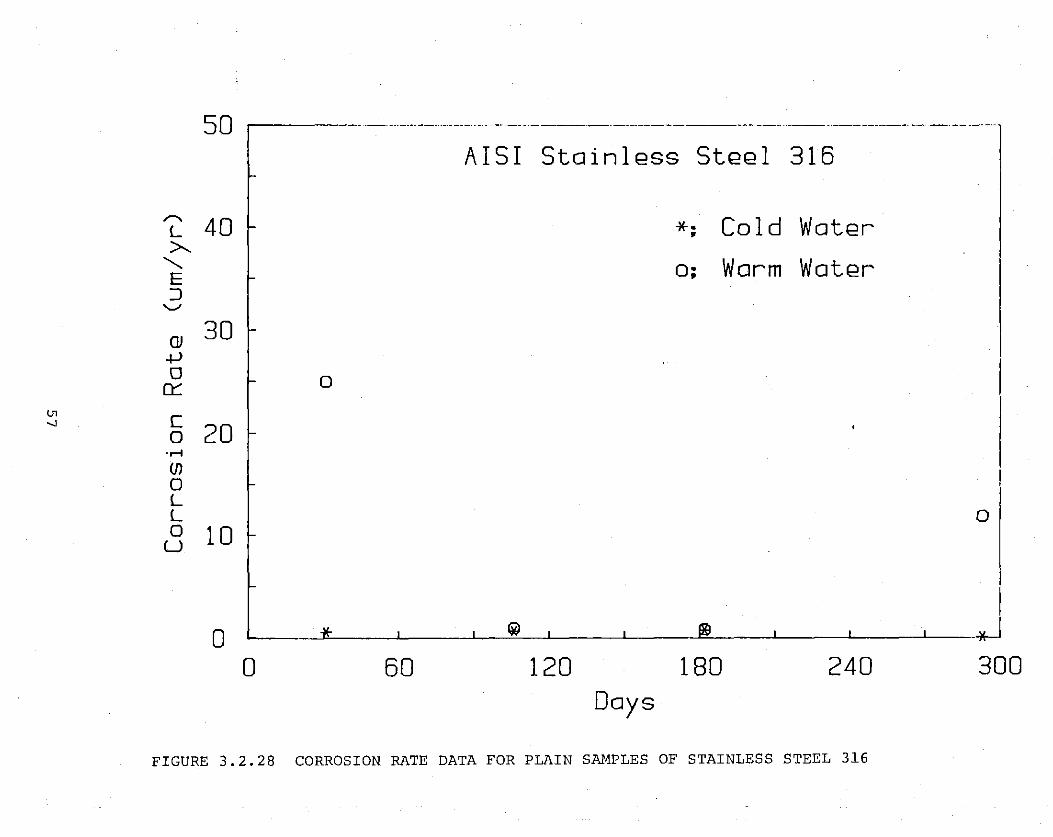
50 ..---------- ----------------------------------- ---·-··---------------------------
AISI Stainless Steel 316
,....._ 40 Cold Water L *· •
>-. "-,. 0; Warm Water E :J
'--'
OJ 30 +> 0 0 0:::
l!1 c " 20 0 ·.-i
(/) 0 L L 0 0 10 u
I
0 lj() @ _j 0 60 120 180 240 300
Days
FIGURE 3.2.28 CORROSION RATE DATA FOR PLAIN SAMPLES OF STAINLESS STEEL 316

Ul
"'
50 Stainless Steel 304 [Crevice]
"" 40 *· Cold Water L • >-. ......... E :::> ...._,
Ql +> 0
0::
c 0
·M (f) 0 L L 0 u
o: Warm Water 0
" 30 " '- ....____
.............
--- 0 -- -20 - --.. - -----0
0
10 ---* *
0 0 60 120 180 240
Days FIGURE 3.2.29 CORROSION RATE DATA FOR STAINLESS STEEL 304 EXPOSED
AS CREVICE CORROSION SAMPLE
--*
300

U1 \0
50 Stainless Steel 316 [Crevice]
'L 40 *· Cold Water • >-. ......... E :J ..._,
OJ +) 0
n::: c 0
....... (/) 0 L L 0
u
0 o: Warm Water a._ --30 ............
............ ............ --- ---- --- -----a__
20 - - --10
* *
0 0 60 120 180 240
Days FIGURE 3.2.30 CORROSION RATE DATA FOR STAINLESS STEEL 316 EXPOSED
AS CREVICE CORROSION SAMPLE
- --o
*
300

...---<
u m
<C
' m <C
• (/)
>
'"' > '--'
•
"' c
0 OJ -W 0
Q_
• 0 L L 0
u
0
-. 2-
-
-. 4 r-
Aluminum 6061-T6
*: Cold WatQr
o: Warm WatQr
-. 6*=----.- * --- ----- -*---- -----*-
-
-1 0
- ______ _,_Q,_ ______ _
0
I I
60
I
120 Days
I
FIGURE 3.2.31 CORROSION POTENTIALS OF Al 606l-T6
0
I
180
I
240

-. 4L_ __ _L ____ L_ __ -L----~--~----~--~----~--~--~
0 60 120 180 240 300 Days
FIGURE 3.2.32 CORROSION POTENTIALS OF COPPER

"' N
,.........
u m
<C '-.,_
m <C
• (/)
> ,., > '-./
• c OJ
..j..)
0 Q_
• 0 L
. 2
. 1
0
-. 1
-.2
L -. 3 0
u
- --
Cu-N i CCDA 715J
*
*: Cold WatQr o; Warm WatQr
--0 ---------~-~*~~~ --=~-----_..a. -.::-=---
--::~
*
0
------....:* 0
-. 4~--~----~----~--~----~----~--~~--~----~--~ 0 60 120 180 240 300
Days FIGURE 3.2.33 CORROSION POTENTIALS OF Cu-30Ni

"' w
0
.--. u m -. 1
<C "-.. m
<C
. -. 2 ([)
> ,.....,_ > '-' -. 3
• c Ql
.j..)
0 -. 4 ()_
• 0 L L -. 5 0
u
* ~
---~-
.* ---
*: Cold WotQr
o; Worm WotQr
-----o;;> -- --~~---o----o---- ----- -------- 0
-. 6~--~----~----~--~----~----~--~~--~----~--~ 0 60 120 180 240 300
Doys FIGURE 3.2.34 CORROSION POTENTIALS OF LEAD

-. 6
1- Zinc .......... u -. 7 m <C "'-.._
*• Cold Water m • <C Warm Water • -. 8 - o: (/)
>
"' > '-" -.9 1-
• ~ * c
"' OJ r 0 ~-. ... .J-)
-~ 0 -1 1-Q_ ::::-:-.....
~ • f-0 * L L -1. 1 f-0
u -
-1. 2 I I I I I I I I I
0 60 120 180 240 300 Days
FIGURE 3.2.35 CORROSION POTENTIALS OF ZINC

0
.......... u m
-.2 < .......... m
< • -.4 (/)
> ,..... > ....._., -.6
• "' c lJ1 OJ
+-) -.8 0 o_
• 0 L -1 L 0
u
-1. 0
I
a--
/ I
*
----
60
GalvanizQd StQQl
120 180
Days
*; Cold WatQr o; Warm WatQr
/
240
FIGURE 3.2.36 CORROSION POTENTIALS OF GALVANIZED STEEL
*
300

...--<
u m
<C .......... m
<C •
(j)
> ,.-.._
> '-./
• "' c "' Of
+' 0
Q_
• 0 L L 0
u
0
-. 2
-. 4-
-.6 ~ 00
-. 8
-1 0 60
. 1-'I:U,,-,._
Low-carbon StGG l CASTM A366J
0
120 Days
180
*: Cold WatGr
o; Warm WatGr
240
FIGURE 3.2.37 CORROSION POTENTIALS OF LOW-CARBON STEEL
300

'-'-""""'· .,.
-.2.-----------------------------------------------~
AISI 1090 Carbon St~~l .......... u
-.3 m < ......__
*· Cold Water m • < Warm Water • -. 4 0; ([)
> \ ,-....., > '-.../ -.5
"~ • c "' OJ -...)
+) ----. . 0 -.6 * -~- - oo-Q_ - -o ·cr •
0 * L L -. 7 0
u
-. 8~--~----~--~----~--~----~--~----~--~--~ 0 60 120 180 240 300
Days FIGURE 3.2.38 CORROSION POTENTIALS OF HIGH CARBON STEEL

-. 8~--~----~--~----~--~----~--~----~--~--~ 0 60 120 180 240 300
Doys FIGURE 3.2.39 CORROSION POTENTIALS OF LOW-ALLOY STEEL 4130

"' \0
-.2,-------------------------------------------~
.......... u m
< "-.... m
< •
([)
>
" > '-.../
• c Q)
+)
0 o_
• 0 L
-. 3
-. 4
-.6
L -. 7 0
u
AISI 4340 Alloy Stggl
*: Cold Wotgr o; Worm Wotgr
_.....o ____ . ----*----.... ------
---- ------- -o ----- ---* -.8~--~--~--~----~--~---J----~--~--~--~
0 60 120 180 240 300 Days
FIGURE 3.2.40 CORROSION POTENTIALS OF LOW-ALLOY STEEL 4340

. 2 Stainless Steel 304
......... u
. 1 m < /~---....... m '* <
' ~ ~ • 0 (j) :--___ 0 . > --------~ ~ 0 "' -®--- .-/
> - 0 - . - _*_............ ..__., - 1 • •
-.] c 0 OJ
+) 0 -.2 Q_
• *· Cold Woter 0 • L Worm Woter L -. 3 0; 0
u
-. 4~--~-----L----~----~----~--~-----L----~----~--~
0 60 120 180 240 300 Doys
FIGURE 3. 2. 41 CORROSION POTENTIALS OF PLAIN SAMPLES OF STAINLESS STEEL 304

._, f.-'
.2
..--. u m • 1 t-
<C '-.._
m t-
<C •
Ul >
,...._ > '-" -
• c OJ f-
..j..J
0 -.2 t-Q_
• t-0 L L -.3 f-0
u f-
-.4 I
0
I I
60
Stainless Steel 316
I I I
120 180
Days
*· • Cold Water o; Worm Water
I 1
240
FIGURE 3.2.42 CORROSION POTENTIALS OF PLAIN SMiPLES OF STAINLESS STEEL 316
300

-..J IV
.2
1-...--<
u m . 1 1-
< '-.... m <
• (])
>
"" > '-"
• c OJ
+-> 0
Q_
• 0 L L -. 3 0
u - .
*: Cold Water o; Worm Water
_0
4L_ ____ L_I ____ L_I ____ L_ ____ L_, ____ l_I ____ L_I ____ ~----~----~--~
0 60 120 180 240 Days
FIGURE 3.2.43 CORROSION POTENTIALS OF CREVICE CORROSION TEST SAMPLES OF STAINLESS STEEL 304
300

-.J w
.3 Stoinl~ss St~~l 316 [Cr~vic~J
.......... * u m . 2 I-
<C "-... m
<C 0
• (})
>
"' > '--'
• c
• 1 I
0
------- --------------0 o- - --~*----....-- . OJ r ------- .* +)
0 ()_
• 0 L
-. 1 r-
L -. 2 0
u
*• • o:
Cold Wot~r Worm Wot~r
---- --------· ---------
-- -o
-. 3L-----~----~-----'L-----L-·----~·----~-----L-'----L-'----~·----~
0 60 120 180 240 Doys
FIGURE 3. 2. 44 CORROSION POTENTIAlS OF CREVICE CORROSION TEST SAMPLES OF STAINLESS STEEL 316
300

3.3 Subtask (b): crevice Corrosion Testing of Stainless steels
3.3.1 Backgrouna
The purpose of this task is to obtain aata which will allow aetermination of the resistance to crevice corrosion of various stainless steels in both surface ana aeep ocean seawater.
Use of the relatively new high alloy stainless steels for armor wire in arEC riser cables has been suggestea. These materials generally have excellent resistance to corrosion ana corrosion fatigue ana have gooa strength levels. Previous work at NELH has shown that stainless AL-6X ana 29-4C show no corrosion in rapidly flowing seawater [1). However, auring testing of arEC riser cable moaels at two aepths [7.6-61 m (25 ana 200ft)) offshore at NELH it was founa that AL-6X aoes corroae by crevice attack in the severe crevices which form unaer fiberglass tape [2). Since stainless steels were felt to be potential canaiaate materials for armor wire in the early stages of the HDWC project, ana since this type of application naturally involves a large number of potential crevices, it was aeciaea to assess the resistance of various high alloy stainless steels to crevice corrosion attack in seawater. The two water supplies at NELH coula further previae information on the possible accelerating role of low levels of aissolvea oxygen in the deep ocean water.
3.3.2 Crevice corrosion Theory; Brief Outline
crevice corrosion is the localizea attack which occurs within (or irnmeaiately outsiae) crevices ana other shielaea areas on the surface of some materials in some environments [3). It usually occurs where small volumes of stagnant solution are present, e.g. unaer gasket surfaces, lap joints, surface aeposits, ana unaer bolt ana rivet heaas. When a metal with a crevice is irnmersea in seawater containing aissolvea oxygen, the overall reaction involves aissolution of metal M ana the reauction of oxygen to hyaroxyl ions.
Initially these reactions proceea uniformly all over the surface of the metal, incluaing the interior of the crevice. However, the oxygen insiae the crevice is soon aepletea; thus no further reauction occurs insiae the crevice although the metal aissolution continues. This proauces an extra positive charge within the crevice which results in the migration of negative chloride ions from the seawater to neutralize the condition insiae the crevice. This results in an increasea concentration of metal chloriae (M Cl) within the crevice. The metal chloriae aissociates into a insoluble hyaroxiae with the formation of free hyarogen ions through hyarolysis [3)
Both the chloriae ana the hyarogen ions accelerate the aissolution rate of metal.
74
A mathematical model of crevice corrosion was developed by Oldfield and sutton [4) to investigate the mechanism and the parameters which control crevice corrosion. They suggest four stages of crevice corrosion as summarized in Figure 3.3.1.
In Stage 1 a passive current flows over the entire metal surface. A crevice is formed in an area in which oxygen availability is restricted, and the cathodic reaction consumes the dissolved oxygen in this area.
During Stage 2 the introduction of metal ions (cations) through the passive film into the electrolyte has a twofold effect: (1) anions (primarily chloride ions) migrate into the crevice area from the bulk solution to neutralize the charge, and (2) hydrolysis reactions involving the metal ions cause an increase in acidity. These hydrolysis reactions take the form of
During Stage 3 the electrolyte within the crevice can become sufficiently aggressive (high chlorides and acidity) to break down the passive film.
The buildup of acidity results in breakdown of the passive film and causes a form of corrosive attack which is similar to autocatalytic pitting. Peterson, et al. [5) analyzed the species present in a natural crevice on type 304 stainless steel in order to determine the acidification of the electrolyte due to hydrolysis. They concluded that the acidification within the crevice is probably dominated by the hydrolysis of chromic ions,
cr3+ + 3H2o - cr<oo> 2 + 3H+.
since only traces of ferric (Fe+3) ions were found analytically, and since Ni ions do not hydrolyze to yield pH values significantly below neutral.
Stage 4 is the propagation of crevice corrosion by rapid dissolution of the alloy exposed to the aggressive solution within the crevice balanced by oxygen reduction on the specimen area outside the crevice.
Figure 3 .3.2 illustrates the factors which can influence crevice corrosion of stainless steels. These factors can be generally classified as metallurgical, environmental and geometric. They are discussed briefly below.
3.3.2.1 Effect of Crevice Geometry
The principal geometrical factors are crevice gap and depth. Oldfield [4) predicted that in practical situations the crevice gap will lie in the range 0.1 ~ to 10 ~. The crevice gaps of metal-to-metal crevices are larger than for metal-to-non-metal crevices. Lee and Kain [6) found that crevice gaps of 0.1 ~ to 3 ~ exist in the multiple crevice assembly. Kain [7) carried out experiments on crevice corrosion in type 304 and 316 stainless steels in filtered seawater using the mathematical model of Oldfield and the multiple crevice assembly. He showed that the resistance of type 304 and 316 to initiation of crevice corrosion is a function of
75

crevice gap. For a tight gap, e.g. 0.01 pn, both alloys are predicted to initiate crevice corrosion, and little significant difference in time to breakdown is evident. As the gaps widen, the difference become more apparent. When gaps are wider than 0.03 pn, breakdown is no longer predicted for type 316, while initiation is still possible for type 304.
Actual crevice gaps are difficult t~ measure and Sedriks [8] has noted that the wide scatter of data in crevice studies may result from the inability to reproduce the geometry of a tight crevice.
A minimum crevice depth must exist to satisfy the conditions for breakdown. Greater crevice depths are required for initiation to occur with widening gaps. According to Kain [7], type 316 is predicted to be more resistant to crevice initiation for a broader range of service conditions than type 304, as shown in Figure 3.3.3.
3.3.2.2 Effect of Environment
crevice corrosion rates are strongly dependent on environmental factors such as temperature, pH, chloride concentration and velocity.
Lee [9] examined the effect of temperature on the initiation and propagation stages of crevice corrosion of types 304 and 316 in natural seawater. He observed that at 25°C (77°F), crevice corrosion initiated faster than at 10 and 50°C (50 and 122°F). Maximum depth of attack, weight loss, etc. all have the highest value at 25°C for 304 and 316 stainless steel. He suggested that the more ready initiation of crevice corrosion at 25°C compared to 10 and 50°C is probably due to slow reaction kinetics at l0°C, while at 50°C surface films act as oxygen diffusion barriers.
Kain [10] studied crevice corrosion propagation resistance of two austenitic (type 304 and 316) and two ferritic [type 430 and 18 chromium (Cr)-2 molybdenum (Mo)] stainless steels using a remote crevice assembly at 30°C (86°F) for 40 days. Test solutions used a pH 3 and pH 6 with chloride concentrations of 1,000 mg/1 and 10,000 mg/1. He observed that no initiation occurred in 316 and 18Cr-2Mo in 100 mg/1 at pH 6, while rapid initiation occurred in 430 under all conditions. In general, more crev1ce corrosion was observed as the chloride concentration increased and the pH of the bulk solution decreased. Ferritic grades showed greater penetration compared to austenitic alloys. This difference was greater in solutions containing 1,000 mg/1 chloride. weight loss in 100 mg/1 chloride was about 1/15 of that in 10,000 mg/1 chloride and this loss was lower in the solution with pH 6. He concluded that increased chloride concentration of the bulk solution has greater effect on propagation than changes in pH within the limits studied.
Lee, et al. [11] studied the effect of seawater velocity on crevice corrosion of 304 and 316 stainless steels. They noticed that the corrosion rate increased significantly when the velocity was increased from 0 to 0.4 m/s, but is little affected when the velocity is increased beyond 0.4 m/s.
Streicher [12] observed that crevice attack was more severe for samples with silicon carbide (SiC) 120 grit finish than for samples tested with a mill finish. The alloys that remained resistant even with SiC 120 grit
76

finish were also resistant with mill finish. Similar results were obtained by Lee and Kain [6].
Generally, higher torque applied to the plastic loading bolt in the MCA will result in narrower crevice gaps and this will reduce the time to breakdown of the passive film; therefore, longer times will be available for propagation. According to Lee [6] and~treicher [12], as torque increased from 25 to 75 in-lbs, both the number of sites attacked and the maximum depth of attack increased. Torque, of course, had no effect for the completely resistant alloys.
Anderson [13] studied the effect of cathode to anode area ratio for type 304 and 316 stainless steels exposed in seawater for 30 days. He observed that as the cathodic area is increased both the number of sites attacked and the maximum depth of attack increase.
Streicher [12] exposed stainless steels with multiple crevice assemblies for 30 to 90 days in quiescent seawater at 30°C (86°F). He noted that for most of the alloys tested, increasing exposure times increased the number of sites attacked and the maximum depth of attack. But this effect was less prounced in alloys that have either very low or very high resistance.
Among all the alloy elements found in stainless steel the Mo provides the greatest improvement in crevice corrosion resistance whether the alloys are austenitic or ferritic.
suzuki and Kitamura [14] claimed that the resistance to crevice corrosion of stainless steels is mainly determined by their Mo content, regardless of the alloy structure. The minimum content of Mo for crevice corrosion resistance is 2 to 3% most alloy systems.
For austenitic alloys a significant improvement in crevice corrosion resistance in seawater can be obtained by molybdenum addition as low as 2 to 4% [15]. Streicher [12] also noted that larger amount of Mo and Cr severely retard crevice attack.
May and HUmble [16] examined crevice corrosion of various stainless steels in ambient temperature seawater for 109 days. They noted that a beneficial effect of nickel can be inferred from a comparison of the crevice corrosion resistance of type 430 and 302. These alloys have comparable chromium and other alloying element contents and differ primary in nickel content (430: 0.02%; 302: 8-10%). The observed weight loss of type 430 was much higher (2-3 times) than that of type 302.
Efird [15] showed the beneficial effect of increasing chromium content by comparing ferritic type 430 (17.5% Cr) with ferritic type 446 (26% Cr). The latter is more crevice corrosion resistant in seawater. But chromium alone is not sufficient to provide protection against crevice corrosion due to the chromic ion hydrolysis which yields a pH of about 1.6.
Streicher [12] found that eu, N, and Ti, when present in molybdenum containing austenitic stainless steels, have a beneficial effect on crevice corrosion resistance in seawater.
77

3.3.3 Experimental Details
3.3.3.1 Materials
The stainless steels used are listed in Table 3.3.1. The list basically contains two common standard austenitie stainless steels for comparison purposes (SS 304 and SS 316}; higher alloyed austenitic steels with 20% Cr and 12-26% Ni and with additions of 1.5-7% Mo and 0-2% cu (Nitronic 50, 254 SMO, AL-6X, AL-6XN, Jessup 700 and Jessup 777}; a high alloy, Mo-containing ferritic stainless steels (29-4C}, and a duplex austenitic-ferritic (50-50%} steel (Ferralium 255}. For comparison, two high-nickel alloys (Hastelloy G3 and Hastelloy 276} were also tested. Their nominal compositions are shown in Table 3.3.2 also tested for comparison were several aluminum alloys. Their nominal compositions are given in Table 3.3.3.
3.3.3.2 Coupon Size
Plate specimens were used, generally 10 em X 10 em with a central hole. Standard multiple crevice washers were located on each side of the plate and tightened together with a plastic bolt. The washers were made of delrin and each had 20 wedge-shaped crevice formers, 2 mm and 2.5 mm on the sides and 2.5 mm wide, separated from one another by 1 mm gaps. Details of the multiple crevice assembly are shown in Figure 3.3.4. To some samples electrical leads were attached in order to record changes in potential. The connections were covered with epoxy. Unfortunately, these connections often proved unsatisfactory and acted as crevices instead of protecting the connection.
3.3.3.3 Specimen Preparation
The samples were used in the as-received condition. The two Jessup alloys, the two Hastelloys, the ferritic steels (29-4C}, and the duplex steel (Ferralium 255}, were received hot rolled and pickled and had a slightly rough surface, while all the other steels were received in the cold-rolled and ground condition.
3.3.3.4 Exposure Conditions
The samples were exposed in the wooden troughs at NELH, described under Subtask (a} of this report.
3.3.3.5 Exposure Periods
Samples were exposed for periods ranging from 26 to 120 days:
7/29/83 - 8/26/83 26 days 8/26/83 - 12/2/83 98 days 12/3/83 - l/4/84 30 days 12/3/83 - 3/1/84 90 days 2/23/84 - 4/23/84 60 days 2/23/84 - 6/25/84 120 days
78

In addition, some samples of ss 304 and ss 316 were exposed for the same time periods as the other samples tested in Subtask (a).
3.3.3.6 Sample Evaluation
After exposure the samples were rinsed and dried. The washers were removed, and the corroded portions under the washers were cleaned using standard methods. The number of sites showing attack was determined, and the maximum depth of attack was measured by low power microscopy. The severity of attack was assessed on a scale from 1 to 5 with 1 set as beginning discoloration, 5 as complete perforation.
3.3 .4 Results
Detailed results are tabulated in Tables 3.3.4-13. Summary data are shown in Table 3.3.14 for warm water and Table 3.3.15 for cold. The effect of initial tightening torque (i.e. of the "tightness" of the crevice is shown in Tables 3.3.16-17 and the effect of area ration (boldly exposed area to area shielded by crevice formers) is shown in Table 3.3.18. The separate results for ss 304 and ss 316 run in parallel with the samples of Subtask (a) are listed in Tables 3.3.19-22 with a summary in Table 3.3.23.
3.3.5 Discussion
In general, crevice corrosion rates were considerably lower in the cold water than in the warm. Minor exceptions were shown by ss 304, ss 316 and 254 SMO, for which the attack was nearly the same in the two environments. ss 304 has very little resistance to crevice corrosion in the warm seawater and some samples even exhibited this type of attack in crevices formed where suspended matter or biofouling from the water had settled on the surface, rather than in the crevices formed by the Delrin washer. Some samples also showed preferred crevice attack under a small spot of epoxy coating which was used to attach wire leads for measurement of corrosion potentials (these potentials were monitored but the results have been of no value as indicators of the onset or severity of crevice corrosion, and are therefore not reported) ,
The data show considerable scatter, as generally found for crevice corrosion testing. In general, the longer the test period, the greater the attack. Also, the greater the area ratio: the ratio between the anodic area in the crevices and the cathodic area of the rest of the sample - the greater the attack. This is as expected and confirms the generally accepted notion that these reactions are controlled by the cathodic oxygen reduction reaction. There is also a minor increase in attack severity with tightness of the crevice - here indicated qualitatively by the torque applied to tighten the bolt which presses the two multiple crevice washers against the specimen surfaces.
Alloy 29-4C showed no crevice corrosion in either warm or cold water for its longest period of exposure - 90 days. No crevice attack occurred under the crevice formers for Hastelloy 276 in 120 days but there was minor crevice corrosion along the periphery of the hole where the metal was in
79

,-,.,.-
contact with the nylon bolt used to hold the Delrin washers together. AL-6X showed no crevice corrosion after 90 days in cold water, but did show attack in warm water after the same period of exposure. The nitrogen-containing variant of this material, AL-6XN was attacked in both warm and cold water, but the attacks were only moderate. Surprisingly, Nitronic 50 showed greater crevice corrosion than ss 316.
The ferritic alloy 29-4C, the austenitic JS700, and the nickel-base alloy Hastelloy c-276 were the only alloys which showed complete irrrrnunity.
The austenitic alloy 254 SMD performed well in both cold and warm water. The slight attack seen may be due to its lower Mo (6%) content as against the 8% MD required for complete resistance for an austenitic alloy, as recorrrrnended by Hack [17]. Another nickel-based alloy, Hastelloy G3, with higher cr content and somewhat lower MD content when compared to Hastelloy 276, showed considerable attack. Jessop 700 was completely resistant and Jessop 77hshowed slight attack. The difference in behavior of the above two alloys is probably due to 2% copper present in Jessop 777. Nitronic 50, in spite of its 4% manganese (Mn) content, exhibited poor resistance. Streicher [12] observed only moderate crevice attack in case of Mn-rich alloys. However, this behavior was not observed in Nitronic 50 in the present tests and this may be due to its lower Mo (2.28%) content. Significant attack occurred in Ferralium 255 exposed to warm water but no attack occurred in cold water. Its lower Mo content combined with 2.7% cu probably decreased the resistance to crevice attack. In the case of AL-6X and AL-6X N, crevice attack was higher than that in 254 SMo in spite of their comparable cr and MD contents. The main difference between their compositions is that the Ni content of AL-6X is higher than for 254 SMo, and higher Ni content seems to decrease crevice corrosion resistance.
Even though the present study was not specifically aimed at studying the effect of composition, some conclusions can be drawn. Both cr and Mo have a significant beneficial effect on crevice corrosion resistance. Higher Mo contents appear to compensate satisfactorily when the Cr content is low, but additional Cr seems less able to compensate for low Mo content. Redmerski et al. [18] concluded from their tests that MD is approximately three times as beneficial as Cr. In case of higher Cr contents, the passive film may be thicker but its protective properties will be significantly increased by the addition of Mo. It appears that there exists an optimum value of CU. The presence of CU below this limit will be beneficial and above is detrimental. Small amounts of cu may increase the protective properties of the oxide film while large amounts promote crevice attack by galvanic action [12]. The beneficial effect of Ni is less evident. However, large amounts of Ni may decrease the resistance to crevice corrosion. Redmerski et al. [18] in their tests found that the addition of Ni did not contribute to crevice corrosion resistance. The presence of Mn in appreciable amounts seems to have no effect on the resistance to crevice corrosion if the Mo content is small. The effect of other alloying elements is not evident from the results obtained.
Many of the ss 304 samples showed gravity-assisted attack which derives its name from the fact that this type of attack always progresses downwards from its origin. This has been observed for 304 in seawater by others [17]. During crevice corrosion there is an accumulation of acidic corrosion products in the crevice and these products have higher density than the
80

surrounding seawater [19, 20). If the products leak out they flow down over the surface in the direction of gravity and may induce local breakdown of passivity which can result in very severe local attack, often in the form of a thin line from the crevice to the bottom of the sample. The aggressive acidic corrosion products may wick along the bottom edge of the sample and cause edge attack, especially for samples resting on the bottom of the trough. The gravity-assisted attacks were often more severe than the crevice attack itself. At first glance this appears to be paradoxical since, as the corrosion products drain out, they can either get washed out or become diluted by the bulk environment, but this did not happen. Instead the intense attack by the corrosion products proceeded progressively downwards from the crevice region. This would occur only if the corrosion products do not reach the surface. The attack is almost like an irregular hole drilled down from the crevice at the mid-thickness of the plate. The hole has a ~aper shape so that a stage is reached when the hole away from the tip becomes wide enough to perforate the surface but, the acidic corrosion products at the tip will remain unaffected because they are still shielded from the environment by the sides of the tunnel so the attack can continue. Also, it was observed that the width of the surface crack is quite small compared to the tunnel diameter i.e. the sample thickness. In many cases the gravity attack was associated with bottom edge attack, presumably because the corrosion products, upon reaching the edge, spread outwards. On reaching the edge, the corrosion products can still continue their attack as they are shielded from the bulk environment by the deposits at the bottom of the trough. Edge attack was observed in some of the samples even when there was no gravity attack. A test rack was later designed to hold the samples above the deposits at the trough bottom. In all of those samples neither edge attack nor the edge attack due to the corrosion products originating from tunneling attack was observed.
The results for warm water exposures are compared with literature data on the same alloys in Table 3.3.24 obtained in two different sets of tests at the LaQue Center in North carolina. It is seen that the various alloys fall in the same ranking in the two locations.
The test program at NELH included some aluminum alloys for comparison purposes. The results are tabulated with the data for stainless steels. None of the samples showed crevice corrosion in the warm water in 120 days of exposure, while they showed severe pitting and crevice corrosion in the cold water. This is consistent with the results cited in section (a), obtained in the OTEC heat exchanger tests at NELH.
The multiple crevice test is considered a very severe test which may rule out materials that could perform well in many actual applications. Selection based on these results may, therefore, be on the conservative side. For the alloys that did show attack, the test does provide some interesting data, as shown in Figures 3.3.5-3.3.11.
The number of sites attacked (out of a total of 40) increases with time, as shown in Figure 3.3.5. The more resistant materials show significant incubation periods with no attack for the first few months. This means that the often used 30-day test period may be too short.
The maximum depth of attack is shown in Figure 3.3.6 for the warm water. ss 304 shows penetration of the sheet after 2-3 months and a very
81

·-..
deep crevice already after one month, The other alloys shown have an incubation period of 30-60 days, after which the maximum depth may increase very drastically (Nitronic 50 and ss 316) or slowly (Ferralium 255 and Hastelloy G3) .
The average depth of attack (Figure 3.3.7) shows quite similar behavior; this is the average of the five deepest crevice attacks.
Samples of SS 304 and SS 316 which were exposed for up to 293 days in the second set of crevice corrosion tests [concurrent with the corrosion tests in section (a)] give some additional information. The results are in the same range as for batch 1, except for the average depths for SS 316 in cold water, which are twice as great in the second set of tests as in the first. Results for ss 304 (Figures 3.3.8-9) show deep attack established already after 30 days in warm water and 90 days in cold while the average depths of attack for the two waters become equal after 180 days. Thus, the cold water is less aggressive over the short-term (and may be less aggressive for less severe conditions), while there is no difference between the two waters in the long run.
Results':,for SS 316 tested in the same series are shown in Figures 3.3.10-11. The maximum depth values are very similar to those for ss 316, except that SS 316 may show a slower initial attack in the warm water.
3,3.6 CONCLUSIONS
The tests have shown that there are no major surprises in the cold deep ocean seawater. The lower temperature results in lower rates of crevice corrosion attack and a number of steels which are not resistant to crevice corrosion in warm water are immune in the cold, deep ocean water. The lower oxygen level, which one might expect to accelerate the differential types of attack seen in crevice and pitting corrosion, appears to play a secondary role. (For the aluminum alloys it is generally considered that the complex carbonate/pH balance is responsible for the different behavior in the two waters). Of the materials tested, only 29-4C and Hastelloy 276 showed complete resistance under all conditions. The warm water data were compared with results obtained in temperate zone Atlantic waters (North Carolina) and showed the same general ranking of alloys in order of resistance to crevice corrosion. The rankings found here are as follows:
warm water
Al alloys 2024 3003
Fully 5456 resistant 6061-T6
29 4C *JS700 Hastelloy 276
cold water
82
29-4C Hastelloy 276 Ferralium 255 Al-6X

rank* 2 JS777 254 SMO 3 254 SMo hl~~ 4 Al-6~ 5 Hastelloy G-3 6 Ferralium 255 Hastelloy G-3; hl 6061-T6 7 hl-6X Nitronic 50 12 ss 316 304; hl 2024; hl 3003 13 Nitronic 50 16 ss 304 ss 316
*qualitative rankings from 1 (fully resistant) to 16 (worst case).
3.3.7 References to Subtask (b)
1. Bruce E. Liebert, K. Sethuramalingam and Jorn Larsen-Basse, Corrosion effects in OTEC heat exchanger materials, paper No. 42, presented at the Corrosion 80 conference at Chicago, (March 1980), pp 22-28.
2. Jorn Larsen-Basse and E.A. Kay, Macrofouling and corrosion of OTEC riser cable models after offshore exposure at Keahole point, University of Hawaii, (December 20, 1982).
3. M.G. Fontana and N.D. Greene, Corrosion Engineering, McGraw-Hill, Inc., (1978), pp 14-16, 310-313, 344.
4. J.W. Oldfield and W.H. sutton, •crevice Corrosion of Stainless Steels: A Mathematical Model", British corrosion J., Vol. 13 (1), (1978), p 13.
5. M.H. Peterson, T.J. Lennox and R.E. Groover, "A study of crevice corrosion in Type 304 Stainless steel", Materials Protection, (Jan. 1970). p 23.
6. T.s. Lee and R.M. Kain, "Factors Influencing the Crevice corrosion Behavior of Stainless Steels in sea Water", corrosion/83, April 18-22 (1983), Anaheim, CA., paper No. 69.
7. R.M. Kain, •crevice corrosion Behavior of Stainless Steel in Sea Water and Related Environments", corrosion, Vol. 40 (6), (1984), p 313.
8. A.J. Sedriks, corrosion of Stainless steels, John Wiley & sons, N.Y., (1979), p 96.
9. T.S. Lee, "Method for Quantifying the Initiation and Propagation Stages of Crevice Corrosion", Electrochemical Corrosion Testing, ASTI1 STP 727, ASTM, Philadelphia, Pennsylvania, (1981), p 43.
10. R.M. Kain, "Electrochemical Measurement of the Crevice Propagation Resistance of stainless Steels: Effect of Environmental Variables and Alloy Content•, Corrosion/83, April (1983), paper No. 203.
11. T.S. Lee and A.H. TUthill, •use of carbon Steel to Mitigate Crevice Corrosion of Stainless Steel in sea Water", Materials Performance, Vol. 22 (1), 1983, p 48.
83

,,-_-
12. M.A. Streicher, "Analysis of Crevice Corrosion Data from TWo Seawater Exposure Tests on Stainless Alloys", Materials Performance, Vol. 22 (3), (1983), p 37.
13. D.B. Anderson, "Statistical Aspects of Crevice corrosion in Sea water•, ASTM STP 576, ASTM, (1976), pp 231-242.
14. T. suzuki andY. Kitamura, "Laboratory Evaluation of Crevice corrosion Resistance of Stainless Steels", Materials Performance, Vol. 16 (10), (1977), p 16.
15. K.D. Efird, "The Effect of Temperature on crevice corrosion of Stainless Steels in Sea Water•, paper presented at 6th International congress on Metallic corrosion, (Dec. 1975), Sydney, Australia.
16. T.P. May and H.A. Humble, "Effectiveness of cathodic currents in Reducing crevice corrosion and Pitting of Several Materials in Sea Water", corrosion, Vol. 5 (2), (1952), p 50.
17. Harvey P. Hack, •crevice corrosion behavior of molybdenum containing stainle$s steels in seawater,• Materials Performance, Vol. 22, No. 6, (June 1983), pp 24-29.
18 L.S. Redmerski, J.J. Eckenrod, and c.w. Kovach, "Crevice corrosion of stainless steel welds in chloride environments,• Materials Performance, Vol. 22, No. 6, (June 1983), pp 31-39.
19. Herbert H. Uhlig, Corrosion and corrosion control, second edition, John Wiley & Sons, Inc., (1971), pp 10-12, 50, 51.
20. F.L. LaQue, Marine corrosion causes and prevention, John Wiley & sons, Inc., New York, (1975), pp 47, 175.
84

"' lJ1
TABLE 3.3.1 NOMINAL COMPOSITIONS OF STAINLESS STEELS TESTED FOR CREVICE CORROSION
s UN Type Designation Number %C Mn Si Cr Ni
Austenitic 304 S30400 0.08 2.00 1.00 18-20 8-10.5 (standard) 316 S31600 0.08 2.00 1.00 16-18 10-14
Austenitic Nitronic 50 S20910 0.06 4-6 1.00 20.5-23.5 11.5-13.5 (non- 254 SMo S31254 0.02 max. 0.5 --- 20.0 18.0 standard) AL-6X N08366 0.03 2.00 0. 75 20-22 23.5-25.5
AL-6XN -- 0.03 2.00 0.75 20-22 23.5-25.5 JS 700 N08700 0.04 2.00 1.00 19-23 . 24-26 JS 777 - 0.04 2.00 1.00 19-23 24-26
Duplex Ferralium 255 --- 0.04 0.80 0.45 25.5 5.2 ' ferritic-
austenitic (50-50)
Ferri tic 29-4C S44700 0. 01 0.30 0.20 28-30 0.15

00
"'
TABLE 3.3 .1 NOMINAL a:JMPOSITIONS OF STAINLESS STEELS TESTED FOR CREVICE CORROSION (con't)
TYPe Desiqnation NWTiber p s Mo Ol N others
Austenitic 304 S30400 0.045 0.03 -- -- -- --(standard) 316 S31600 0.045 0.03 2-3 -- -- --
Austenitic Nitronic 50 S20910 o. 04 0.03 1.5-3 --- 0.2-0.4 O.l-0.3V (non- O.l-0.3Nb standard) 254 SMo S31254 -- -- 6.1 0.7 0.2
AL-6X N08366 0.03 0.003 6-7 -- --AL-6XN -- 0.03 0.003 6-7 -- 0.04 JS 700 N08700 0.04 0.03 4.3-5 0.5 -- ave min. Nb,
0.005 Pb 0.035 Sn
JS 777 -- 0.045 0.035 4-5 1.9-2.5 -- '
Duplex Ferralium 255 --- --- --- 3.5 1.7 0.17 ferritic-austenitic (50-50)
Ferri tic 29-4C S44700 0.025 0.02 3.5-4.2 -- --

TABLE 3.3.2 NOMINAL COMPOSITIONS OF NICKEL ALL~S TESTED FOR CREITICE CORROSION
Alloy %C Cr Ni Mo Cu Si Mu Co W
Hastelloy G3 0.006 23 44 7 - 1.9 0.4 0.8 3.5 1
Fe
bal.
Hastelloy 276 0.003 16 55 15.5 0.1 0.45 1.0 3.8 bal.
87

TABLE 3 .3. 3 NOMINAL COMPOSITIONS OF ALUMINUM ALLOYS TESI'ED FOR CREVICE CORROSION
Designation Composition
2024 3003 5456
4.4 eu, 0.6 Mn, 1.5 Mg 0.12 eu, 1.2 Mn 0.8 Mn, 5.1 Mg, 0.12 Cr
88

Alloy
Al. 2024
Al. 2024
Al. ·J003
Al. 3003
A1. 5456
Ferralium 255
Jeuop 700
Jeuop 777
Haatelloy G3
Haatelloy 276
Nltronlc 50
254 SHO
TABLE 3. 3. 4 CREVICE CORROSION DATA FROt1 26 DAYS OF EXPOSURE TO WARM WATER
(Exposure dates• 7/29/83 to 8/26/83)
Boldly lnltia Final Number of sites Hax.depth
Thlckneu exposed to torque torque attacked of attack shielded in.lbs in.lbs (microns)
(rrrn) area ratio Side 1 Side 2
1.0 120:1 20 7 - 10 0 0 -1.0 120:1 52 25-26 0 0 -1.5 120:1 20 10-12 0 0 -1.5 120:1 50 25-30 0 0 -4.5 85:1 52 26 0 0 -3.0 155:1 52 26 0 0 -3.5 130:1 52 26-27 0 0 -6.0 205:1 52 26-27 .0 0 -3.0 155:1 50 25-26 0 0 - -
2.5 155:1 52 26-27 0 0 -3.0 150:1 52 .25-26 2 2 15 - 30
3.0 130:1 52 25-26 0 1 15 - 20
Severity of attack based on
1 to5 seal!!
----
' ------1
1

"' 0
$
** $
Alloy
55 304
ss 304
ss 304
ss 304
TABLE 3.3.4 CREVICE CORROSION DATA FROM 26 DAYS OF EXPOSURE TO WARM WATER (con't)
-
Boldly Initial Final Number of sites Max_. depth
exposed torque torque attacked of attack
Thickness to shield (ln.lbs (in.lbs) (microns)
(IMI) area ratio Side 1 Side 2
0.8 115:1 10 5-7 2 2 10-15
0.8 115:1 20 10-12 17 15 36-684
0.8 115:1 40 20-25 5 1 75-100
0.8 115:1 52 30 10 10 50 -700
.
$ Crevice Corrosion under epoxy
** Gravity assisted tunnelling attack originating from the crevice
Severity of attack based on 1-5 scale
1
5
3
.5

Alloy
Al. 2024
A1. 3003
Ferra Hum 255
Haatelloy G3
Haatelloy 276
Jeuop 700
Jeuop 777
Nitronic 50
254 SHO
** ss 304
TABLE 3.3.5 CREVICE CORROSION DATA FROM 98 DAYS OF EXPOSURE TO WARM \'lATER
(Exposure dates: 8/26/83 to 12/2/83)
Boldly Initial Final Number of s itea Hax.depth exposed to torque torque attacked of attack
Thickneaa shielded (in.lbs) (in.lbs) (microns) ( ..... ) area ratio Side 1 Side 2
1.0 120:1 50 25-27 0 0 -1.0 120:1 50 25-27 0 0 -3.0 155:1 50 25-27 10 0 130-180
3.0 155:1 50 22-25 7 1 60-70
2.5 155:1 50 20-25 0 0 -3.5 130:1 50 25-27 0 0 -6.0 205:1 50 25-27 1 4 20-25
3.0 150:1 50 20-25 14 0 140-400
3.0 130:1 50 23-25 1 2 20-25
0.8 115:1 so 23-25 20 20 175-788
** Gravity assisted tunnelling attack originating from t~e crevice
Severity of attack
based on lto5 scale
--3
.1 6. 2
--1
3 6. 4
1
5

Alloy
A.L. 6X
A.L. 6X N
A. L. 29-4C
Al. 6061-T6
TABLE 3.3.6 CREVICE CORROSION DATA FROM 30 DAYS OF EXPOSURE TO WARM WATER
(Exposure dates: 12/3/83 to 1/4/84)
Bol~lr Initia Final Number of sites IHax.aeptn
expose o torque torque attacked of attack Thickness shielded (in.lbs) (in .lba (microns)
(nro) area ratio Side 1 Side 2
0.8 90:1 50 27.5 0 0 -0.8 98:1 50 20-25 1 0 82
0.8 100:1 50 29 0 0 -1.5 95:1 50 24 0 0 -
:>evertty of attack
baaed on lto5 scale
-2
-' -

"' w
TABLE 3,3.7 CREVICE CORROSION DATA FROM 30 D~YS OF EXPOSURE TO COLD WATER
(Exposure dates: 12/3/83 to 1/4/84) . .
Boldly Initia Final Number of eitea exposed to torque torque attacked
Alloy Thickness shielded (ln.lbs (ln.lba Side 1 Side 2 (nwn\ lnr~A rntln
A.L. 6X 0.8 90:1 50 22.5 0 0
A.L, 6X N 0.8 98:1 50 25-30 0 0
A,L, 29-4C 0,8 100:1 50 27.5-30 0 0
* Al. 6061-T6 1.5 95:1 50 25 0 1
* This specimen has undergone significant pitting
Max.depth Severity of attack of attack (microns) based on
lto5 scale
- -- -- -
410 ' 4
.

Alloy
A. L, 6X
A. L. 6X N
A. L, 29-4C
ss 316
Al. 6061-T6
TABLE 3.3.8 CREVICE CORROSION DATA FROM 90 DAYS OF EXPOSURE TO WARM WATER
(Exposure dates: 12/3/83 to 3/1/84)
Boldly Initial Final Number of sites Hax.depth exposed t torque torque attacked of attack Thickness shielded (in.lbs (in.lbs} (microns) (nvn) !area ratio ) Side 1 Side 2
0.8 90:1 50 25 1 2 370-540
0.8 98:1 50 25 1 0 20
0,8 100:1 50 27.5 0 0 -1.5 119:1 50 32.5 2 0 110-430
1.5 95:1 50 25 0 0 -
Severity of attack
based on lto5 scale
4
2
-' 3
-

Alloy _
A. L. 6X
A. L. 6X N
A. L. 29-4C
ss 316
* Al, 6061-T6
TABLE 3.3.9 CREVICE CORROSION DATA FROM 90 DAYS OF EXPOSURE TO COLD WATER
(Exposure dates: 12/3/83 to 3/1/84) oo taty lnitia Final Number of sites
1 Max.!leptn
exposed to torque attacked of attack
Thickness shielded torque (microns)
(nvn) area ratio (in.lbs) (in.lbs) Side 1 Side 2
0.8 90:1 50 30 0 0 -0.8 98:1 50 30 0 2 30
0.8 100:1 50 27.5 0 0 -1.5 119:1 50 35 2 2 140-1010
1.5 95:1 50 30 1 2 300-720
* This sample has undergone severe pitting
'~ever tty of attack based on lt_o5 scale
-2
-' 4
4

Alloy.
Al. 2024
Al. 3003
Hastelloy G3
Haatelloy 276
Ferralium 255
Nitronic so
$ss 316
$ss 316
•• ss 304 @ ss 304
TABLE 3.3.10 CREVICE CORROSION DATA FROM 60 DAYS OF EXPOSURE TO WARM WATER
(Exposure dates: 2/23/84 ·r.o 4/23/84)
Boldly Initial Final Number of sites Hax.depth expooed torque torque attacked of attack
Thickness to shielde (in.lbs) (in.lbs) (microns) (RID) area ratio Side 1 Side 2
1.0 120:1 50 27-30 0 0 -1.5 120:1 50 32-35 0 0 -3.0 155:1 50 27-30 0 1 40
2.5 155:1 50 27-30 0 0 -3.0 155:1 50 32-35 0 0 -3.0 150:1 50 20-23 10 0 176-1014
1.5 110:1 50 30-32 1 0 20
1.5 110:1 50 27-30 1 1 15-20
0.8 110:1 50 25-27 16 16 400-730
0.8 110:1 50 30-32 0 0 -
$ Crevlce corroslon under epoxy **
Severity of attack based on
lto5 scale
--1
-'
-4
1
1
5
-
@ Gravity assisted tunnelling attack orl'gl'natl. f · nq rom crevlce --rav· · - ar-""--· -,te,, _J.,.unn~,_:a.in(- tta ...... _,, ori,....~"1at~ ..... ,.- fr'"'m pojnt- ot:b-0,.... thrln crevice
.

TABLE 3.3.11 CREVICE CORROSION DATA FROM 60 DAYS OF EXPOSURE TO COLD WATER
(Exposure dates· 2/23/84 to 4/23/84) . Boldly Initial Final Number of sites Hax.depth
exposed to torque Torque attacked of attack shielded
Alloy ~ickness area ratio (in.lbs) (in.lbs) (microns)
c ... l Side 1 Side 2
• Al. 2024 1.0 120:1 50 30-32 20 20 20-30
• Al. 3003 1.5 120:1 50 32-35 20 20 20-340
llastelloy G3 3.0 155:1 50 32-35 2 1 20-60
Haste lloy 276 2.5 155:1 50 27-30 0 0 -Ferra Hum 255 3,0 155:1 50 32-35 0 0 -
$ Nitronic 50 3,0 150:1 50 27-30 0 1 100
ss 316 1.5 110:1 50 22-25 8 20 210-880
ss 316 1.5 110:1 50 18-20 6 3 150-640
•• ss 304 0.8 110:1 50 26-28 10 7 380-740
** ss 304 0.8 110:1 50 20-22 10 2 250-780
* P1tt1ng corros1on $ Crevice corrosion under epoxy
** Gravity assisted tunnelling attack originating from crevice
Severity of attack
based on 1[to5 Sc~IP
1
3
1
-' -
2
4
4
5
5

"' 00
Alloy
Al. 3003
Ferralium 255
Haatelloy GJ
Haatelloy 276
Nitronic 50
254 SHO
·** 55 304
** 55 304
*** 55 316
••• 55 316
TABLE 3. 3.12 CREVICE CORROSION DATA l'Rot1 120 DAYS Ol' EXPOSURE TO WARM WATER
(Exposure dates: 2/23/84 to 6/25/84)
Thickness Boldly Initial Final Num~~~8~(e~itea
Hax.depth
exposed to torque torque of (mm)
ahield~~i, (in .lbs (in.lba) Side 1 attack
ArPA rAI In Side 2 fm~rrnna\
1.5 120:1 50 25 - 27 0 0 -J.O 155:1 50 22 - 25 J 1 800
3.0 155:1 50 20 0 12 220
2.5 155:1 50 15 - 20 0 0 -J.O 150:1 50 22 - 25 9 7 1190
3.0 130:1 50 15 - 20 1 0 20
o.s 115:1 50 22 - 25 1 0 750
0.8 115:1 50 15 - 20 4 5 800
1.5 115:1 50 22 - 25 4 1 660
1.5 115:1 50 20 1 2 570
** ***
Grav1ty ass1sted tunnell1ng attack or1g1nat1ng from crev1ce Local attack of vertical edges
Severity of attack
baaed on llto5 acale
-4
3
. -4
1
4
5 .
4
3

Alloy
Al. 3003
Ferralium 255
Hastelloy G3
Haatelloy 276
Nitronic 50
254 SHO u @
ss 304
** ss 304
ss 316
ss 316
TABLE 3.3.13 CREVICE CORROSION DATA FROM 120 DAYS OF EXPOSURE TO COLD WATE~
(Exposure dates: 2/23/84 to 6/23/84)
Boldly Initial Final Number of sites Kax.depth
Thickness exposed to attacked f attack torque torque ( mm) ahi~!~~d (in.lbs) (in.lbs (micronn)
IArPn lo Side 1 Side 2
1.5 120:1 50 25-28 20 20 840
3.0 155:1 50 25 0 0 -3.0 155:1 50 25 5 1 100
2.5 155:1 50 22-25 0 0 -
3.0 150:1 50 20-25 7 2 580
3.0 130:1 50 25-27 1 0 20
0.8 115:1 50 17-20 4 1 780
0.8 115:1 50 25-27 3 5 760
1.5 115:1 50 22-25 14 0 790
115 11511 50 25 14 17 1200
** Gravit y assisted tunnellin g attack orl lnatln g g trom crevlce
severity of attack based on lto5 scale
4
-3
-3
1
5
5
4
5
@ Gravity assisted tunnelling attack oriainating from point other than crevice

1--' 0 0
Alloy
Al. 2024
Al. 3003
Al. 5456
Al. 6061-T6
ss 304
ss 316
Jessop 700
Jessop 777
Ferralium 255
Nitronic 50
254 SHO
Hastelloy GJ
TABLE 3.3.14 SUMMARY OF WARM WATER DATA
Total number of sites Single Hax,depth of Average depth of attack * based on all sites Rank attacked attack (microns) attacked (microns) baaed on
30 60 90 120 30. 60 90 120 30 60 90 ~=? 1 to 16
dave dAVA <lAVA <lAVA <lAVA <lAVA .~ .... <lAVA <lAVA ,!,.,. .! .... numerical fig.
0 0 0 - 0 0 0 - 0 0 0 - 1
0 0 0 0 0 0 0 0 0 0 0 0 1
0 - - - 0 - - - 0 - - - 1
0 - 0 - 0 - 0 - 0 - 0 - 1
20 32 40 9 700 730 788 BOO 170 260 325 640 16
- 1 2 5 - 20 430 660 - 20 270 480 12
0 - 0 - 0 - 0 - 0 - 0 - 1
- 0 5 - - 0 25 - - 0 20 - 2
0 0 10 4 0 0 180 800 0 0 15 250 6
4 10 14 16 30 1014 400 1190 20 400 240 365 13
1 - 3 1 20 - 25 20 20 - 20 20 3
0 1 8 12 0 40 70 220 0 40 65 85 5

1-' 0 1-'
TABLE 3.3.14 SUMMARY OF WARN WATER DATA (can't)
Total number of sites Single Max,depth of Average depth o.f attack based on all sites
Alloy attacked attack (micron•) attacked (microns) 30 60 90 120 30 30 90 120 60 90 1~~. 60
day a days day a days davs days days da s da~s days days days
Hastelloy 276 0 0 0 0 0 0 0 0
A.L, 29 - 4C 0 - 0 - 0 - 0 -A.L, 6X 0 - 3 - 0 - 540 -A.L, 6X N 1 - 1 - 82 - 30 -
* 1, ia clasaified sa the highest crevice corroaion reaiatance 16, is classified aa the lowest crevice corrosion reaistance
0 0 0 0
0 - 0 -0 - 300 -
82 - 30 -
Ascending from 1 to 16 represents gradually decreasing crevice corroaion reaistance
Not tested,
.. Rank b11.sed
on 1 to 16 numerical figures
1
1
7
4

..... 0
"'
Alloy
Al. 2024
Al. 3003
Al. 5456
Al. 6061-T6
ss 304
ss 316
Jeaaop 700
Jeaaop 777
Ferralium 255
Nitronic 50
254 SHO
TAJ3LE J. 3 .15 SlJ[oll''!l\RY OF COLD WATER DATA
• Total number of sites Single Max.depth of Average depth of Rank baaed
attacked attack (microns) attack baaed on all on 1 to 16 sites attacked(microns) numerical
30 60 90 ~!:~ 30 60 90 120 30 60 90 ~~p figure a dsvs dave dav• ~AVB days days days daya days days da a
- 40 - - - 30 - - - 25 - - 10
- 40 - 40 - 340 - 840 - 70 - 130 ll
- - - - - - - - - - - - -
1 - 3 - 410 - 720 - 410 - 340 - -
- 17 - 8 - 740 - 760 - 250 - 630 13
- 28 4 31 - 880 1010 1200 - 335 385 430 15
- - - - - - - - - - - - -
-- - - - - - - - - - - -- 0 - 0 - 0 - 0 - 0 - 0 0
- 1 - 9 - 100 - 580 - 100 - 275 7
- - - 1 - - - 20 - - - 20 2

f-' 0 w
TABLE 3.3.15 SU~~ARY OF COLD WATER DATA (can't)
Average.depth of Total number of sites Single Hax.depth of attack baaed on all
attacked attock (microns) ~itea attacked(microna) Alloy
30 60 90 120 30 60 90 120 30 60 90 120
days days days days day a day a days dsya l!aya diiv" day& day a
Hastelloy GJ - 3 - 6 - 60 - 100 - 40 - 90
Haatelloy 276 - 0 - 0 - 0 - 0 - 0 - 0
A.L. 29 -4C 0 - 0 - 0 - 0 - 0 - 0 -A.L. 6X 0 - 0 - 0 - 0 - 0 - 0 -A.L. 6X N 0 - 1 - 0 - 30 - 0 - 30 -
* 1, ia classified 110 the highest crevice corrosion resistance 16, is claaoified a11 the loveat crevice corrosion resiatance Aacending from 1 to 16 repreaents gradually decreeing crevice corrosion resistance
Not tested.
*Rank baaed on 1 to 16
numerical figure&
6
l
l
l
3

TABLE 3.3.16 EFFECT OF TORQUE IN WARH WATER
(E xposure d a tea: 3/23/84 t 4/23/84) 0
Boldly Initial Final Number of sites Hax,depth Severity of attack
Thickness exposed to torque torque attacked of attack baaed on
Alloy shielded (in.lba (in.lbs) (microns) (mm) area ratio
Side 1 Side 2 lto5 scale
** ss 304 0.8 119:1 40 40 1 1 680-710 4
** ss 304 0.8 119:1 60 45-50 7 4 360-790 5
** ss 304 0,8 119:1 80 75-80 8 7 20-620 5
+ 1 0 760 4 ss 304 0.8 119:1 100 90-95
@ ss 304 0.8 119:1 120 100-105 0 0 . -ss 316 1.5 119:1 40 30-35 3 2 60-750 4
+ 0 0 ss 316 1.5 119:1 60 60 - -+ ss 316 1.5 119:1 80 65-70 0 0 . - .
ss 316 1.5 119:1 100 100 1 2 20-720 4
+ 0 ss 316 1.5 119:1 120 100 0 - -
** + @
Grav1ty ass1sted tunnell1ng attack or1g1nating from crev1ce Edge attack r:,.-,_vitv assisted. tunnelling attack originating from point other than crevice
.

f-' 0 U1
TABLE 3. 3 .17 EFFECT OF TORQUE IN COLD ~lATER
(Exposure dates: 3/23/84 to 4/23/84)
Boldly Initial Final Number of sites
Alloy Thickn.,ss exposed to torque torque attacked
shleld.,d (ln.lba (in.lbs) (nwn) •rea r&tio Side 1 Side 2
ss 304 0.8 119:1 40 30-35 3 3
ss 304 1.5 119:1 60 45-50 5 3
ss 304 1.5 119:1 80 65-70 14 0
+ ss 304 1.5 119:1 100 75-80 0 0
ss 304 1.5 119:1 120 ll0-115 4 15
ss 316 1.5 119:1 40 30-35 1 6
ss 316 1.5 119:1 60 50-55 8 2
ss 316 1.5 119:1 80 60-65 11 1
-+ Edge attack
fillX.depth Severity of attac k of attack
(microns) based on 1to5 scale
305-640 5
20-770 5
280-760 4
- -180-610 4
50-680 4
20-460 4
15-380 3

1-' 0
"'
TABLE 3.3.18 EFFECT OF AREA RATIO
(Exposure dates• 5/9/84 to 6/7/84)
Boldly Initia 1 Final Number of sites exposed to torque attacked
Alloy :r"hickness shielded (1n.1bs)
torque
(nrn). area ratio (in.lbs) Side 1 Side 2
ss 304 1.5 7:1 100 75-80 3 0
SS.304 1.5 16:1 100 60-65 10 7
** ss 304 1.5 250:1 100 55-60 15 3
ss 316 1.5 143:1 100 50-55 20 17
ss 316 1.5 209:1 100 70-75 14 11
ss 316 1.5 250:1 100 60-65 14 14
+ ss 316 1.5 293:1 100 50-55 14 17
+ ss 304 1.5 209:1 100 8D-85 0 0
¢ ss 304 . 1.5 293:1 100 70-75 6 1
** +
Grav~ty ass~sted tunnell~ng attack or~g~nat~nCj from crev~ce Encre a.ttack ~dL_Eac~- ~-OVC __ .__~ W:...~~· SC•.·.~--
Max.depth Severity of attack of attack (microns) based on
1to5 scale
50-1200 4
60-1000 4
290-1230 4
320-830 4
240-1080 4
240-1460 5
400-1490 5
- -10D-175 2

TABLE 3.3.19 DATA FOR SS 304 AND 316 EXPOSED FOR 31 DAYS
BOLDLY TORQUE NU1,EER Of DEPTH Of ATTACK ~I.TERIAL THICK. EXPOSED {in, I bs l SITES ATTACKED { urn ) REHARKS
{ em ) TO SHIELDED -------------------------------------------------AREA RATIO II< IT. fiNAL SIDE 1. SIDE 1' HAX. AVERAGE Of 5
J
304 " 0. 144 ! 34 : 50 35 1 8 68 41 ·'•
304 6C 0. 144 136 : 50 3~ 6 11 310 18U
3Q~ !5W 0.! 4~ 132 : ~, e "' -- 14 2D !210 659.8
'n A 16~ 0. \44 ,, : 50 35 I 0 \0 lZ44 655.2 .,~..,., '" oC
3! E- 5C' D. !48 131 ; 50 .<n 4 60~ 350.8 .. w
316 6C 0. 148 128 : 50 35 11 18 519 455.8
3!6 \5\;' 0. 148 !33 ; I 5[1 " 16 19 976 790.2 .. ~.
3\6 JSW 0. 148 Ill : 5D 30 20 I J m 7Q6
' NOTE !. C ; SPECIMEN EXPOSED IN THE COLO SEHI.TER TROUGH
2. W ; SPECI~EN EXPOSED !N THE WARH SEA-WATER TROUGH
107

I ;
TABLE 3.3.20 DATA FOR SS 304 AND 316 EXPOSED FOR 106 DAYS
BOLDLY EXPOSED
~ATERII.L THICK. TO SHIELDED
TORQUE ( in. lbs )
NUMBER OF SITES ATTACKED
DEPTH OF ATTACK ( urn )
(em) AREA RATIO !NIT. FINAL SIDE I. SIDE 2. MAX. AVERAGE OF 5
301 IC 0 .Ill 134.8 50 31.5 12 19 942 705.6
304 zc 0.14~ 133.8 50 37.5 8 I I I 180 702.0
104 ! I W 0. I 44 110. e 50 37.5 14 19 1240 946.0
304 12W 0. I 44 I 33.8 50 37.5 13 20 I! 78 724.8
316 IC 0.148 I 30.0 50 37.5 5 15 718 55 I. 0
316 2C 0.148 I 3 I. I 50 31.5 8 I 0 790 618.6
316 ! IW 0. I 48 130.2 50 31.5 9 15 I 3 4 0 895.1
316 IZW 0. I 48 13U 50 31.5 I I 9 I 128 158.6 ATTACK
• NOTE I. C SPECI~EN EXPOSED IN THE COLD SEA-WATER TROUGH
1. W SPECIMEN EXPOSED IN THE WARH SEA-WATER TROUGH
108
REMARKS
I-SITE PERFORATED
PITTED ADJACENT OF CREVICE
PERFORATED
GRAVITY ASSISTED ATTACK GRAVI1Y ASSISTED
i '

TABLE 3.3.21 DATA FOR SS 304 AND 316 EXPOSED FOR 182 DAYS
BOLDLY EXPOSED
~ATER!AL THICK. TO SHIELDED AREA RATIO
304 JC 0.144 136 :
3D4 ~c 0.144 138 :
::,o~ !3W 0.144 136
304 l4W 0. ! 4 4 ! 33
31£ 3[ 0. 148 Ill
316 !C 0.! 48 132
316 m G .148 I 36 :
3!6 !4W 0. 148 I 3 I :
TORQUE (in. lbs)
I NIT. FINAL
50 25
50 30
50 J 2. 5
50 27.5
50 35
50 3D
50 32.5
50 32.5
NU~,BER OF SITES ATTACKED
SIDE.! SIDE.2
20 20
18 15
II 14
16 20
!9 19
18 11
14 11
14 13
' NOTE I. C ; SPEC I HEN EXPOSED IN THE COLO SEA-WHER TROUGH
2. W ; SPEC!~EN EXPOSED IN THE WAR~ SEA-WATER TROUGH
109
DEPTH OF ATTACK (.urn I
HAX. AVERAGE OF 5
1280 969.6
1064 955.~
1308 II 00.2
989 754.8
1117 BIU
1263 ~20.8
947 73!. 4
1111 782.6
REMARr.S
!·SITE PERFORATED
GRAVITY ASSISTED ATTACK
GRAVITY ASSISTED I.TTACK

TABLE 3.3.22 DATA FOR SS 304 AND 316 EXPOSED FOR 293 DAYS
BOLDLY TORQUE NUMBER OF DEPTH OF ATTACK EXPOSED TO I in. lbs) SITES ATtACKED I urn )
!ATERIAL THICK. SHIELDED ----------- ----------------- ----------------- REMW;S (em) AREA RAT! 0 !NIT. FINAL SlOE I. SIDE 2. !AX. AVE. OF 5
304 )( 0. 144 !32: I 10 30 I~ 5 812 840 GRAVITY ASSISTED ATTACK & PERfORATED
304 BC 0. 144 Ill: l 50 25 l l 1218 995 GRAVITY ASSISTED ATTACK & PERfORATED
30~ ll'' ... 0. 144 ! lO: I 50 30 12 \8 1100 713 GRAV lTY ASSISTED ATTACK ! PERFORATED
104 181\ 0.! 44 ! 3!: 1 50 25 II II 1285 900 GRAVITY ASSISTED ATTACK ! PERfORATED
316 )( n 1 A ~J "' ....... ! 2 ~I: l 50 30 ! l 1190 359 GRAVITY ASSISTED ATTACK
,. J 'b ec 0.148 ! 3~: I 50 30 7 i8 Ill 0 liS I GRA.ViTY ASSISTED ATH.c~: !
PERFORI.TED 316 l7W 0. l ~3 ! 33: l 50 30 l 1400 782 GRAVITY ~.SS1STED HTACr- !
PERfORI.TED l\6 !8W Q 1 Hl . , .. .., i 23:! 10 30 I: IS 1240 ! Q~, 4 GRAVITY ASSISTED !.TTW: !
PERFORATED
• fiOTE I. C ; SPeCIMEN EXPOSED !N THE COLD WATER TROUGH
2. W ; SPECIMEN EXPOSED IN THE WARM WATER TROUGH
110

TABLE 3.3.23 SUl".l:ARY OF TABLES 3.3.19-22
KAX I ~.UK DEPTH or ATTACK (urn) AVERAGE or 5 DEEPEST PIT I uo,) NUMBER OF ATTACKED CREVICE
MATERIAL ENVIRON. ------------------------------ ----------------------------- ---------------------------Exposed Duration (days) Exposed Duration (days) Exposed Duration (days) ll lOb I 82 293 3 l IOo IBZ 293 3 I 106 182 293
30~ 55 c w 32 0 l! so 1280 1238 !53 104 913 958 ! 0-2 3 19-31 35-40 6-19
'jj\ ~ ss w w 1270 12A Q !308 1285 E-58 837 928 1037 28-34 30-3? 26-29 22-30 _,,. ..
316 55 c w 60~ 10. r, ' _, l- !2o3 I J I 0 ~03 615 B'' "I 12 57 8-29 \B-10 35-38 14-25
316 ss w w 97E. : 3 4 [I I! 12 1400 748 827 757 I! 52 33-35 20-24 27-3! 8-35
' fiOTE ! . C W ; SPEC!KEN EY.POSEO lfl THE COLD SEH'lTER \ROUGH
2, W W ; 5PECIWl EXPOSED IN THE WARK SEA-WAER TROUGH
111
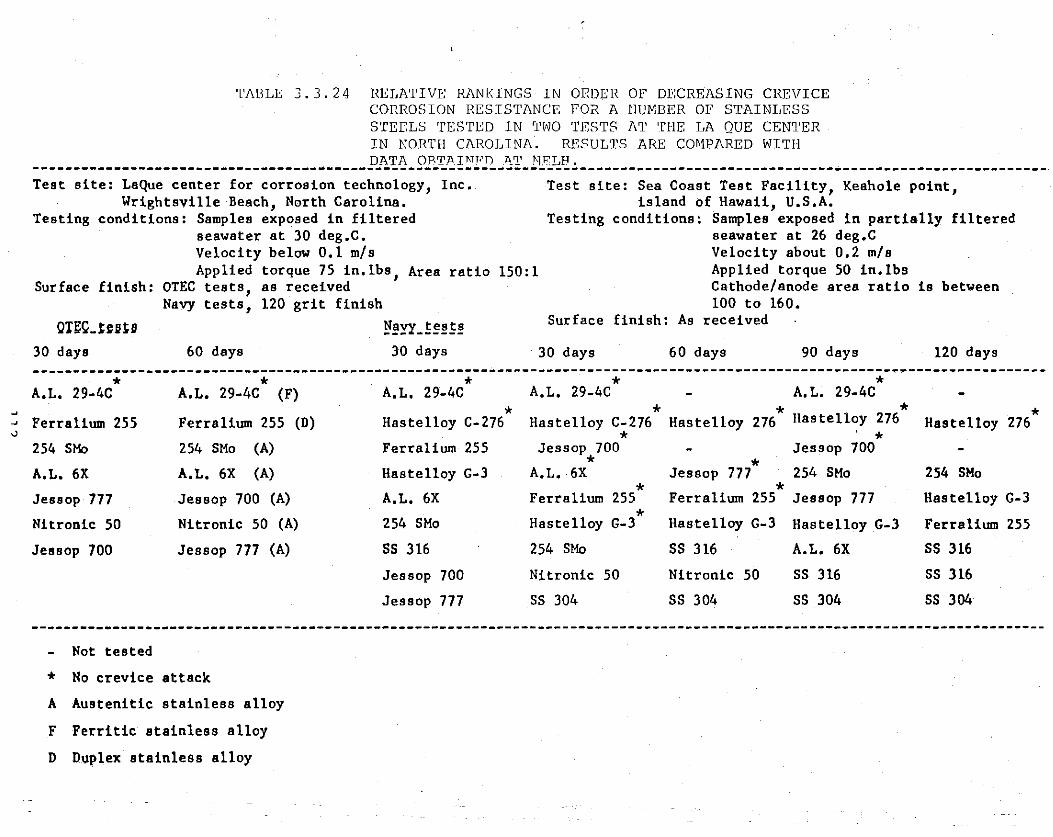
~
"
'l'l\!3LE J. 3. 2 4 REI,A'l'IVE RANKINGS IN ORDER OF DECREASING CREVICE CORROSION RESISTANCE I'OL\ A NIJMI3ER OI' STAINLESS STEI:LS TESTED IN 'l'WO TESTS Nl' THE LA QUE CENTER IN NORTH CAROLINA. RESULTS ARE CO~IPARED WITH DATA OBTIIJ'117[) i'I_T N.J"CLB.
----------------------------------------------------------------------------------------------------------------------------· Test site: LaQue center for corrosion technology, Inc.
Wrightsville Beach, North Carolina. Testing conditions: Samples exposed in filtered
seawater at 30 deg,C. Velocity below 0.1 m/s Applied torque 75 in,lbs, Area ratio 150:1
Surface finish: OTEC tests, as received
QUQ_J;uU
30 days
Navy tests, 120 grit finish
60 days !:l!n'-!~!!H 30 days
Test site: Sea Coast Test Facility, Keahole point, island of Hawaii, U.S.A.
Testing conditions: Samples exposed in partially filtered seawater at 26 deg,C Velocity about 0,2 m/s Applied torque 50 in,lbs Cathode/anode area ratio is between 100 to 160.
Surface finish: As received
30 days 60 days 90 days 120 days
----------------------------------------------------------------------------------------------------------------------------* * * * * A.L. 29-4C A.L. 29-4C (F) A,L, 29-4C A, L, 29-4C A.L. 29-4C
* * * * * Ferralium 255 Ferralium 255 (D) Hastelloy C-276 Hastelloy C-276 Hastelloy 276 Has telloy 276 Hastelloy 276 * * 254 SMo 254 SMo (A) Ferralium 255 Jessop 700 Jessop 700
* * A.L. 6X A.L, 6X (A) Hastelloy G-3 A.L. · 6X Jessop 777 254 SMo 254 SMo
* * Jessop 777 Jessop 700 (A) A.L. 6X Ferralium 255 Ferralium 255 Jessop 777 Hastelloy G-3
* Nitronic 50 Nitronic 50 (A) 254 SMo Hastelloy G-3 Hastelloy G-3 Hastelloy G-3 Ferralium 255
Jessop 700 Jessop 777 (A) ss 316 254 SMo ss 316 A.L, 6X ss 316
Jessop 700 Nitronic 50 Nitronic 50 ss 316 ss 316
Jessop 777 ss 304 ss 304 ss 304 ss 304
----------------------------------------------------------------------------------------------------------------------------Not tested
* No crevice attack
A Austenitic stainless alloy
F Ferritic stainless alloy
D D~plex stainless alloy
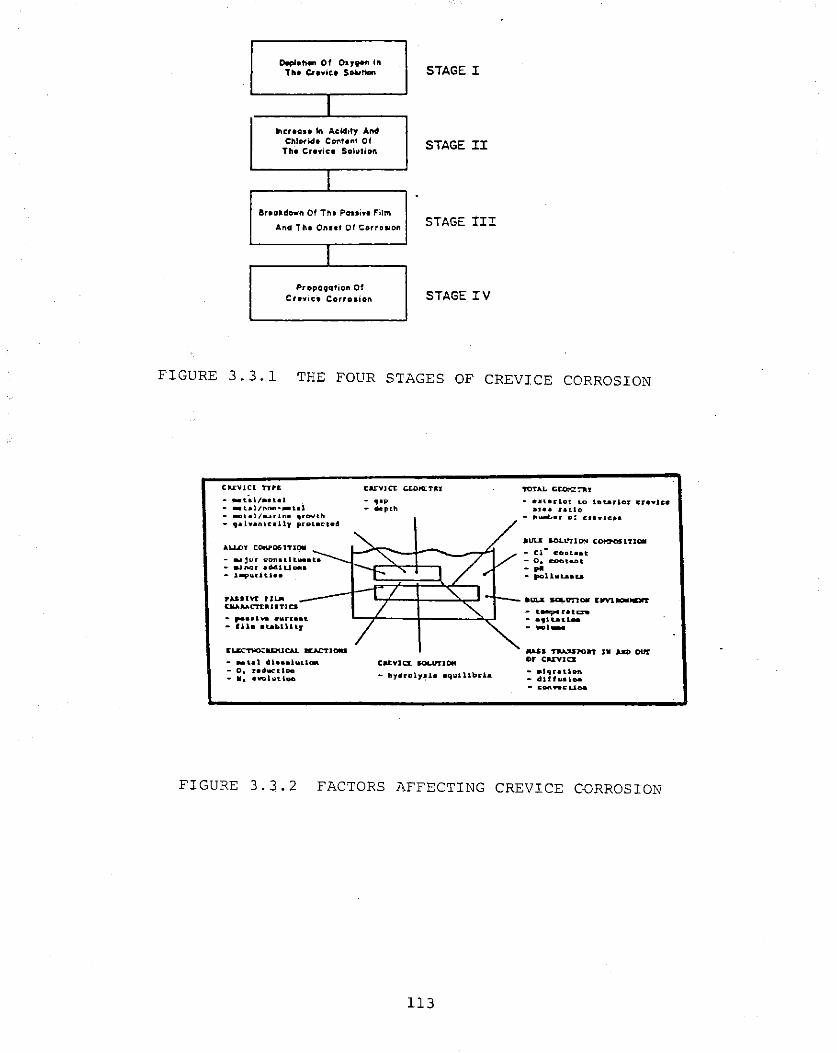
Dlpi•tien Of oa,v-n In Tl•• Cr1•iCI SO.Wtion STAGE I
I ._c:nou In Acld•ty ...
Cllloridl CD'f\,UI Of Th• Cr•vic• Sollftiol'l STAGE II
I Brlolldown Of Th• Po'lliYI Film
And Th• On .. t Of Corro~o~on STAGE III
I PropOjJation Of
Crev•c• Corro•ion STAGE IV
FIGURE 3.3.1 THE FOUR STAGES OF CREVICE CORROSION
CIU:VlCl TTI'E
• _t. .. l/•eUI -t.•l/nnft·-t.•l -••1/-...rln• •rowtl'l
• 9•1••nlc•lly pcot.•ct•d
o\U...OJ COrU'OSITSOII
- -jur t~>On•tll-•t• • IIJ.ngr •dod.IU-• - J..-purltl••
JI.UIIYT r Jl~ QI..\IU.C'TJ:II.'IICS
- ....... C'lll"l"llt.
- fll• •ut.llltr
ltL.P:"nn:IlDUC.U. KAC'!'lOitl
..,t.•l dh•ol•tl-D, reduoetl-
- II, •-l~~otloe.
catvla. KOL.U"''JOtl
- brdroly~l• eq~~ot.llDrla
lllii"IG: lO liiUCIOI" CI"IYICI are• ••t.IO
• ~w.Lec O! CIIYICII
.U\..I 50L1.."Tl ~ COt'7CIS l'llCIII
• Cl• C011t.e1t -c. -tent - .. • polllll.IIIU
.Ul,ll; RILVTll* EIIFVIIC*..n
- ........ l'.t~ - •tlt . .llt. .... ·-·-MSS ~10n Ill ACI DU'I' or cuv1a - ..s,,.,,_ - dllfu.sl-- CIMI .... CLioa
FIGURE 3.3.2 FACTORS AFFECTING CREVICE CDRROSION
113

e 3
~
0.50
Cl 025 w u > w a: u
0.05
INCREASED t RESIS'UHC[ GAP
IXPTH
0.1 0.2 0.:3 0.4 0.5
CREVICE DEPTH (em)
FIGURE 3.3.3 MODEL PREDIC7ION3 OF GEOHETRIC LIMITATIONS
TO THE RESISTANCE OF SS 304 AND SS 316 TO
CREVICE CORROSION ATTACK IN SEA\\'ATER
114

C. Plc 'Yi..., of .Ut.:ipll c:r..,.:L~ Yit.b tr.-p:l21u. ahaped arau c.rartc.e •1 ue
. _, obowiAI
I
I , .. I
a. Crrrico llut
l
.. .. r-1•
I ~lolt
FIGURE 3. 3. 4 DETAILS OF l'lUI.TIPLE CREVICE l'.SSE11BLY
115
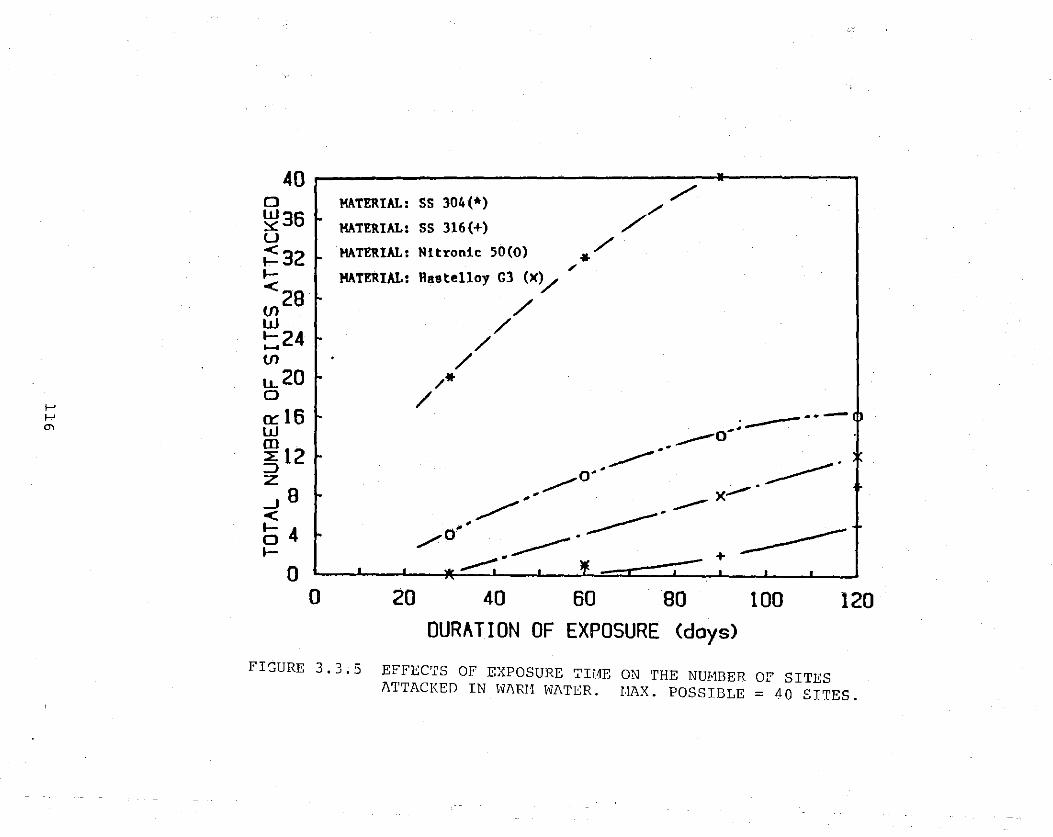
f-' f-'
"'
40 0 w35 r ~ u ~32 I" ..... <28 t' (/) w ..... 24 ....... I" (/)
LL20 f" 0
a:: 16 t' w ~12 ::J
I" z _Ja t' < b4 .....
0 0
MATERIAL: SS 304(*) //
MATERIAL: SS 316(+) ~
MATERIAL: Nttronic 50(0) * / , MATERIAL: Rastelloy G3 (K~
/ /*
/
20
/ /
/
40 60
/
. -----1 .-__-o· .
------ + --------J
80 100 120
DURATION OF EXPOSURE <days>
FISURE 3. 3. 5 EFFECTS OF EXPOSURE ':'I!1E ON 'THE NUHBER OP SITES ATTACKED IN lvARt1 WATER. tiAX. POSSIBLE = 40 SITES.

,.... en c o· 100 L u ..... E 'J BOO ~ u < 1-
f-' 1-f-' < 600 -.J
lL a :::c 400 1-0... w a
• X 200 < ~
0 0
SS 304(*), Haotelloy G3(e)
ss 316(+) ~ FerraUum 255 ()() ·
Nitronic 50(0) / ' , 0
-----· Maxt.ua pooolble depth of attock for SB JOt.
------~----·--·--------~------·-·X·------• • ~--. ------- * __. I +
I ' j
I
I
I
30 60 90 DURATION OF EXPOSURE
120 (days>
l'IGURE 3.3.6 MAX. DEPTH Ol' ATTACK IN NARM WATEH
150

100 ,... ss 304(*) II) c ss 316(+) 0 L BOO Ferralium 255(~) u .... Nitronic 50 (0) E .....,
Haatelloy GJ (e)
* ~ 600 u / <
1-/ 1- + ...... <
/ ...... (JJ
lJ... 400 0 / 0
/* 0
:c ./" 1- *- + x"" 0... .......... 0 w 200 _.... / D * ....... ..
• -u >
-~---< 0
0 30 60 90 120 150 DURATION OF EXPOSURE (days>
FIGURE 3. 3. 7 1\VEMGE DEP'l'H OJ" A'l'TACK IN WARN WATER

150[ .
r-
,...... 130[ 0 E r- 0 -o-·- -*--::J .
....__, J * r-_y I u 11 oc 0 +-' +-' < LL 900 r , 0
I f-' ss 304 [[rev ice] f-' L r-\D
+-' D... 700 QJ - ,
D I - *• Cold Water • •
X 0 SOOr- • 0; Warm Water
L: I r-
300 if- L I l I I I I I
0 60 120 180 240 300
Days FIGURE 3.3.8 MAX. DEPTH OF ATTACK IN \i1Z\R!1 AND COLD WATER
POR SS 304 EXPOSED IN THE SECOND SET OF TESTS

120
FIGURE 3. 3. 9 AVERAGE DEP'l'H OF ATTACK IN WARI1 AND COLD WATER FOR SS 304 EXPOSED IN THE SECOND SET OF TESTS

I I
60
FIGURE 3.3.10
0
I
MAX.
I I
120
Doys
*• • Cold Woter
o; Worm Woter
I I I
180 240
DEPTH OF ATTACK IN WARH 1\ND COLD WATER FOR SS 316 EXPOSED IN THE SECOND SET OF TESTS
I
300

_y u 0
+-> +-> < 4-0
L +->
f-' ()_ N N OJ
D
• OJ > <
150 J.--
130
110
900
700
500
*• • 0;
------------- ---------~
SS 316 [Crevice]
Cold Woter
Worm Woter
0
3oo~~L--~L-~L--~--~--~--~--~--~--~
0 60 120 180 240
Doys FIGURE 3.3.11 AVERAGE DEPTH OF ATTACK IN WARH AND COLD WATER
FOR SS 316 EXPOSED IN THE SECOND SET OF TESTS
300

3.4 Subtask (c): Abrasion of Cable Materials Under Simulated Marine Cond~t~ons
3.4.1 Background
During deployment of the H~~ it is conceivable that sections of the cable will become suspended between outcroppings of rock on the ocean floor. The suspended sections would be affected by tidal currents [1] which, under certain circumstances, could result in twice-daily abrasion of the cable against the rock.
The purpose of the present test series was to obtain some initial experience with the behavior of various cable materials during abrasion by typical Hawaiian marine rocks. Since the outer polypropylene serving of the cable will be the first component to experience abrasion, the test series was built around polymeric test materials. Late in the program it was learned that the resistance of the steel armor wires is a more critical factor, and some preliminary abrasion tests of this material were also included.
3.4.2 Brief Review of the Literature
Abrasive wear is the material loss caused by hard particles sliding in contact with surface. Almost all the research done to date has been on metallic samples abraded by hard, sharp particles. For these conditions, it has been found that [2]:
o wear per unit sliding distance is constant after an initial running-in period, if fresh abrasives are supplied continuously,
o wear is proportional to the applied load, so long as the load is insufficient to crush the abrasives,
o wear is inversely proportioned to the hardness of the abraded surface; minor variations to this relationship is found when hardened steels are abraded or when metals of low ductility are the specimen materials, and
o wear is independent of specimen size within certain limits.
Most studies have been conducted with abrasives which are considerably harder than the metal surface. It has been found that the mechanism of abrasive wear under these conditions has the following components [2]:
o formation of craters and grooves in the specimen surface by plowing, backwards extrusion, and microcutting with chip formation,
o surface fatigue due to repeated contacts, and o microspalling due to brittle fracture around the contact area
between individual abrasives and the metal surface.
The plastic deformation processes predominate for ductile metals abraded by hard, sharp abrasives, while the fatigue component increases in relative importance when the abrasives are rounded or less hard; the brittle spalling component becomes important for metals with a ductility less than 1-2%.
When the hardness of the abrasive is less than 1.2 times the hardness of
123

the metal surface, it is no longer able to indent the surface and form grooves and craters. Relatively little effort has gone into study of these conditions. Basically, the wear rates are much lower, and the wear mechanism becomes predominantly a contact fatigue mechanism, combined with a "pot hole" effect - where poorly supported regions around edges and surface defects are gradually removed by frictional forces [3].
For polymers much less is known about their abrasion behavior and the mechanisms and property relationships are not well established. Since polymers generally deform by very large elastic strains before plastic deformation or fracture set in it has been proposed that the wear rate in abrasion is inversely proportional to the indentation hardness and to the product of ultimate strength and elongation to fracture [4]:
w = k]JL/H·S·E (l)
where w is the wear per unit distance, k is a constant, ]J is the coefficient of friction, L is the applied load, H is the indentation hardness, S is the ultimate strength, and E is the strain to fracture.
It is known that local melting may occur at the points of abrasive contact depending on the properties of the polymer and the operating conditions. This may modify the property values which should be applied in equation ( 1).
Fatigue appears to be an important factor in many cases of abrasive wear [5]. This may also be the case for polymers but since their general fatigue behavior is poorly understood it is not readily possible to test wear data for fatigue contributions. Jain and Bahadur [6] have derived a wear equation which relates the fatigue wear of polymers to a number of parameters such as topography of the mating surfaces, fatigue resistance, and operating conditions. The wear per unit sliding distance is derived to be:
w = ll[.·Fo(h) ·Vp· (Kl· p)t. (Aon)l-t
[ (2TT/3 ·So· S·a ·F1 (h) 1t
where w = ll[.= Vp= p = t = Ao=
T1 = So =
(3=
volume wear per unit distance, line density of asperities average volume of a wear particle normal load a materials fa,tigue constant (see below) nominal area of contact surface density of asperities failure stress for single-cycle loading asperity radius of curvature, and
( 2)
a= F0 (h)
standard deviation of asperity height distribution, and F1(h) are given by:
CD
Fn(h) = f (s-h)n¢(s) ds h
( 3)
where s and h are standardized variables which are obtained by normalizing the heights d (the distance between the reference planes of the surfaces in contact) and z (asperity heights), such that
124

h = d/cr s = z/a
(4) (5)
In equation (3) ¢ (s) is the distribution function for s, and n is a variable equal to 0 or 1.
The fatigue coefficient t in equation (2) is obtained from the simple · general fatigue equation for the material
(6)
where Nf = number of cycles to failure s0 = failure stress in single-cycle loading s = applied stress
The applied stress in uniaxial testing, s, is related to the wear particle-ge~erating surface shear stress, Kl, by
s = (7)
and K1 is given by
Kl = i (4+v) 1T + ll-2v 8 3
( 8)
where vis Poisson's ratio, and f is the coefficient of friction.
Equation (2) is too complex to be applied for most wear conditions. However, for the same size and size distribution of asperitives (abrasives) and for constant specimen area the equation predicts that, if the wear particle volume can be assumed to be constant:
W<X IP·Kl }t \ S'So
for the same material and abrasive:
w <X pt
( 9 )
(10)
which is similar to a relationship proposed earlier by Throp [7] for wear of polymers against metallic gauze. Throp found the exponent to be larger than one for wear on gauze, equal to one for wear on fresh sandpaper, and less than one for wear against surfaces which would lose abrasiveness with time (by clogging of "valleys" in the surface or by deterioration of abrasives).
Not much work has been published on the abrasion of polymers or other materials in slurries. In a recent study Madsen [8] found that, as might be expected, the wear rate is constant if fresh abrasives are used in a flow-through system, while it decreases with time if the abrasives are not renewed.
The ASTM (G75-82) has a recommended test for determining the abrasivity of slurries. It defines a "Miller Index" as a "departure number", which is a measure of the deviation from linearity of the volume wear-time curve. It
125

is based on a wear equation of the form:
V = A·tB (11)
where V = volumetric wear t =time (hours), and A,B = constants depending on experimental conditions, abrasive, and
specimen properties. constant A is the amount of wear after one hour, and thus is related to the properties of the materials, and constant B determines how the abrasive changes with time. The Miller departure number is calculated by dividing the second derivative of the curve given by equation (11) by its first derivative
DN= 100 d2V/dt2
. dV/dt (12)
The value of the departure number is negative if there is a loss of abrasivity with time and positive if there is an increase.
3.4.3 Experimental
3.4.3.1 Abrasives
The rocks on the ocean floor will be either coral or pillow lava from undersea eruptions. The coral is largely soft calcium carbonate, caco3, which is not expected to generate much wear. However, coral reefs usually also contain remains of silica concentrating organisms in small amounts. It is expected that these silica particles will be responsible for most of the abrasion.
Lavas are somewhat more complicated. Their composition, mineralogy, and grain size vary from location to location. For our purpose however, there is a great deal of similarity in composition between the different flaws on Mauna Kea, the different flows at Kilauea, and between the two families of flaws (see Table 3.4.1). The lava used in the present tests was collected at Kilauea from a recent lava flow. It can be expected to have a composition similar to that of the flaws in the channel, which should be of the Mauna Kea type.
The most abundant minerals in lava are Pyroxene, Feldspar and Olivine. A typical lava contains some 48% Pyroxene, 33% Plagioclase (Feldspar), 8-10% glassy phase, and 3-5% Olivine [9]. The Olivine begins to crystallize first and, depending on the rate of cooling, may grow to relatively large grain sizes.
The hardness of the various typical minerals are listed in Table :3.4.2, together with some common commercial abrasives. It is expected that the Olivine, because of its great hardness, will be responsible for the majority of the abrasion from lava, especially of hard materials such as armor wire steels.
In the real-life situation it is expected that a number of parallel processes will be in competition: as the cable slides back and forth over
126

the rock it will be abraded while the rock will be blunted and will have its pores filled with wear particles. The relative roles of these various processes will depend on a number of factors which were beyond the scope of the present study. It was decided, therefore, to test under conditions where cable materials performance was the primary factor and rock deterioration was of less concern. For this reason, a slurry test was chosen for most of the work, using crushed rock as loose abrasives in a slurry of fresh water or seawater.
The lava was obtained from a recent lava flow at Mauna Ulu near Kilauea Crater and the coral fran coral boulders at Ke-ahole Point, near the NELH compound. The rocks were crushed and sieved to the size range 250-420 ~. Comparison tests were made with slurries of rounded quartz grains from Western Australian beach sand and with commercial silicon carbide (SiC) sandpaper, 120 ~grit size.
3.4.3.2 Test Materials
The polymers were purchased in the form of 3/8 inch diameter rods from AIN Plastics, Inc., New York. The polymers used were:
PVC - Poly Vinyl Chloride High density polyethylene Plexiglas - Poly Methyl Methacrylate Polypropylene Delrin Teflon - Poly Tetra Fluoro Ethylene Nylon 6/6
The steel samples tested were pieces of armor wire from a power cable, provided by Pirelli. The wire was a cold drawn carbon steel (0.25% c, type AISI 1025) and galvanized. The diameter was 6mm.
3.4.3.3 Specimen configurations
The polymer rods were cut into lengths of 1 inch and were abraded on the cylinder's end, perpendicular to the axis.
The steel specimens were 1 inch long. They were abraded in one of two directions - "axial configuration": abrasion on the cylinder's end, perpendicular to the cylinder axis, or "lateral configuration": abrasion of the perimeter of the cylinder in a fixed position, perpendicular to the cylinder axis.
3.4.3.4 EqUipment
Most of the data were obtained using a slurry abrasion tester but some comparison data were obtained using silicon carbide abrasive papers in dry, two-body abrasion.
The slurry tester was modeled on the ASTM test for determining the abrasivity of slurries in the so-called Miller-index test. (ASTM G75-82.)
'
127

TWo samples can be tested at a time. The samples are mounted at the end of 1.5" diameter delrin cylinders which extend vertically through linear motion bearings attached to a guided carriage. The carriage is moved back and forth through an arm driven by an eccentric operated at 14 rpm. The stroke length was kept constant at 11 inches.
The abrasive slurries were contained in a tray which can be easily removed to facilitate abrasive replacement. The tray was built of Plexiglas and its bottom was covered with a 2 mm thick sheet of polyurethane in order to protect the tray from wear and to keep the abrasives from sliding over the tray bottom.
To ensure good mixing of the abrasives, T-shaped plows were attached to the specimen holder in such a way that the track was constantly covered by a supply of abrasives.
3.4.3.5 Test Details
Specimens were washed thoroughly with liquid soap, rinsed with tap water, dried and weighed to 0.1 mg. Drying was done in ambient air, except for Nylon 6/6 which, because of its tendency to absorb water, had to be dried under a heat gun for 2-5 minutes. steel specimens were cleaned in acetone and dried by compressed air.
After testing for a predetermined period of time the specimens were removed, washed and dried using the same procedure, and weighed again.
3.4.3.6 Reproducibility
Eleven tests were run with a Plexiglas sample. Each test was conducted for 15 minutes at 548 g load against a tap water slurry of round quartz sand, 250-420 ~m size. The mean value was 0.060 mm3/min with an S.D. of 13.
\¥bile this scatter is relatively high it is not unusual for wear tests. Since most studies were conducted for longer time periods which result in weight losses that are less susceptible to inaccuracies from the weight measurements, it is expected that this value represents the upper limits of scatter.
3.4.3.7 TWo-Body Tests With SiC Paper
In the two-body abrasion tester the sample is mounted on a carriage which runs on tracks above a rigidly mounted strip of SiC sandpaper, grit size 120 ~m.
Samples were run in using 2-3 passes at 1.35m. They were then cleaned, dried and weighed after which they were run for an additional number of passes, sufficient to obtain significant weight loss. Fresh sandpaper was used for each pass.
128

·~ v
3,4.4 Results and Discussion
3.4.4.1 Polymers
Volume wear-time data for various slurries are listed in Tables 3.4.3-3,4.5, It is seen that:
1) the general ranking of the polymers is the same in all three slurries:
2)
3)
increasing wear resistance
Plexiglas NC High Density Polyethylene Delrin Polypropylene Teflon Nylon 6/6
the relative wear rates in the different slurries vary somewhat; the ratio between maximum wear and minimum wear observed is around 2 in quartz, 5 in coral, and 3 in lava,
the round quartz gives the lowest wear rates, while the crushed lava gives the highest. The general range of values is shown as follows;
Plexiglas Polypropylene
Quartz 6,5 2.8
coral 47.5 14.7
Lava 69.4 25.3
where the volume wear after 2 hours is listed (rnrn3), and
4) there is no significant difference in abrasiveness between seawater slurries and tap water slurries in the abrasion of polymers.
Figures 3.4.1-3.4.3 show wear-time curves for three different polymers in three different slurries, There is some deviation from linearity at longer test times, towards laver wear. This is more evident in the long-term test data illustrated in Figures 3.4.4-3.4.5, The data fit an equation of the form
w = AtB (11)
with a correlation coefficient of 0.982 or better.
Figures 3.4.6-3,4.8 illustrate the wear behavior of three different polymers in crushed coral slurries with either tap water or seawater, As mentioned above, there is no significant difference between the two types of slurry.
Tables 3.4.6-3.4,8 and Figures 3.4.9-3.4.11 illustrate the effects of testing load, The exact shape of the curves is not clear at this stage, it may be of a power form or, as drawn, consist of two linear segments, For the latter case, the break in the lines which results in greater wear at higher loads occur at 550-600 g (5.5-6 N) for quartz, 425-450 g (4.3-4,6 N) for coral, and 300 g (3.1 N) for lava. These values are in qualitative
129

agreement with the relative crushing strengths of the abrasives and the shape of the curves may indicate a load-induced sharpening of the abrasives.
For the tests on dry silicon carbide abrasive paper {data shown in Tables 3.4.9-3.4.10) both wear-time and wear-load curves are straight lines {see Figures 3.4.12-3.4.13). There is obviously no deterioration or sharpening of this abrasive with load, within the range used, and since fresh abrasives were used for each pass no deterioration with sliding distance is expected. The ranking of the four polymers tested is slightly different from the rankings observed for the slurry tests in that PVC has replaced Plexiglas as the fastest wearing material:
increasing wear resistance j
PVC Plexiglas Delrin Polypropylene
The ration between the highest and the lowest wear rates is around 3.5.
Table 3.4.11 summarizes the wear data for four of the polymers. The silicon carbide abrasive paper gives wear rates that are about two orders of magnitude greater than the slurries.
3.4.4.2 Armor wire
Data for pure copper {OFHC) and the galvanized cold drawn AlSl 1025 armor wire steel are listed in Table 3.4.12. The wear rate of the copper is around ten times greater than the wear rate of the armor wire and one-third as large as the wear rate of the most wear resistant polymer. Results for the armor wire are also plotted in Figures 3.4.14-3.4.16.
The two curves for crushed coral plus seawater in Figure 3.4.14 are parallel for the two configurations. The curve for the "lateral" configurations is 0.5 mm3 above the curve for the •axial" configuration, probably because in the former case the soft zinc coating is worn off first. The curves above 30 minutes then represent the corrosion-wear behavior of the armor wire under these test conditions.
This behavior is not apparent in the crushed lava slurries {Figure 3.4.15), probably because the over-all wear is so much greater than the 0.5 mm3 difference is not noticeable. Another difference between the two slurries is that in the crushed lava the lateral configuration wears less than the axial, probably because the former leads to a greater degree of crushing of the abrasives, as also indicated by the deviation from linearity of curves for long testing times.
Generally, the seawater slurries result in wear which is considerably greater than in fresh water slurries. This is expected to be due to the contribution of metallic corrosion in the seawater.
In abrasion by silicon carbide paper the armor wire behaves as shown in Figure 3.4.16. As for the polymers, the wear-distance and wear-load curves are straight lines. The curve for the lateral configuration initially rises more rapidly but becomes linear after around 0.5 mm3 has been worn away -
130

~ '
corresponding to the removal of the zinc coat in the contact zone,
Table 3.4.14 summarizes the data for the armor wire. The three abrasives shaw the same general ranking as when abrading polymers (Table 3.4.11), with SiC paper about two orders of magnitude more abrasive than crushed lava slurry which, in turn, is an order of magnitude more abrasive than crushed coral slurries (for polymers the latter difference is only a factor of 2-3). In comparison, the polymers wear more than the steel by about two orders of magnitude for coral slurries and one order of magnitude for lava slurries and SiC paper. The greater difference for the coral is thought to be due to the scarcity of coral constituents which are harder than the steel surface. The data for the armor wire do not permit any accuracy in extrapolation to real-life cable situations. However, a rough estimate may be made as follows:
The data shaw a wear in lava of 11 mm3 in 7 hours for 5. 5 N load, for a sample length of 25 mm. This corresponds to 7 hrs x 60 min/hr x 14 cpm = 5, 880 cycle's,
For a tidal loading of the cable of 2 cycles per day, this corresponds to 2,940 days or 8 years. For a thirty year exposure, and a load which may be up to five times greater, the wear would be around 11 x 5 x 30/8 = 206 mm3,
The volume of a 25 mm long section of the armor wire in the final design is 3 x 10 x 25 = 750 mm3, Thus, abrasion alone could remove 25-30% of the wire over its service life. With the added effect of rapid corrosion of the freshly exposed surfaces and increased corrosion rates after the zinc coating has corroded away, it would appear that abrasive/corrosive wear of the cable armor wire is a factor which should be examined further.
3.4.5 Conclusions
A number of interesting conclusions can be drawn from this preliminary study:
o lava is a considerably more aggressive abrasive than coral. The difference is a factor of 2-3 for abrasion of polymers and about one order of magnitude for abrasion of steel,
o the lava's abrasiveness relates to two factors: the content of hard constituents (Olivine) and the relatively law crushing strength of these constituents which results in sharpening of the abrasives under load. In a real-life cable/rock abrasive situation this latter factor could, on the other hand, mean that the hard constituents in the surface would soon be exhausted; the wear on the cable would subsequently drop,
o the rate of wear is greatly dependent on the sharpness of the abrasives, with the rounded quartz grains, which also are resistant to fracture and self-sharpening, giving the least wear,
o while the mechanism of material removal varies from almost pure fatigue for the round quartz abrasives to almost pure cutting for the silicon carbide abrasive paper, the general ranking of the various materials remains almost constant,
131

o the substitution of seawater for tap water in the slurry has no effect on the rate of wear of polymers while the associated increase in corrosion does result in increased wear of the armor wire; details of the effects of frequency, exposure periods, etc. will have to be determined in future studies, and
o a rough estimate of the possible long-term effects of abrasion by lava due to tidal forces on the cable shows that this factor, combined with recurring corrosion of freshly exposed surfaces, might be life-limiting for the cable under certain situations. Additional study would appear to be warranted,
3.4.6 References to Subtask (c)
1. Pirelli Gable Corp., "Gable catenary Study", Hawaii Deep Water Gable Program, Phase II, May 1986.
2. J. Larsen-Basse, "Abrasion Mechanisms-Delamination to Machining" in Fundamentals of Tribology, N.P. Suh and N. Saka (eds. ), the MIT Press, 1980, 679-689.
3. J. Larsen-Basse, "Effect of Composition, Microstructure and service Conditions on the Wear of Cemented carbides" Journal of Metals, Vol. 35, No. 11, Nov. 1983, 35-42.
4. S.B. Ratner, I.I. Farberova, o.v. Radyukervich and E.G. Lure, "Connection Between the Wear Resistance of Plastics and other Mechanical Properties", in Abrasion of Rubber (D. I. James, ed. ), 1964, p. 145.
5. I.V. Kraghelsky, "Friction and wear", Butterworths, London, 1965.
6. V.K. Jain and s. Bahadur, "Development of a wear Equation for Polymer-Metal Sliding in Terms of the Fatigue and Topography of Sliding surfaces", wear, Vol. 60, 1980, pp 237-248.
7. J.M. Throp, "Abrasion of Some Commercial Polymer", Tribology International, April 1982, pp 59-68,
8. B.W. Madsen, "A Study of Parameters Using a New Constant Wear Rate Slurry Test", wear of Materials, (K. Luderrna, ed.), ASME, 1985, pp 345-354.
9. G.A. MacDonald and A.T. Abbott, Volcanoes in the Sea, University of Hawaii Press, 1970.
10. G.A. MacDonald, Petrology of Hawaii, Hawaii Div. of Hydrology, Bulletin 1646, pp 187-208.
11. Handbook of Chemistry and Physics, 57th ed, 1976-77, pp C791-C800.
132

TABLE 3.4.1
RANGE OF CHEMICAL ANALYSES OF LAVAS FROM MAUNA KEA AND KILAUEA, % [9, 10]
Mauna Kea Kilauea
Si02 46.4 - 50.9 47.3 - 50.9 Al2o3 7.8 - 19.5 9.1 - 15.3 Fe20J 0.7- 7.6 0.3 - 3.8 FeO 4 - 10.2 8.1 - 10.9 MgO 3.9 - 10.5 7.1 - 20 cao 6.5- 11.3 7.9 -11.5 Na2o 1.7- 4.7 0.7 - 2.6 K20 0.3 - 2.1 0.4 - 0.6 TiOz, 1.7- 3.1 1.6 - 3.3 ._,-
Total Sites Tested 11 13
133

Substance
calcite Glass Pyrotene
TABLE 3.4.2
TYPICAL HARDNESS VALUES FOR SOME MINERALS OF INTEREST [9, ll]
Mohs Knoop % in Scale Number Typical Lava
3 135 530 + 10
5-6 430-560 50 Feldspar (orthoclase) 6 560 33 Olivine 6.5-7 700-820 5 Quartz 7 820 Garnet 1,360 Alumina 9 + 2,100 Silicon carbide 2,480
Copper 3 160 Steel 5-8 400-750 Plastics 2-3 100-150
134
% in Typical Coral
98 +
1-2

TABLE 3.4.3
VOLUME WEAR Fffi 548 g LOAD, rrun3 SLURRY: ROUND QUARI'Z + TAP WA'IER
Time, h Polypro12. H.D. Polyeth. Nylon 6/6 Plexiglas PVC Teflon Delrin
0.25 0.556 0.525 0.348 0. 585 0.876 0.364 0.559 0.5 1.440 1.140 0.696 1.320 1.606 0.727 1.119 1 1.111 2.160 0.870 2.160 2.920 1. 909 2.168 1.5 1.667 3.510 1.304 4. 950 3.358 2.682 3.007 2 2.778 5.160 2.000 6.360 4.453 4.000 4.196 3 5.778 7. 920 0.543 10.62 7.664 5.682 4.685 5 7.111 11.100 1.826 18.000 10.730 10.136 7.762 7 11.444 13.860 4.957 22.680 14.307 14.273 11.049
10 13.889 21.000 5. 652 29.400 21.387 19.227 15.105

Time h
0.25 0.5 1 1.5 2 3 5 7
10
TABLE 3.4.4
VOLUME WEAR FOR 548 g LOAD, mm3 SLURRY: CRUSHED CORAL + SEA OR TAP WA'IER
Tap Water Slurries seawater Slurries
H.D. Poly_eth. Nylon 6/6 Plexig].as Teflon Polyprop. Plexiglas PVC
3.125 o. 957 6.417 1.046 1.556 6.875 4.306 4.000 3.044 13.833 2.556 4.067 10.583 7.300 9. 503 3.217 25.500 3.546 7.922 23.517 12.700
13.438 37.000 16.875 3.913 47.583 6. 591 14.788 47.150 27.518 25.105 7.217 66.583 12.182 23.633 65.483 43.285 48.333 11.739 119.417 15.046 69.479 131.417 87.813 191.583
Delrin
2.030 4.126
10.280
16.365 25.665

TABLE 3.4.5
VOLUME WEAR Fffi 548 g LOAD, mm3 SLURRY: CRUSHED LAVA + TAP \'lATER
Time, h Pol Plexi las PVC Delrin
0.25 3.666 12,083 8.248 3.846 0. 50 5.667 20.330 14.891 7.133 1 10.770 42.250 34.817 15.255 1.5 18.111 62.910 49.124 18.881 2 25.277 69.420 64.817 26.923
137

f--' w 00
Load, g
176 277 427 548 650 716 866 966
TABLE 3.4.6
FIRsr HOOR VOLUME WEAR RATE AS FUNCTICN OF LOAD, mrn3/MIN SLURRY: QUARTZ GRAINS + TAP WATER
Polyprop. H.D. Polyeth. Plexiglas PVC
o. 011 0.016 0.014 0.011 0,015 0.023 0.024 0.018 0,020 0.038 0.047 0.032 0,033 0.048 0.051 0.049 0.054 0.066 o. 071 0,057 o. 061 0.069 0.082 0.056 0,063 0.083 0.113 0.086 0.087 0.095 0.138 0,088
Teflon De1rin
0.006 0.011 0. 011 0.018 0.026 0.021 0.032 0.043 0.036 0.033 0.048 0.062 0.052 0.069 0.060 0.076

TABLE 3.4.7
FIRsr HaJR WEAR RATE AS FUNCTICN OF LOAD, mn3/MIN SLURRY: CRUSHED CORAL + TAP ~TER
Load, g PolyProp. H.D. Polyeth. Nylon 6/6 Plexiglas PVC Teflon Delrin
176 0.026 0.037 0.022 0.061 0.040 0.025 0.016 243 0.039 0.050 0.104 0.054 o:o31 427 0.080 0.109 o. 028 0.175 0.114 0. 071 0.092 548 0.124 0.160 0.425 0.251 0.129 650 0.154 0.203 0.080 0.526 0.276 0.150 0.168 716 0.170 0.250 0.088 0.494 0.324 0.166 0.161 866 0.218 0.307 1.333 0.544 0.420 0.169 0.230 966 0.252 0.365 0.094 0.531 0.490 0.179 0.338

Load, g
176 310 494 548 650 716 866
TABLE 3.4.8
FIRsr HOUR WEAR RATE AS FUNCTICN OF LOAD, rrnn3/MIN SLURRY: CRUSHED LAVA + TAP WATER
Plexi las PVC
0.020 0.114 0.084 0.067 0.242 0.178 0.139 0.494 0.393 0.180 0. 704 0.580 0.256 0.903 o. 691 0.256 o. 969 0.744 0.339 1.335 1.050
140
Delrin
0.028 0.086 0.212 0.244 0.361 0.366 0.530
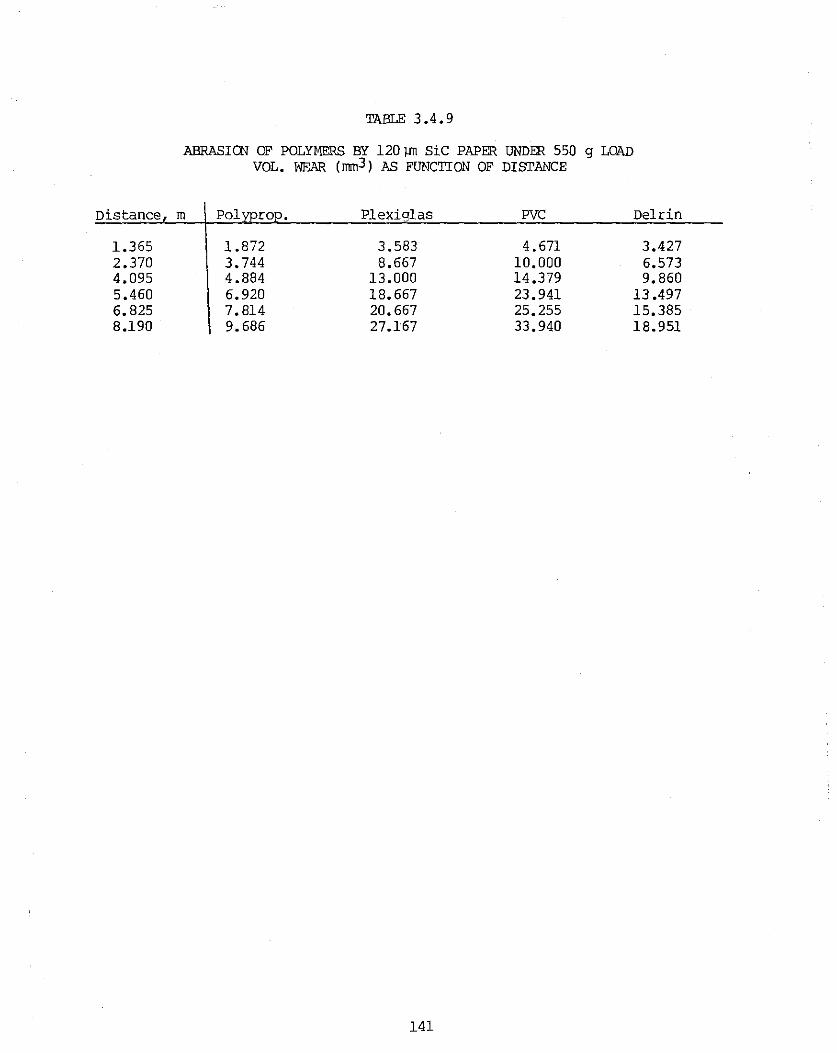
Distance
1.365 2.370 4.095 5.460 6.825 8.190
TABLE 3.4.9
ABRASICN OF POLYMERS BY 120 ]Jl1 SiC PAPER UNDER 550 g LOAD VOL. I'IEAR (mm3) AS FUNCTION OF DISTANCE
rn Plexiglas PVC Delrin
1.872 3.583 4.671 3.427 3.744 8.667 10.000 6.573 4.884 13.000 14.379 9.860 6.920 18.667 23.941 13.497 7.814 20.667 25.255 15.385 9.686 27.167 33.940 18.951
141

TABLE 3.4.10
ABRASIOO OF POLYMERS BY 120 ].Ill SiC PAPERS WEAR RATE (mm3/rn) AS FUNCTION OF LOAD
Load Pol Plexiglas PVC Delrin
215 0.529 1.160 1.568 0.922 282 0. 773 1.648 1. 791 1.153 316.4 1.058 1.984 2.085 1.332 383.4 1.150 2.139 1.537 465 1.262 3.208 1.998 484.4 2.177 532 1.465 3.530 2.459 551.1 2.870 633 1.628 3.998 4.118 2.766
142

TABLE 3.4 .ll
VOLilllE WEAR RATE (rmn3/m) OF 4 POLYMERS IN DIFFERENT ABRASIVES
VOLUME WEAR RATE (mm3/m)
ABRASIVE: ROOND QUARTZ CRUSHED CORAL CRUSHED LAVA SiC ABRASIVE MATERIAL PAPER
Polypropylene 4.3 X lQ-3 1.48 x 1o-2 2.79 x 1o-2 1.11
Delrin 4.55 x lo-3 1.66 x lQ-2 2.87 x 1o-2 2.25
PVC 5.24 X lQ-3 2.27 x 1o-2 7.33 X lQ-2 4.22
Plexiglas 8.27 x lo-3 4.89 x 10⁻² 7.78 X lQ-2 3.34
>--' ..,. w

TABLE 3.4.12 SLURRY ABRASICN OF COPPER AND ARMOR WIRE: VOLUME WEAR (mn3) VS. TIME. LOAD: 5.5 N
cower Armor Wire, Axial Armor Wire, Lateral Quartz coral Coral Coral Lava coral Lava
Time, h Tap Tap Tap Sea Sea Sea sea
0.25 0.135 0.37 0.041 0.063 0.410 0.473 0. 910 0.5 0.303 0.661 0.063 0.089 o. 769 0.555 0.936 1 0.482 1.379 0.119 0.131 1.513 o. 633 1.423 1.5 o. 717 2.365 1.423 1. 782 2 0.942 3.049 0.180 0.321 1.051 0.776 2. 795 3 1.323 4.563 0.228 0.421 4.256 0.955 2.910 5 2.197 6.883 7.308 6.436 7 2.556 8. 711 7.910 10.230
,... 10 4.148 17.079 11.731 ... ...

TABLE 3.4.13
ABRASION OF ARMOR WIRE BY 120 ].[Tl SiC PAPER. LOAD 5.4 N
Distance, m
1.365 2.730 4.095 5.460 6.825
Volume Hear mm3 Axial Lateral
0.32.1 0.692 1.039 1.397 1. 744
145
0.539 0.859 1.141 1.474 1. 705

Direction
Axial
Lateral
TABLE 3.4 .14
VOLUME WEAR CF ARMffi WIRE (AISI 1025) WHEN ABRADED IN SLURRIES AND DRY CONDITICNS. LOAD: 5.4 N
Volume Wear Volume wear
mm3jm mm3jm
crushed coral crushed Lava
Tap Sea Tap Sea
1.524xl0-4 3. 07xlo-4 4.683xlo-3 3. 242xl0-3
4. 94lxlo-4 3. 742xlo-4 2 .407xlo-3 2.557xlo-3
volume wear
nm3jm
SiC Paper
Dry
0.2600
0. 2160
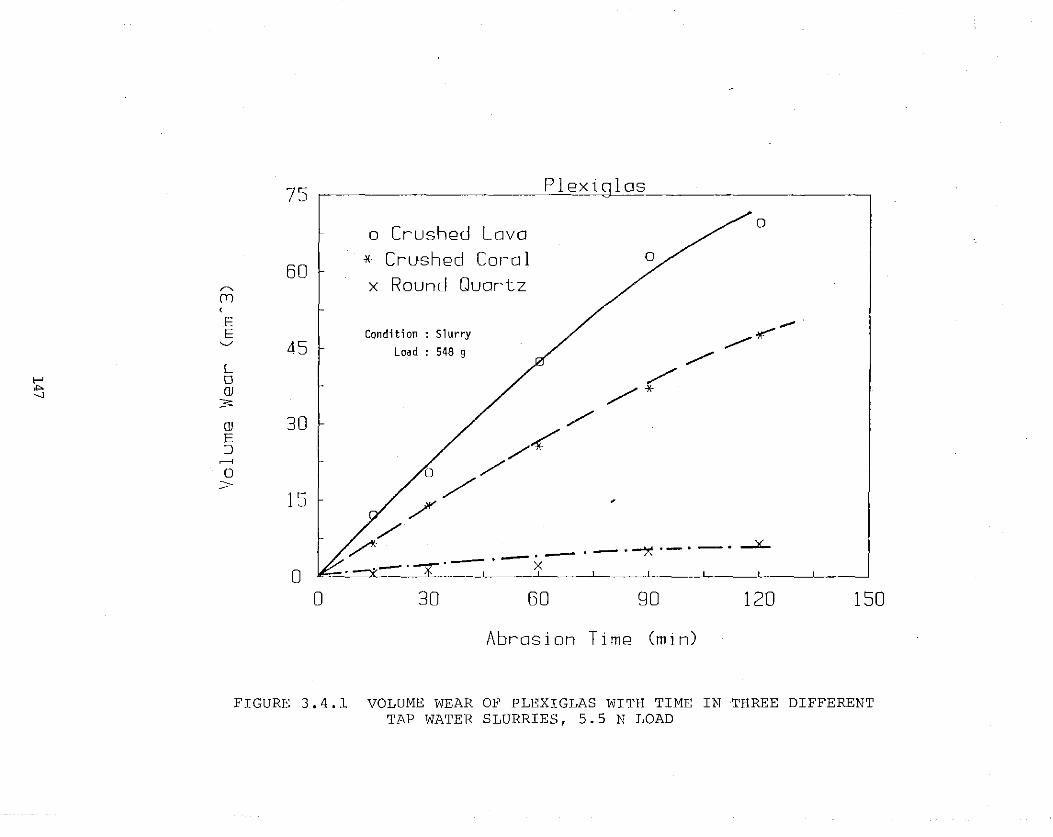
,...... rrJ
E E
'-./
L f-' 0 ""' OJ -.J
3
OJ E ::J
.-<
0 >
75
60
45
30
15
0
_ __cP_l=-=e x i g l as
o Crushed Lava * Crushed Co1~a l x Round Ouartz
0
Condition : Slurry Lood : 548 g
/
0 /
/ /
/ /<"
0
'/1<- ·-·~·-·-·__;x:_ / -·-. ---~. 7.-~---L
0 30 60 90 120
Abrasion Time (min)
150
FIGURE 3.4.1 VOLUME WEAR OF PLEXIGLAS WITH TIME IN THREE DIFFERENT TAP WATER SLURRIES, 5.5 N LOAD

r-. [T]
E E ._,
L f-' 0 "'" OJ 00
3
OJ E ::J ...... 0 >
75 PVC
0 Crushed Lava
* Crushed Coral 60
)( Round Ouartz Abrasive Grain size: 250-420 micron
Lo!!d : 548 gr. Condition: Slurry
45
0
30
15
0 0 30 60 90 120 150
Abrasion Time (min)
FIGURE 3.4.2 VOLUME WEAR OF PVC WITH TIME IN THREE DIFFERENT TAP WATER SLURRIES, 5.5 N LOAD

"""' (Y]
E E
'-../
L ..... 0 "' (]J
'"' 3:
(]J E :::J
..---<
0 >
30
24
18
12
6
0
Delrin ------------~----------------------- - ·---·-----------------------------------
o Crushed Lovo * Crushed Carol x Round Ouortz
Condition : slurry
Load : 548 g
>-/
/? /
/ /
0
.......... ...< ----
*-
-~·-/ .--·x-·-A .-·~ ---7.::' . - y:--. __ _: __ L--~------L _____ ___t_ ___________ L_ _______ ___.1___ ___ __1_ __ .___
30 60 90 120
!\bros ion T 1 me Cm in)
150
FIGURE 3.4.3 VOLUME WEAR OF DELRIN WITH TIME IN THREE DIFFERENT TAP WATER SLURRIES, 5.5 N LOAD

,...._ [Y)
E E
'-./
L 0 OJ
3
OJ E :J __. 0 >
250 Plexi los
+ Crushed Coral
200 0 Round Quartz
Condition : slurry
150 Load : 548 g
+
100
50 ---e--
--e- ---c---er--
0 0 120 240 360 480 600 720
Abrasion Time (mins)
FIGURE 3.4.4 LONG-TERM WEAR OF PLEXIGLAS IN TWO DIFFERENT TAP WATER SLURRIES, 5.5 N LOAD
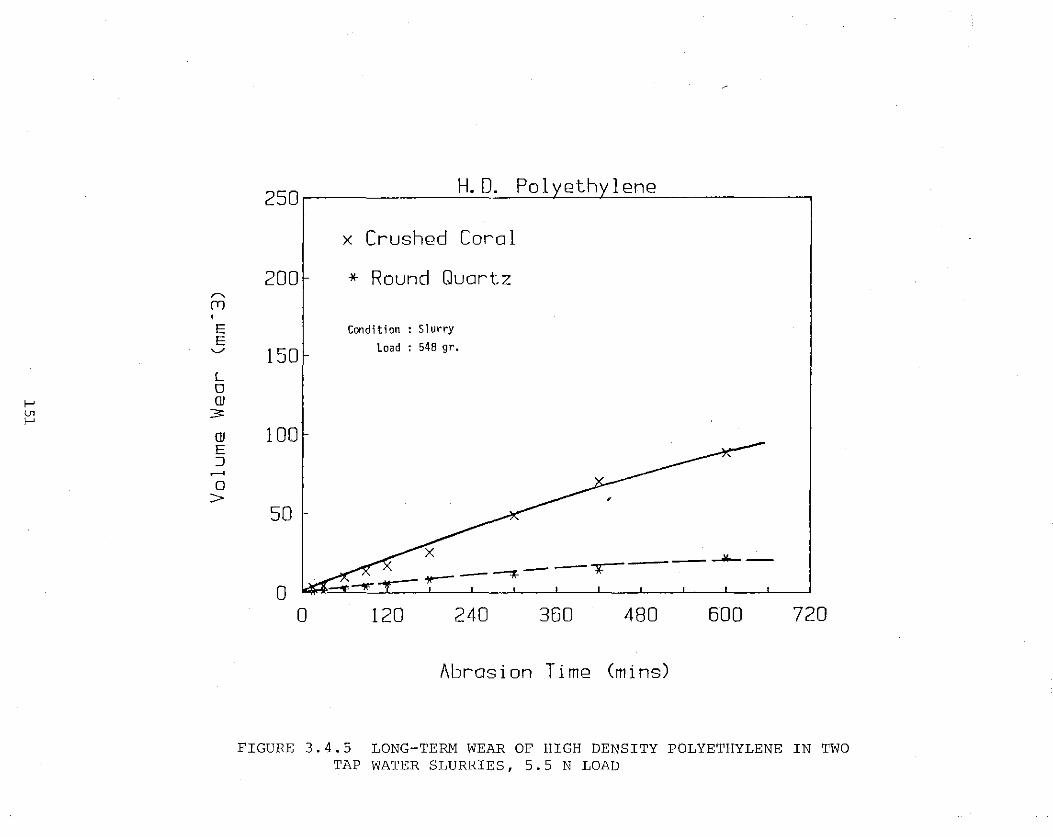
" [T)
E E
'--'
L 0
f-' OJ ln 3: f-'
OJ E :J
..--<
0 >
200
150
100
50
0 0
x Crushed Coral
* Round Quartz
Condition : Slurry Load : 548 gr.
__ _.jlo....._
--r~---~
120 240 360 480 600
Abrasion Time (mins)
720
FIGURE 3.4.5 LONG-TERM WEAR OF HIGH DENSITY POLYETHYLENE IN TWO TAP WATER SLURRIES, 5.5 N LOAD

'"" [T)
E E
'-'
L
r' 0
lJ1 OJ N 3:
OJ E :::J
.-!
0 >
75
50
45
30
15
0 0
Pl ex i 1 as
o Tap Water
* Sea Water
40 80 120
Condition : Slurry Load : 548 g
Abrasive : Crushed coral
160 200
Abrasion Time (min)
240
FIGURE 3.4.6 WEAR OF PLEXIGLAS IN TAP WATER AND SEAWATER SLURRIES WITH CRUSHED CORAL, LOAD 5.5 N

,---. [T)
E E
'--'
L 0 OJ
f-' 3
Ul w OJ
E ::J
.--<
0 >
75 Pol lem~
0 Top Water Condition : slurry
60 Load : 549 g
* Sea Water Abrasive : Crushed coral
45
30
15
0 0 40 80 120 160 200 240
Abrasion Time (min)
FIGURE 3.4.7 WEAR OF POLYPROPYLENE IN TAP WATER AND SEAWATER SLURRIES WITH CRUSHED CORAL, LOAD 5.5 N

,.... (T) (
E E
'-"
L 0 OJ
f--' lJ1
3: .,. OJ E :J
.-<
0 >
75 Delrin
0 Tap Water Condition : Slurry
60 Load : 548 g
* Sea Water Abrasive : Crushed cora 1
45
30
15
0 0 40 80 120 160 200 . 240
Abrasion Time (min)
FIGURE 3.4.8 WEAR OF DELRIN IN TAP WATER AND SEAWATER SLURRIES WITH CRUSHED CORAL, LOAD S.SN

0 0 0 ,__,
"'--.__,
* " c . """ E
"'--"'E
E '--"
OJ _,_, >--' 0 lJl lJl 0:::
L 0 OJ
3
OJ E ~
.--<
0 >
Oelr~in 600 r--------------------------------,
500
400
300
200
100
0 0
+ Crushed Coral
o Round Ouartz
Abrasion Time : 1 hr
-.G-_o ___ -rr-~
.o---8-----0- -e- Q -~~----···L-----'----___j_ __ _j_ __ J__ _ _j_ __ _j_ _ __j
200 400 600 BOO 1000
Load Cgms)
FIGURE 3.4.9 WEAR-LOAD DATA FOR ONE HOUR ABRASION OF DELRIN IN CORAL AND QUARTZ SLURRIES

0 0 0 .......
" ...... * ,..., c ...... E
"'" E E
'-'
OJ f-' ->J lJl 0 ""' 0::
L 0 OJ
3:
OJ E :J
....... 0
>
H. D. Polyethylene 600
+ Crushed Coral
SOD o Round Quartz
400 Abrasion time : 1 hr.
300
200
100
0 0 200 400 600 800 1000
Load <gms)
FIGURE 3.4.10 WEAR-LOAD DATA FOR ONE HOUR OF HIGH DENSITY POLYETHYLENE IN CORAL AND QUARTZ SLURRIES

,.., c
·.-<
E ........ (T)
E E
'-../
Cll +l 0
1-' 0:: U1 __,
L 0 Cll
3
Cll E :J
.-<
0 >
1.6 PVC
1.4 * Crushed Lava
1.2 x Crushed Coral
1
. 8
.6
. 4
. 2
0 0 200 400 600 800 1000
Load Cg)
FIGURE 3.4.11 WEAR-LOAD DATA FOR ONE HOUR OF PVC IN CORAL AND LAVA SLURRIES
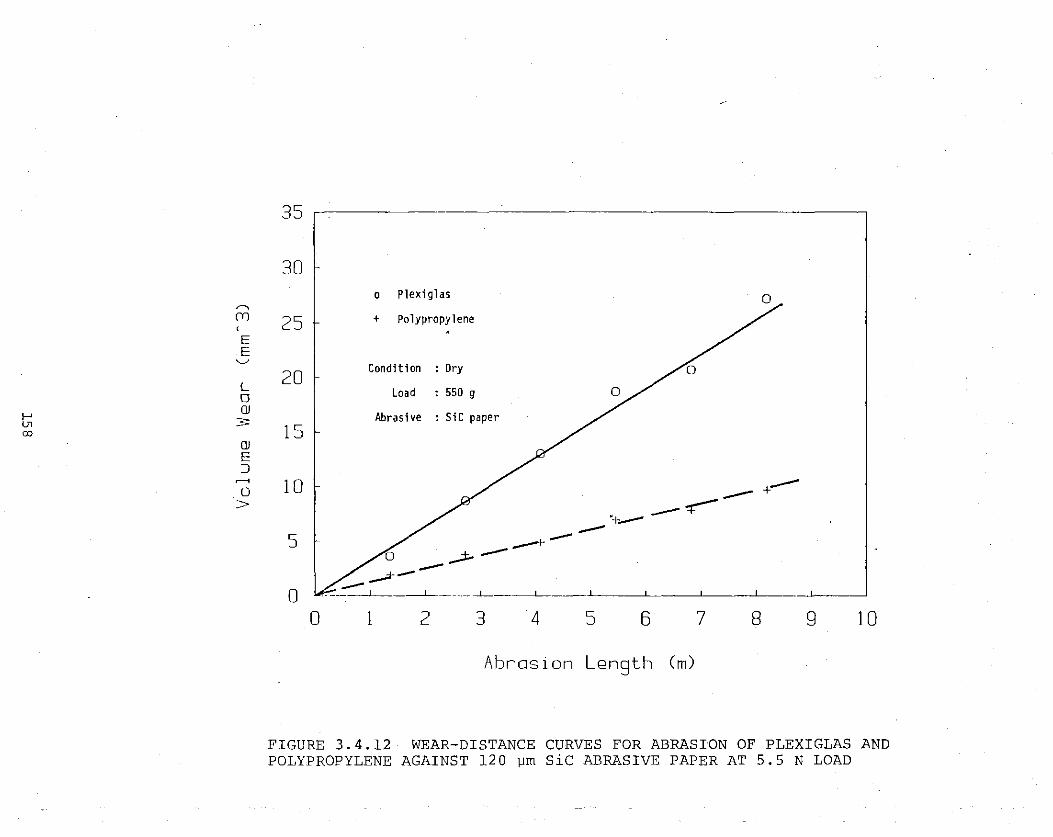
-------(Y)
E E ~
L 0
>--' OJ
lJl 3 00
OJ E :J
.----<
0 >
35 ,--------------~--------------------------~
30
25
20
15
10
5
0 0
o Plexiglas
+ Polypropylene
Condition : Dry
Load : 550 g
Abrasive : SiC paper
1 2 3 4 5 6
Abrasion Length (m)
7 8 9 10
FIGURE 3.4.12 WEAR-DISTANCE CURVES FOR ABRASION OF PLEXIGLAS AND POLYPROPYLENE AGAINST 120 ~m SiC ABRASIVE PAPER AT 5.5 N LOAD

" E
" (Y)
E E ~
OJ +' 0
f-' 0::
Ul
'"' L 0 OJ
3
OJ E =:J
.---<
0 >
4 0 Plexiglas
+ Polypropylene
Condition : Dry 3 Abrasive : SiC paper
2
1
0 .L j __ _ .. L ____ -·- . ___ .1.__- _______ ___L_ ----· _...!.......____ ____ L_
0 1 2 3 4 5 6 7 8 g 10
Load CN)
FIGURE 3.4.13 WEAR RATE-LOAD CURVES FOR ABRASION OF PLEXIGLAS AND POLYPROPYLENE AGAINST 120 ~m SiC ABRASIVE PAPER
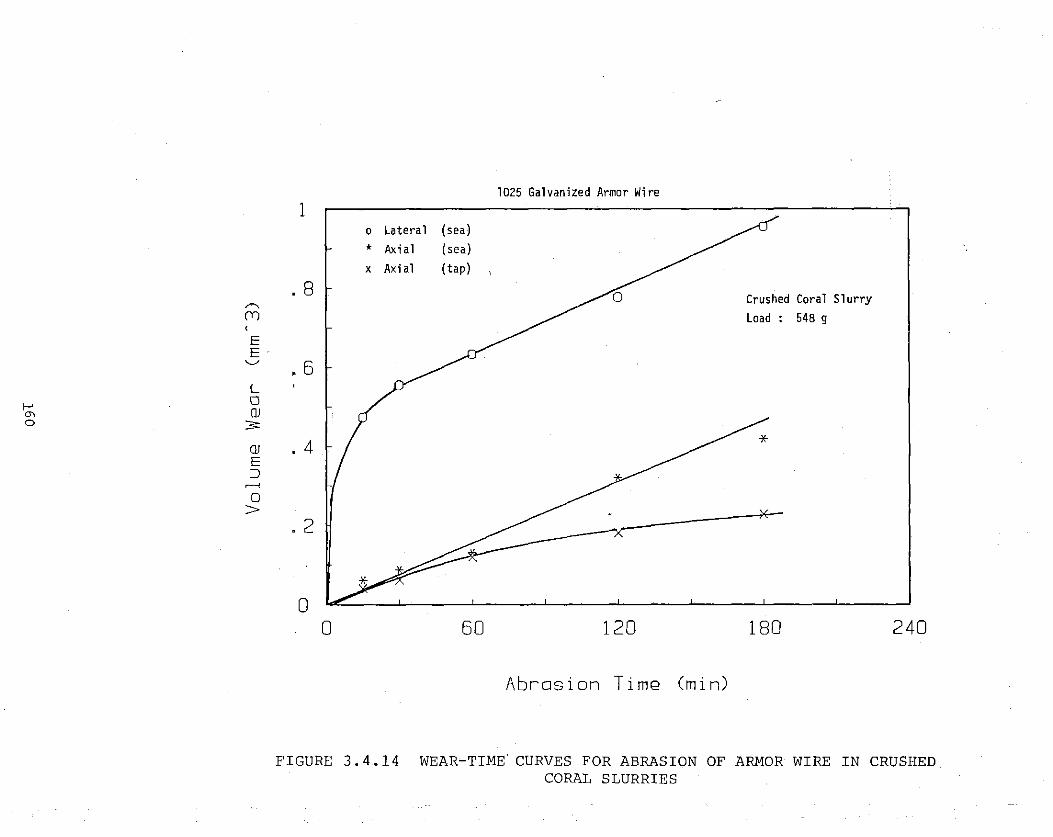
"""' (Y)
E E·
'--'
L f-' 0
"' OJ 0 3
OJ E :J
........ 0
>
1
.8
' 6
.4
.2
0 0
o Latera 1
* Axial x Axial
(sea) (sea) (tap)
60
1025 Galvanized Armor Wire
120
Abrasion Time (min)
Crushed Coral Slurry Load : 548 g
*
180 240
FIGURE 3.4.14 WEAR-TIME. CURVES FOR ABRASION OF ARMOR WIRE IN CRUSHED CORAL SLURRIES

35 1025 Galvanized Steel
X Axial CT ap) Slurry Crushed Lava
+ Axial CSea) Load : 548 g 30
' "' (YJ
CSea) 0 Lateral 25
E E * Lateral CT ap)
'--'
L 20
0 OJ
3 f--'
"' 15 f--' OJ
E :::J ,__, 0 10
>
5
0 0 120 240 360 480 600 720
Abrasion Time (min)
FIGURE 3.4.15 WEAR-TIME CURVES FOR ABRASION OF ARMOR WIRE IN LAVA SLURRIES

,..... (Y)
E E
'--'
L 0
f--' QJ
"' 3: "'
QJ E :J
.---<
0 >
2 5 AIS! 1025 Galvanized Armor Wire . .-----------~~~~==~~~---------------.
2 • Latera 1 X Axial Load : 550 g
1.5
~ *
1
.5
0 0 1 2 3 4 5 6 7 8
Sliding Distance (m)
FIGURE 3.4.16 WEAR-DISTANCE CURVES FOR ABRASION OF ARMOR WIRE BY SiC ABRASIVE PAPER

3.5 Subtask (d): Corrosion Fatigue of Lead in seawater
3.5.1 Background
The lead sheath of the cable serves to separate the seawater from the inner insulation and the central conductor. Breaks in the sheath may cause flooding of the cable, followed by catastrophic breakdown. The lead sheath is subjected to fatigue loading during the various stages of its life:
before deployment: during coiling in the transporting vessel and during subsequent ocean passage due to temperature variations and mechanical motions associated with the vessel's response to the waves;
during deployment: due to uncoiling, sliding over sheaves or drums, and due to various other deployment loads;
after deployment: due to tidal current forces on sections of cable which have become suspended between rock outcroppings.
Of these, the damage after deployment is probably most serious because it will happen after the cable has been put into service and the resulting short circuit could give severe equipment damage and long-term black-outs.
A recent report [1] by Pirelli's staff has shown that the HDWC cable will not generate rapid "flutter" in the water but that the effect of tidal currents could be important. With a 30-year design life and a twice-daily current change this corresponds to around 22,000 cycles. Considering that some tidal currents may be very insignificant, the actual number of load cycles to survive may be somewhat smaller, probably in the total range 5,000-25,000 cycles. This falls in the low-cycle fatigue range, where the life is controlled by cyclic plastic strain rather than by elastic stress, as in the long-life region of the fatigue curve.
The maximum strain seen by the lead sheath is more difficult to estimate. The same study [1] found that the chosen design can tolerate up to 40 m long free spans between rock outcroppings up to 4 m high and with a minimum radius of curvature of 1.5 m. The movement of the cable over the supports in response to the tidal currents will depend on a number of factors, including the presently unknown coefficient of friction between the rock and the cable. From preliminary estimates it would appear that the possible values of the maximum strain lie in the range 0.05-0.1 which is generally associated with low-cycle fatigue. Thus, damage due to low-cycle fatigue is a possibility which must be taken into account. The present study was aimed at assessing the joint effects of law-cycle fatigue and seawater corrosion under conditions generally similar to those experienced by lead sheath in the worst situations.
3.5.2 Fatigue of Lead; Brief survey of the Literature
Because lead has a law melting point and self-anneals and creeps at ambient or near,ambient temperatures its performance in fatigue becomes heavily influenced by testing temperature, amplitude, and frequency.
163

The fatigue resistance of lead sheath alloys increases rapidly when the temperature drops below 90°F (32°C) while there is no effect of temperature at higher values [2]. The temperature effect is most pronounced when the load cycle has a large plastic strain component [3] 1 because the contribution of creep to the failure becomes more significant.
The frequency at which strain is applied affects the fatigue life of lead significantly - increased frequency gives longer lives. This is probably due to creep effects at low frequencies. An example is shown in Figure 3.5.1 [4] where the fatigue life at various strain levels increased by about a factor of ten as the frequency was increased from 6.63 to 7,440 cycles per minute (cpm). In another study [5] it was reported that a frequency change from 6 to 240 cpm made little difference, except for pure lead for which the fatigue life increased slightly. Ghon and Ellis [3] found almost no effect of frequency in the range 1-15 cycles per hour (cph) and an increase in fatigue life at testing speeds greater than 15 cph. When the frequency was increased from 0.25 to 1,650 cpm they found an increase in fatigue life from 103 to 104 cycles at 0.8% strain and from 105 to 108 cycles at 0.1% strain.
some simple rules have been developed to deal with the combined effects of temperature and cycle frequency. Havard [6 1 7] suggested that one day at 1 cpm at 20°C corresponds to about 250 days at one cycle per day at 43°C or 150 days at two cycles per day at that temperature. In another study it was suggested that the number of cycles to failure at one cycle per day is equal to one-third the number of cycles to failure at one cpm.
The presence of oxygen has a pronounced effect on the fatigue life of lead. In one series of tests it was found that the fatigue life increased by one order of magnitude as the oxygen level was decreased from ambient to the equivalent of a 10 pm vacuum; the fatigue life increased an additional order of magnitude as the vacuum was replaced with pure nitrogen [8].
Measurements of strain in damaged areas of the sheath of a cable removed from seven years of service gave values in the range 0.06 to 0.20% in the fatigue damaged regions, with an average of 0.13%. In the undamaged areas the values were 0.006 to 0.016% with an average of 0.01% [7].
3.5.3 Experimental Details
3.5.3.1 Materials
The chemical analysis and the origin of the materials used are listed in Table 3.5.1. Unfortunately, the Pirelli material was made available only late in this study and therefore was not tested as thoroughly as the other material.
3.5.3.2 Apparatus
After some initial experimentation with cantilever beam and various other test concepts a U-bend test was chosen. This type of test has been used by a number of other investigators to test samples of actual cable and
164

also smaller specimens [4]. Because the strain distribution at the bend appears to depend on the hardness of the alloy it has been proposed to introduce a notch at the bend to alleviate some of these differences [4].
The U-bend tester could test five samples simultaneously. By varying sample length the strain could be varied. Strain gauges on dummy samples were used to determine the strain range for each sample length.
The samples were mounted in parallel with one leg attached to rotating grips on a fixed cross bar and the other leg attached to grips on a cross bar moving back and forth at 28 cprn. Three different stroke lengths were used by exchanging the cam drive, in order to obtain additional strain ranges. A typical strain-cycle curve, obtained by strain gages, is shown in Figure 3.5.2. A comparison of the measured values with those obtained by Eckel [4] is given in Figure 3.5.3.
In ordet to determine the number of cycles to failure, the resistance between the" two ends of the sample was automatically measured each 10 minutes. A current of 1 rnA was used and when the resistance changed by 50 ohms in water or 500 ohms in air the time was recorded as the time of failure. For this system an HP 3497A/3321A data acquisition/multiplexer unit was used, controlled by an HP 85 computer.
The tester was outfitted with a reservoir which allowed the samples to be submerged in slowly flowing water. Some additional tests were done with the complete tester located in a chamber where the atmosphere could be controlled.
3.5.3.3 Specimen Preparation
A typical specimen is shown in Figure 3.5.4. It was prepared by cutting a rectangular strip of the desired length in the direction of rolling of the lead sheath, drilling 0.2" diameter holes for fastening near each end, and carefully bending around a template to obtain the u-shape. After bending semi-circular notches (l/16" radius, 3/16" deep) were cut with a l/8" end mill cutter in a milling machine.
The samples were left for at least 50 hours at room temperature before carefully being installed in the testing rig.
3.5.3.4 Testing conditions
Most tests were done under laboratory conditions, but some were conducted at NELH in slowly flowing warm surface seawater or cold deep ocean water. The water quality parameters have been detailed under Subtask (a). Finally, some samples were left in the finished condition in the troughs at NELH for 225 days (from 10/16/85 to 5/28/86), after which they were rinsed, dried, and returned to Honolulu for testing in laboratory air.
All samples were tested in sinusoidal completely reversed strain cycles.
165

3.5.4 Results and Discussion
The results are shown in Table 3.5.2. Each value is the average of 2-5 samples, Scatter was about + 10%. The data have been plotted in Figures 3.5,5-7, Figure 3.5.5 shows-the total range of results obtained, from the short-life data for alloy Pb-0.04 cu-0.01 Sn in air to the long-lived Pirelli alloy Pb-0.16 sn-0,04 Sb in the cold, deep ocean water at NELH. The range at 0. 7% total strain is 6,000-12,500 cycles, while at 0.25% total strain it has broadened to a range of 14,750 to 100,000 cycles, Clearly, the effects of alloy improvement are particularly noticeable at the lower strain levels.
The curves are straight lines in semi-logarithmic coordinates, following an equation of the type
~-~-SlnN (1),
where Ef is the total cyclic strain, N is the number of cycles to failure, E1 is a constant which corresponds to extrapolation of the line to a single cycle (N=l), and sis the slope. This type of relationship is commonly observed for low-cycle fatigue, although the plastic component only of the strain is generally used. In the present case it was decided to use total strain as the different contributions of elastic, plastic, and creep deformation are somewhat difficult to allocate.
The lines shaw a distinct turn towards a possible fatigue limit at strains around 0.15% for the Pb-0.04 cu-0.01 sn alloy, while the level appears to be around 0.2-0.22% for the Pirelli Pb-0,16 sn-0.04 Sb alloy. For the latter, insufficient test data are available at this stage to fully define the curves. The indicated fatigue limit may be associated with the peculiarities of the deformation of lead: frequency dependent creep contributions and elastic contributions, and the Pb-0.16 su-0.04 Sb alloy may show a higher "fatigue limit" in these tests because of its greater resistance to creep.
The data show that air at 25°C is the most severe of the environments tested (see Figure 3,5,5). Colder air, at 9-l5°C, increases the fatigue life somewhat, by 18-25%. A drastic increase in fatigue life over air is shown when the tests are conducted in stagnant fresh water. The increase is 100% at 0. 7% strain and 270% at 0.2% strain.
Different fresh water environments are compared in Figure 3.5.6: fresh water at 25°C and at soc, water with air or nitrogen bubbled through it at 25°C, and a water-methanol mixture at 5-l0°C, It is seen that the curves for 25°C water fall very close together, Bubbling of air through the tap water lowers the fatigue resistance a very small amount, while bubbling nitrogen through it increases the fatigue life som~1hat, This is consistent with the expectations that fatigue life decreases as oxygen availability in the environment increases.
For the lower temperature tests the fatigue life at low strains is essentially the same while it increases substantially at large strains - 65% at 0. 7% strain. The low temperature water-methanol mixture shows an even more pronounced increase, probably because of the lower oxygen availability.
166

The seawater test data are plotted in Figure 3.5.7. While these data show somewhat more scatter it would appear that the surface seawater at NELH gives essentially the same results as seawater from the Honolulu aquarium used under stagnant conditions in laboratory tests - except that fatigue lives are somewhat longer in the NELH waters. The difference amounts to around 50% at 7% strain and 70% at 0.2% strain.
Data for the Pirelli alloy Pb-0.16 su-0.04 Sb indicate a substantially longer life for this alloy in the low strain end of the range tested - 200% at 0.2% strain- while the curves appear to join at strain levels above 0.6%. Further testing is needed to clarify the behavior of this alloy in the high strain range.
Cold water data from NELH show a somewhat similar behavior. Fatigue life of the Pirelli alloy is 170% greater than for the Pb-0.03 cu-0.015 Su alloy at 0.2% strain, while the curves appear to merge for strains greater than 0.5%. Compared with the surface seawater, the cold water gives longer fatigue lives at law strain (at 0.2% strain the increase is 70% for both the Pb-0.04 Cu-0.01 sn alloy and the Pirelli alloy) and shorter lives at high strains (around 40% lower for both alloys). The reason for this behavior is not clear at this stage; it deviates from the law temperature behavior found in fresh water and in air and discussed above. More complex phenomena, associated with calcareous film deposition from the seawater and development of passive or part-passive films, may be involved. Additional effort is needed to clarify this.
The samples which were precorroded for 225 days in NELH seawaters before testing in laboratory air at 25°C show a lower fatigue life than the samples tested in air directly after preparation, see Figure 3.5.8. The effect is more pronounced for the cold water exposures and at large strains. The lines have the same slope as the one for testing in air directly.
The calculated values of the constants El and S of equation (1) are tabulated in Table 3.5.3. While El represents the extrapolated strain value to failure in one cycle, the data are obviously quite uncertain because of the large extrapolation involved. Nevertheless, the calculated values of 3-7% for the elongation to fracture are not at all unreasonable for lead.
3.5.5 Conclusions
Low-cycle fatigue of lead is strongly dependent on the test environment and the alloy. The difference is more pronounced at lower strain levels than at high. Of the test environments used ambient air gives the lowest fatigue life, while the seawater at NELH gives the longest. In comparing the two seawater at NELH, the cold water from 600 m depth gives longer lives than the surface seawater at low strains (0.15-0.5%), shorter lives at greater strains. Of the two alloys tested, the Pirelli alloy Pb-0.16 Sn-0.04 Sb is superior to the Pb-0.04 Cu-0.01 sn at low strains, while the difference disappears at strains above 0.4-0.5%.
Results for all the environments tested shaw a linear relationship between total cyclic strain above 0.2% and ln N, where N is the number of cycles to fracture.
167

3.5.6 References to Subtask (d)
1. Pirelli Gable Corp., "HDWC Program, Phase II, Gable catenary Study", May 1986.
2. J.R. Townsend, "Fatigue Studies of Telephone Gable Sheath Alloys•, Proc. ASTM, Vol. 27 Part II, 153-166.
3. G.R. Ghon and w.c. Ellis, "The Fatigue Test as Applied to Lead cable Sheath", Proc. ASTM, Vol. 51, 1951, 721-740.
4. J.F. Eckel, "The Influence of Frequency on the Repeated Bending Life of Acid Lead", Proc. ASTM, Vol. 51, 1951, 745-756.
5. P. Gregory and D. M~llister, "The Fatigue of Lead cable Sheath Materials", LEAD '65, 73-83.
6. D.G. Havard, "Selection of cable Sheath Lead Alloys for Fatigue Resistance•, IEEE Trans. on Power Apparatus and systems, v. PAS-96, No. 1, 1977, 80-87.
7. D.G. Havard, "Lead cable Sheath Fatigue Studies", Ontario Hydro Research Quarterly, First Quarter, 1965, 5-13.
8. R.W. Atkinson, L. Meyerhoff and W.H. cortelon, "Gencalloy, A Lead Alloy cable Shea~1-- creep and Fatigue Characteristics", AlEE Trans., Vol. 72, pt III., April 2953, 246-256.
168

TABLE 3.5.1 COMPOSITION OF ALL~S TESTED
Pb-0.04 CU-0.01 Sn: 0.015 Sb, 0.006 As, 0.03 Cd, 0.04 CU, 0.008 Fe, 0.01 Sn; less than 0.001 Al, 0.01 Bi, 0.001 Cd, 0.01 Au, 0.01 Ni, and 0.001 Zn. Material purchased locally and rolled to thickness.
Pb-0.16 Sn-0.04 Sb (Pirelli): 0.041 Sb, 0.006 As, 0.16 Sn; less than 0.001 Al, 0.01 Bi, 0.001 Cd, 0.01 CU, 0.001 Fe, 0.01 Au, 0.01 Ni, and 0.001 zn. Obtained from Pirelli; actual cable sheath material.
169

TABLE 3. 5.2 TEsr RESULTS CYCLES TO FAILURE
Total Strain, %
Environment o. 695 0.457 0.261 0.151 0.130
Pb-0. 04 cu-0. 01 Sn Air, 25°C 6,160 10,360 14,358 20,160 27,160 Air, 9-l5°C 7,560 12,320 17,920 Tap water, stagnant, 25°C 9,770 30,100 49,280 72,990 125,615 Tap water + bubbled air, 25°C 10,900 27,440 50,120 68,880 76,720 Tap water + bubbled nitrogen, 25°C 13,720 31 ,ooo 56,840 90,440 144,760
!:::J Tap water, 5°C 20,860 35,695 46,945 66,780 86,615
0 Tap water + methanol, 5-l0°C 25,480 38,360 50,960 Stagnant seawater, lab, 25°C 10,500 15,815 34,160 72,940 125,360 NELH surface seawater, 25°C 16,145 25,340 31,250 55,345 113,610 NELH deep ocean water, 7.5°C 16,750 26,460 46,205 92,960 175,840
Pb-0.16 Sn-0.04 Sb (Pirelli) NELH surface seawater, 25°C 41,860 67,340 122,640 NELH deep ocean water, 7.5°C 38,780 73,080 213,080
Pb-0.04 cu-0.01 Sn, precorroded in NELH waters for 225 days, tested in lab air, single samples only
Precorroded in NELH surface 5,600 9,100 14,084 19,964 29,036 seawater, 25°C
Precorroded in NELH deep 4,900 8,470 13,118 16,772 ocean seawater, 7.5°C

TABLE 3.5.3 VALUES OF EQUATION CONSTANTS FOR ALLOY Pb-0.04 CU-0.01 Sn
Air, 25°C Air, 9-l5°C Stagnant seawater, 25°C, lab NELH surface seawater, 25°C -.- deepsea water, 7.5°C Tap water, 25°C Tap water, 25°C + air Tap water, 25°C + N2 Tap water 5°C Tap water + methanol, 5-l0°C
171
El% 4.94 5.22 5.57 5. 65 3.13 3.58 3.57 3.45 5.46 6.87
s 0.49 0.51 0.53 0.51 0.26 0.31 0.31 0.29 0.48 0.61

lc_ 07
06
z ~05
m ~
~ ;:. ~ . :;_ -•
0 r 0
\ ' b c\
0 ' '000
' I
0
m ~ ~
~ ~
' ~ --
~\ 'b'o
b \
\ ;~ 0
H
\ \ \ 'o
10000 CYCL.E.S TO fALl.VR(
100000
FIGURE 3.5.1 INFLUENCE OF STRAIN AND FREQUENCY ON THE NUMBER OF CYCLES REQUIRED TO CAUSE FAILURE IN ACID LEAD [4]
172

i ~~ ,_ ~ z ~
< 0:: IV>
• 7 .---
. 46
. 23
N -. 23
-.46
··----------- ---------
-095
,A ___________ /' o
\ I
~
Ill Q)
.r:. u c -~
~
E L 0
Q) -.D 0 Q)
> 0
::.;:
4-0
c 0 -..., u ~ - .. 095 Q)
c -.7 -·-- ~------~--- - -··- ____. ______ --'-
0 . 25 . 50 . 75
Revolution of Cam
FIGURE 3.5.2 VARIATION IN STRAIN OF OUTER FIBERS DUE TO THE COMPLETE CYCLE OF THE MOVEABLE ARM IN THE TESTEH
173
4-Q)
0

l
.9
.a
• 7
.6
.5
~
= ~
•• ' = ~
• "' = • - .;\.
= -• -u
"'
• 2 .
I I
Effective length (inch)
FIGURE 3.5.3 STRAIN CALIBRATION FOR DIFFERENT LENGTHS OF U-BEND SAMPLES. STRAINS ARE ALSO COHPARED WITH THE VALUES HEASURED BY ECKEL [4]; ALL SAMPLES WIT!i 0.125" THICKNESS
174
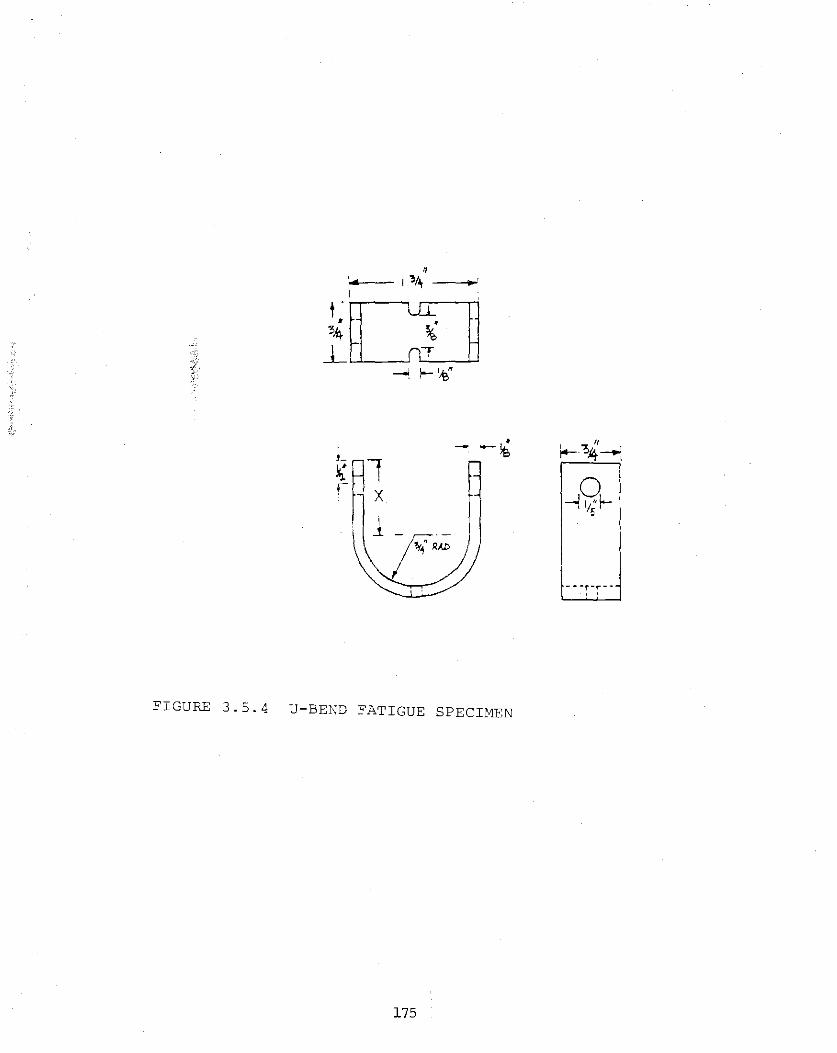
• - -)e
FIGURE 3.5.4 U-BEND FATIGUE SPECIMEN
175
---r-,.--, '

f--' _, a\
. 8
'" Pirelli mat'l Pb-0.16Sn-0.04Sb
+ X Other curves Pb-0.04Cu-0.01Sn \ •
" .6 \
"' \ ~
" c OJ u •
" L + X \
OJ • o__ .4 \
"' (Pirelli mat'l) '-./ air, 25"C • 5 •c •
c ~ 9-15" c rl air 0 • L X ~
"' Ul .2
x. ·- •X
0 ~---------7~--------~-------------~----------r----------7~~
5 10 20 so 100 200
Cycles ( 1 n thousands)
FIGURE 3. 5. 5 FATIGUE DATA FOR ALLOY Pb-0. 04 Cu-0. 01 Sn IN VARIOUS ENVIROW1ENTS, SHOWING THE TOTAL RANGE OF DATA OBTAINED

" +l c: OJ u
L OJ Q_
"---'
c: 0 L
+-> (_f)
08
06
04
02
0
' \
X+
\ ' \
air, 25'C \ ----------A \
\
-----~---- ------
X--- ---X tap water, 25' C -'o-- --+tap water, 25'C, +air
~ ~Hap water, 2S • C, +N 2 o--+ --a tap water, 5'C a--- -It tap water, +methanol, 5-lO'C
NELH Seawater, 7.5'C
(Pirelli mat'l)
7'--------;-----------f -------1~------ ----1---------f----
s 10 20 so lDO 200
Cycles ( 1 n Thousands)
FIGURE 3.5.6 FATIGUE DATA FOR ALLOY Pb-0.04 Cu-0.01 Sn IN AIR AND IN VARIOUS FRESH WATER ENVIRONMENTS

f-' -J CJ)
08
0 7
/"""'>. 06 +-)
c OJ
5 Uo
L OJ 0__ 0 4
'-._/
c .--1 3 00 L
+-) (_f) 02
0 1
0
,--------- ------------------------- -------------- -- ------ --- - --- ----------------
X
' ' \ ' ' \
' ><\
' ' ' ' \
Pb-0.~4Cu-0.01Sn alloy: Air, 250C
0 -seawater, 25 C, lab
X---- -NELH Seawater, 25 C
*----·NELH Seawater, 7.5 C
Pirelli Alloy : Pb-0. 16 Sn- 0.04 Sb G] NELH Seawater, 25 C
0-- _ NELH Seawater, 7.5 C
-
L_~----~-----~-------f---------f-- -f 200 5 10 20 50 100
Cycles _ (in thousands)
FIGURE 3.5.7 FATIGUE DATA FOR BOTH ALLOYS IN VARIOUS SEAWATER ENVIRONMENTS

f-' --.J
""
/"'..
-J.-)
c OJ u
L OJ o_
'---/
c ·rl
0 L
+-) (J)
. 8 r I
'7 I
6
.3
.?
1 1
0 f 4
I s
Material: Pb~.04Cu~;01Sn
I 10
0 In Air
+ In Air, previously expsd in warm seawater
x In Air, previously expsd in cold seawater
I 20
for 225 days
u---
I 40
Cycles ( 1 n thousands) FIGURE 3.5.8 FATIGUE DATA FOR SAMPLES PRE-CORRODED IN NELH SEAWATER FOR 225 DAYS BEFORE
TESTING IN AIR AT 25°C, DATA FOR SAMPLES TESTED IN AIR DIRECTLY AFTER PREPARATION ARE SHOWN FOR COHPARISON

4. 0 PERSONNEL
Jorn Larsen-Basse, Professor of Mechanical Engineering and senior Researcher, Hawaii Natural Energy Institute
Ko Moe Htun, Associate Professor of Mechanical Engineering
Panduragansayi Nuti, graduate student in Mechanical Engineering (crevice corrosion)
Young-Ho Park, graduate student in Mechanical Engineering (marine corrosion)
Najeeb Shaikh, graduate student in Mechanical Engineering (fatigue of lead)
Ahmad Tadjvar, graduate student in Mechanical Engineering (slurry abrasion)
5.0 PUBLICATIONS
J. Larsen-Basse and A. Tadjvar, "Slurry Abrasion of some Polymers Under Simulated Marine Conditions", Int. conf. on Wear of Materials, Houston, TX, April 1987 (in preparation).
J. Larsen-Basse, P. Nuti, and K.M. Htun, •crevice Corrosion of Stainless Steels in Hawaiian OTEC Seawater", CORROSION '87, san Francisco, March 1987 (in preparation).
P. Nuti, K.M. Htun and J. Larsen-Basse, •crevice corrosion of some stainless steels in Hawaiian surface and Deep Ocean seawaters", Int. Conf. on Fatigue, corrosion cracking, Fracture Mechanics and Failure Analysis, Salt Lake City, UT, Dec. 1985 (Abstract).
M.S. Theses in.Mechanical Engineering, University of Hawaii:
s. Najeeb and J. Larsen-Basse, "Corrosion Fatigue of Lead in surface and Deep Ocean seawater", student Poster, NACE Annual Meeting CORROSION '86, Houston, March 1986.
Panduragansayi Nuti, "Crevice Corrosion Evaluation of Some Stainless Steel Alloys in Tropical surface and Deep Ocean seawaters", (Dec. 1984)
Y.H. Park and J. Larsen-Basse, "Corrosion of some Metals in Tropical surface and Deep Ocean Seawaters", Student Poster, NACE Annual Meeting CORROSION '86, Houston, March 1986
Young-Ho Park, "Comparison of corrosiveness of Hawaiian surface and Deep Ocean Seawater,• (August 1986)
Najeeb Shaikh, "Corrosion Fatigue of Lead Sheathing Alloys in Some Natural Environments", (11ay 1986)
Ahmad Tadjvar, "Abrasion of Some Polymers ·in Slurries", (August 1986)
180
W 7,351 .. ~ ..... !135 p\IB n
LIBRARY STATE OF HAWAII
DEPARTMENT OF BUSINESS AND ECONOMIC DEVELOPMENT & TOURISM
P. 0. OOA 2359