phase i remedial investigation … · phase i remedial investigation ... at the ramsdell quarry...
TRANSCRIPT
REVISED FINAL
PHASE I REMEDIAL INVESTIGATION MAY 2004 FOLLOW-ON GROUNDWATER SAMPLING AT THE RAMSDELL QUARRY LANDFILL AT THE RAVENNA ARMY AMMUNITION PLANT RAVENNA, OHIO Prepared for
U.S. Army Corps of Engineers – Louisville District Contract No. F44650-D-99-0007 DELIVERY ORDER CY11 MARCH 2005
SCIENCE APPLICATIONS INTERNATIONAL CORPORATION
contributed to the preparation of this document and should not
be considered an eligible contractor for its review.

REVISED FINAL
PHASE 1 REMEDIAL INVESTIGATION MAY 2004 FOLLOW-ON
GROUNDWATER SAMPLING AT THE
RAMSDELL QUARRY LANDFILL AT THE
RAVENNA ARMY AMMUNITION PLANT RAVENNA, OHIO
March 2005
Prepared for U. S. Army Corps of Engineers
Louisville District Under Contract F44650-D-99-0007
Delivery Order Number CY11
Prepared by Science Applications International Corporation
151 Lafayette Drive Oak Ridge, Tennessee 37831
04-202(E)/031705 iii
CONTENTS
FIGURES...................................................................................................................................................... v
TABLES ....................................................................................................................................................... v
ACRONYMS..............................................................................................................................................vii
1.0 INTRODUCTION...........................................................................................................................1-1 1.1 PURPOSE AND SCOPE ......................................................................................................1-1
2.0 SITE HISTORY AND PREVIOUS INVESTIGATIONS ..............................................................2-1 2.1 SITE HISTORY....................................................................................................................2-1 2.2 PREVIOUS SITE INVESTIGATIONS................................................................................2-2 2.3 PHASE I REMEDIAL INVESTIGATION CONSTITUENTS OF POTENTIAL
CONCERN............................................................................................................................2-3
3.0 MAY 2004 WET SEASON SAMPLING .......................................................................................3-1 3.1 WATER LEVEL MEASUREMENTS .................................................................................3-1 3.2 MONITORING WELL SAMPLING ...................................................................................3-1 3.3 RESULTS .............................................................................................................................3-3
4.0 REFERENCES................................................................................................................................4-1
APPENDIX A GROUNDWATER SAMPLING LOGS.........................................................................A-1
APPENDIX B ANALYTICAL LABORATORY DATA TABLES ....................................................... B-1

04-202(E)/031705 iv
THIS PAGE INTENTIONALLY LEFT BLANK.

04-202(E)/031705 v
FIGURES
1-1 General Location and Orientation of RVAAP.................................................................................1-2 1-2 Ramsdell Quarry Site Map and Groundwater Monitoring Well Locations.....................................1-3 2-1 Ramsdell Quarry Potentiometric Surface, April 2004.....................................................................2-4 3-1 Groundwater Potentiometric Map, Second Event (May 2004) .......................................................3-2
TABLES
2-1 Summary of COPC Screening for Ramsdell Quarry Groundwater, Phase I RI (December 2003) .............................................................................................................................2-5
2-2 Detected Analytes in Ramsdell Quarry Phase I RI Wells Baseline Event (December 2003) .........2-6 3-1 Groundwater Elevations from Second Event Sampling (May 2004) ..............................................3-1 3-2 Summary of COPC Screening for Ramsdell Quarry Groundwater - Wet Season
(May 2004) ......................................................................................................................................3-4 3-3 Detected Analytes in Ramsdell Quarry Phase I RI Wells, Wet Season Sampling Event
(May 2004) ......................................................................................................................................3-5
04-202(E)/031705 vi
THIS PAGE INTENTIONALLY LEFT BLANK
04-202(E)/031705 vii
ACRONYMS
AOC area of concern COPC constituent of potential concern EPA U. S. Environmental Protection Agency JMC Joint Munitions Command MCL maximum contaminant level PCB polychlorinated biphenyl PRG preliminary remediation goal RI remedial investigation RQL Ramsdell Quarry Landfill RVAAP Ravenna Army Ammunition Plant SRC site-related contaminant SVOC semivolatile organic compound TAL target analyte list VOC volatile organic compound

04-202(E)/031705 viii
THIS PAGE INTENTIONALLY LEFT BLANK

04-202(E)/031705 1-1
1.0 INTRODUCTION
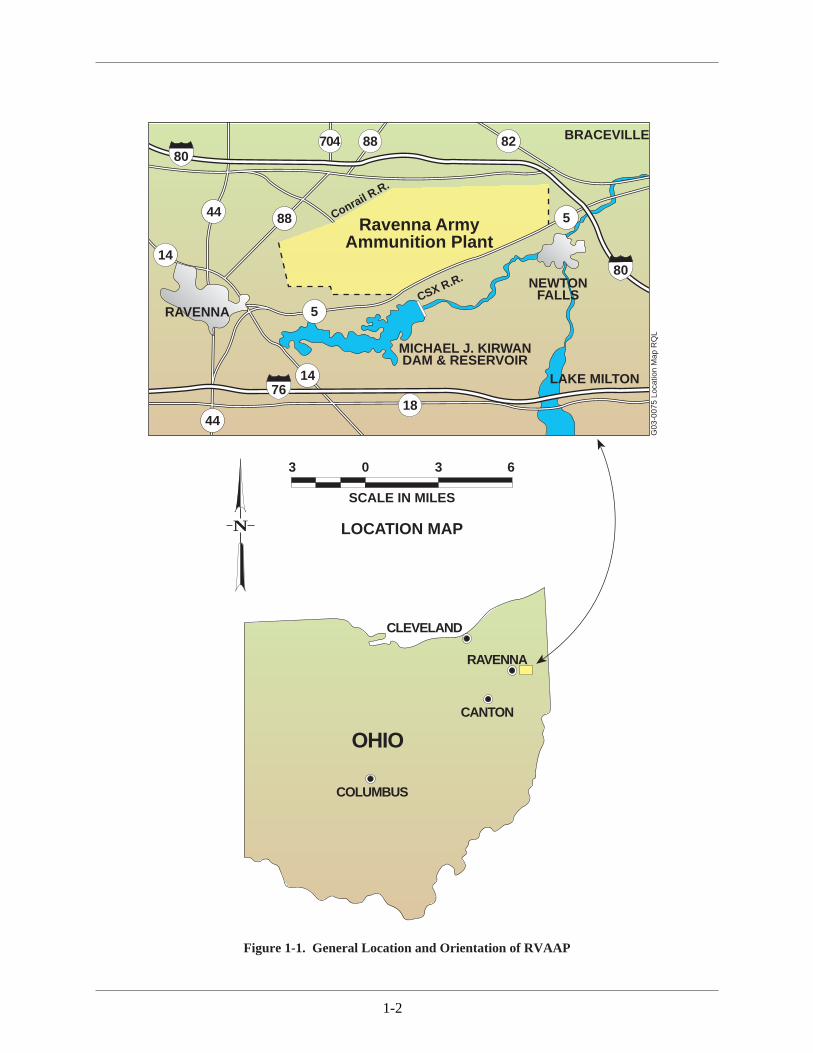
This report documents the results of the second round (wet season) of groundwater sampling at the Ramsdell Quarry Landfill (RQL) at the U. S. Army Joint Munitions Command (JMC) at the Ravenna Army Ammunition Plant, (RVAAP), Ravenna, Ohio (Figures 1-1 and 1-2). The second round of groundwater sampling was conducted in May 2004, and represents follow-on sampling of the Groundwater Investigation initiated during the Phase I Remedial Investigation (RI). Both the Phase I RI and follow-on sampling were conducted under the U. S. Department of Defense Installation Restoration Program by Science Applications International Corporation and its subcontractors, under contract number F44650-D-99-0007, Delivery Order CY11, with the U. S. Army Corps of Engineers, Louisville District. This investigation was conducted in compliance with the Comprehensive Environmental Response, Compensation, and Liability Act of 1980 following work plans reviewed and commented on by the Ohio Environmental Protection Agency.
The reader is referred to the Phase I RI (USACE 2004) for additional details regarding the field program, environmental setting, nature and extent of contamination, and conceptual site model.
1.1 PURPOSE AND SCOPE
During the Phase I RI, six new monitoring wells were installed both downgradient (north-northwest) and upgradient (south-southeast) of the area of concern (AOC). The downgradient wells were installed to bound the extent of contamination observed in groundwater adjacent to the quarry and to further evaluate potentiometric gradient reversals, observed previously adjacent to the quarry. Two groundwater wells (RQLmw-013 and -014) were installed in a configuration along the north side of Ramsdell Road to provide data on general hydrogeologic characteristics and groundwater flow patterns. One monitoring well (RQLmw-012) was installed east of Ramsdell Quarry to provide data on general hydrogeologic characteristics and groundwater flow patterns, and to provide closure for the monitoring network in the sidegradient direction. One monitoring well (RQLmw-015) was installed to the west of RQL to fill a data gap in this portion of the AOC. Two upgradient wells were installed to identify if any potential migration of contaminants from Load Line 1 is occurring, which might account for contaminants observed in an upgradient well (RQLmw-006). One upgradient monitoring well (RQLmw-016) was installed southwest of the quarry to fill a data gap in this portion of the AOC and to monitor for potential northward contaminant transport from Load Line 1. The other upgradient monitoring well (RQLmw-017) was installed due south of the AOC, between RQL and Load Line 1; this location was selected to determine whether contaminants observed in the upgradient well at RQL (RQLmw-006) are sourced from Load Line 1. Multiple sampling rounds of newly installed wells, and water level measurements of both newly installed and existing wells under both base flow/dry season conditions and high flow/wet season conditions, were planned to determine if transport of contaminants is occurring under certain hydrologic conditions.
High flow/wet season conditions are represented by the samples collected in May of 2004, and the results are documented in this report.
76
80
44
70480
44
14
14
18
5
5
8288
88
LAKE MILTON
MICHAEL J. KIRWAN DAM & RESERVOIR
BRACEVILLE
NEWTONFALLS
RAVENNA
Conrail R.R.
Ravenna Army Ammunition Plant
CSX R.R.
SCALE IN MILES
3 0 3 6
LOCATION MAP
Figure 1-1. General Location and Orientation of RVAAP
COLUMBUS
OHIO
CLEVELAND
CANTON
RAVENNAG
03-0
075
Loca
tion
Map
RQ
L
N
1-2
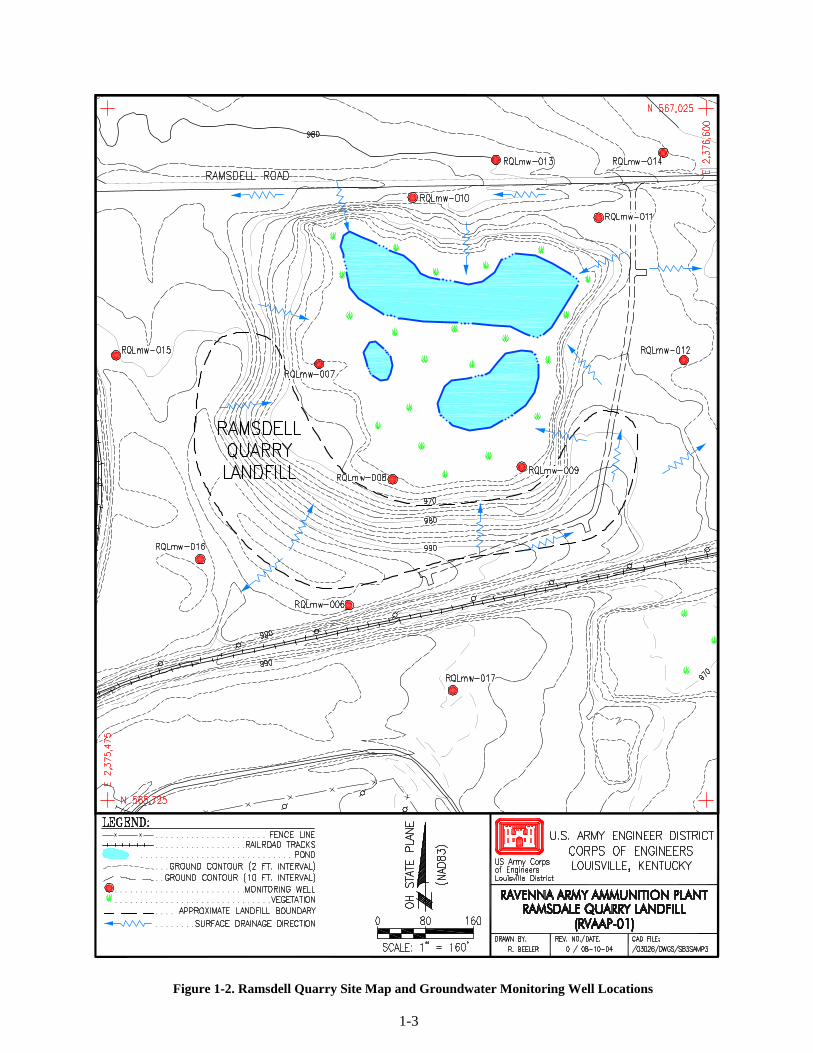
Figure 1-2. Ramsdell Quarry Site Map and Groundwater Monitoring Well Locations
1-3

04-202(E)/031705 1-4
THIS PAGE INTENTIONALLY LEFT BLANK

04-202(E)/031705 2-1
2.0 SITE HISTORY AND PREVIOUS INVESTIGATIONS
2.1 SITE HISTORY
RVAAP is located in northeastern Ohio in Portage and Trumbull counties and lies about 16 km (10 miles) east of Ravenna, Ohio (Figure 1-1). Operations at the facility began in September 1941 and included the storage, handling, and packing of military ammunition and explosives. The facility encompasses 8,668 ha (21,419 acres) and is jointly operated by the JMC of the U. S. Army and the National Guard Bureau. The JMC controls environmental AOCs and active mission areas. A detailed history of process operations and waste disposal processes for each AOC at RVAAP is presented in the Preliminary Assessment for the Ravenna Army Ammunition Plant, Ravenna, Ohio (USACE 1996).
Ramsdell Quarry is located in the northeastern portion of RVAAP and encompasses about 14 acres (Figure 1-2). The quarry was excavated about 9 to 12 m (30 to 40 ft) below existing grade into the Sharon Member of the Pottsville Formation. The original unconsolidated glacial material overlying the sandstone was only a few meters (<10 ft) thick and appears to have been entirely removed. The excavated material, consisting of sandstone and quartz pebble conglomerate, was used for road and construction ballast. Quarry operations were discontinued in about 1941.
The western and southern portions of the abandoned quarry were subsequently used for landfill operations (RQL) between 1941 and 1989 (Figure 1-2). No information is available regarding landfill disposal activities between 1941 and 1976. From 1976 until the landfill was closed in 1989, only non-hazardous solid waste was deposited in RQL. In 1978, a portion of the abandoned quarry was permitted as a sanitary landfill by the state of Ohio. The permit required a 30-m (100-ft) buffer be maintained between the landfill and the pond; the extent of the pond prior to this time is not known. Closure of the permitted sanitary landfill was completed in May 1990 under state of Ohio solid waste regulations (Ohio Administrative Code 3745-27-10). A requirement of closure was installation and semiannual monitoring of five monitoring wells.
In addition, from 1946 to the 1950s, the bottom of the quarry was used to burn waste explosives from Load Line 1. Approximately 18,000 225-kg (500-lb) incendiary or napalm bombs were reported to have been burned in the abandoned quarry. Liquid residues from annealing operations were also dumped in the quarry. No additional historical information currently is available on how the quarry was used, other than for landfill operations, from the 1950s until 1976, when operational records show that non-hazardous solid wastes were placed in RQL.
Based upon available information and past uses of the abandoned quarry, wastes may include domestic, commercial, and industrial solid and liquid wastes, including explosives (e.g., trinitrotoluene, hexahydro-1,3,5-trinitro-1,3,5-triazine, and Composition B), napalm, gasoline, acid dip liquor, annealing residue (e.g., sulfuric acid, shell casings, sodium orthosilicate, chromic acid, and alkali), aluminum chloride, and inert material. Interviews with former RVAAP personnel have indicated that much of the landfilled wastes and debris at the abandoned quarry were removed in the 1980s.
A much smaller quarry (also abandoned) was located directly southeast of RQL (Figure 1-2). Although no standing water was observed in the smaller quarry during earlier investigations, it was water filled in late August 2003 as a result of above average rainfall during the summer of 2003. No documentation of waste disposal or treatment exists for this quarry.
04-202(E)/031705 2-2
2.2 PREVIOUS SITE INVESTIGATIONS
Previous investigations at Ramsdell Quarry include monitoring related to post-closure of RQL, a Groundwater Investigation to evaluate the suitability of the post-closure groundwater monitoring network for RQL and to investigate general groundwater/surface water interactions in the quarry (USACE 1999, 2000), and the Phase I RI completed in Fall 2003 (USACE 2004). The Groundwater Investigation was designed to: (1) evaluate whether the closed landfill is in compliance with Ohio solid waste post-closure requirements; (2) to close data gaps in the RQL post-closure monitoring program; and (3) to address potential impacts upon groundwater related to historical operations at Ramsdell Quarry prior to use of the site for landfill operations.
The initial phase, conducted in July 1998, involved: (1) the installation and sampling of six monitoring wells, (2) sampling of the existing RQL post-closure monitoring well system, (3) sampling of sediment and surface water within the quarry, and (4) construction of a staff gauge within the main quarry pond. Results of the initial phase of the investigation were presented in the Initial Phase Report, Groundwater Investigation Ramsdell Quarry Landfill, Ravenna Army Ammunition plant, Ravenna, Ohio (USACE 1999).
The follow-on phase of the investigation, which extended until July 15, 1999, included: (1) quarterly, dry season, and wet season (storm event) sampling of the new monitoring well network and quarry pond surface water; (2) collection of long-term water levels from new monitoring well network and quarry pond; (3) monthly manual water level measurements from all wells and the pond staff gauge; and (4) collection of precipitation data. Results of the follow-on phase of the investigation were presented in the Final Phase Report, Groundwater Investigation Ramsdell Quarry Landfill, Ravenna Army Ammunition plant, Ravenna, Ohio (USACE 2000).
Groundwater samples from the Groundwater Investigation contained low, but consistently detectable, concentrations of nine explosive compounds and associated degradation products and nitroglycerin. Multiple trace metals were present above facility-wide background criteria, as well as Ohio drinking water standards in both unfiltered and filtered samples. The most prevalent of these were aluminum, arsenic, cobalt, manganese, mercury, nickel, and zinc. Sporadic detections of bis(2-ethylhexyl)phthalate and volatile organic compounds (VOCs) were noted. Toluene and methylene chloride were the most persistent VOCs detected. No VOC results exceeded Ohio primary maximum contaminant levels (MCLs). The upgradient well (RQLmw-006) and two wells (RQLmw-007 and -008), located at the toe of the landfill, typically had the highest percentages of detected contaminants. The furthest downgradient well (RQLmw-011) also had a comparatively high frequency of metals above background criteria.
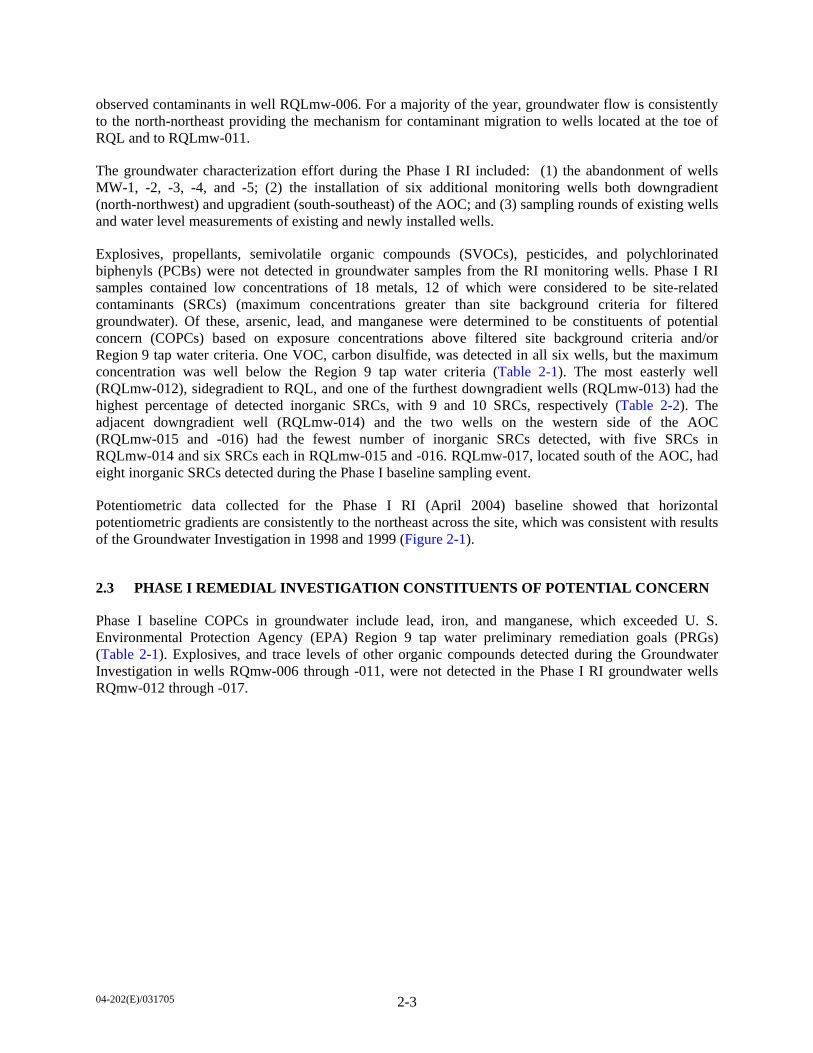
Potentiometric data collected during the period of the Groundwater Investigation showed that horizontal potentiometric gradients are consistently to the northeast across the site during dry periods of the year. During these periods, the quarry pond is a static representation of the water table and may even function as a sink through evapotranspiration processes. During the wet season of the year, a sufficient reservoir of water exists in the quarry pond to act as a recharge point to groundwater. As a result, potentiometric surface elevations in upgradient well RQLmw-006 and those at the toe of the landfill are essentially equal. Rainfall events during the wet period of the year adds additional volume to the quarry pond, which results in sufficient hydraulic head to produce slight, localized flow gradient reversals between the pond and well RQLmw-006 for short periods of time. Wells RQLmw-010 and -011 remain consistently downgradient of RQL throughout the year.
The distribution of contaminants in wells at RQL observed during the Groundwater Investigation are consistent with the observed hydraulic characteristics. Considering that the horizontal potentiometric gradient during the wet season is flat and exhibits short-term reversals, RQL is the likely source of
04-202(E)/031705 2-3
observed contaminants in well RQLmw-006. For a majority of the year, groundwater flow is consistently to the north-northeast providing the mechanism for contaminant migration to wells located at the toe of RQL and to RQLmw-011.
The groundwater characterization effort during the Phase I RI included: (1) the abandonment of wells MW-1, -2, -3, -4, and -5; (2) the installation of six additional monitoring wells both downgradient (north-northwest) and upgradient (south-southeast) of the AOC; and (3) sampling rounds of existing wells and water level measurements of existing and newly installed wells.
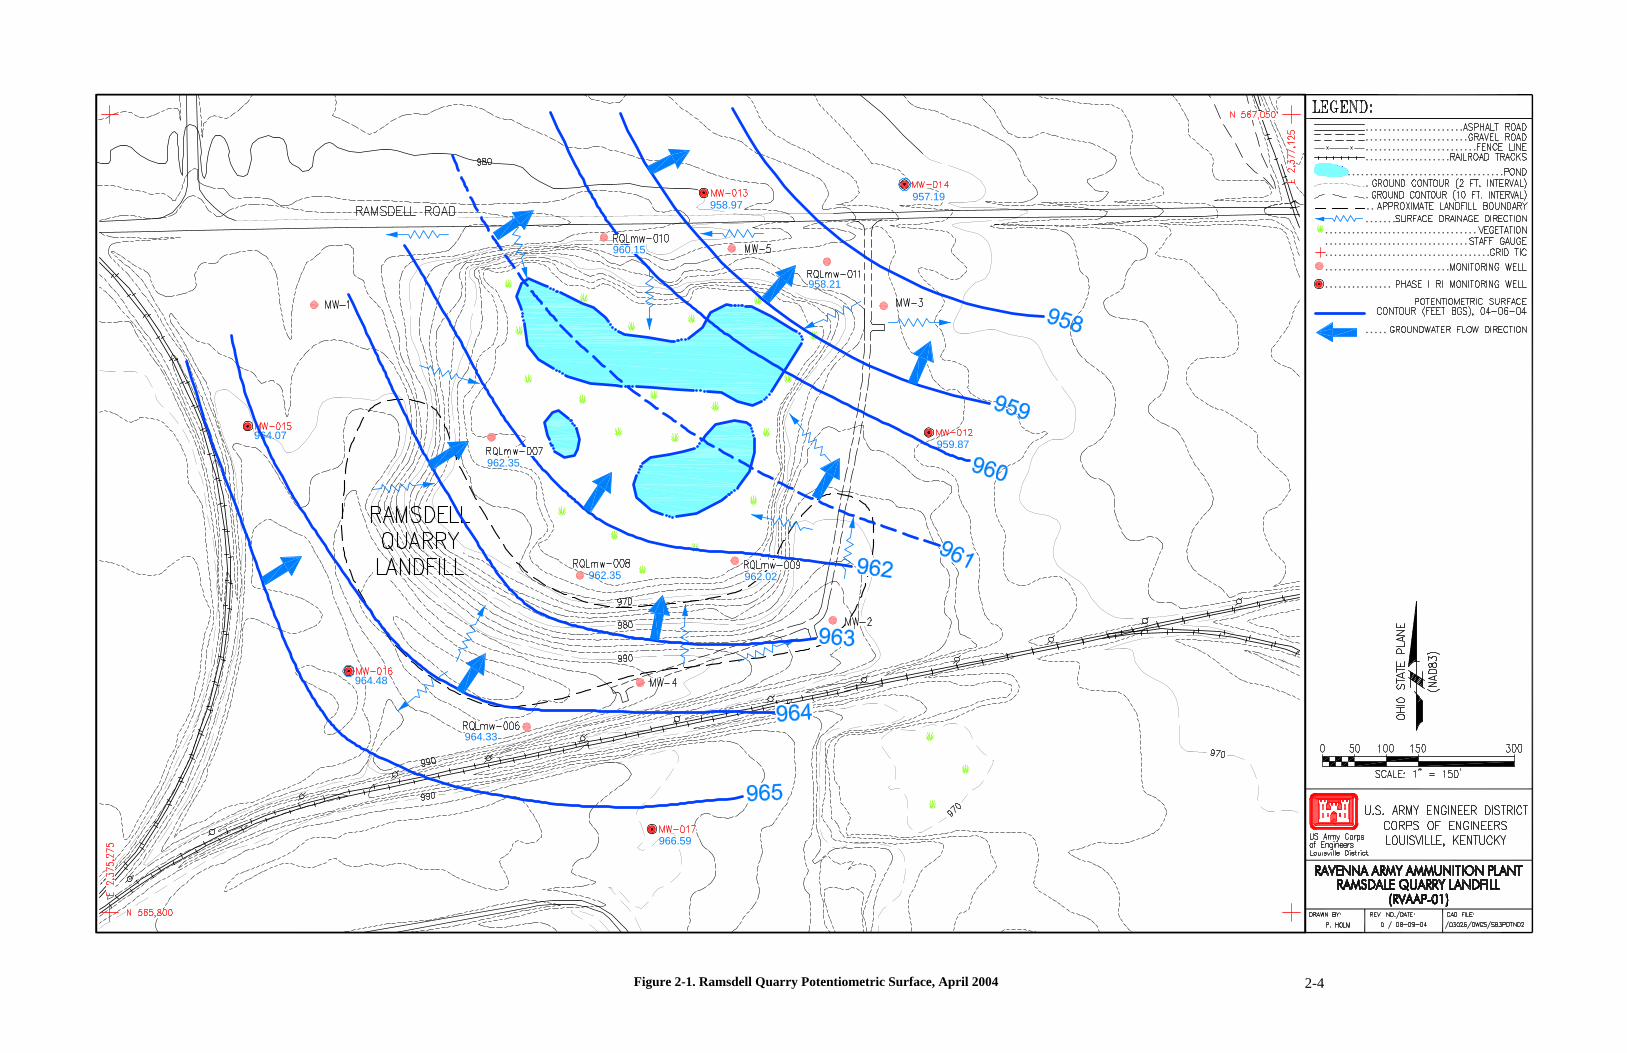
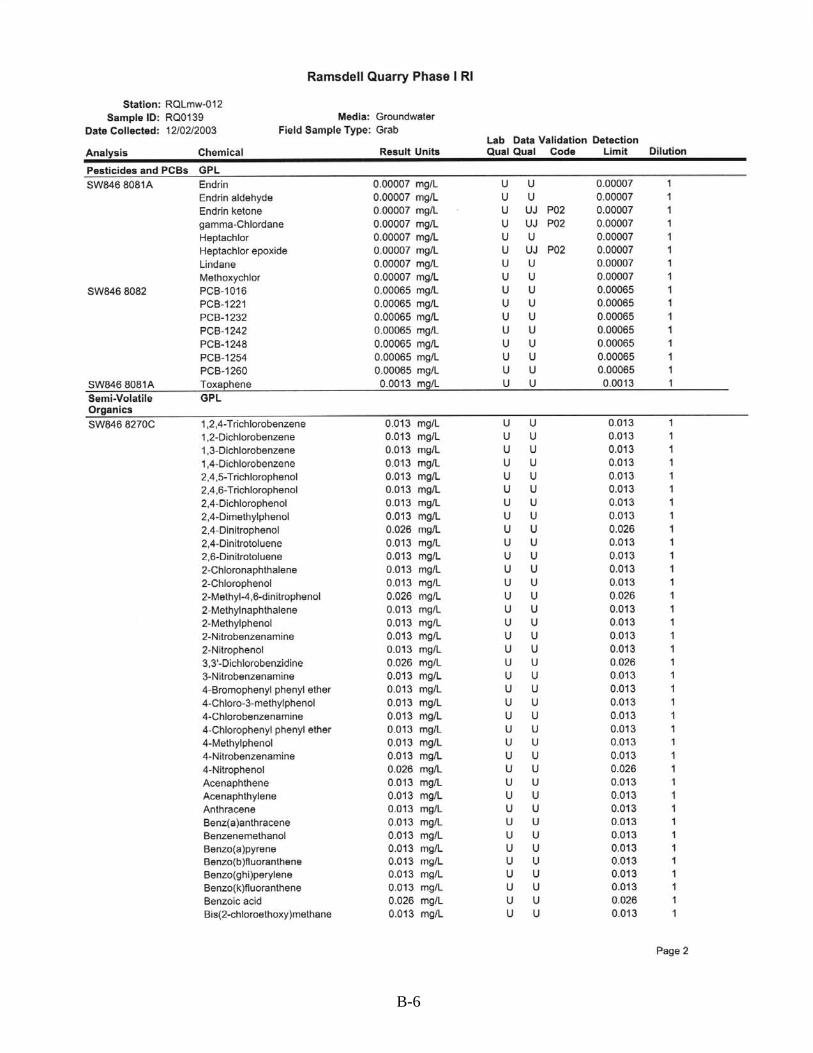
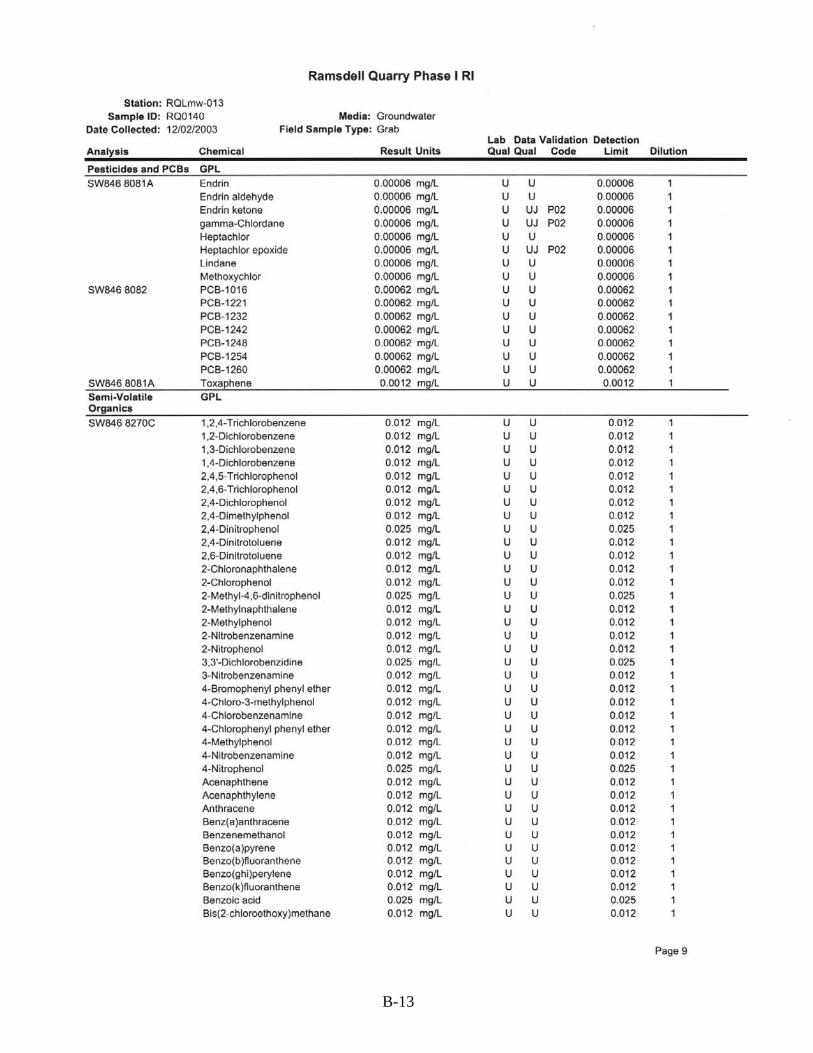
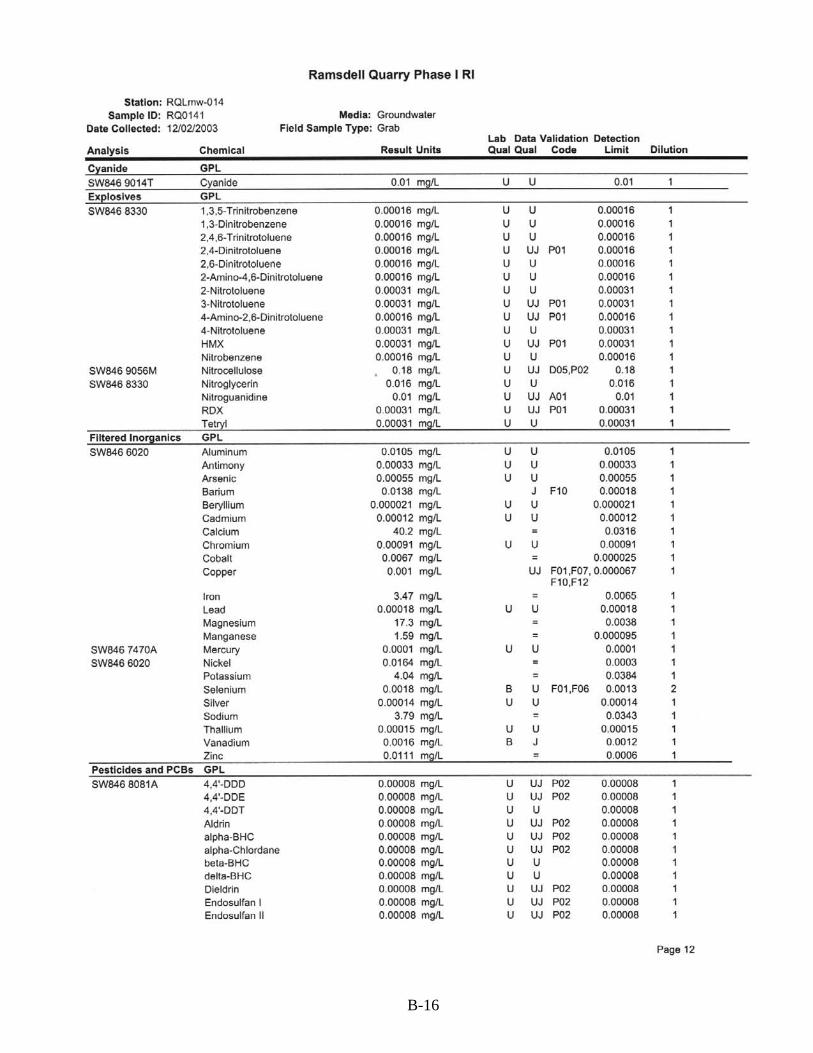
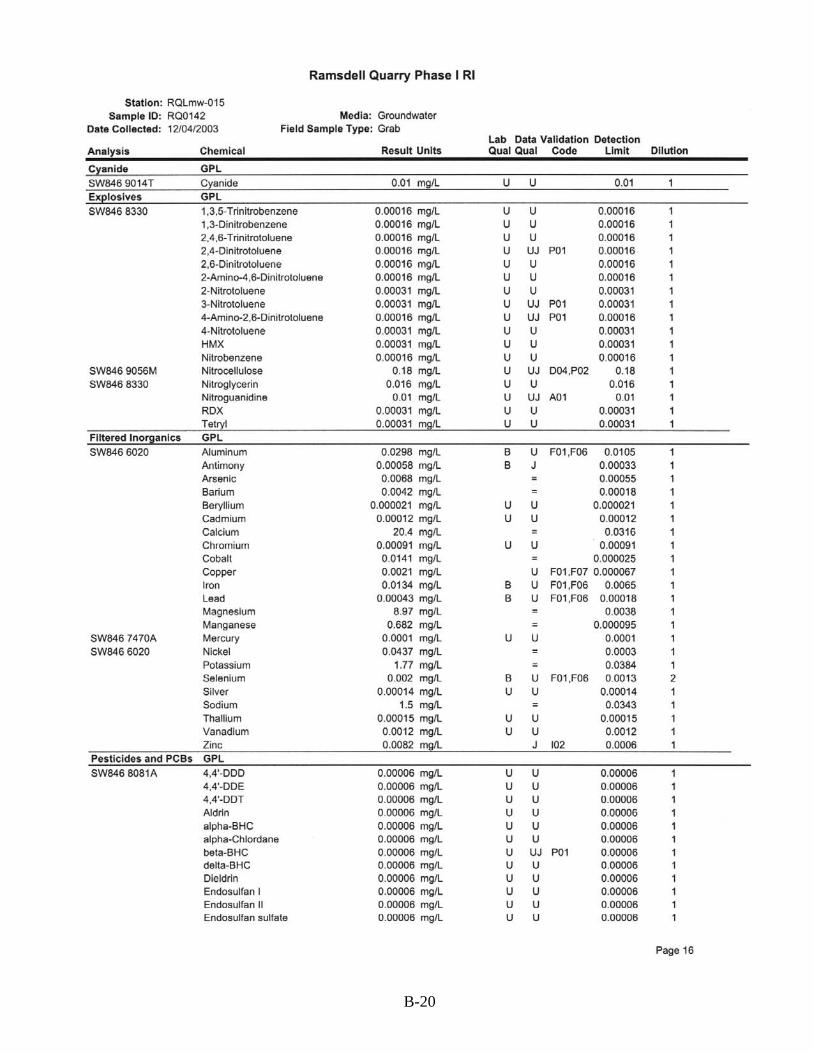
Explosives, propellants, semivolatile organic compounds (SVOCs), pesticides, and polychlorinated biphenyls (PCBs) were not detected in groundwater samples from the RI monitoring wells. Phase I RI samples contained low concentrations of 18 metals, 12 of which were considered to be site-related contaminants (SRCs) (maximum concentrations greater than site background criteria for filtered groundwater). Of these, arsenic, lead, and manganese were determined to be constituents of potential concern (COPCs) based on exposure concentrations above filtered site background criteria and/or Region 9 tap water criteria. One VOC, carbon disulfide, was detected in all six wells, but the maximum concentration was well below the Region 9 tap water criteria (Table 2-1). The most easterly well (RQLmw-012), sidegradient to RQL, and one of the furthest downgradient wells (RQLmw-013) had the highest percentage of detected inorganic SRCs, with 9 and 10 SRCs, respectively (Table 2-2). The adjacent downgradient well (RQLmw-014) and the two wells on the western side of the AOC (RQLmw-015 and -016) had the fewest number of inorganic SRCs detected, with five SRCs in RQLmw-014 and six SRCs each in RQLmw-015 and -016. RQLmw-017, located south of the AOC, had eight inorganic SRCs detected during the Phase I baseline sampling event.
Potentiometric data collected for the Phase I RI (April 2004) baseline showed that horizontal potentiometric gradients are consistently to the northeast across the site, which was consistent with results of the Groundwater Investigation in 1998 and 1999 (Figure 2-1).
2.3 PHASE I REMEDIAL INVESTIGATION CONSTITUENTS OF POTENTIAL CONCERN
Phase I baseline COPCs in groundwater include lead, iron, and manganese, which exceeded U. S. Environmental Protection Agency (EPA) Region 9 tap water preliminary remediation goals (PRGs) (Table 2-1). Explosives, and trace levels of other organic compounds detected during the Groundwater Investigation in wells RQmw-006 through -011, were not detected in the Phase I RI groundwater wells RQmw-012 through -017.
958.97
959.87964.07
962.35
960.15
962.35
962.02
966.59
964.33
964.48
958.21
957.19
Figure 2-1. Ramsdell Quarry Potentiometric Surface, April 2004 2-4
04-202(E)/031705 2-5
Table 2-1. Summary of COPC Screening for Ramsdell Quarry Groundwater, Phase I RI (December 2003)
Analyte (mg/L)
Results >Detection
Limit Average Result
Minimum Detect
Maximum Detect
95% UCL of Mean
Exposure Concentration MCL
Max. Det.>MCL?
Site Background
Criteria
Region 9 Tap Water
Criteria
Max Detect > Tap Water
Criteria COPC?Site
Related?Metals
Aluminum 3/ 6 1.27E+00 7.88E-02 6.13E+00 6.98E+06 6.13E+00 2.00E-01 Yes a 3.65E+01 No No Yes Antimony 1/ 6 2.34E-04 5.80E-04 5.80E-04 3.74E-04 3.74E-04 6.00E-03 No 1.46E-02 No No Yes Arsenic 4/ 6 2.13E-03 9.50E-04 6.80E-03 7.64E-02 6.80E-03 5.00E-02 No 4.48E-05 Yes Yes Yes Barium 6/ 6 2.17E-02 4.20E-03 4.54E-02 3.32E-02 3.32E-02 2.00E+00 No 2.56E-01 2.55E+00 No No No Beryllium 4/ 6 1.49E-04 7.60E-05 5.70E-04 2.31E-02 5.70E-04 4.00E-03 No 7.30E-02 No No Yes Cadmium 2/ 6 2.37E-04 4.80E-04 7.00E-04 4.69E-04 4.69E-04 5.00E-03 No 1.82E-02 No No Yes Calcium 6/ 6 1.11E+02 1.98E+01 4.52E+02 1.45E+03 4.52E+02 N/A 5.31E+01 None No No Cobalt 6/ 6 2.65E-02 6.70E-03 7.00E-02 1.58E-01 7.00E-02 N/A 7.30E-01 No No Yes Copper 3/ 6 1.55E-03 2.00E-03 3.40E-03 2.55E-03 2.55E-03 1.30E+00 No 1.46E+00 No No Yes Iron 4/ 6 2.56E+00 8.20E-03 7.25E+00 5.07E+00 5.07E+00 3.00E-01 Yes a 1.43E+00 1.09E+01 No No No Lead 2/ 6 3.92E-04 5.10E-04 1.30E-03 7.80E-04 7.80E-04 1.50E-02 No None Yes Yes Magnesium 6/ 6 2.26E+01 8.97E+00 5.73E+01 5.89E+01 5.73E+01 N/A 1.50E+01 None No No Manganese 6/ 6 2.32E+00 2.66E-01 6.17E+00 4.42E+01 6.17E+00 5.00E-02 Yes a 1.34E+00 8.76E-01 Yes Yes Yes Nickel 6/ 6 8.98E-02 1.64E-02 3.06E-01 1.04E+00 3.06E-01 1.00E-01 Yes 8.34E-02 7.30E-01 No No Yes Potassium 6/ 6 3.27E+00 1.77E+00 5.02E+00 4.88E+00 4.88E+00 N/A 5.77E+00 None No No Sodium 6/ 6 7.34E+00 1.50E+00 2.32E+01 4.03E+01 2.32E+01 N/A 5.14E+01 None No No Vanadium 1/ 6 7.67E-04 1.60E-03 1.60E-03 1.10E-03 1.10E-03 N/A 2.55E-01 No No Yes Zinc 6/ 6 1.03E-01 8.20E-03 3.12E-01 2.10E+01 3.12E-01 5.00E+00 No a 5.23E-02 1.09E+01 No No Yes
Organics-Volatile Carbon Disulfide 6/ 6 2.67E-03 6.60E-04 7.90E-03 1.82E-02 7.90E-03 N/A 1.04E+00 No No Yes a - Secondary maximum contaminant level (MCL). COPC = Constituent of potential concern. N/A = Not available. RI = Remedial investigation. UCL = Upper confidence limit.

04-202(E)/031705 2-6
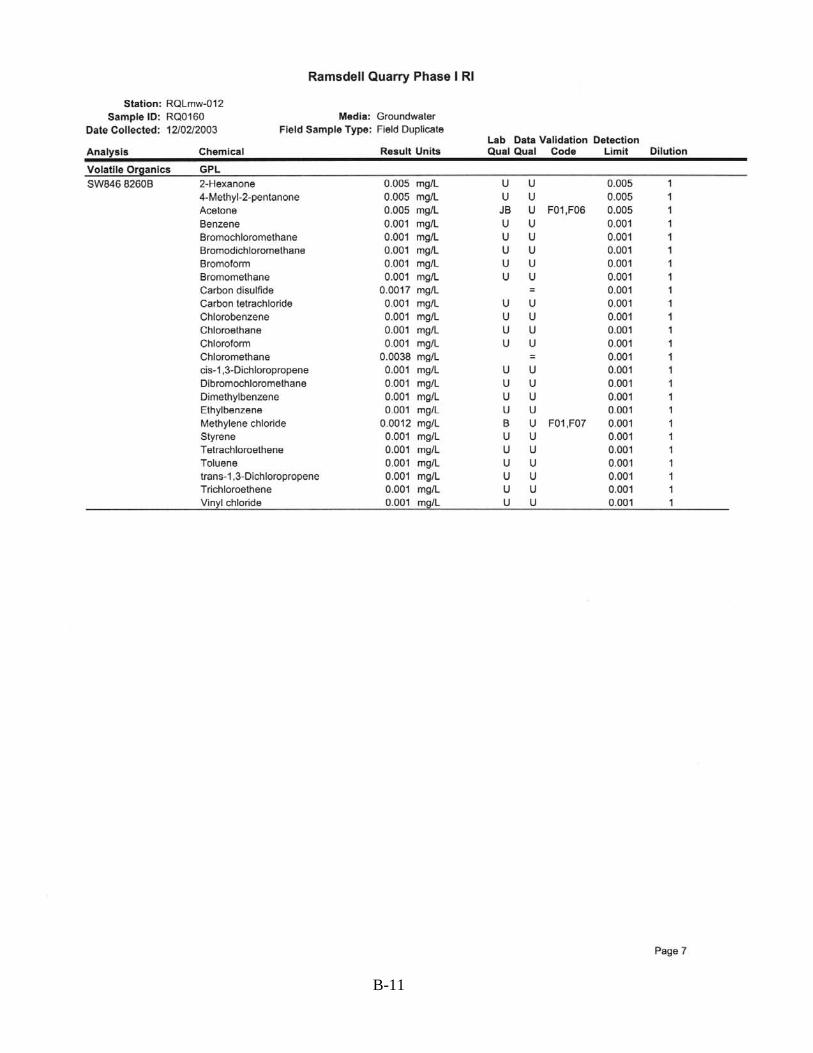
Table 2-2. Detected Analytes in Ramsdell Quarry Phase I RI Wells Baseline Event (December 2003)
Media Groundwater Groundwater Groundwater Groundwater Groundwater Groundwater Groundwater
Location
Ramsdell Monitoring
Well
Ramsdell Monitoring
Well
Ramsdell Monitoring
Well
Ramsdell Monitoring
Well
Ramsdell Monitoring
Well
Ramsdell Monitoring
Well
Ramsdell Monitoring
Well Station RQLmw-012 RQLmw-012 RQLmw-013 RQLmw-014 RQLmw-015 RQLmw-016 RQLmw-017
Sample ID RQ0139 RQ0160 RQ0140 RQ0141 RQ0142 RQ0143 RQ0144
Customer ID RQLmw-012-
0139-GW RQLmw-012-
0160-GW RQLmw-013-
0140-GW RQLmw-014-
0141-GW RQLmw-015-
0142-GW RQLmw-016-
0143-GW RQLmw-017-
0144-GW Date 12/02/2003 12/02/2003 12/02/2003 12/02/2003 12/04/2003 12/04/2003 12/01/2003
Field Type Grab Field
Duplicate Grab Grab Grab Grab Grab Analyte (mg/L) Units
Dissolved Metals Aluminum mg/L 1.38 = * 1.4 = * 6.13 = * 0.0105 U 0.0298 U 0.0413 U 0.0788 = *Antimony mg/L 0.00033 U 0.00033 U 0.00033 U 0.00033 U 0.00058 J * 0.00033 U 0.00033 U Arsenic mg/L 0.00055 U 0.00055 U 0.002 = * 0.00055 U 0.0068 = * 0.0025 = * 0.00095 J *Barium mg/L 0.0238 J 0.024 J 0.0454 J 0.0138 J 0.0042 = 0.0261 = 0.0167 J Beryllium mg/L 0.000076 J
* 0.000083 =
* 0.00057 = * 0.000021 U 0.000021 U 0.000076 J
* 0.00015 = *
Cadmium mg/L 0.0007 = * 0.00075 = * 0.00048 = * 0.00012 U 0.00012 U 0.00012 U 0.00012 U Calcium mg/L 50.6 = 51.1 = 19.8 = 40.2 = 20.4 = 452 = * 81.3 = *Cobalt mg/L 0.0084 = * 0.0085 = * 0.0452 = * 0.0067 = * 0.0141 = * 0.0143 = * 0.07 = *Copper mg/L 0.0034 J * 0.0037 J * 0.002 J * 0.001 UJ 0.0021 U 0.00024 U 0.0022 J *Iron mg/L 0.0082 J 0.0189 J 4.6 = * 3.47 = * 0.0134 U 7.25 = * 0.0065 U Lead mg/L 0.0013 = * 0.0014 = * 0.00051 J * 0.00018 U 0.00043 U 0.00029 U 0.00018 U Magnesium mg/L 13.6 = 13.8 = 11.9 = 17.3 = * 8.97 = 57.3 = * 26.3 = *Manganese mg/L 0.266 = 0.27 = 0.584 = 1.59 = * 0.682 = 6.17 = * 4.63 = *Nickel mg/L 0.0202 = 0.0205 = 0.0906 = * 0.0164 = 0.0437 = 0.062 = 0.306 = *Potassium mg/L 5.02 = 5.08 = 2.87 = 4.04 = 1.77 = 2.67 = 3.24 = Sodium mg/L 3.63 = 3.68 = 23.2 = 3.79 = 1.5 = 6.82 = 5.12 = Vanadium mg/L 0.0012 U 0.0012 U 0.0012 U 0.0016 J * 0.0012 U 0.0012 U 0.0012 U Zinc mg/L 0.0415 = 0.0433 = 0.235 = * 0.0111 = 0.0082 J 0.0097 J 0.312 = *
Volatile Organics Carbon Disulfide
mg/L 0.00066 J 0.0017 = 0.0025 = 0.00069 J 0.0033 = 0.0079 = 0.00095 J
Chloromethane mg/L 0.001 U 0.0038 = 0.001 U 0.001 U 0.001 U 0.001 U 0.001 U
ID = Identifier. RI = Remedial investigation. RQL = Ramsdell Quarry Landfill. Qualifiers:
* = Value above facility-wide background. = = Analysis present and concentration accurate. J = Estimated values less than reporting limits. U = Non-detect.

04-202(E)/031705 3-1
3.0 MAY 2004 WET SEASON SAMPLING
Prior to purging and sampling for the May 2004 sampling event of the Phase I RI groundwater monitoring wells, water level measurements were taken at each of the six newly installed groundwater wells (RQLmw-012 through -017), as well as the existing groundwater wells (RQLmw-006 through -011). Wells RQLmw-012 through -017 were also sampled for chemical analysis.
3.1 WATER LEVEL MEASUREMENTS
Table 3-1 presents the results of water level measurements under high flow conditions. Figure 3-1 shows the groundwater potentiometric surface based on the second event water level measurements.
Table 3-1. Groundwater Elevations from Second Event Sampling (May 2004)
Well ID Elev. Top of PVC Depth to Water (ft)
Groundwater Elevation
RQLmw-006 995.39 30.10 965.29 RQLmw-007 965.91 3.33 962.58 RQLmw-008 966.08 3.38 962.7 RQLmw-009 964.58 2.12 962.46 RQLmw-010 982.14 21.77 960.37 RQLmw-011 976.57 18.15 958.42 RQLmw-012 977.65 17.54 960.11 RQLmw-013 980.71 21.55 959.16 RQLmw-014 973.49 16.17 957.32 RQLmw-015 991.26 26.36 964.90 RQLmw-016 996.60 30.16 966.44 RQLmw-017 991.23 23.29 967.94
ID = Identifier. PVC = Polyvinyl chloride.
Potentiometric data collected immediately before the second (May 2004) sampling event of the investigation continue to show that horizontal potentiometric gradients are consistently to the northeast across the site. The gradient reversals observed during the Groundwater Investigation water level measurements were not noted during May 2004 at the time the water level measurements were taken. The water table was elevated by 1 to 2 ft compared to measurements taken in early April, 2004, and a gradient of nearly 11 ft existed between the most upgradient well (RQLmw-017) and the most downgradient well (RQLmw-014). The difference between these two wells during the previous event was only 8 ft.
3.2 MONITORING WELL SAMPLING
Following AOC-wide groundwater level measurements, groundwater samples were collected from each of the six Phase I RI monitoring wells. Per the SAP Addendum for the Phase I RI, wet season/storm event sampling was to occur within 24 hrs of a rainfall event of 1 in. or more. Due to the lack of such substantial single rain events during the wet season period, relief from this specific requirement was provided by Ohio EPA and USACE so long as wet season, high flow conditions were represented.

Figure 3-1. Groundwater Potentiometric Map, Second Event (May 2004)
3-2

04-202(E)/031705 3-3
Sampling started on May 19, 2004, following a total of 0.28 in. of rainfall that fell over the preceding 4 days (May 15 through 18, 2004). Additional rainfall occurred on May 20, 2004 (0.3 in.), and May 21, 2004 (0.68 in.), during the course of the sampling event. Thus, the May 2004 samples are deemed to be representative of high flow conditions.
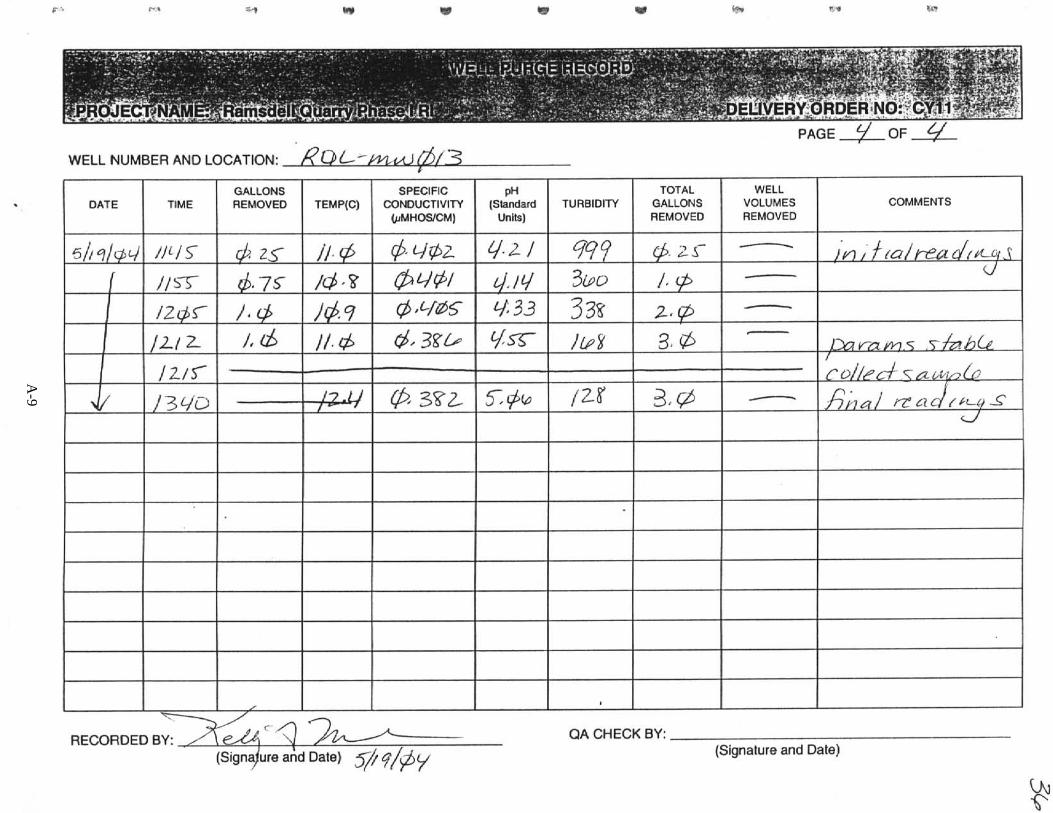
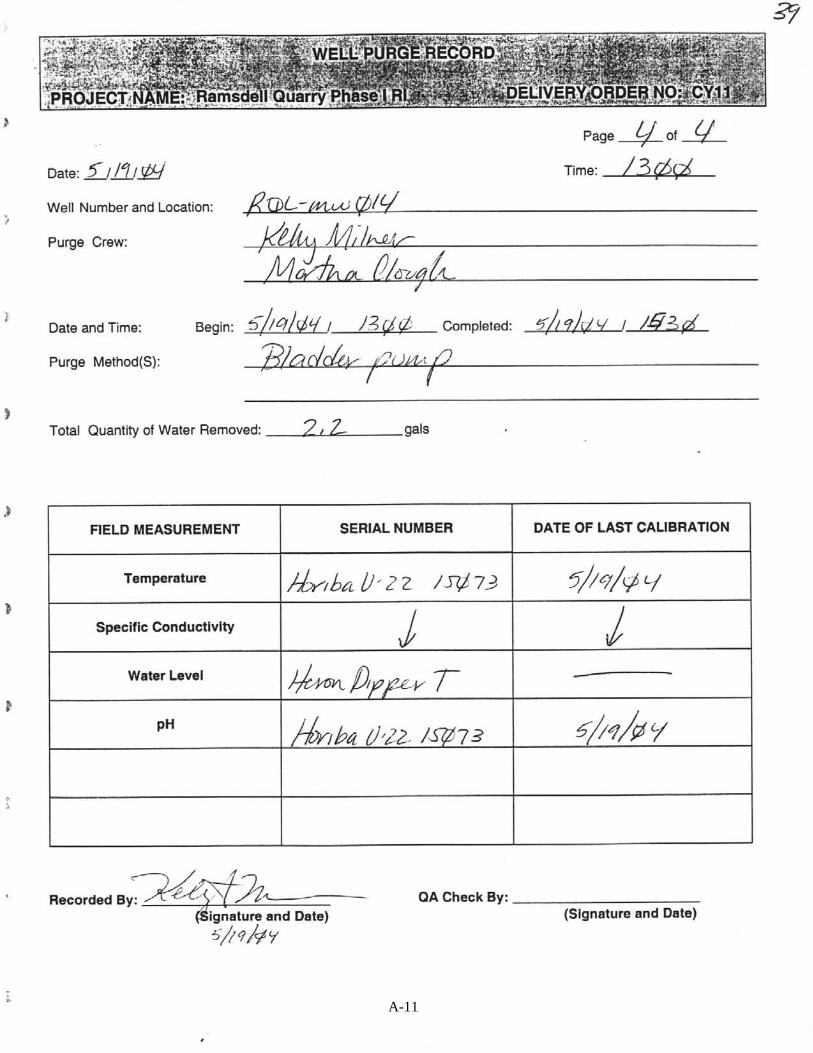
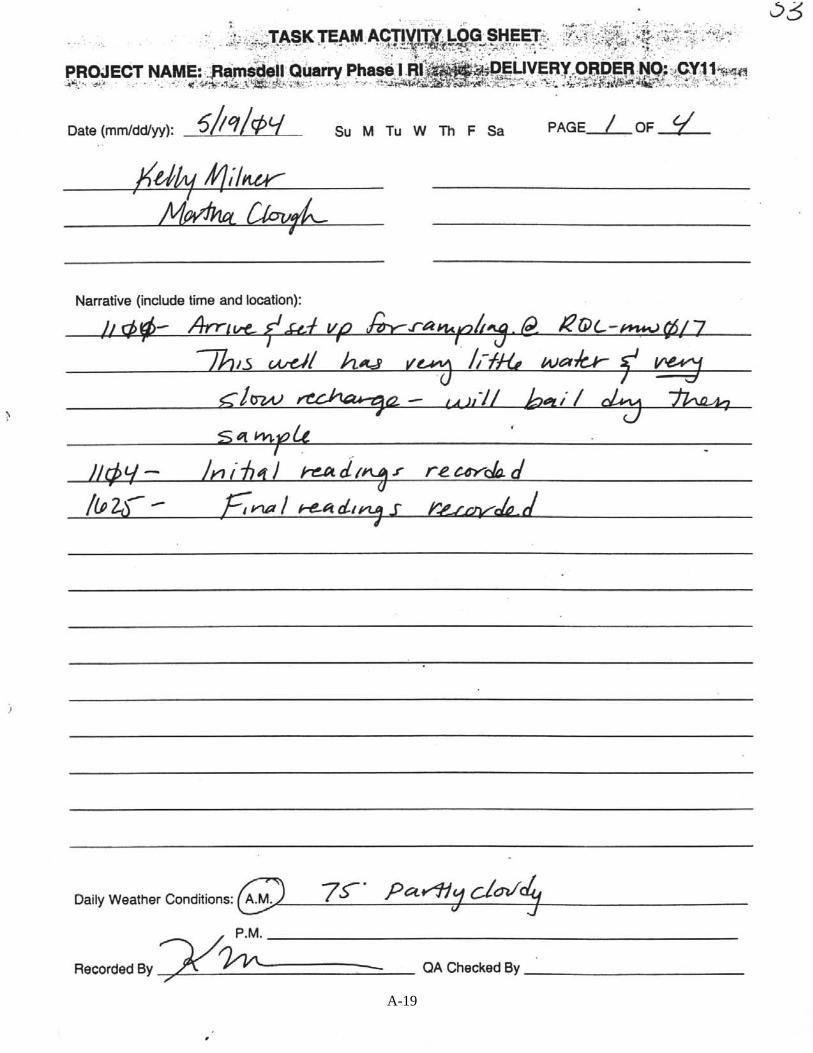
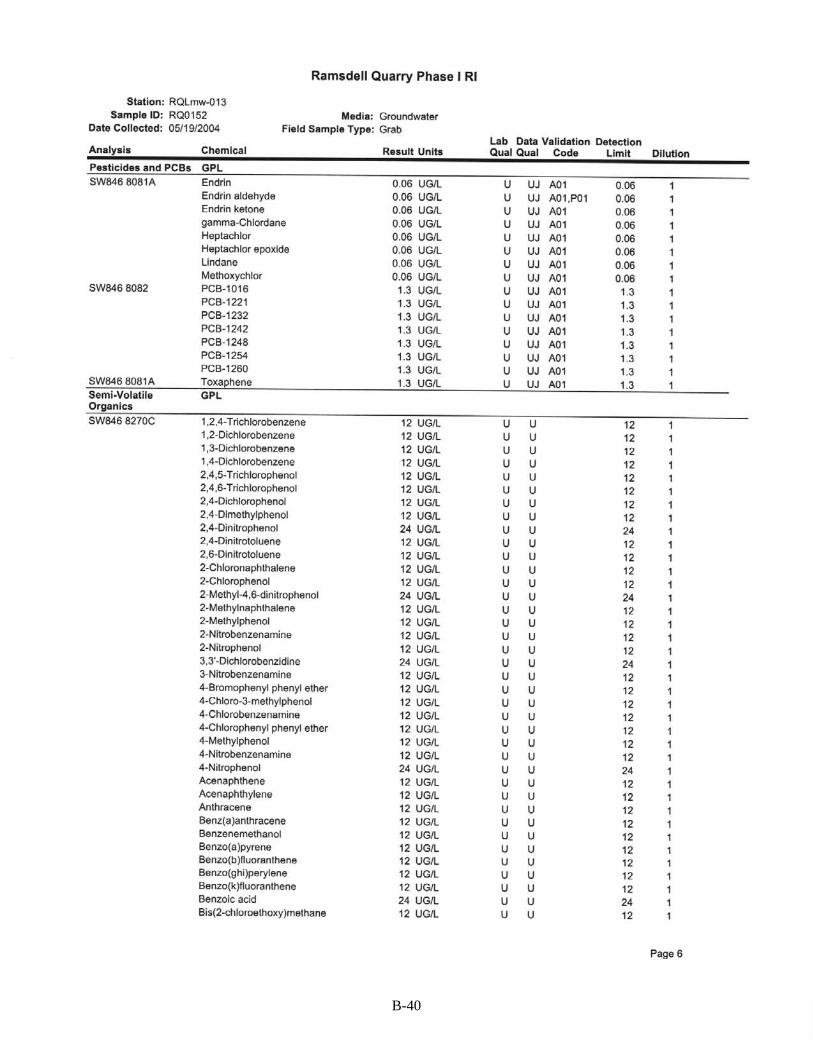
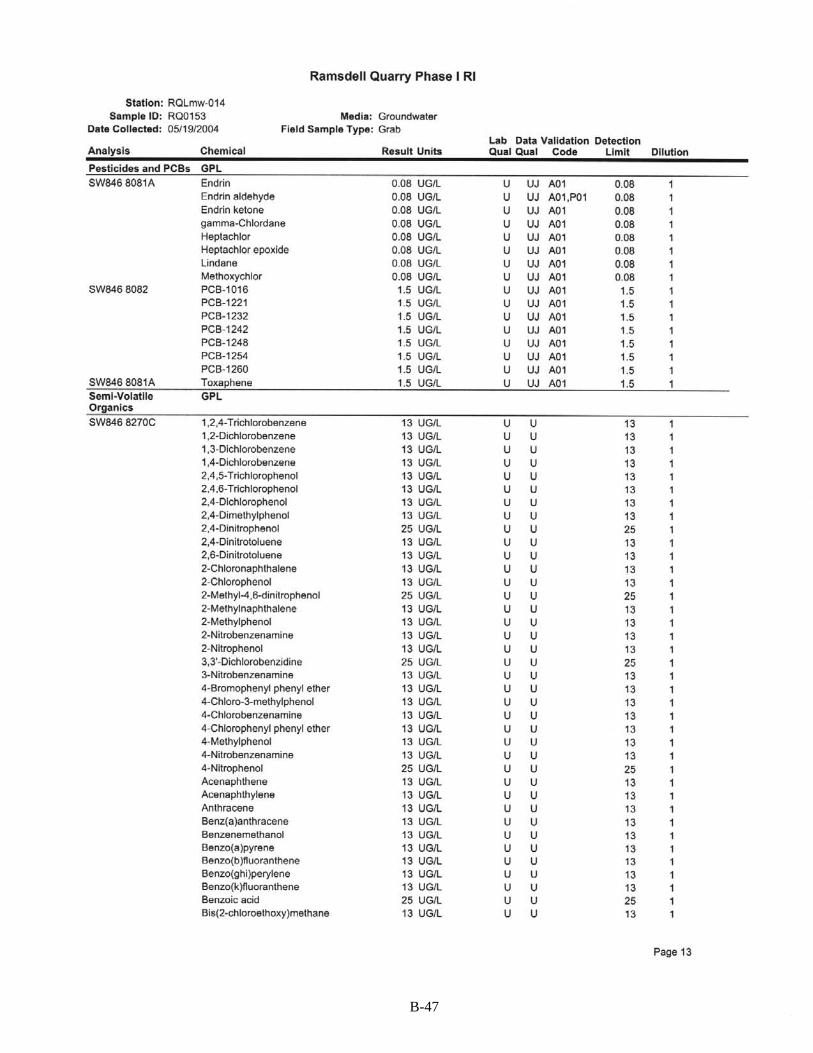
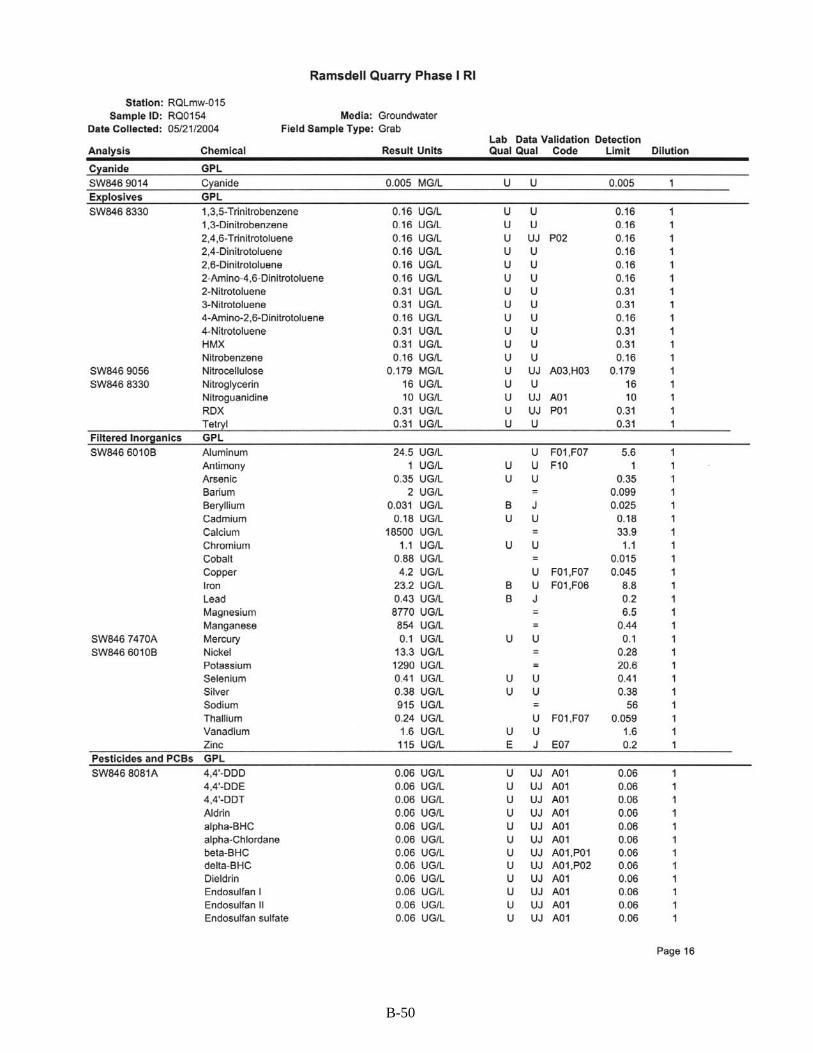
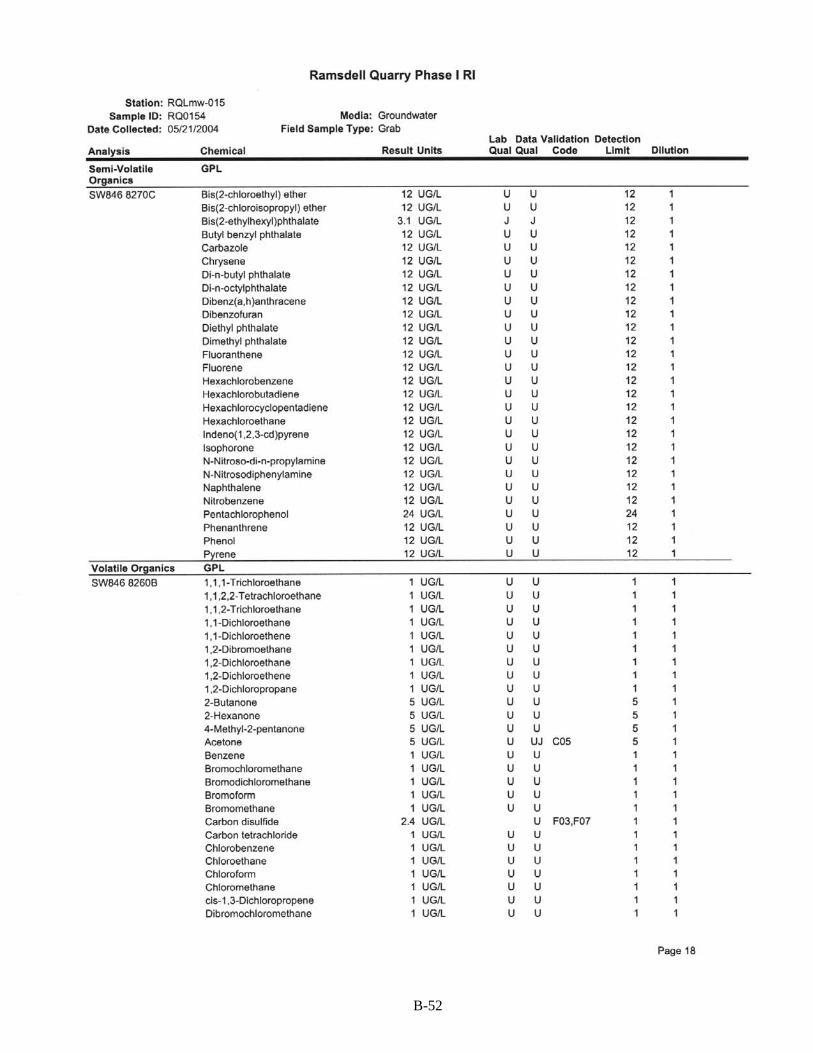
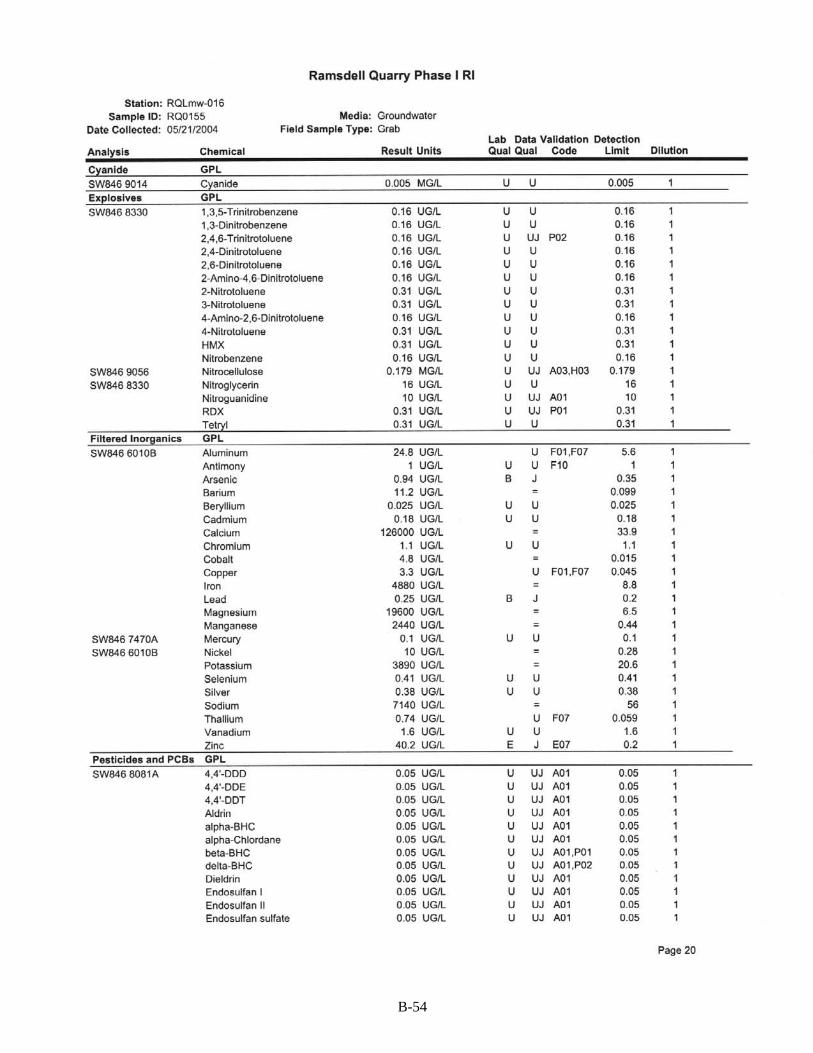
The procedure for sampling is detailed in Section 4.3.4.2 of the Facility-wide Sampling and Analysis Plan (USACE 2001). All groundwater samples from RQL were analyzes for target analyte list (TAL) metals (filtered only), explosives, propellants, cyanide, VOCs, SVOCs, and pesticides/PCBs. Despite being developed in accordance with work plan specifications and using micropurge sampling methods, where possible, to obtain the lowest turbidity wells practicable, turbidity levels remained above 5 nephelometric turbidity units in most wells. Accordingly, only filtered metals samples were obtained. Groundwater samples analyzed for TAL metals were filtered during sample collection using an in-line, disposable barrel filter with 0.45-um pores. For those wells with slow recharge rates where micro-purge techniques were not applicable (RQLmw-015, -016, and -017), samples for TAL metals were filtered using a negative pressure, hand-operated vacuum pump and collection flask with a 0.45-um pore size filter. Analytical program overview for the wet season event sampling was consistent with that for the baseline sampling during the Phase I RI. Groundwater sampling logs are presented in Appendix A; and complete analytical results for all sampling events are included in Appendix B.
3.3 RESULTS
Table 3-2 presents the summary statistics for the second round sampling event. A total of 11 inorganic and 2 organic SRCs were detected in the wet season samples. Arsenic, lead, and manganese exceeded the EPA Region 9 tap water criteria, and are considered to be COPCs. However, it should be noted that while arsenic and manganese exceeded the PRG (in the case of lead, no Region 9 tap water criteria exist), the maximum concentration of both metals was below other promulgated criteria. The federal and Ohio MCL for arsenic is 0.05 mg/L, and the maximum detected concentration in May 2004 was 0.0012 mg/L. Likewise, for lead, the federal treatment technique standard is 0.015 mg/L, and the maximum detected concentration in May 2004 was 0.0036 mg/L. Two phthalates, bis(2-ethylhexyl)phthalate and di-n-butyl phthalate, were detected in the May 2004 analysis. Di-n-butyl phthalate was below the Region 9 tap water criteria, and is not considered a COPC. All six wells had detections of phthalates during the second sampling event, and none were detected during the Phase I RI baseline event. Conversely, carbon disulfide was detected in all wells during the Phase I RI baseline event, but was not detected in May 2004.
Vanadium, which was detected in one well during the Phase I RI baseline event, was not detected in the May 2004 samples. The southernmost well, RQLmw-017, had the greatest number of inorganic SRCs detected, with 10 of 11 SRCs having their maximum concentrations at this well (Table 3-3). Downgradient well RQLmw-013 also contained 10 SRCs, with the maximum concentration of arsenic at this location (arsenic was not detected in RQLmw-017). The eastern boundary well RQLmw-012 contained nine SRCs, and downgradient wells RQLmw-014, -015, and -016 each contained six SRCs.
The explosives noted in groundwater during the 1998/1999 Groundwater Investigation were not detected in any Phase I RI groundwater well in the 2003 and 2004 baseline and wet season sample events. It can be concluded that the bounds of explosive contamination in groundwater have been adequately defined, and explosive contaminant migration is not occurring off the AOC. The continual low concentrations of metals detected are fairly indicative of landfill environments, and concentrations continue to fall below applicable Ohio MCLs.

04-202(E)/031705 3-4
Table 3-2. Summary of COPC Screening for Ramsdell Quarry Groundwater - Wet Season (May 2004)
Analyte (mg/L)
Results >Detection
Limit Average Result
Minimum Detect
Maximum Detect
95% UCL of Mean
Exposure Concentration MCL
Max. Det.>MCL?
Site Background
Criteria
Region 9 Tap
Water Criteria
Max Detect > Tap Water
Criteria COPC?Site
Related?Metals
Aluminum 3/ 6 2.77E+00 6.56E-01 1.14E+01 1.11E+10 1.14E+01 2.00E-01 Yes a 3.65E+01 No No Yes Arsenic 2/ 6 4.73E-04 9.40E-04 1.20E-03 8.60E-04 8.60E-04 5.00E-02 No 4.48E-05 Yes Yes Yes Barium 6/ 6 1.92E-02 2.00E-03 3.16E-02 2.92E-02 2.92E-02 2.00E+00 No 2.56E-01 2.55E+00 No No No Beryllium 4/ 6 5.35E-04 3.10E-05 2.70E-03 7.22E+00 2.70E-03 4.00E-03 No 7.30E-02 No No Yes Cadmium 3/ 6 3.85E-04 2.10E-04 1.50E-03 4.62E-03 1.50E-03 5.00E-03 No 1.82E-02 No No Yes Calcium 6/ 6 4.34E+01 1.85E+01 1.26E+02 1.32E+02 1.26E+02 N/A 5.31E+01 None No No Chromium 4/ 6 1.97E-03 1.80E-03 4.80E-03 9.02E-03 4.80E-03 1.00E-01 No None Yes Yes Cobalt 6/ 6 1.81E-02 8.80E-04 5.33E-02 1.24E+00 5.33E-02 N/A 7.30E-01 No No Yes Iron 4/ 6 3.01E+00 3.06E+00 6.74E+00 5.20E+00 5.20E+00 3.00E-01 Yes a 1.43E+00 1.09E+01 No No No Lead 6/ 6 9.60E-04 2.00E-04 3.60E-03 1.06E-02 3.60E-03 1.50E-02 No None Yes Yes Magnesium 6/ 6 1.21E+01 8.73E+00 1.96E+01 1.69E+01 1.69E+01 N/A 1.50E+01 None No No Manganese 6/ 6 2.19E+00 2.14E-01 7.08E+00 7.36E+01 7.08E+00 5.00E-02 Yes 1.34E+00 8.76E-01 Yes Yes Yes Nickel 6/ 6 4.56E-02 1.00E-02 1.36E-01 4.71E-01 1.36E-01 1.00E-01 Yes a 8.34E-02 7.30E-01 No No Yes Potassium 6/ 6 2.92E+00 1.29E+00 3.93E+00 3.74E+00 3.74E+00 N/A 5.77E+00 None No No Selenium 1/ 6 2.49E-04 4.70E-04 4.70E-04 3.38E-04 3.38E-04 5.00E-02 No 1.82E-01 No No Yes Sodium 6/ 6 6.44E+00 9.15E-01 1.92E+01 7.12E+01 1.92E+01 N/A 5.14E+01 None No No Zinc 6/ 6 1.96E-01 2.27E-02 7.81E-01 6.42E+00 7.81E-01 5.00E+00 No a 5.23E-02 1.09E+01 No No Yes
Organics-Semivolatile Bis(2-ethylhexyl)phthalate 6/ 6 9.48E-03 3.10E-03 2.20E-02 4.20E-02 2.20E-02 6.00E-03 Yes 4.80E-03 Yes Yes Yes Di-n-butyl phthalate 5/ 6 2.45E-03 1.50E-03 2.00E-03 3.89E-03 2.00E-03 N/A 3.65E+00 No No Yes a - Secondary maximum contaminant level (MCL). COPC = Constituent of potential concern. N/A = Not available. UCL = Upper confidence limit.

04-202(E)/031705 3-5
Table 3-3. Detected Analytes in Ramsdell Quarry Phase I RI Wells, Wet Season Sampling Event (May 2004)
Media Groundwater Groundwater Groundwater Groundwater Groundwater Groundwater Groundwater
Location Ramsdell
Monitoring WellRamsdell
Monitoring WellRamsdell
Monitoring WellRamsdell
Monitoring WellRamsdell
Monitoring WellRamsdell
Monitoring WellRamsdell
Monitoring WellStation RQLmw-012 RQLmw-013 RQLmw-013 RQLmw-014 RQLmw-015 RQLmw-016 RQLmw-017
Sample ID RQ0151 RQ0152 RQ0159 RQ0153 RQ0154 RQ0155 RQ0156
Customer ID RQLmw-012-
0151-GW RQLmw-013-
0152-GW RQLmw-013-
0159-GW RQLmw-014-
0153-GW RQLmw-015-
0154-GW RQLmw-016-
0155-GW RQLmw-017-
0156-GW Date 05/20/2004 05/19/2004 05/19/2004 05/19/2004 05/21/2004 05/21/2004 05/19/2004
Field Type Grab Grab Field Duplicate Grab Grab Grab Grab Analyte (mg/L) Units
Dissolved Metals Aluminum mg/L 0.656 = * 4.53 = * 4.56 = * 0.0151 U 0.0245 U 0.0248 U 11.4 = * Arsenic mg/L 0.00035 U 0.0012 J * 0.0014 = * 0.00035 U 0.00035 U 0.00094 J * 0.00035 U Barium mg/L 0.0301 = 0.0316 = 0.0321 = 0.0276 = 0.002 = 0.0112 = 0.0125 = Beryllium mg/L 0.000061 J * 0.00039 = * 0.00037 = * 0.000025 U 0.000031 J * 0.000025 U 0.0027 = * Cadmium mg/L 0.00021 J * 0.00033 J * 0.00036 J * 0.00018 U 0.00018 U 0.00018 U 0.0015 = * Calcium mg/L 28.6 = 22.5 = 22.4 = 21 = 18.5 = 126 = * 43.5 = Chromium mg/L 0.0019 J * 0.0022 J * 0.0011 U 0.0018 J * 0.0011 U 0.0011 U 0.0048 = * Cobalt mg/L 0.0064 = * 0.0338 = * 0.0348 = * 0.0094 = * 0.00088 = * 0.0048 = * 0.0533 = * Iron mg/L 0.0186 U 3.33 = * 3.37 = * 6.74 = * 0.0232 U 4.88 = * 3.06 = * Lead mg/L 0.00095 = * 0.00033 J * 0.00041 J * 0.0002 J * 0.00043 J * 0.00025 J * 0.0036 = * Magnesium mg/L 8.73 = 11.9 = 11.7 = 10.3 = 8.77 = 19.6 = * 13.3 = Manganese mg/L 0.214 = 0.461 = 0.469 = 2.08 = * 0.854 = 2.44 = * 7.08 = * Nickel mg/L 0.0223 = 0.0724 = 0.0735 = 0.0193 = 0.0133 = 0.01 = 0.136 = * Potassium mg/L 3.93 = 2.46 = 2.44 = 2.67 = 1.29 = 3.89 = 3.27 = Selenium mg/L 0.00041 U 0.00041 U 0.00041 U 0.00041 U 0.00041 U 0.00041 U 0.00047 J * Sodium mg/L 2.39 = 19.2 = 19.4 = 4.01 = 0.915 = 7.14 = 4.99 = Zinc mg/L 0.0399 J 0.179 J * 0.187 J * 0.0227 J 0.115 J * 0.0402 J 0.781 J *
Semivolatile Organics Bis(2-ethylhexyl)phthalate mg/L 0.022 = 0.004 J 0.0033 J 0.0033 J 0.0031 J 0.015 = 0.0095 J Di-n-butyl phthalate mg/L 0.002 J 0.0015 J 0.0015 J 0.002 J 0.012 U 0.0015 J 0.0017 J
ID = Identifier. RI = Remedial investigation. RQL = Ramsdell Quarry Landfill Qualifiers:
* = Value above facility-wide background criterion. = = Analyte present and concentration accurate. J = Estimated value less than reporting limits. U = Non-detect.

04-202(E)/031705 3-6
It was noted that several wells exhibited low pH readings during the May 2004 sampling event (e.g., RQLmw-012 had a pH value of 3.95 and RQLmw-017 had pH values of 3.13 to 3.68). The reason for this is not known. In the December 2003 (baseline) sampling, RQLmw-012 and -013 both had low pH readings (3.8 to 3.9 range), while the pH for RQLmw-017 was slightly acidic to normal (5 to 6.13 range).

04-202(E)/031705 4-1
4.0 REFERENCES
USACE (U. S. Army Corps of Engineers) 1996. Preliminary Assessment for the Ravenna Army Ammunition Plant, Ravenna, Ohio, DACA62-94-D-0029, D.O. 0009, Final, February.
USACE (U. S. Army Corps of Engineers) 1999. Initial Phase Report on the Groundwater Investigation, Ramsdell Quarry Landfill, Ravenna Army Ammunition Plant, Ravenna, Ohio, DACA27-97-D-0025, D.O. 003, Final, January.
USACE (U. S. Army Corps of Engineers) 2000. Final Phase Report on the Groundwater Investigation of the Ramsdell Quarry Landfill, Ravenna Army Ammunition Plant, Ravenna, Ohio, DACA27-97-D-0025, D.O. 003, August.
USACE (U. S. Army Corps of Engineers) 2001. Facility-Wide Sampling and Analysis Plan for the Ravenna Army Ammunition Plant, Ravenna, Ohio, DACA62-00-D-0001, D.O. CY02, Final, March.
USACE (U. S. Army Corps of Engineers) 2004. Phase I Remedial Investigation Report for Ramsdell Quarry Landfill at the Ravenna Army Ammunition Plant, F44650-D-99-0007, D.O. CY11, Ravenna, Ohio, August.
04-202(E)/031705 4-2
THIS PAGE INTENTIONALLY LEFT BLANK

04-202(E)/031705
APPENDIX A
GROUNDWATER SAMPLING LOGS

04-202(E)/031705
THIS PAGE INTENTIONALLY LEFT BLANK


A-4

A-5

A-6

A-7

A-8
A-9

A-10
A-11

A-12

A-13

A-14

A-15

A-16

A-17

A-18
A-19

A-20

A-21

THIS PAGE INTENTIONALLY LEFT BLANK.
A-22

04-202(E)/092304
APPENDIX B
ANALYTICAL LABORATORY DATA TABLES

04-202(E)/092304
THIS PAGE INTENTIONALLY LEFT BLANK

04-202(E)/092304
Baseline Sampling Event
December 2003

04-202(E)/092304
THIS PAGE INTENTIONALLY LEFT BLANK

B-5
B-6

B-7

B-8

B-9

B-10
B-11

B-12
B-13

B-14

B-15
B-16

B-17

B-18

B-19
B-20

B-21
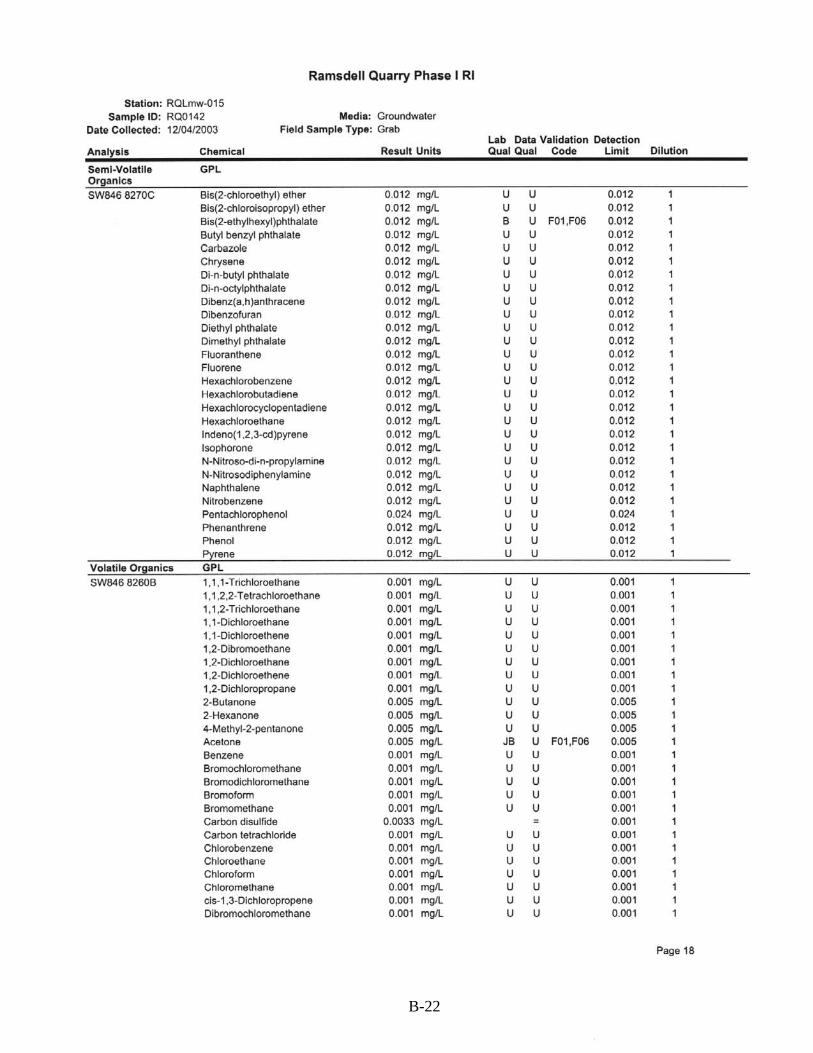
B-22

B-23

B-24
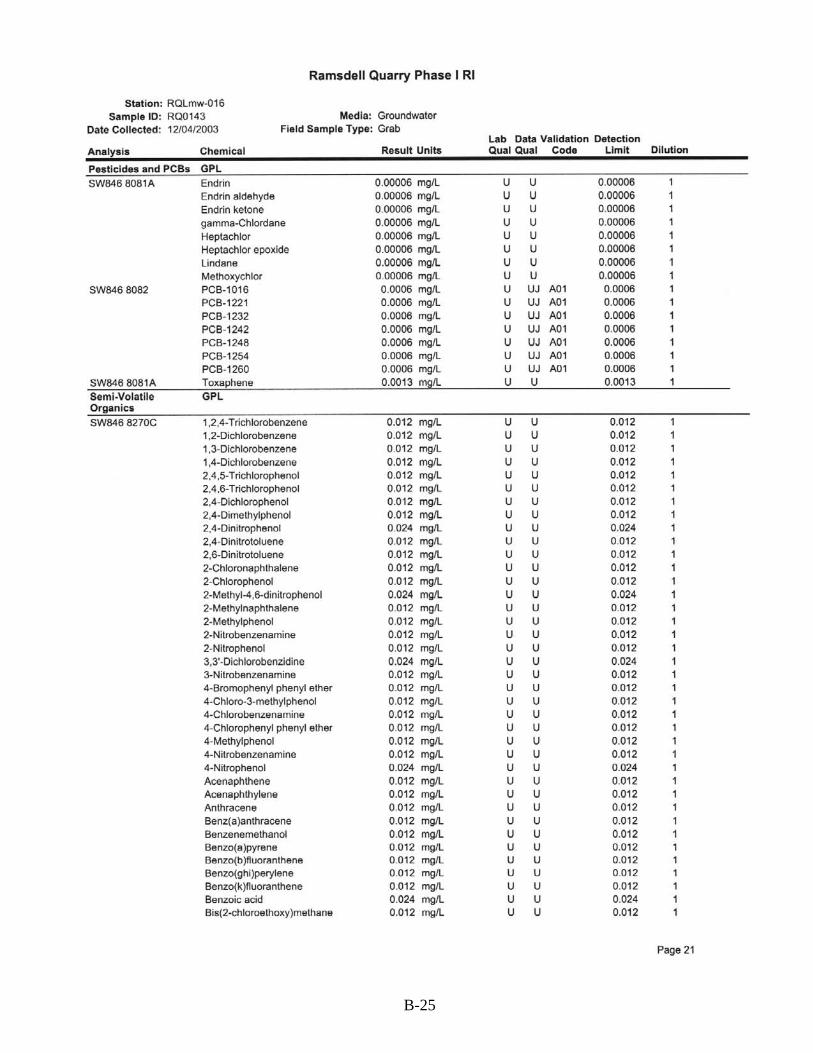
B-25

B-26
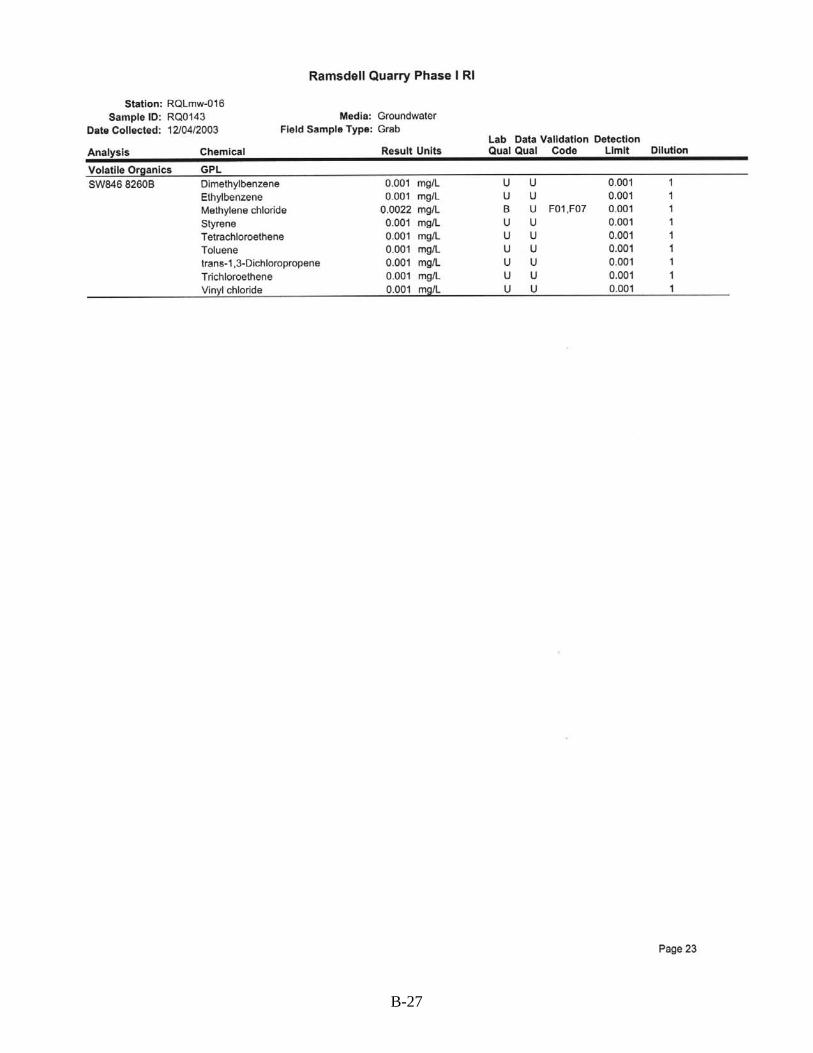
B-27

B-28

B-29

B-30

B-31

04-202(E)/031705 B-32
THIS PAGE INTENTIONALLY LEFT BLANK

04-202(E)/031705
Second Sampling Event
May 2004

04-202(E)/031705
THIS PAGE INTENTIONALLY LEFT BLANK
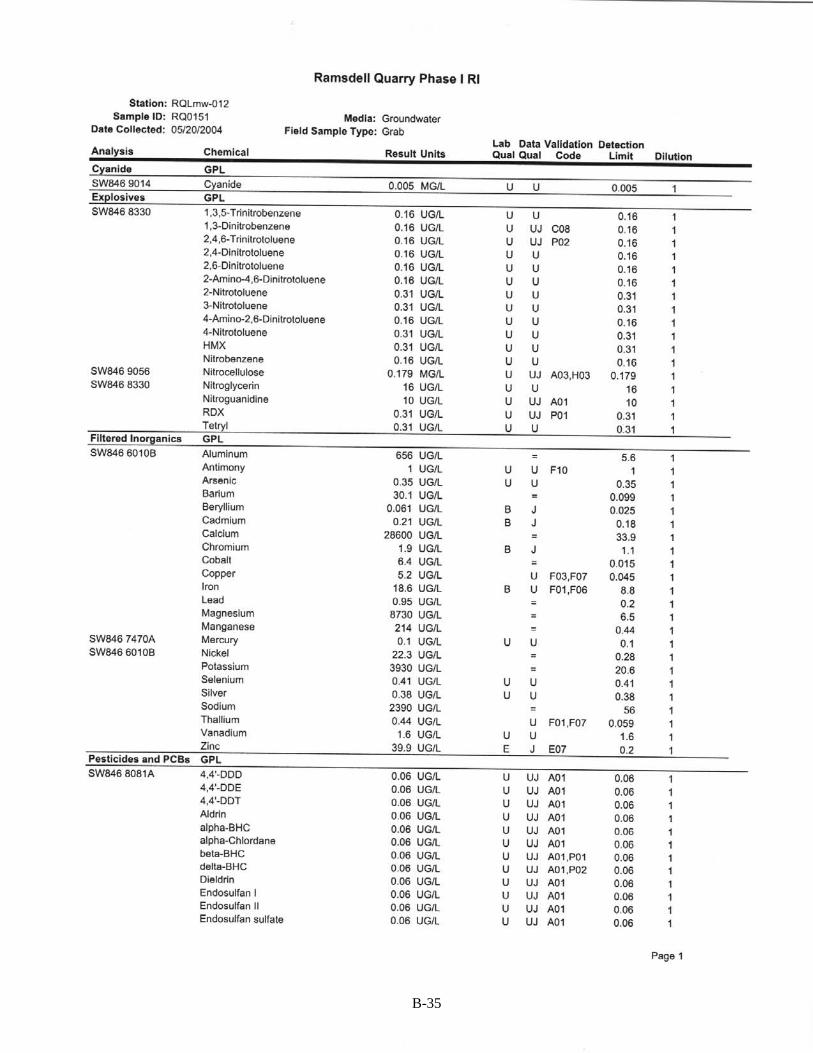
B-35

B-36

B-37

B-38

B-39
B-40

B-41

B-42

B-43

B-44

B-45

B-46
B-47

B-48

B-49
B-50

B-51
B-52

B-53
B-54

B-55

B-56

B-57

B-58

B-59

B-60

B-61

B-6
2

B-6
3

04-202(E)/031705 B-64
THIS PAGE INTENTIONALLY LEFT BLANK

Comment Responses for Final Phase I Remedial Investigation May 2004 Follow-On Groundwater Sampling at the Ramsdell Quarry Landfill at the Ravenna Army Ammunition Plant, Ravenna, Ohio
Comment Response Table Rev. 3/16/05
Page 1 of 3 04-202(E)/031705
Comment Number
Page or Sheet Comment Recommendation Response
Ohio EPA DDAGW (C. McCambridge, T. Fisher)
1. Section 3.1, Table 3-1, Figure 3-1, pg. 3-2
Issue 1: There is a discrepancy between the ground water elevations for RQLmw-017 in Table 3-1 (967.94) and Figure 3-1 (967.99). Issue 2: Most of the ground water sampling logs found in Appendix A did not contain ground water elevations for sampled wells (i.e., samples RQ0153, RQ0151, sample #? From RQLmw-017).
Issue 3: Figure 3.1 does not contain arrows illustrating the inferred ground water flow direction. Only surface drainage direction arrows have been added.
Issue 4: The text does not state whether ground water elevations were measured before purging or sampling.
Issue 1: Please correct the discrepancy.
Issue 2: Please provide the field data sheets detailing ground water elevation information on wells which samples were collected from.
Issue 3: Add arrows to illustrate the inferred ground water flow direction.
Issue 4: Please provide additional details concerning this issue.
Issue 1: Agree. 967.94 is correct. The figure has been revised to correct the typo.
Issue 2: Clarification. Contemporaneous water level elevations were recorded on May 19, 2004, prior to any sampling in the Field Manager’s logbook rather than in the sampling logbook. As part of the QA process, additional details have been added and the sheet included. Steps have been taken to ensure that the information is recorded in the correct location in future field efforts. Issue 3: Agree. Arrows showing inferred groundwater flow direction have been added to this figure. Issue 4: Agree. The text states that, “Groundwater samples were collected from each of the six Phase I RI monitoring wells following AOC-wide water-level measurements.” However, additional text has been added to Chapter 3.0 to make this clearer to the reader.

Comment Responses for Final Phase I Remedial Investigation May 2004 Follow-On Groundwater Sampling at the Ramsdell Quarry Landfill at the Ravenna Army Ammunition Plant, Ravenna, Ohio
Comment Response Table Rev. 3/16/05
Page 2 of 3 04-202(E)/031705
Comment Number
Page or Sheet Comment Recommendation Response
2. Section 3.3, Table 3.2, pg. 3-4
This table indicates that the summary statistics were only compared with site background criteria. This data was not compared with MCLs
Revise this table to ensure that MCLs are listed in addition to site background criteria.
Clarification. Table 3.2 compares results to both site background and PRGs; however, columns comparing the results to MCLs (primary and secondary) have been added as requested.
3. Section 3.3, Table 3-3, pg. 3-5.
Table 3-3 provided no explanation for the various symbols (=, *, U, and J) used as data qualifiers
Provide an explanation of the symbols used in Table 3-3 for clarification.
Agree. Footnotes defining the symbols used as data qualifiers have been added to the table.
4. Appendix A Well Sampling Logs
Issue 1: Water table elevations were not recorded on the field data sheets that are included in the submittal.
Issue 1: Please provide the field data sheets recording the water table elevations for this sampling event (May 2004)
Issue 1: See response to Comment 1, Issue 2.
Issue 2: During the Phase I groundwater sampling activities, final turbidity readings of > 5 NTUs were noted on the sampling logs of the following monitoring well locations: RQLmw-013, RQLmw-014, RQLmw-015, RQLmw-016, and RQLmw-017. The reasons for these elevated turbidity readings are not discussed or explained in the submittal.
Issue 2: Provide a discussion concerning the measurement of turidity and the procedures that were implemented to obtain representative groundwater samples
Issue 2: Clarification. These wells were developed in accordance with work plan specifications to obtain the lowest turbidity readings possible. Micropurge sampling methods were employed for wells where possible (recharge rates were too slow at RQLmw-015, -016, and -017). Despite these measures, turbidity levels remained above 5 NTUs in most wells. Accordingly, only filtered metals samples were obtained. Text has been added with this discussion.
Comment Responses for Final Phase I Remedial Investigation May 2004 Follow-On Groundwater Sampling at the Ramsdell Quarry Landfill at the Ravenna Army Ammunition Plant, Ravenna, Ohio
Comment Response Table Rev. 3/16/05
Page 3 of 3 04-202(E)/031705
Comment Number
Page or Sheet Comment Recommendation Response
Issue 3: On the well sampling sheet for RQLmw-017, pH values of 3.13 (initial reading) and 3.68 (final reading) were noted. A pH value of 3.95 was recorded during the purging activities of RQLmw-102. No explanation for these low pH readings was given in the text.
Issue 3: Were low pH values noted at this monitoring well location during prior sampling events? Please provide a discussion concerning these low pH readings from RQLmw-017.
Issue 3: Clarification. In December 2003, both RQLmw-012 and -013 had low pH readings (3.8 to 3.9), while RQLmw-017 was in the slightly acidic to normal (5 to 6 pH) range. The reason for this is not known. Text has been added to discuss this observation.
5. Appendix B The analytical results section does not contain the chain of custody forms for the May 2004 groundwater sampling event.
Please insert the completed chain of custody forms of the May 2004 sampling event in the revised document.
Agree. COCs have been added.