ou2 supplemental remedial investigation workplan
TRANSCRIPT

DRAFT
Index Number CERCLA 02-2010-2017
OU2 SUPPLEMENTAL REMEDIAL INVESTIGATION WORKPLAN
SHIELDALLOY METALLURGICAL SITE NEWFIELD, NEW JERSEY
TRC Job No. 112434ES
DRAFT May 2011
Prepared by:
TRC Engineers, Inc. Center Square, 12th Floor, East Tower
1500 Market Street Philadelphia, PA 19102
R2-0000270

i
TABLE OF CONTENTS
Section No. Title Page No.
1.0 INTRODUCTION 1 1.1 Site Location and Description 2 1.1.1 Former Production Area 3 1.1.2 Former Lagoons Areas 3 1.1.3 Natural Resource Restoration Areas 4 1.1.4 Eastern Storage Areas 4 1.1.5 Southern Area 5 1.1.6 Restricted Area 5 1.2 Site History 5 1.3 Physical Setting 6 1.3.1 Site Drainage and Surface Water 6 1.3.2 Wetlands 7 1.3.3 Surficial Geology 7 1.3.4 Bedrock Geology 8 1.3.5 Local Hydrogeology 8 1.4 Summary of Environmental Activities 9 1.4.1 Soil 9 1.4.2 Surface Water 10 1.4.3 Sediment 10 1.5 Objectives 11 1.6 Preliminary Identification of ARARs and TBC Information 11 1.6.1 Potential Federal Chemical-Specific ARARs/TBCs 12 1.6.2 Potential State Chemical-Specific ARARs/TBCs 13 2.0 SUMMARY OF AVAILABLE OU2 DATA 14 2.1 Soil Data 14 2.1.1 Former Production Area 15
2.1.1.1 VOCs 15 2.1.1.2 Semi-VOCs 15 2.1.1.3 Pesticides/PCBs 15 2.1.1.4 Metals 15 2.1.1.5 Data Summary 16
2.1.1.6 Data Gaps 16 2.1.2 Former Lagoons Area 17
2.1.2.1 VOCs 17 2.1.2.2 Semi-VOCs 17 2.1.2.3 Pesticides/PCBs 17 2.1.2.4 Metals 17 2.1.2.5 Data Summary 17
2.1.2.6 Data Gaps 17 2.1.3 Eastern Storage Areas 18
R2-0000271
ii
2.1.3.1 VOCs 18 2.1.3.2 Semi-VOCs 18 2.1.3.3 Pesticides/PCBs 18 2.1.3.4 Metals 18 2.1.3.5 Data Summary 18
2.1.3.6 Data Gaps 18 2.1.4 Southern Area 19
2.1.4.1 VOCs 19 2.1.4.2 Semi-VOCs 19 2.1.4.3 Pesticides/PCBs 19 2.1.4.4 Metals 19 2.1.4.5 Data Summary 19
2.1.4.6 Data Gaps 19 2.1.5 Facility Wide Soil Data Summary 20 2.1.5.1 Facility Wide Results and COPCs 20 2.1.5.2 Data Gaps 20 2.2 Surface Water Data 21 2.2.1 Hudson Branch 21
2.2.1.1 VOCs 21 2.2.1.2 Semi-VOCs 21 2.2.1.3 Pesticides/PCBs 21 2.2.1.4 Metals 22 2.2.1.5 Data Summary 22
2.2.1.6 Data Gaps 23 2.2.2 Burnt Mill Pond 23
2.2.2.1 VOCs 23 2.2.2.2 Semi-VOCs 23 2.2.2.3 Pesticides/PCBs 23 2.2.2.4 Metals 23 2.2.2.5 Data Summary 23
2.2.2.6 Data Gaps 24 2.2.3 Burnt Mill Branch 24
2.2.3.1 VOCs 24 2.2.3.2 Semi-VOCs 24 2.2.3.3 Pesticides/PCBs 24 2.2.3.4 Metals 24 2.2.3.5 Data Summary 24
2.2.3.6 Data Gaps 24 2.3 Sediment Data 25 2.3.1 Hudson Branch 25
2.3.1.1 VOCs 25 2.3.1.2 Semi-VOCs 25 2.3.1.3 Pesticides/PCBs 25 2.3.1.4 Metals 26 2.3.1.5 Data Summary 26
2.3.1.6 Data Gaps 26
R2-0000272
iii
2.3.2 Burnt Mill Pond 27 2.3.2.1 VOCs 27 2.3.2.2 Semi-VOCs 27 2.3.2.3 Pesticides/PCBs 27 2.3.2.4 Metals 27 2.3.2.5 Data Summary 27
2.3.2.6 Data Gaps 28 2.3.3 Burnt Mill Branch 28
2.3.3.1 VOCs 28 2.3.3.2 Semi-VOCs 28 2.3.3.3 Pesticides/PCBs 28 2.3.3.4 Metals 28 2.3.3.5 Data Summary 28
2.3.3.6 Data Gaps 29 3.0 SUPPLEMENTAL OU2 RI ACTIVITIES 30 3.1 Supplemental OU2 RI Overview 30 3.2 Mobilization and Demobilization 30 3.3 Site Survey 32 3.4 Soil Sampling 32 3.4.1 Proposed Soil Sample Locations and Frequency 32 3.4.1.1 Former Production Area 32 3.4.1.2 Former Lagoons Area 33 3.4.1.3 Eastern Storage Areas 33 3.4.1.4 Southern Area 34 3.4.1.5 Background Soil Samples 34 3.4.2 Soil Sampling Equipment and Procedures 34 3.4.2.1 Surface Soil Sampling 35 3.4.2.2 Subsurface Soil Sampling 36 3.5 Surface Water Sampling 39 3.5.1 Proposed Surface Water Sample Locations and Frequency 40 3.5.1.1 Hudson Branch 40 3.5.1.2 Burnt Mill Pond 40 3.5.1.3 Burnt Mill Branch 40 3.5.2 Surface Water Sampling Equipment and Procedures 41 3.6 Sediment Sampling 41 3.6.1 Proposed Sediment Sample Locations and Frequency 41 3.6.1.1 Hudson Branch 42 3.6.1.2 Burnt Mill Pond 42 3.6.1.3 Burnt Mill Branch 43 3.6.2 Sediment Sampling Equipment and Procedures 43 3.7 Sampling Handling and Custody Requirements 44 3.8 Reporting Requirements 45 3.9 Decontamination 46 3.10 Field Equipment Calibration 47 3.11 Investigation-Derived Waste 47
R2-0000273

iv
3.12 Schedule 48 4.0 PROJECT ORGANIZATION AND RESPONSIBILITIES 49 5.0 PERMIT IDENTIFICATION AND PERMIT APPLICATIONS 52 6.0 REFERENCES 54
R2-0000274

v
LIST OF FIGURES Figure No. Title
1 Site Location Map
2 Site Plan
3 VOCs Soil Sample Results
4 Semi-VOCs Soil Sample Results
5 Pesticide/PCBs Soil Sample Results
6 Metals (Except Hexavalent Chromium and Vanadium) Soil Sample Results
7 Hexavalent Chromium Soil Sample Results
8 Vanadium Soil Sampling Results
9 Former Lagoons Area – Hexavalent Chromium Post-Excavation Soil Sampling Results
10 Metals Soil Sample Results, Along Hudson Branch
11 Surface Water Sample Results
12 Organics Sediment Sampling Results
13 Metal Sediment Sampling Results
14 Chromium Concentrations in Sediments along Hudson Branch
15 Proposed Soil Sample Locations
16 Proposed Background Soil Sample Locations
17 Proposed Surface Water and Sediment Sample Locations
18 Project Schedule
LIST OF TABLES
Table No. Title
1 Potential Federal and State Chemical-Specific ARARs and TBC Criteria
2 Number of Soil Samples Collected by Area
3 Number of Surface Water Samples Collected by Area
4 Number of Sediment Samples Collected by Area
5 Proposed Soil Samples
6 Master Sampling and Analysis Summary
7 Proposed Surface Water and Sediment Samples
R2-0000275

vi
LIST OF APPENDICES
Appendix Title
A Soil Sampling Protocols – Flow Diagrams A – 1 Flow Diagram - Surface Soil Sampling Protocol A – 2 Flow Diagram – Subsurface Soil Sampling Protocol A – 3 Flow Diagram – Sediment/Soil Sampling Protocol
R2-0000276

TRC Job No. 2710 Wip/R/OU2 SUPPLEMENTAL RI WORKPLAN
1
Index Number CERCLA 02-2010-2017
OU2 SUPPLEMENTAL REMEDIAL INVESTIGATION WORKPLAN
SHIELDALLOY METALLURGICAL SITE NEWFIELD, NEW JERSEY
1.0 INTRODUCTION TRC Engineers, Inc. (TRC), has prepared this Operable Unit 2 (OU2) SUPPLEMENTAL REMEDIAL INVESTIGATION (RI) WORKPLAN for the Shieldalloy Metallurgical Site (SMC Site), located in Newfield, New Jersey (Figure 1). TRC and SMC executed the Administrative Order on Consent (AOC) for the Site with the U.S. Environmental Protection Agency (USEPA) on April 28, 2010. The AOC defined the following OUs:
OU1-Non-Perchlorate Ground Water; OU2-Non-Perchlorate Soil, Sediment, and Surface Water; and OU3-Perchlorate, all media.
This OU2 SUPPLEMENTAL RI WORKPLAN satisfies Task I, Section F.2 of the AOC and Section III Task 1 of the AOC’s Scope of Work. OU1 and OU3 requirements are addressed in other documents. The purpose of this OU2 SUPPLEMENTAL RI WORKPLAN is to provide the characterization of the nature and extent of OU2 and allow development of the Revised OU2 Risk Assessment and Feasibility Study. The OU2 SUPPLEMENTAL RI WORKPLAN has been prepared in accordance with USEPA Region 2 Guidance for the Development of Quality Assurance Project Plans for Environmental Monitoring Projects (dated April 2004) and the most recent guidance in N.J.A.C. 7:26E Technical Requirements for Site Remediation and the New Jersey Department of Environmental Protection (NJDEP) Field Sampling Procedures Manual (2005). This OU2 SUPPLEMENTAL RI WORKPLAN is organized as follows:
Section 1 presents introductory and background information; Section 2 summarizes the extensive available OU2 data and identifies data gaps; Section 3 outlines proposed supplemental OU2 RI activities; Section 4 discusses project organization and responsibilities; Section 5 assesses potential RI permit needs; and, Section 6 presents references.
This OU2 SUPPLEMENTAL RI WORKPLAN includes this document as well as the following companion documents:
Quality Assurance/Quality Control Project Plan (QAPP); Health and Safety Plan (HASP);
R2-0000277

TRC Job No. 2710 Wip/R/OU2 SUPPLEMENTAL RI WORKPLAN
2
Memorandum on Exposure Scenarios and Assumption with the Revised Conceptual Site Model (CSM); and
Revised Ecological Risk Report.
1.1 Site Location and Description The Site is located at 35 South West Boulevard, primarily in the Borough of Newfield, Gloucester County, New Jersey. A small portion of the southwest corner of the site is located in the City of Vineland, Cumberland County, New Jersey. A site location map is provided on Figure 1. The SMC Facility comprises approximately 67.7 acres. The approximate center of the Facility is located at latitude 3932’27.6”N, longitude 7501’06.7”W. SMC also owns an additional 19.8 acres of farmland, referred to as the “Farm Parcel”, located in Vineland, approximately 2,000 feet southwest of the facility. SMC purchased the Farm Parcel to facilitate the groundwater remediation, which includes a pumping well at this location. This Farm Parcel has never been used for manufacturing or related activities. Specialty glass manufacturing began at the Site in the early 1900s. SMC manufactured specialty metals at the Site from 1955 to approximately 2007. The Site is currently used as office space and is sublet as warehousing and construction equipment storage space. The Site is bordered as follows:
To the north by a former rail spur and a former landfill; To the west by Conrail rail lines, West Boulevard, and various light industries and
residences; To the east by a wooded area, residences and small businesses; and To the south by Hudson Branch stream, its associated wetlands/headwaters, and residences
(located along Weymouth Road). The Site is secured by a perimeter chain link fence. The facility parking lot along the western property boundary lies outside of the chain link fence to allow visitor and administrative access. To understand the nature of the Facility, and to assist in the characterization, it is helpful to understand certain sections of the Site, defined by the facility’s historic operations, current land cover, and potential future uses. The Site consists of six key areas, namely:
Former Production Area, Former Lagoons Area, Eastern Storage Areas, Southern Area, Natural Resource Restoration Areas, and Restricted Area.
A description of the key areas is provided below. A plan depicting the boundaries of these areas and the physical features of the facility areas is provided as Figure 2.
R2-0000278

TRC Job No. 2710 Wip/R/OU2 SUPPLEMENTAL RI WORKPLAN
3
1.1.1 Former Production Area The Former Production Area is located in the northwest part of the Facility and is the area where the majority of former manufacturing activities occurred. The Former Production Area is approximately 22 acres, and is the largest key area. The Former Production Area is largely covered with buildings and asphalt or concrete pavement. SMC uses one of the buildings as offices (D202). Current buildings used for storage include D117, D201, D203(D), and D203(E). Building D203(B) is used as a break room. Building D204 is a former scale house, and building D203(C) houses a plumbing backflow preventer. Vacant buildings include D110, D116(D), and D115. Building D203(F) is currently leased to the Borough of Newfield for storage of municipal vehicles. Building D203(A) is currently leased to a construction company (KB Construction). Building D116(A) is currently leased to the Borough of Newfield Public Works. TRC uses Building D216 for the Wastewater Treatment Facility component of the OU1 pump and treat system. A Former Manpro-Vibra Degreasing Unit existed in the Former Production Area in former building D109; it was in periodic service for approximately 2 years (1965-1967). After 1967, the system’s operation was discontinued and the entire system was removed from the Site. Trichloroethene (TCE) was the primary degreasing chemical used in the unit. SMC’s future plans for the Former Production Area include the continued use of the buildings for warehousing and construction equipment storage space (or replacement/repair thereof). 1.1.2 Former Lagoons Area The Former Lagoons Area is located in the central portion of the Facility and occupies approximately 4.5 acres. The Former Lagoons Area includes closed lagoons that were used from the 1960s to the 1990s for wastewater treatment. During the 1960s, SMC used one unlined lagoon to hold untreated wastewaters at the location of former lined lagoons B-1, B-2, B-3, B-5, B-6, B-7, B-8, B-11 and B-12 (see Figure 2). In 1971, this one unlined lagoon was closed and replaced by nine smaller, lined lagoons (B-1, B-2, B-3, B-5, B-6, B-7, B-8, B-11 and B-12) in which the wastewater was treated. In 1987, the wastewater treatment process was modified with aboveground tanks replacing some of the lagoons in the wastewater treatment process. In May 1992, use of all nine lagoons was discontinued. The nine lagoons were characterized, remediated, and closed from 1994 to 1997. The closure activities were conducted in accordance with the Closure Plan-Surface Impoundments B-1, B-2, B-3, B-5, B-11 and B-12 (TRC, 1995) submitted to the NJDEP in August 1995 and Closure Plan-Surface Impoundments B-6-B-7, and B-8 that was submitted to the NJDEP in July 1997. NJDEP previously provided SMC with authorization to initiate the remedial action in a letter dated June 17, 1997. Closure activities included sludge removal, liner removal, contaminated soil removal, post-excavation sampling, and backfilling. TRC prepared a Work Plan for the collection of supplemental soil samples in the area of the former lagoons which was submitted to the NJDEP on October 3, 2000. The Work Plan was approved on November 6, 2000. TRC performed and documented the prescribed sampling. Certain soil samples collected were below the water table (the saturated
R2-0000279

TRC Job No. 2710 Wip/R/OU2 SUPPLEMENTAL RI WORKPLAN
4
portions are now considered part of the OU1 investigation and remediation). In a letter dated August 10, 2001, the NJDEP approved the lagoons closure report and concluded that limited residual hexavalent chromium concentration in soils do not appear to represent a continued source of groundwater contamination (NJDEP, 2001). Two additional lined basins (B-9 and B-10) were located to the west of the former lagoons. These lined basins were used to contain wastewater associated with an air pollution control process. SMC stopped using the basins in early 1990s. In December 1992, the soils below the basins and the adjacent berm soils were sampled per NJDEP requirements. The analytical results indicated that past activities did not impact the surrounding soils. The lined basins were closed in 1993 and the berm soils were used to backfill the former basins. Currently, the Former Lagoons Area is covered by light vegetation, which includes small trees and grass. SMC is considering a Brownfields/Brightfields approach for the Site, and is considering the Former Lagoons Area as the area to potentially receive a solar field. If viable, solar arrays would be placed in this area, after warranted remedial measures have been implemented. 1.1.3 Natural Resource Restoration Areas Natural Resource Restoration Areas were constructed in 1999 and 2000 at designated portions of the facility to provide habitat value. These Natural Resource Restoration Areas were based on a Natural Resource Restoration Plan was prepared in October 1997 in accordance with the terms of USEPA and NJDEP Environmental Settlement Agreement (ESA), which was incorporated into SMC’s plan of reorganization pursuant to Chapter 11 of the Bankruptcy Code (US Bankruptcy Court, 1997). In November 1997, the Office of Natural Resource Damage (ONRD) reviewed and approved the Natural Resource Restoration Plan. The Natural Resource Restoration Areas cover totals approximately 9.65 acres, located in a non-contiguous collection of areas around the Facility, generally focused on the eastern and southern portions. These areas were established by importing soil (generally a minimum of 1’ thick, but as much as 2’ thick), then establishing vegetation. Vegetation includes a variety of grass, flowers, trees, and bushes. In addition to providing natural resource value, these areas were intended as a cap to address potential soil contamination at these locations. To ensure the planted areas are maintained as vegetated areas, the future use of the planted areas is considered restricted. As such, the nature of these areas cannot be changed, without significant regulatory changes. 1.1.4 Eastern Storage Areas The Eastern Storage Areas, which consist of two separate areas bounding the Restricted Area, are located to the east of the Former Production Area and Former Lagoons Area. These areas were previously used as the By-Product Drum Storage Area and a bone yard. These areas have never included buildings or offices. Currently, the areas are covered with gravel, light vegetation and piles of concrete debris. Most of these areas were developed and included with the Natural Resource Restoration Tree Planting Area, which is discussed in Section 1.1.3.
R2-0000280

TRC Job No. 2710 Wip/R/OU2 SUPPLEMENTAL RI WORKPLAN
5
SMC is considering this area for potential solar installation, or possibly continued use as storage. 1.1.5 Southern Area The Southern Area is located along the southern property line of the Facility. The Southern Area includes undeveloped areas, the on-site impoundment, the Former Thermal Pond Area, and the Pansy Field. The on-site impoundment, as referenced in the current New Jersey Pollutant Discharge Elimination System (NJPDES) permit, receives a combination of facility stormwater and treated water from the on-site groundwater treatment system. The water from the on-site impoundment is directed into a ditch or unnamed tributary of the Hudson Branch. The on-site impoundment was installed in the early 2000s. The Former Thermal Pond Area covers approximately 0.77 acres and consists of a rectangular depression area of approximately 3 feet deep. The Former Thermal Pond Area was used on a few occasions as an emergency holding reservoir for treated wastewater. The Former Thermal Pond Area is currently covered with vegetation (grass and small trees). The Pansy Field covers an area of approximately 2.2 acres and was previously used by local farmers to grow pansies. The Former Pansy Field is included with the Natural Resource Restoration Tree Planting Area, which is discussed in Section 1.1.3. Based on historical aerial photographs, some areas in the Southern Area were used for miscellaneous storage. Currently, the Southern Area is covered with vegetation that includes grass and small trees. Several areas were developed and included with the Natural Resource Restoration Tree Planting Area; these areas are shown on Figure 2. Wetlands also exist along the property line to the south. Because of the nature of this area, its proximity to ditches and wetlands, and its non-contiguous nature, SMC is currently planning on no change for future site use. 1.1.6 Restricted Area The Restricted Area is located in the eastern portion of the facility and is referred as a controlled area by the Nuclear Regulatory Commission (NRC). Due to the presence of naturally occurring thorium and uranium in the raw material used for ferro-columbium and the resulting slag and dust, this portion of the Facility is restricted. A chain link fence with barbed wire surrounds this area (providing a second layer of security from the facilities perimeter fence). Additionally, the Restricted Area is posted with specific signage. Site personnel are trained to stay out of this area, unless specific training and/or escort is provided. The Restricted Area is not the subject of the AOC and/or this OU2 SUPPLEMENTAL RI WORKPLAN. 1.2 Site History
Specialty glass manufacturing began at the Site in 1924. SMC purchased the Site in the early 1950s
R2-0000281

TRC Job No. 2710 Wip/R/OU2 SUPPLEMENTAL RI WORKPLAN
6
and, from 1955 to approximately 2007, SMC manufactured specialty steel and super alloy additives, primary aluminum master alloys, metal carbides, powdered metals and optical surfacing products at the Site. Raw materials used at the Site included ores which contain oxides of columbium (niobium), vanadium, aluminum metal, titanium metal, strontium metal, zirconium metal, and fluoride (titanium and boron) salts. SMC made various forms of vanadium in the 1980s and mid-1990s. Vanadium-related production generally occurred in Building D111. The raw material was in the form of an ash, and was transported to the Facility via a variety of containers (e.g., sacks, drums, truck loads). The raw material was stored in the 3-sided “pole building” east of Building D111. 1.3 Physical Setting The referenced property is located within the Newfield, New Jersey 7.5' United States Geological Survey (USGS) Quadrangle (Figure 1). 1.3.1 Site Drainage and Surface Water The topography of the Site is relatively flat. The Site is located on a slight topographic high, with the ground surface at the Site generally sloping to the west-southwest, toward the Hudson Branch stream. Within the SMC Facility, drainage from developed portions of the Facility is managed via a storm drain system and through overland flow. Most of the drainage from the developed portion of the SMC Facility is directed to the on-site impoundment located in the southwestern portion of the Facility. The drainage from the employee parking lot area (west portion of the Site) is discharged into a ditch near the western boundary of the Facility. Stormwater drainage in the eastern undeveloped area of the Site is generally via sheet flow. In the restricted area, the surface runoff is controlled with berms located to the south and inside the fence. Historically, the Site had three permitted discharge water outfalls to the Hudson Branch. Following the closure of on-site lagoon features and subsequent to the preparation of the Draft FS Report, the outfalls were revised to reflect current discharge conditions at the Site. Currently, there are two permitted outfalls (DSN004A and DSN001B). DSN004A is located at the southwest corner of the on-site impoundment in the southwest portion of the SMC Facility. DSN004A receives a combination of facility stormwater and treated water from the on-site groundwater treatment system. When on-site operations were more extensive, non-contact cooling water was also discharged at this location. Flows from DSN004A are recorded at an H-flume located at the outfall. DSN001B is located at the northwest corner of the on-site impoundment, and is the “tailpipe” of the pump and treat system. The treated groundwater pump and treat system discharge is monitored separately from the discharge at an internal monitoring point for the treatment system referred to within the NJPDES permit as DSN001B.
R2-0000282

TRC Job No. 2710 Wip/R/OU2 SUPPLEMENTAL RI WORKPLAN
7
The most notable surface water body proximate to the Site is the Hudson Branch. The Hudson Branch originates just to the east of the Site and runs generally along the Facility’s southern border. Based on numerous site inspections, the Hudson Branch (near the Facility) is relatively dry during most periods of the year. The upstream drainage area of the Hudson Branch is estimated at 1,180 acres (TRC, 2006). Runoff enters the Hudson Branch via overland flow and a number of culverts, including a north-south 36-inch diameter culvert that bisects the Site and conveys stormwater from areas of Newfield north of the Site to Hudson Branch. A broader area, approximately 1.4 acres in size, is located within this reach of the Hudson Branch, immediately south of SMC’s former thermal cooling pond (see Figure 2). The channel of the Hudson Branch along the southern boundary of the Site varies in size; its width ranges from as little as a few feet at many locations to 100 feet wide at the broader area. The water depth in this portion of Hudson Branch ranges from zero feet (during dry periods) to approximately 3 feet deep. Downstream of the SMC Facility, the Hudson Branch flows southwesterly, under South West Blvd. and Weymouth Road (via culverts) then through the Farm Parcel, discharging into Burnt Mill Pond, located approximately 6,500 feet southwest of the SMC Facility. Burnt Mill Pond has a surface area of approximately 15 acres in size and is impounded by a dam. Burnt Mill Pond is reported to be shallow, with a mean depth of 2.4 feet. Burnt Mill Branch (sometimes referred to as the Manaway Branch) generally runs north to south and discharges into Burnt Mill Pond. Burnt Mill Branch is located approximately 4,000 feet west of the Site. The headwaters of Burnt Mill Branch begin approximately 7,000 feet northwest of the Site. The Burnt Mill Branch continues from Burnt Mill Pond, joining the Maurice River approximately 9,000 feet southwest of Burnt Mill Pond. 1.3.2 Wetlands Wetlands were delineated along the Hudson Branch in the vicinity of the Site in 1994 by Schoor, DePalma & Canger Environmental Services, Inc., under contract to TRC (Schoor DePalma, 1994). The delineation covered an approximately 100-acre area, which included the Site and the Hudson Branch from the headwaters to the location of the RIW2 pumping center at the Farm Parcel. Multiple wetland habitats are present adjacent to the Hudson Branch including the following palustrine wetland types: emergent marsh, broad-leaved deciduous forest, scrub-shrub, and open water. The width of the wetlands ranges from approximately 5 feet (along the generally dry portion of Hudson Branch along the Facility boundary) to over 400 feet (near the southwest corner of the Facility). A wetland cover survey was conducted in 1996 by TRC and included the identification and subsequent field survey of the stream center line (thalweg) and limits of each wetland cover type (including the upland/wetland boundary) at 250-foot intervals along the Hudson Branch (TRC, 1996a). 1.3.3 Surficial Geology Three surficial geologic units underlie the Site, which include the Bridgeton Formation, Cohansey Sand Formation, and the Kirkwood Formation. The Bridgeton Formation consists of up to 28 feet of brown sand and overlies the Cohansey Sand Formation which is comprised of coarse sands and little silt in the upper 40 feet with generally finer sand and some clay and silt lenses in the lower 60-80
R2-0000283
TRC Job No. 2710 Wip/R/OU2 SUPPLEMENTAL RI WORKPLAN
8
feet. Discontinuous silt and clay up to 6 feet in thickness were encountered within the lower Cohansey Sand Formation. The Kirkwood Formation, predominantly a vertically confining gray clay and silt layer, was encountered between 121 to153 feet below grade, underlying the Cohansey Sand Formation. The thickness of the unsaturated soils at the Site ranges from a few feet (near the Hudson Branch) to 17 feet (in the northwest part of the Site). The surface soils and subsurface soils referred in this OU2 SUPPLEMENTAL RI WORKPLAN include the unsaturated soils (vadose zone). Saturated soils below the vadose zone are considered a component of OU1. 1.3.4 Bedrock Geology Based on the average degree of dip for overburden in the Newfield area, it is estimated that the depth to bedrock beneath the Site to be approximately 2,000 feet below grade. Bedrock has not been encountered at the Site during previous investigations. Bedrock beneath the Site consists of banded, micaceous schists or gneiss within the Wissahickon Formation of Precambrian age. The Wissahickon Formation contains mica, quartz, feldspar, and chlorite with numerous fractures, joints, and folding of individual layers. The formation outcrops northwest of Gloucester County. 1.3.5 Local Hydrogeology The principal aquifer in the vicinity of the Site is the Cohansey Sand, which is approximately 130 feet thick. The Cohansey Sand is underlain by the Kirkwood Formation. The upper portion of the Kirkwood Formation is composed of silt and clay, which functions as a confining unit in the vicinity of the Site, restricting the downward flow of groundwater from the Cohansey Sand. Depths to groundwater across the Site range from surface grade at the Hudson Branch to 17 feet below ground in the northwest quadrant of the Site. Based on extensive investigations, groundwater was identified at depths ranging from 4 feet to 31 feet. Seasonal fluctuations in the water table elevations are on the order of a few feet. Groundwater flow direction in the Cohansey Sand is southwest, which closely matches general Site topography. The average linear on-site groundwater flow velocity in the shallow portion of the aquifer is about 2.9 ft/day (TRC, 2008). A downward hydraulic gradient has been observed in most on-site well clusters, which is consistent with groundwater pumping conditions at and downgradient of the Site.
TRC operates a groundwater pump and treat system, which consists of an electrochemical precipitation and air stripper, to contain and treat chromium and TCE. Five extraction wells, two on-site in the southwest corner of the manufacturing portion of the Site (i.e., W9 and Layne), two “Car Wash” wells (RW6S, RW6D), and one well at the Farm Parcel (RIW2), withdraw groundwater. On-site groundwater movement in the lower Cohansey Sand is influenced by the treatment system’s pumping wells. Other anthropogenic factors including sewer systems and other buried utilities may also affect local groundwater movement.
Approximately 62 groundwater monitoring wells located on the subject Site and on adjacent properties and roadside right-of-ways (ROWs) are utilized for continuous groundwater monitoring.
R2-0000284

TRC Job No. 2710 Wip/R/OU2 SUPPLEMENTAL RI WORKPLAN
9
1.4 Summary of Environmental Activities Environmental investigations at the Site began in 1972, after the discovery of hexavalent chromium in a well that triggered studies to evaluate the potential environmental impacts associated with SMC’s operations. Non-perchlorate groundwater (OU1) has been addressed by a pump and treatment system that has operated since 1979, and is still in operation. Consequently, the Site has an extensive site characterization history of groundwater, soil, sediment and surface water sampling, as well as remedial activities. The Statement of Work for OU2 Supplemental RI and FS (Task 1, Section C) requires that all existing soil, surface water, and sediment data for the Site be reviewed to identify possible data gaps or areas where data may be require updating. Based on a review of the existing data, contaminants of concern (COCs) for OU2 include metals and certain volatile organic compounds (VOCs). A summary of previous soil, surface water, and sediment environmental investigations conducted at the Site are provided below. The results and potential data gaps are discussed in Section 2.0. 1.4.1 Soil Surface and subsurface soil investigations were conducted between October 1990 and April 1991 to characterize the soils across the Site. The RI included the collection of 64 surface soil samples, 72 soil borings, and five test pits. The majority of the soil samples were analyzed for Target Analyte List (TAL) metals, boron, niobium, strontium, titanium, and hexavalent chromium. Selected samples were also analyzed for the Target Compound List (TCL) + 30 peaks and zirconium. The results of the RI were included in a Remedial Investigation Technical Report (TRC, 1992). Characterization of soils was conducted at Former Lined Basins B9 and B10 in December 1992. Eight samples were collected beneath the liners and four samples were collected from the berm materials. The soil samples were analyzed for TAL metals and fluoride. Two samples from the basins were also analyzed for TCL VOCs plus boron, niobium, strontium, titanium and zirconium. The field activities and analytical results were included in a letter report (TRC, 1993). A supplemental RI was conducted in August 1995 to delineate the extent of contamination observed during the 1991 RI. The supplemental RI included the collection of 40 surface soil samples and 52 subsurface soil samples. The samples were analyzed for those parameters that required delineation. The results of the supplemental RI were included with a Draft Final Feasibility Study Report (TRC, 1996a). On April 11, 1996, representatives of NJDEP, SMC, and TRC collected a total of 22 samples along the Hudson Branch. Seventeen of the 22 samples were classified as soil samples since they were collected at distances between 20 to 80 feet from the stream center. Five of the 22 samples were classified as sediment samples since they were collected from the middle of the stream or within a broad area of diffuse water flow. Samples were collected beginning at a point downstream of existing sampling station SD-23 and continuing upstream to a point near existing sediment sampling station SD-17 (located between West Boulevard and Weymouth Road). The soil samples were collected from a depth of 0 to 0.5 feet and analyzed for total chromium, vanadium, nickel and copper
R2-0000285

TRC Job No. 2710 Wip/R/OU2 SUPPLEMENTAL RI WORKPLAN
10
analysis. The results of the sampling were included in a letter report prepared by TRC and submitted to the NJDEP on May 3, 1996 (TRC, 1996b). Lagoon closure activities were conducted at the Site from 1994 to 1997 and included characterization, remediation, and closure of nine wastewater treatment lagoons. Post-excavation soil samples were collected from the base and sidewalls of the lagoons. All samples were analyzed for TAL metals and hexavalent chromium. In addition, two samples per lagoon were analyzed for TCL VOCs boron, niobium, strontium, titanium and zirconium. The closure activities and analytical results were summarized in a Closure Report (TRC, 1999). A supplemental soil sampling program was conducted in the Former Lagoons B6, B7, and B8 in November 2000. A total of 36 soil samples were collected from the base of the lagoons and analyzed for hexavalent chromium. The results of the investigation were provided in a Final Supplemental Soil Sampling Report, Former Lagoons B6, B7, and B8 (TRC, 2001a). A supplemental soil sampling program was conducted in the Former Lagoons B1, B2, B3, B5, B11 and B12 in November 2000. A total of 26 soil samples were collected from the base of the lagoons and analyzed for hexavalent chromium. The results of the investigation were provided in a Final Supplemental Soil Sampling Report, Former Lagoons B1, B2, B3, B5, B11 and B12 (TRC, 2001b).
1.4.2 Surface Water A total of five surface water samples were collected from the Hudson Branch in 1990 to determine the presence, nature and extent of surface water contamination. Three surface water samples were analyzed for TAL metals, hexavalent chromium, VOCs, sulfate, fluoride, and total cyanide. The remaining two samples were analyzed for TCL+30, TAL metals, hexavalent chromium, sulfate, cyanide, fluoride, boron, niobium, strontium, titanium, and zirconium. The results of the investigation were included in the Remedial Investigation Technical Report (TRC, 1992). A total of seven surface water samples were collected within the Hudson Branch, Burnt Mill Pond, and Burnt Mill Branch during the supplemental investigation conducted in 1995. The surface water samples were analyzed for TAL metals, hexavalent chromium, and total hardness. The results of the supplemental surface water investigation were summarized in the Draft Final Feasibility Study Report (TRC, 1996a). 1.4.3 Sediment A total of five stream sediment samples were collected from the Hudson Branch in 1990 to determine the presence, nature and extent of sediment contamination. Three sediment samples were analyzed for TAL metals, hexavalent chromium, VOCs, sulfate, fluoride, and total cyanide. The remaining two sediment samples were analyzed for TCL+30, TAL metals, hexavalent chromium, sulfate, cyanide, fluoride, boron, niobium, strontium, titanium, and zirconium. The results of the sediment investigation were included in the Remedial Investigation Technical Report (TRC, 1992). In August 1995, a total of 27 stations were selected within the Hudson Branch, Burnt Mill Pond, and Burnt Mill Branch to delineate the extent of metal contamination in sediments and define
R2-0000286

TRC Job No. 2710 Wip/R/OU2 SUPPLEMENTAL RI WORKPLAN
11
background conditions. The sediment samples were analyzed for TAL metals, hexavalent chromium, total organic carbon (TOC), grain size and pH. Selected sediment samples were also analyzed for TCL pesticides and polychlorinated biphenyls (PCBs). Following an initial review of the August 1995 supplemental sampling results, additional sediment characterization studies were conducted in September 1995. Eight sediment samples were collected for chemical, sediment bioassay and macrobenthic invertebrate bioassessment analyses. The sediment samples were analyzed for TAL inorganics, pH, total organic content, and acid volatile sulfide analysis. The sediment results were included in a Draft Final Feasibility Study Report (TRC, 1996a). On April 11, 1996, representatives of NJDEP, SMC, and TRC collected a total of five sediment samples along the Hudson Branch. The sediment samples were collected from the middle of the stream or within a broad area of diffuse water flow between existing sampling station SD-23 and existing sediment sampling station SD-17 (located between West Boulevard and Weymouth Road). The sediment samples were collected from a depth of 0 to 0.5 feet and analyzed for total chromium, vanadium, nickel and copper analysis. The results of the supplemental sediment sampling were included in a letter report prepared by TRC and submitted to the NJDEP on May 3, 1996 (TRC, 1996b). In March 2009, a total of 19 sediment samples were collected from 13 sampling stations where previous samples were obtained during the 1990 and 1995 sediment investigation to determine the current sediment quality. The sediment samples were analyzed for metals, pH, TOC, and grain size. Selected samples were analyzed for aquatic toxicity characteristics. The field activities and analytical results were summarized in a letter report (TRC, 2009). 1.5 Objectives This OU2 SUPPLEMENTAL RI WORKPLAN has been developed to accomplish the objectives established in the AOC. TRC has also identified additional goals to meet its plan for the accelerated characterization and remediation of the Site. This OU2 SUPPLEMENTAL RI WORKPLAN has been designed to meet the following goals:
Define the nature and extent of contamination in soil, sediment, and surface water; Develop a sufficient database to support the human health and ecological risk
assessments; Address identified data gaps; and Collect sufficient data to support the revised FS.
1.6 Preliminary Identification of ARARs and TBC Information As specified in the 1988 Guidance (USEPA, 1988), the preliminary identification of Applicable or Relevant and Appropriate Requirements (ARARs) and To Be Considered information (TBCs) can assist in establishing preliminary remediation goals (PRGs), identifying preliminary remedial alternatives, and planning RI field activities. As the RI/FS progresses, ARARs and TBCs will continue to be identified and refined, based on a better understanding of site conditions and contaminants, risk pathways, receptors and remedial alternatives. In addition to federal ARARs,
R2-0000287

TRC Job No. 2710 Wip/R/OU2 SUPPLEMENTAL RI WORKPLAN
12
more stringent state ARARs should be identified and other federal and state criteria, advisories, and guidance and local ordinances should be considered. There are three general categories of ARARs. Contaminant-specific ARARs can define acceptable exposure levels and be used in establishing preliminary cleanup goals. Location-specific ARARs can set restrictions on activities in certain areas; a site-specific example is the set of wetlands regulations that will necessitate permits for removal and investigative activities, and will place restrictions on post-remedial land use scenarios. Action-specific ARARs can set controls for particular hazardous waste treatment and disposal activities. The USEPA has developed regional screening levels (SLs) for chemical contaminants at Superfund Sites. It should be noted that the SLs are based upon human health risk and do not address potential ecological risk. USEPA's compilation of national recommended water quality criteria provide guidance for states and tribes to use in adopting water quality standards. USEPA has also developed Freshwater Sediment Screening Benchmarks (Region III BTAG, August 2006), which are values to be used for the evaluation of sampling data at Superfund sites. The NJDEP has developed soil remediation standards that are used to establish cleanup goals under all NJDEP programs. The NJDEP has also developed criteria for sediment evaluation and surface water quality standards. Furthermore, the NJDEP has promulgated specific procedures for conducting the investigation and remediation of contaminated sites in the Technical Requirements for Site Remediation (TRSR) and has developed guidance for methodologies to be employed in field investigations in the Field Sampling Procedures Manual. To determine the chemical-specific requirements which may be applicable to remediation at the Site, an evaluation of Federal and State chemical-specific ARARs/TBCs was conducted. Potential Federal and State chemical-specific ARARs and TBC criteria are presented in Table 1. 1.6.1 Potential Federal Chemical-Specific ARARs/TBCs Chemical-specific ARARs/TBCs, which may be applicable to the development of PRGs for various media at the Site, are addressed by media below. Soil USEPA Regional SLs for Industrial Soil (May 2010) are used for site "screening" and as initial cleanup goals, if applicable. It should be noted that the SLs are based on human health risk and do not address potential ecological risk. SLs are not cleanup standards and should not be applied as such. The SL's role in site "screening" is to help identify areas, contaminants, and conditions that require further federal attention at a particular site. The SLs will be applicable to the soils, which are here referred as the unsaturated soils above the vadose zone. Surface Water USEPA's compilation of national recommended water quality criteria is presented as a summary table containing recommended water quality criteria for the protection of aquatic life and human health in surface water for approximately 150 pollutants. These criteria are published pursuant to
R2-0000288

TRC Job No. 2710 Wip/R/OU2 SUPPLEMENTAL RI WORKPLAN
13
Section 304(a) of the Clean Water Act (CWA) and provide guidance for states and tribes to use in adopting water quality standards. Sediment USEPA Freshwater Sediment Screening Benchmarks (Region III BTAG, August 2006) were selected utilizing numerous criteria. The Region III BTAG Screening Benchmarks are values to be used for the evaluation of sampling data at Superfund sites. The tables include compounds for which benchmark values have been established or that are considered bioaccumulative compounds. 1.6.2 Potential State Chemical-Specific ARARs/TBCs Soil The NJDEP adopted new Remediation Standards rules at N.J.A.C. 7:26D. The soil remediation standards contained in those rules became effective on June 2, 2008. Soil Remediation Standards (SRS) have been developed by the NJDEP for use in establishing site-site specific goals. The SRS are not ARARs but are to be considered TBCs for soils. The NJDEP SRS for the ingestion/dermal exposure pathway are potential ARARs under CERCLA (except the standard for lead, and except when the future use of the site will be limited to recreation). Based on the future use of the Site (industrial), the NJDEP Non-Residential Direct Contact Soil Remediation Standard (NRDCSRS) will be considered with respect to soil quality. The remediation standards will be applicable to the soils, which are here referred as the unsaturated soils above the vadose zone. Surface Water The Surface Water Quality Standards (SWQS), N.J.A.C. 7:9B, establish the designated uses and antidegradation categories of the State's surface waters, classify surface waters based on those uses (i.e., stream classifications), and specify the water quality criteria and other policies and provisions necessary to attain those designated uses. Designated uses include drinking water supply, fish consumption, shellfish resources, propagation of fish and wildlife, recreation, and agricultural and industrial water supplies. The Hudson Branch is classified as FW2-NT (Category II classification). Therefore, the SWQC for FW2 waters identified in N.J.A.C. 7:9B are evaluated as ARARs for the Hudson Branch. Sediment The NJDEP Site Remediation Program (SRP), Environmental Toxicology and Risk Assessment (ETRA) Unit has developed Ecological Screening Criteria from various sources to allow ease of reference for ecological screening criteria (ESC) for sediment. The ESC are not promulgated standards, but are to be used as screening values in ecological assessments.
R2-0000289

TRC Job No. 2710 Wip/R/OU2 SUPPLEMENTAL RI WORKPLAN
14
2.0 SUMMARY OF AVAILABLE OU2 DATA SMC and TRC have implemented a series of investigative activities for OU2 from the 1990s to 2009. Extensive environmental data for different media have been collected throughout the years and analyzed for a broad spectrum of constituents. This body of data provides an excellent basis for OU2 characterization. A summary of previous environmental investigations conducted at the Site was also provided in Section 1.4. In summary, investigative activities included: Comprehensive Remedial Investigation/Feasibility Study (RI/FS) conducted between
October 1990 and April 1991 and summarized in the Remedial Investigation Technical Report prepared in April 1992 (TRC, 1992).
Supplemental sampling conducted in August and September 1995 summarized in a Draft Final Feasibility Study Report prepared in April 1996 (TRC, 1996a).
Supplemental soil and sediment sampling conducted in April 1996 along Hudson Branch
and summarized on a letter report prepared by TRC (TRC, 1996b).
Sediment investigations conducted in March 2009 and summarized in a letter report prepared by TRC on June 22, 2009 (TRC, 2009).
TRC has reviewed the results of all previous sampling investigations, historical information and the recent investigation conducted at the Site to identify possible data gaps and collect data that need to be updated as required by The Statement of Work for OU2 Supplemental RI and FS (Task 1, Section C). The existing data for soil, surface water, and sediments, are discussed in the subsections below. 2.1 Soil Data Numerous soil samples were collected across the Site during the RI conducted in October 1990 and the supplemental investigation conducted in August 1995 to characterize soil conditions and evaluate the extent of soil contaminants. Soil sampling was also conducted in the Former Lagoons Area to characterize the soils beneath the liners. Chemical analysis performed on the soil samples varied, depending on the location of samples within various plant process and storage areas. A summary of the previous soil investigations conducted at the Site was summarized in Section 1.4.1. The analytical results for the soil samples collected during previous investigations were compared with the current USEPA Industrial SLs and the NJDEP NRDCSRS, which are considered TBCs for soil. The analytical results for VOCs, Semi-VOCs, and pesticides/PCBs are provided on Figures 3, 4, and 5, respectively. The results for metals, except hexavalent chromium and vanadium are provided on Figure 6. Because they are prominent contaminants of concern (COCs) at the Site, hexavalent chromium and vanadium are presented on separate figures. The analytical results for hexavalent chromium are provided on Figure 7. The analytical results for vanadium are provided on Figure 8. Numerous soil samples were also collected from the Former Lagoons Areas and analyzed for hexavalent chromium (Figure 9). Table 2 provides a summary of the number of soil samples collected by Facility area.
R2-0000290

TRC Job No. 2710 Wip/R/OU2 SUPPLEMENTAL RI WORKPLAN
15
In addition to the soil samples collected from the Facility, TRC also collected soil samples near the Hudson Branch, southwest of the intersection of West Boulevard and Weymouth Road. The soil samples were collected at distances between 20 to 80 feet from the Hudson Branch. The analytical results for soil samples collected near the Hudson Branch are provided on Figure 10. The discussion of the previous data is provided by Facility area and contaminant type in the following subsections. 2.1.1 Former Production Area 2.1.1.1 VOCs A total of 34 soil samples were collected from within in the Former Production Area for analysis of VOCs. Some of the samples were collected from the former Manpro-Vibra Degreasing Unit, which is known to be the source of TCE groundwater contamination at the Site. No VOCs were detected in the soil samples collected from the Former Production Area above the TBCs. 2.1.1.2 Semi-VOCs A total of 28 soil samples were collected from the Former Production Area for semi-VOC analysis. No Semi-VOCs were detected in the samples above the TBCs. 2.1.1.3 Pesticides/PCBs A total of 23 soil samples for pesticide/PCB analysis were collected from the Former Production Area. No pesticides/PCBs were detected in the samples exceeding the TBCs. 2.1.1.4 Metals A total of 62 soil samples were collected from the Former Production Area for analysis of metals. All samples were analyzed for TAL metals and hexavalent chromium, except for 15 samples collected during the supplemental investigation in 1995 that were analyzed for at least one of the following compounds: arsenic, beryllium, chromium, hexavalent chromium and vanadium. Vanadium was detected in 25 of 55 soil samples collected from the Former Production Area exceeding the USEPA Industrial SLs of 72 parts per million (ppm) and/or the NJDEP NRDCSRS of 1,100 ppm. Vanadium exceedances ranged from 76.7 ppm to 4,110 ppm. In general, the vanadium concentrations were observed to decrease with depth. Vanadium is slightly soluble in water and groundwater samples collected at the Site exhibited detectable concentrations of vanadium. A comparison of the most recent vanadium concentrations with those detected during the RI activities indicates a significant decrease of vanadium concentrations in groundwater.
R2-0000291

TRC Job No. 2710 Wip/R/OU2 SUPPLEMENTAL RI WORKPLAN
16
Hexavalent chromium was only detected in three of 28 soil samples collected from the Former Production Area above the USEPA Industrial SLs of 5.6 ppm but below the NJDEP NRDCSRS of 20 ppm. The hexavalent chromium exceedances ranged from 8 ppm to 18.1 ppm. Arsenic was only detected in two of 50 soil samples collected from the Former Production Area at concentrations exceeding the USEPA Industrial SLs of 1.6 ppm and NJDEP NRDCSRS of 19 ppm. Arsenic exceedances were reported at 43.1 ppm and 69.8 ppm, respectively. The sample with the highest concentration of arsenic (RA-64) was collected near the water table. Since only two samples were detected above the USEPA and NJDEP guidance, the arsenic exceedances are considered de minimus. 2.1.1.5 Data Summary The primary chemical of potential concern (COPC) in the Former Production Area is vanadium, which exceeds the TBCs in almost half of the samples collected from this area. Hexavalent chromium is a secondary COPC in the Former Production Area. The samples with hexavalent chromium exceedances were above the USEPA industrial SLs but below the NJDEP NRDCSRS. 2.1.1.6 Data Gaps The existing soil data are sufficient to complete the Revised Risk Assessment. However, additional surface soils and subsurface soils will be collected at the Former Production Area to address data gaps. For the Former Production Area and for purposes of horizontal delineation of surface soils, a data gap exists along the northern property line. Surface soil samples will be collected from this area to delineate vanadium exceedances and to consider remedial measures in the Feasibility Study. A potential data gap also exists at the Former Manpro-Vibra Degreasing Unit where TCE was the primary degreasing compound used in the unit. Evidence of TCE contamination was not observed during previous soil investigations conducted in this area but existing groundwater data indicate that the highest TCE concentrations in the shallow zone have been detected in well SC-20, which is located in the proximity of the Former Manpro-Vibra Degreasing Unit. Several soil borings will be advanced in the area of well SC-20 to evaluate the subsurface soils conditions. TRC, as part of the approved OU1 In Situ Expanded Pilot Program, will be performing certain ground water injections near well SC-20S, proximate to Former Building D109. Because TRC wants good data from the OU2 borings planned for this area, in the event that the OU1 ground water injections are performed prior to the proposed OU2 borings, TRC will wait to perform the OU2 borings until the OU1 effects are studied and understood. A proposed sampling program to address the data gaps in this area is described in Section 3.4.1.1.
R2-0000292

TRC Job No. 2710 Wip/R/OU2 SUPPLEMENTAL RI WORKPLAN
17
2.1.2 Former Lagoons Area 2.1.2.1 VOCs A total of four soil samples were collected from the Former Lagoons Area for VOC analysis. No VOCs were detected in the samples above the TBCs. 2.1.2.2 Semi-VOCs A total of two soil samples were collected from the Former Lagoons Area for Semi-VOC analysis. No Semi-VOCs were detected in the samples above the TBCs. 2.1.2.3 Pesticides/PCBs A total of two soil samples were collected from the Former Lagoons Area for pesticide/PCB analysis. No pesticides/PCBs were detected in the samples above the TBCs. 2.1.2.4 Metals A total of 30 soil samples were collected from the lagoons area for analysis of metals. No metals were detected in the samples above the TBCs, except for hexavalent chromium and vanadium. Hexavalent chromium was detected in 18 of 78 soil samples collected from the lagoons at concentrations exceeding the USEPA Industrial SLs of 5.6 ppm and/or the NJDEP NRDCSRS of 20 ppm. The hexavalent chromium exceedances ranged from 5.6 ppm to 70 ppm. In a letter dated August 10, 2001, the NJDEP approved the lagoons closure report and concluded that the limited hexavalent chromium concentrations do not appear to represent a continued source of groundwater contamination (NJDEP, 2001). Ten of the 18 exceedances occurred below the water table. Exceedances below the water table will be addressed as part of OU1. Vanadium was detected in seven of 21 soil samples collected from the lagoons at concentrations above the USEPA Industrial SLs of 72 ppm. The vanadium exceedances ranged from 91.2 ppm to 671 ppm. Vanadium was not detected above the NJDEP NRDCSRS of 1,100 ppm. 2.1.2.5 Data Summary The primary COPCs identified in Former Basins B9 and B10 include vanadium and hexavalent chromium. 2.1.2.6 Data Gaps Sufficient soil data exist at the Former Lagoons Area to complete the Revised Risk Assessment. Investigation of surface and subsurface soils at Former Basins B9 and B10 was identified as a data gap. Since limited post-closure data are available for Former Basins B9 and B10, two soil borings are proposed to evaluate the surface and subsurface soil conditions in the former basins.
R2-0000293

TRC Job No. 2710 Wip/R/OU2 SUPPLEMENTAL RI WORKPLAN
18
A proposed sampling program to address the data gaps in Former Basins B9 and B10 is described in Section 3.4.1.2. 2.1.3 Eastern Storage Areas 2.1.3.1 VOCs A total of 13 soil samples were collected from the Eastern Storage Areas for VOC analysis. No VOCs were detected in the samples above the TBCs. 2.1.3.2 Semi-VOCs A total of nine soil samples were collected from the Eastern Storage Areas for semi-VOC analysis. No Semi-VOCs were detected in the samples above the TBCs. 2.1.3.3 Pesticides/PCBs Total PCBs were detected in one of 29 samples collected from the Eastern Storage Areas at a concentration of 2.5 ppm, which just exceeds the TBCs. Based on the distribution and number of PCB analysis conducted in this area, the PCB exceedances in one sample are considered de minimus. No pesticides were detected in the samples above the TBCs. 2.1.3.4 Metals A total of 47 samples were collected from the storage areas for metal analysis. No metals were detected in the samples above the TBCs, except for vanadium and hexavalent chromium. Vanadium was detected in 26 of 42 soil samples collected from the Eastern Storage Areas exceeding the USEPA Industrial SLs of 72 ppm and/or the NJDEP NRDCSRS of 1,100 ppm. Vanadium exceedances ranged from 82.9 ppm to 4,750 ppm. Hexavalent chromium was detected in one of 42 soil samples collected just north of the Eastern Storage Areas exceeding the USEPA Industrial SLs of 5.6 ppm but below the NJDEP NRDCSRS of 20 ppm. 2.1.3.5 Data Summary The primary COPC in the Eastern Storage Areas is vanadium and the secondary COPC in this area is hexavalent chromium. 2.1.3.6 Data Gaps Delineation of surface soils to the north of the Eastern Storage Areas and near the property line was identified as a data gap. Three surface soil samples are proposed at locations near the property line
R2-0000294
TRC Job No. 2710 Wip/R/OU2 SUPPLEMENTAL RI WORKPLAN
19
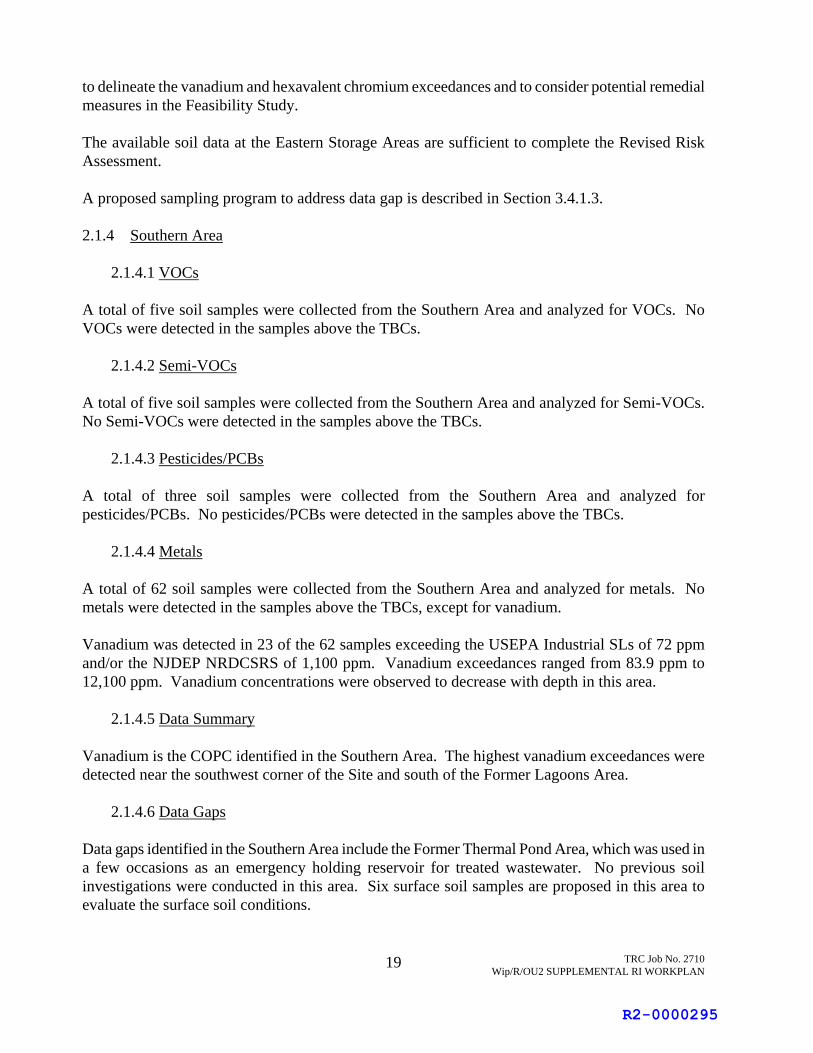
to delineate the vanadium and hexavalent chromium exceedances and to consider potential remedial measures in the Feasibility Study. The available soil data at the Eastern Storage Areas are sufficient to complete the Revised Risk Assessment. A proposed sampling program to address data gap is described in Section 3.4.1.3. 2.1.4 Southern Area 2.1.4.1 VOCs A total of five soil samples were collected from the Southern Area and analyzed for VOCs. No VOCs were detected in the samples above the TBCs. 2.1.4.2 Semi-VOCs A total of five soil samples were collected from the Southern Area and analyzed for Semi-VOCs. No Semi-VOCs were detected in the samples above the TBCs. 2.1.4.3 Pesticides/PCBs A total of three soil samples were collected from the Southern Area and analyzed for pesticides/PCBs. No pesticides/PCBs were detected in the samples above the TBCs. 2.1.4.4 Metals A total of 62 soil samples were collected from the Southern Area and analyzed for metals. No metals were detected in the samples above the TBCs, except for vanadium. Vanadium was detected in 23 of the 62 samples exceeding the USEPA Industrial SLs of 72 ppm and/or the NJDEP NRDCSRS of 1,100 ppm. Vanadium exceedances ranged from 83.9 ppm to 12,100 ppm. Vanadium concentrations were observed to decrease with depth in this area. 2.1.4.5 Data Summary Vanadium is the COPC identified in the Southern Area. The highest vanadium exceedances were detected near the southwest corner of the Site and south of the Former Lagoons Area. 2.1.4.6 Data Gaps Data gaps identified in the Southern Area include the Former Thermal Pond Area, which was used in a few occasions as an emergency holding reservoir for treated wastewater. No previous soil investigations were conducted in this area. Six surface soil samples are proposed in this area to evaluate the surface soil conditions.
R2-0000295

TRC Job No. 2710 Wip/R/OU2 SUPPLEMENTAL RI WORKPLAN
20
Delineation of surface soils in the southwest corner of the Site, along the property line, is also identified as a data gap. Two surface soil samples are proposed at locations near the property line to delineate the vanadium exceedances and to consider potential remedial measures in the Feasibility Study. The existing data in this area are sufficient to complete the Revised Risk Assessment. A proposed sampling program to address these data gaps is described in Section 3.4.1.4. 2.1.5 Facility Wide Soil Data Summary Hundreds of soil samples were collected across the Facility during previous investigations to characterize the soil conditions and delineate the extent of contaminants in the unsaturated zone. Soil samples were analyzed for a wide range of parameters that included VOCs, Semi-VOCs, pesticides/PCBs, TAL metals, and hexavalent chromium.
2.1.5.1 Facility Wide Results and COPCs Vanadium was the primary COPC identified at the SMC Facility. Vanadium was detected in 95 of 201 soil samples collected across the Site at concentrations exceeding the USEPA Industrial SLs of 72 ppm and/or the NJDEP NRDCSRS of 1,100 ppm. Vanadium exceedances across the Site ranged from 75.8 ppm to 12,100 ppm. The highest vanadium concentrations were observed in the Eastern Storage Areas and the Southern Area. Vanadium, which has a low solubility, has also been detected in groundwater samples collected at the Site. A comparison of the most recent vanadium concentrations in groundwater (January 2010) with the results obtained during the initial RI activities (December 1990) indicates a significant decrease of vanadium concentrations in groundwater. Vanadium concentration maps for the shallow aquifer (January 2010 and December 1990 sampling events) were included in the OU1 Supplement RI Report that was submitted to the USEPA in January 2011. Hexavalent chromium was identified as a secondary COPC across the Site. Hexavalent chromium was detected in 22 of 231 samples collected across the Site at concentrations above the USEPA Industrial SLs of 5.6 ppm and/or NJDEP NRDCSRS of 20 ppm. The exceedances of hexavalent chromium were detected in three samples from the Former Production Area, one sample collected off-site and north of the Eastern Storage Area, and 18 samples from the Former Lagoons Area.
2.1.5.2 Data Gaps Sufficient soil data exist to complete a Revised Risk Assessment for all areas at the Site. Based on the review and evaluation of the soil data and to consider potential remedial measures in the Feasibility Study, it is be necessary to accomplish horizontal delineation of surface soils in several areas. Additional data will be obtained along the northern property line at the Former Production Area and the Eastern Storage Areas to delineate the horizontal extent of vanadium. Additional soil investigation will be conducted at the Former Manpro-Vibra Degreasing Unit, the Former Basins B9 and B10 and the Former Thermal Pond Area to evaluate the soil conditions in
R2-0000296

TRC Job No. 2710 Wip/R/OU2 SUPPLEMENTAL RI WORKPLAN
21
these areas. Delineation of surface soils will also be conducted at the southwest corner of the Southern Area, near the properly line. Background soil data are also considered as a data gap. A total of 13 surface soil samples are proposed in areas around the Site to address data gaps and develop sufficient database to support the Revised Risk Assessment. A proposed sampling program to address these data gaps is described in Section 3.4.1.5. 2.2 Surface Water Data As discussed in Section 1.4.2, surface water samples were collected during the RI conducted in 1990 and supplemental investigations conducted in 1995. The analytical results for surface water samples were compared with the National Recommended Water Quality Criteria (2009) and the NJDEP Surface Water Criteria (SWQC) for FW2-classified waters (2009), which were identified as the ARARs. The analytical results for surface water samples collected during previous investigations are provided on Figure 11. Table 3 provides a summary of the number of surface water samples collected by water body and type of analysis. A discussion of the surface water results for each water body is provided below: 2.2.1 Hudson Branch
2.2.1.1 VOCs Five surface water samples were collected from the Hudson Branch for VOC analysis. One of five surface water samples had a TCE concentration of 3 parts per billion (ppb), which exceeded the ARARs of 1 ppb. The TCE exceedance was detected in a surface water sample collected from the Farm Parcel, downgradient of the North Vineland Contamination area (the industrial area near the intersection of Weymouth Road and South West Boulevard), identified as contributing VOCs by the NJDEP (as discussed in the OU1 Supplemental RI Report, January, 2011). No TCE was detected in surface water samples collected in the vicinity of the Site. No other VOCs were detected in samples above the ARARs.
2.2.1.2 Semi-VOCs Two surface water samples were collected from the Hudson Branch for Semi-VOC analysis. Bis (2-ethylhexyl) phthalate was detected at 2 ppb in one sample collected from the Farm Parcel. This concentration is above the ARARs of 0.3 ppb. Bis (2-ethylhexyl) phthalate is not considered a COPC since it is a common laboratory contaminant and it was present in the laboratory blanks. No other Semi-VOCs were detected in the samples.
2.2.1.3 Pesticides/PCBs Two surface water samples were collected from the Hudson Branch for pesticide/PCB analysis. No
R2-0000297
TRC Job No. 2710 Wip/R/OU2 SUPPLEMENTAL RI WORKPLAN
22
pesticides/PCBs were detected in the surface water samples above the ARARs.
2.2.1.4 Metals Metals were detected in all surface water samples collected from the Hudson Branch at concentrations exceeding the ARARs. Metals exceeding the ARARs included: Antimony, arsenic, barium, beryllium, cadmium, chromium, cobalt, iron, lead, mercury, nickel, vanadium, and zinc. Vanadium was detected in all surface water samples collected from the Hudson Branch at concentrations exceeding the ARARs of 12 ppb. Vanadium exceedances ranged from 64.3 ppb to 5,700 ppb. Chromium was detected in seven of eight surface water samples at concentrations exceeding the ARARs of 10 ppb. The chromium exceedances ranged from 43.3 ppb to 8,520 ppb. Lead was detected in five of eight surface water samples at concentrations exceeding the ARARs of 2.5 ppb. Lead exceedances ranged from 2.9 ppb to 28 ppb. Arsenic was detected in four of eight surface water samples at concentrations exceeding the ARARs of 0.017 ppb. Arsenic exceedances ranged from 2 ppb to 34.6 ppb. Iron was detected in four of eight surface water samples at concentrations exceeding the ARARs of 1,000 ppb. Iron exceedances ranged from 1,210 ppb to 71,000 ppb. Antimony was detected in two of eight surface water samples collected from the Hudson Branch at concentrations exceeding the ARARs of 5.6 ppb. Antimony exceedances ranged from 44.2 ppb to 151 ppb. Zinc was detected in two of eight surface water samples at concentrations exceeding the ARARs of 120 ppb. Zinc exceedances ranged from 287 ppb to 1,070 ppb. Barium (962 ppb), beryllium (25.1 ppb), cadmium (9 ppb), cobalt (62.2 ppb), mercury (21.4 ppb), and nickel (618 ppb) were only detected in one surface water sample at concentrations exceeding the ARARs. The highest concentrations of metals were detected in surface water sample SW02, which was collected approximately 900 feet upstream of West Blvd. The metal concentrations in surface water samples were observed to decrease downstream of the Site. 2.2.1.5 Data Summary The primary COPCs identified in the Hudson Branch are metals. Secondary COPCs identified in the Hudson Branch included TCE that was detected at the Farm Parcel at a location downstream of other industrial facilities, near the intersection of Weymouth Road and South West Boulevard. No TCE was detected in the stream along the southern portion of
R2-0000298
TRC Job No. 2710 Wip/R/OU2 SUPPLEMENTAL RI WORKPLAN
23
the Site. 2.2.1.6 Data Gaps Because surface water conditions can considerably change over time, surface water samples are proposed along the Hudson Branch to evaluate the current water quality conditions and address data gaps. The surface water samples will be collected from same locations where sediment samples will be collected and include seven transects. The samples will be collected sequentially beginning at the most downstream location and ending with the upstream location to eliminate the potential for cross-contamination between sampling locations and to ensure sample quality. A discussion of the sediment data gaps is provided in Section 2.3.1.6. A proposed sampling program to address the data gaps in the Hudson Branch is described in Section 3.5.1.1. 2.2.2 Burnt Mill Pond 2.2.2.1 VOCs No surface water samples were collected from the Burnt Mill Pond for analysis of VOCs. 2.2.2.2 Semi-VOCs No surface water samples were collected from the Burnt Mill Pond for analysis of Semi-VOCs. 2.2.2.3 Pesticides/PCBs No surface water samples were collected from the Burnt Mill Pond for analysis of pesticides/PCBs. 2.2.2.4 Metals Two surface water samples were collected from the Burnt Mill Pond for analysis of metals. Arsenic, chromium, and iron were detected in one surface water sample above the ARARs. Arsenic was detected at 2.8 ppb exceeding the ARAR of 0.017 ppb. Chromium was detected at 46.8 ppb exceeding the ARAR of 42 ppb. Iron was detected at 3,080 ppb exceeding the ARAR of 1,000 ppb. Lead and vanadium were detected in both samples above the ARARs. Lead was detected at concentrations ranging from 2.8 ppb to 3.4 ppb, which exceeded the ARAR of 2.5 ppb and vanadium was detected at concentrations ranging from 145 ppb to 413 ppb, which exceeded the ARAR of 12 ppb. 2.2.2.5 Data Summary The primary COPCs in the Burnt Mill Pond surface water include arsenic, chromium, iron, lead, and vanadium.
R2-0000299

TRC Job No. 2710 Wip/R/OU2 SUPPLEMENTAL RI WORKPLAN
24
2.2.2.6 Data Gaps Surface water samples were collected from the Burnt Mill Pond in 1995 and no additional surface water data have been obtained from this pond. Because surface water conditions can considerably change over time, four surface water samples are proposed to be collected from the pond to evaluate current water quality conditions and address data gaps. In order to determine whether any contaminants from the Burnt Mill Pond have migrated downstream into the Burnt Mill Branch, two surface water sample will be collected downstream of the pond. A proposed sampling program to address the data gaps in the Burnt Mill Pond is described in Section 3.5.1.2. 2.2.3 Burnt Mill Branch 2.2.3.1 VOCs No surface water samples were collected from the Burnt Mill Branch for analysis of VOCs. 2.2.3.2 Semi-VOCs No surface water samples were collected from the Burnt Mill Branch for analysis of Semi-VOCs. 2.2.3.3 Pesticides/PCBs No surface water samples were collected from the Burnt Mill Branch for analysis of pesticides/PCBs. 2.2.3.4 Metals Two surface water samples were collected from the Burnt Mill Branch for analysis of metals. No metals were detected above the ARARs. 2.2.3.5 Data Summary No COPCs were identified for the Burnt Mill Branch. 2.2.3.6 Data Gaps Surface water samples were collected from the Burnt Mill Branch in 1995 (upstream of the Burnt Mill Pond). Because surface water conditions can considerably change over time and because there has only been sampling for metals in the Burnt Mill Branch, TRC considers the surface water data as a significant data gap. At least eight surface water samples are proposed to be collected from the Burnt Mill Branch (upstream of the pond) to address the data gaps.
R2-0000300

TRC Job No. 2710 Wip/R/OU2 SUPPLEMENTAL RI WORKPLAN
25
The surface water samples will be collected sequentially beginning at the most downstream location and ending with the upstream location to eliminate the potential for cross-contamination between sampling locations and to ensure sample quality. At least one surface water sample is proposed from the Burnt Mill Branch (downstream of the Burnt Mill Pond) to determine if contaminants had migrated downstream. A proposed sampling program for collection of background surface water samples from the Burnt Mill Branch is described in Section 3.5.1.3. 2.3 Sediment Data As discussed in Section 1.4.3, stream sediments were sampled in 1990, 1995, and 2009. The analytical results for sediment samples were compared with the USEPA Freshwater Sediment Screening Benchmarks (Region III BTAG, August 2006) and the NJDEP Ecological Screening Criteria (March 2009). The USEPA and the NJDEP screening levels are TBCs and should be used as screening values in ecological assessments. The analytical results for sediment samples collected during previous investigations are provided on Figure 12 (organics) and Figure 13 (metals). Table 4 provides a summary of the number of sediment samples collected by water body and type of analysis. A discussion of the sediment results for each water body is provided below: 2.3.1 Hudson Branch 2.3.1.1 VOCs Five sediment samples were collected from the Hudson Branch for VOC analysis. Methylene chloride was detected in one sample at 0.87 ppm, which exceeded the TBCs of 0.159 ppm. Carbon disulfide was detected in one sample at 0.004 ppm, which exceeded the TBCs of 0.000851 ppm. Methylene chloride is a common laboratory contaminant. No other VOCs were detected in the sediment samples. 2.3.1.2 Semi-VOCs Two sediment samples were collected from the Hudson Branch for Semi-VOCs analysis. Phenol was detected in one sample at 0.52 ppm, which exceeded the TBCs of 0.0491 ppb. Benzoic acid was detected in two samples at 1 ppm and 3.2 ppm, respectively, which are above the TBC of 0.65 ppm. It should be noted that benzoic acid is no longer included in the TCL list and it will not be included in future sediment analyses. Bis (2-ethylhexyl) phthalate were detected in two sediment samples at 0.27 ppm and 0.58 ppm, respectively, which are above the TBCs of 0.18 ppm. Benzo(b)fluoranthene was detected in one sample at 0.11 ppm, which exceeded the TBC of 0.0272 ppm. 2.3.1.3 Pesticides/PCBs
R2-0000301
TRC Job No. 2710 Wip/R/OU2 SUPPLEMENTAL RI WORKPLAN
26
Pesticides were detected in four of seven sediment samples at concentrations exceeding the TBCs. 4,4-DDE was detected at concentration ranging from 0.011 ppm to 0.046 ppm, which exceeded the TBC of 0.00316 ppm. 4,4-DDD was detected at concentrations ranging from 0.0053 ppm to 0.074 ppm, which exceeded the TBC of 0.00488 ppm. 4,4-DDT was detected at concentrations ranging from 0.014 ppm to 0.051 ppm, which exceeded the TBC of 0.00416 ppm. PCBs were detected in three of seven sediment samples at concentrations ranging from 0.095 ppm to 1.89 ppm, which exceeded the TBC of 0.0598 ppm. 2.3.1.4 Metals A total of 54 sediment samples were collected from the Hudson Branch for metal analysis. Metals were detected in 53 of 54 sediment samples at concentrations above the TBCs. Metals with exceedances included: Aluminum, antimony, arsenic, cadmium, chromium, cobalt, copper, iron, lead, manganese, mercury, nickel, selenium, silver, and zinc. Chromium was detected in 53 of 54 sediment samples collected from the Hudson Branch at concentrations exceeding the TBC of 26 ppm. The chromium exceedances ranged from 30.1 ppm to 15,700 ppm. The highest chromium concentrations in the Hudson Branch were observed in sediment samples collected between the broader area (south of SMC) and the car wash area. Distribution of chromium along Hudson Branch during several sampling events is provided on Figure 14. The concentration of chromium in sediments generally decreases with distance from the Site. Nickel was detected in 45 of 54 sediment samples exceeding the TBC of 16 ppm, at concentrations ranging from 17.8 ppm to 1,090 ppm. Lead was detected in 43 of 54 sediment samples exceeding the TBC of 31 ppm, ranging from 31.2 ppm to 381 ppm. Copper was detected in 41 of 54 sediment samples exceeding the TBC of 16 ppm, ranging from 17.4 ppm to 361 ppm. Mercury was detected in 34 of 54 sediment samples exceeding the TBC of 0.18 ppm, at concentrations ranging from 0.21 ppm to 8.3 ppm. Other metals detected above the TBCs but at less frequency included aluminum, antimony, arsenic, cadmium, cobalt, iron, manganese, selenium, silver, and zinc. The concentrations of metals at the downstream sampling stations generally decreased with distance from the Site. The concentrations of metals also decreased with depth as observed in those stations where additional samples were collected vertically for delineation purpose. 2.3.1.5 Data Summary The primary COPCs for sediments in the Hudson Branch include metals. The secondary COPCs for sediments in the Hudson Branch include Semi-VOCs and pesticides/PCBs. 2.3.1.6 Data Gaps
R2-0000302
TRC Job No. 2710 Wip/R/OU2 SUPPLEMENTAL RI WORKPLAN
27
Sufficient sediment data exist to complete the Revised Risk Assessment for the Hudson Branch. Sediment samples will be collected from the Hudson Branch to evaluate current sediment quality conditions and delineate the vertical extent of contamination. Sediment samples will be collected from transects located along the Hudson Branch. At each transect location, one surface water sample, at least one sediment sample, and two stream bank soil samples will be collected to address the data gaps. The sediments in the on-site impoundment were also identified as data gaps. Six sediment samples will be collected from the on-site impoundment to evaluate the sediment quality conditions. A sampling program that addresses the data gaps is described in Section 3.6.1.1. 2.3.2 Burnt Mill Pond 2.3.2.1 VOCs No sediment samples were collected from the Burnt Mill Pond for analysis of VOCs. 2.3.2.2 Semi-VOCs No sediment samples were collected from the Burnt Mill Pond for analysis of Semi-VOCs. 2.3.2.3 Pesticides/PCBs No sediment samples were collected from the Burnt Mill Pond for analysis of pesticides/PCBs. 2.3.2.4 Metals Nine sediment samples were collected from four stations at the Burnt Mill Pond and analyzed for metals. Metals exceeding the TBCs included antimony, cadmium, chromium, mercury, and nickel. Chromium was detected in seven of nine sediment samples collected from the Burnt Mill Pond at concentrations ranging from 41.4 ppm to 594 ppm, which exceeded the TBC of 26 ppm. Mercury was detected in two of nine sediment samples and antimony, cadmium, and nickel were detected in one nine sediment samples at very low concentrations and slightly exceeding the TBC. 2.3.2.5 Data Summary The primary COPCs for sediments in the Burnt Mill Pond include chromium. The highest concentrations of chromium were detected at the station near the Hudson Branch discharge point. The secondary COPCs included antimony, cadmium, chromium, mercury, and nickel.
R2-0000303

TRC Job No. 2710 Wip/R/OU2 SUPPLEMENTAL RI WORKPLAN
28
2.3.2.6 Data Gaps Given the time elapsed since sediment samples were last collected from several stations at the Burnt Mill Pond, sediment sampling will be required from this area to assess current quality conditions and address data gaps. Sediment samples are also proposed at several locations in the pond to accomplish the vertical delineation. A proposed sediment sampling program to address data gaps at the Burnt Mill Pond is provided in Section 3.6.1.2. 2.3.3 Burnt Mill Branch 2.3.3.1 VOCs No sediment samples were collected from the Burnt Mill Branch for analysis of VOCs. 2.3.3.2 Semi-VOCs No sediment samples were collected from the Burnt Mill Branch for analysis of Semi-VOCs. 2.3.3.3 Pesticides/PCBs No sediment samples were collected from the Burnt Mill Branch for analysis of pesticides/PCBs. 2.3.3.4 Metals A total of eight sediment samples were collected from four stations within the Burnt Mill Branch. Metals detected above the TBCs included cadmium, chromium, copper, lead mercury, and nickel. Mercury was detected in six of eight sediment samples collected from the Burnt Mill Branch at concentrations ranging from 0.3 ppm to 1.5 ppm, which exceeded the TBC of 0.18 ppm. Lead was detected in four of eight sediment samples at concentrations ranging from 35.8 ppm to 91.9 ppm, which exceeded the TBC of 31 ppm. Chromium was detected in two of eight sediment samples at concentrations ranging from 38.3 ppm to 122 ppm, which exceeded the TBC of 26 ppm. Cadmium and nickel were detected in two of eight sediment samples and copper was detected in one of eight sediment samples at a low concentrations and slightly exceeding the TBCs. 2.3.3.5 Data Summary Sediment samples were previously collected from the Burnt Mill Branch to evaluate background sediment conditions. The Burnt Mill Branch is located in a separate watershed basin relative to the watershed basin in which the SMC Facility is located. The primary COPCs for sediments in the Burnt Mill Branch include cadmium, chromium, copper, lead, mercury, and nickel.
R2-0000304

TRC Job No. 2710 Wip/R/OU2 SUPPLEMENTAL RI WORKPLAN
29
2.3.3.6 Data Gaps Given the time elapsed since sediment samples were last collected from the Burnt Mill Branch, sediment samples are proposed to be collected from this branch to assess current quality conditions. Background sediment samples are also proposed upstream of the Burnt Mill Pond to consider potential remedial measures in the Feasibility Study. At least two sediment samples will be collected downstream of the Burnt Mill Pond to evaluate the sediment conditions, downstream of the Burnt Mill Pond. A proposed sampling program to address the data gaps is described in Section 3.6.1.3.
R2-0000305

TRC Job No. 2710 Wip/R/OU2 SUPPLEMENTAL RI WORKPLAN
30
3.0 SUPPLEMENTAL OU2 RI ACTIVITIES The purpose of this OU2 SUPPLEMENTAL RI WORKPLAN is to provide guidance for all fieldwork by defining the sampling details and field data-gathering methods to be used during the RI. The sampling program defined in the OU2 SUPPLEMENTAL RI WORKPLAN is intended to address the data gaps discussed in Section 2 relative to the nature and extent of contamination at the Site, and to facilitate the risk assessment process and the feasibility study process. All sampling, analysis, data assessment, and monitoring will be performed in accordance with USEPA Region 2 Guidance for the Development of Quality Assurance Project Plans for Environmental Monitoring Projects (dated April 2004) and any updates thereto, or an alternate EPA-approved test method and the guidelines set forth in the Settlement Agreement. Each field activity will be conducted by field personnel wearing appropriate personal protective equipment (PPE) and using proper health and safety equipment as outlined in the HASP. 3.1 Supplemental OU2 RI Overview The OU2 SUPPLEMENTAL RI WORKPLAN proposes a RI sampling program that is designed to be flexible and progressive in nature, to maximize the characterization of site conditions during the initial RI mobilization and reduce the need for subsequent RI phases. The OU2 SUPPLEMENTAL RI WORKPLAN is designed to fill the data gaps identified in Section 2. The OU2 SUPPLEMENTAL RI WORKPLAN describes the sampling methodology for the characterization of the nature and extent of the contamination found in OU2, site soil, surface water, and sediment. The sampling methodology will involve the collection of multiple samples, with provisions for additional contingent samples, based on rapid evaluation of collected data. This approach will reduce the need for subsequent RI phases after submission of the RI Report. As specified in Section III Task III-B of the AOC/SOW, SMC/TRC will notify EPA at least two weeks in advance of the field work regarding the planned dates for field activities. TRC will notify the EPA when field work is completed within 7 days of completion. TRC will submit the validated data to the EPA within 60 days of each sampling activity, as specified in Section III Task III of the AOC/SOW. Within 45 days of the submission to USEPA of the final set of validated data, TRC will submit a Site Characterization Summary Report for OU2 Supplemental RI activities, as specified in Section III Task III of the AOC/SOW, The results of initial sampling efforts will be evaluated as soon as data are available and if data gaps persist in one or more medium, additional sampling locations and depth intervals will be selected, depending on which data gaps exist after initial sampling. The project schedule is discussed in section 3.12. 3.2 Mobilization and Demobilization This field investigation mobilization activity consists of field personnel orientation, equipment mobilization, the determination of sampling locations, and demobilization. Each field team member will attend an on-site orientation meeting to become familiar with the history of the Site, health and safety requirements, and field investigation procedures. Prior to initiating field activities, the State-
R2-0000306

TRC Job No. 2710 Wip/R/OU2 SUPPLEMENTAL RI WORKPLAN
31
mandated underground utility location service will be notified to identify and mark underground utilities that may be serving the property. Currently the Site is used as office space and is sublet as warehousing and construction equipment storage space. The Site is secured by a perimeter chain link fence and the facility parking lot along the western property boundary lies outside of the chain link fence to allow visitor and administrative access. A controlled area exists within the Facility and access will not be allowed to this area. The Restricted Area is located in the eastern portion of the Facility and it is referred as the controlled area by the NRC. Prior to scheduling the field work, TRC personnel will coordinate with the SMC representative to get access to the Site. To reduce the accidental spread of contaminants by workers or equipment, work zones (Exclusion Zone, Contamination, and Support Zone) will be established using control lines or barriers for each subsurface investigation area prior to the implementation of field activities. The areas will be cordoned off to restrict unauthorized personnel. Additional information regarding the work zones and decontamination procedures is provided in Section 3.9. Prior to the start of the field activities, all contractors and field personnel will become familiar with all facilities at the Site. A decontamination pad exists at the rear and west side of the treatment plant to decon vehicles and field equipment. Waste generated during the supplemental RI will be containerized and staged adjacent and south of the treatment plan to await characterization. Additional information regarding the waste management is provided in Section 3.11. A field trailer with central AC and heating is currently occupied by TRC personnel who operate the treatment system. The field trailer will be used to store field documents, logbooks equipment, sample containers, coolers, generators, and PPE. Field personnel will have access to telephone, computer, and water, which is available in the field trailer. Portable toilet facilities are also available at the treatment plant. A copy of the HASP will be distributed to each field team member and subcontractor conducting field work at the Site. Prior to the implementation of field sampling activities, TRC will conduct the following activities at the Site in order to ensure the safe and efficient implementation of the Supplemental Work Plan in accordance with the OU2 SUPPLEMENTAL RI WORKPLAN:
Verify the locations of existing subsurface utilities entering the Site through the New Jersey “One Call” system;
Identify site ingress/egress points, Project Team meeting locations, work zone areas, equipment decontamination and storage areas, and drum storage areas (for cuttings, purge water and waste materials, as appropriate);
Identify site security issues; and Locate and mark-out sampling locations.
For each site mobilization, the Field Team will manage and conduct the following tasks:
Conduct daily tailgate meetings to discuss daily sampling work scope and health and safety issues;
Verify that all team members and subcontractors have read and understand the HASP;
R2-0000307

TRC Job No. 2710 Wip/R/OU2 SUPPLEMENTAL RI WORKPLAN
32
Instruct all site personnel on procedures and hazards identified in the OU2 SUPPLEMENTAL RI WORKPLAN, QAPP and HASP.
Equipment and personnel will be demobilized at the completion of each phase of field activities as necessary. Demobilization will also consist of site-area clean-up and organization of investigation records. 3.3 Site Survey The State Plane Coordinates will be obtained for all proposed sampling locations (soil, surface water, and sediment). Prior to conducting the field activities, the field team will identify the proposed locations using a GPS unit. Following the collection of the samples, a labeled stake will be placed in the ground to mark the sample locations. All sample locations (soil, surface water, and sediment locations) will be horizontally located by a New Jersey-licensed land surveyor. 3.4 Soil Sampling
Soil samples will be collected from several areas at the Site to address data gaps. Information about the physical setting of the Site that includes site drainage, surface water, wetlands, geology, and hydrogeology is provided in Section 1.3. Section 2.0 provides a summary of the previous soil investigations and results for the soil samples collected from several areas at the Site. 3.4.1 Proposed Soil Sample Location and Frequency Proposed soil sample locations from several areas at the Site are provided on Figure 15 and proposed background soil sample locations are provided on Figure 16. Table 5 provides a summary of the proposed sampling program and a protocol for collection of samples. Table 6 provides the media volume and preservation requirements for the specific analyses to be performed. 3.4.1.1 Former Production Area The primary COPC identified in the Former Production Area is vanadium and the secondary COPC included hexavalent chromium. In order to delineate the horizontal extent of vanadium exceedances, four surface soil samples (SB-84 through SB-87) are proposed along the northern property. No horizontal delineation is being proposed for hexavalent chromium along the northern property line. Surface soil samples will be collected from exposed ground surface to 0.5 feet below ground. For the horizontal delineation sampling program, the analysis will be performed on an expedited turnaround (3 or 5 days) by a New Jersey-certified laboratory. If the surface soil sample results are above the EPA screening levels or NJDEP NRDCSRS, then, TRC and USEPA may determine if additional sampling will be required. The surface soil samples will be collected in accordance with the sampling procedures provided in Section 3.4.2.1. A minimum of 5 soil borings (SB-88 through SB-92) will be advanced in the Former Manpro-Vibra Degreasing Unit, which is known to be the source of VOC contamination at the Site. Continuous soil samples will be collected to the water table and the sample with the highest photoionization
R2-0000308

TRC Job No. 2710 Wip/R/OU2 SUPPLEMENTAL RI WORKPLAN
33
detector/flame ionization detector (PID/FID) reading or greatest impact (i.e., staining or sheens) will be submitted to the laboratory for VOC analysis on an expedited turnaround (3 or 5 days). When evidence of contamination is observed in a soil boring, then a contingency sample will be collected at a lower interval (2 to 3 feet below first sample) to accomplish the vertical delineation. If no evidence of contamination is encountered, a soil sample will be collected from the 0.5 feet interval above the water table and analysis will be performed on a normal turnaround time. If the results of the contingency sample exceed the EPA screening levels or the NJDEP NRDCSRS, then the field team will be directed to step out and advance a second boring to accomplish the delineation. The actual number of samples will depend on field conditions and analytical results. Subsurface soil samples will be collected in accordance with the sampling procedures provided in Section 3.4.2.2. 3.4.1.2 Former Lagoons Area Data gaps identified at the Former Lagoons Area include the collection of additional data from the Former Basins B9 and B10 to evaluate subsurface soil conditions. A soil boring will be advanced from the center of each former basin (Borings SB-93 and SB-94) and continuous soil samples will be collected to the top of the water table. One surface soil sample will be collected from each boring for analysis of VOC, chromium, hexavalent chromium, vanadium, pH, and ORP on a normal turnaround time. The surface soil samples will be collected from surface to 0.5 feet below ground, except surface soil samples for VOC analysis that will be collected from 0.5 to 1 foot below ground. Surface soil samples will be collected in accordance with the sampling procedures provided in Section 3.4.2.1. A subsurface soil sample will also be collected from each soil boring from the interval with the highest PID/FID reading or greatest impact (i.e., staining or sheens). The subsurface soil sample will be submitted to the laboratory for analysis of VOC, hexavalent chromium, vanadium, pH, and ORP on an expedited turnaround (3 or 5 days). When evidence of contamination is observed in a soil boring, then a contingency sample will be collected at a lower interval to accomplish the vertical delineation. If no evidence of contamination is observed, a soil sample will be collected from the 0.5 feet depth interval above the water table and analysis will be performed on a normal turnaround time by a New Jersey-certified laboratory. Subsurface soil samples will be collected in accordance with the sampling procedures provided in Section 3.4.2.2. 3.4.1.3 Eastern Storage Areas Surface soil samples (SB-95 through SB-97) are proposed off-site and north of Eastern Storage Areas to determine the horizontal extent of vanadium contamination. Sample SB-95 will also be analyzed for hexavalent chromium to delineate an exceedance near the property line. The surface soil samples will be collected from exposed ground surface to 0.5 feet below ground. For the horizontal delineation sampling program, the analysis will be performed on an expedited turnaround (3 or 5 days) by a New Jersey-certified laboratory. If the surface soil sample results are above the EPA screening levels or NJDEP NRDCSRS, then, TRC and USEPA may determine if additional
R2-0000309

TRC Job No. 2710 Wip/R/OU2 SUPPLEMENTAL RI WORKPLAN
34
sampling is required. The surface soil samples will be collected in accordance with the sampling procedures provided in Section 3.4.2.1. 3.4.1.4 Southern Area Data gaps exist at the Former Thermal Pond Area and soil samples will be collected from this area to evaluate the surface soil conditions. Six surface soil samples (SB-98 through SB-103) will be collected for analysis of VOC, TAL metals, hexavalent chromium, pH, and ORP on a normal turnaround time. The surface soil samples will be collected from exposed ground surface to 0.5 feet below surface, except the samples for VOC analysis that will be collected from 0.5 to 1 foot below surface. Surface soil samples (SB-104 and SB-105) are proposed along the southwestern property line to determine the horizontal extent of vanadium concentrations in this area. The surface soil samples will be collected from exposed ground surface to 0.5 feet below ground. For the horizontal delineation sampling program, the analysis will be performed on an expedited turnaround (3 or 5 days) by a New Jersey-certified laboratory. If the surface soil sample results are above the EPA screening levels or NJDEP NRDCSRS, then, TRC and USEPA may determine if additional sampling is required. The surface soil samples will be collected in accordance with the sampling procedures provided in Section 3.4.2.1. 3.4.1.5 Background Soil Samples A total of 13 surface soil samples (BG-1 through BG-13) are proposed to be collected from areas that are not influenced by releases (naturally occurring or anthropogenic). Naturally occurring is defined as those areas that are not influenced by human activity and anthropogenic is defined as natural and human made substances present in the environment as a result of human activities (not specifically related to the Site). Background soil samples will be collected from exposed ground surface to 0.5 feet below ground. The surface soil samples will be collected in accordance with the sampling procedures provided in Section 3.4.2.1. 3.4.2 Soil Sampling Equipment and Procedures Sampling will occur in progression from less contaminated areas to more contaminated areas. At each sample location, surface debris (e.g., leaves, vegetation, rocks) will be removed from the surface before sampling commences. In paved areas, the asphalt or concrete will be cored prior to advancing the sampling tools. If refusal is encountered during borehole advancement or insufficient volume is obtained, the field team will step out approximately 5 feet from the first borehole location to permit the collection of the samples from the desired intervals.
R2-0000310
TRC Job No. 2710 Wip/R/OU2 SUPPLEMENTAL RI WORKPLAN
35
3.4.2.1 Surface Soil Sampling Surface soil samples will be collected to accomplish the horizontal delineation of several metals along the property line and to evaluate surface soil conditions in other areas. Surface soil samples will be collected using decontaminated or dedicated sampling equipment (i.e., stainless steel spoons, hand augers, scoop or equivalent soil coring tool) from exposed ground surface to 0.5 ft below ground. Surface soil samples for VOC analysis will be collected from 0.5 to 1 foot below surface. After removing the sample from the ground, the soil will be homogenized in a dedicated stainless steel bowl. Then the samples will be transferred directly into the sample containers and the bottles will be capped and, if necessary, the outside of the bottle wiped with a clean paper towel to remove excess soil. The sample containers will be labeled and placed in a cooler on ice to await transport to a New Jersey-certified laboratory. An EnCore sampler (one-time-use volumetric sampling and storage device) will be used to collect the sample for VOC analysis. During sample collection, the EnCore sampler will be removed from the re-sealable foil package and placed into the EnCore T-shaped handle. Prior to sample collection, the sampler must confirm that the plunger bottom is flush with the bottom of the coring body. The EnCore handle is then used to push the EnCore sampler directly into the soil matrix (of the selected 0.5 ft interval) and locked once the sample has been collected. The EnCore sampler will be removed from the handle and placed back into the foil package. The foil package will be labeled and placed in a cooler on ice for transport to a New Jersey-certified laboratory. The laboratory will extrude the soil sample from the EnCore® sampler and preserve it within 48 hours of sample collection. Following sample collection, the EnCore T-handle will be decontaminated for reuse at the next sample location. For the horizontal delineation sampling program, the analysis will be performed on an expedited turnaround (3 or 5 days) by a New Jersey-certified laboratory, except the surface soil samples collected from the Former Basins B9 and B10 and the Former Thermal Pond Area where the analysis will be performed on a normal turnaround time. If the surface soil sample results are above the EPA screening levels or NJDEP NRDCSRS, then, TRC and USEPA may determine if additional sampling is required. Flow Diagram A-1 summarizes the sample collection protocol for surface soil sampling. The soil will be classified using a modified Burmeister Classification System and soil logs will be prepared for each sampling location. Disposable gloves will be changed between each sample location and care will be taken to minimize contact of disposable gloves with soil to be sent for laboratory analysis. Following sample collection, the borings will be backfilled with soil removed during the sampling and the location of all soil borings will be staked and labeled. For quality assurance purposes, field blanks (one per day) and duplicates (one per 20 soil samples) will also be collected for analysis for the same analytical parameters. The aforementioned sampling procedure is summarized into the following step-by-step guidance:
1. Clear surface debris from the sampling location.
R2-0000311
TRC Job No. 2710 Wip/R/OU2 SUPPLEMENTAL RI WORKPLAN
36
2. Collect a surface soil sample using decontaminated or dedicated sampling equipment (i.e stainless steel spoons, hand augers, split spoon sampler or equivalent soil coring tool) from exposed ground surface to the 0.5 ft below ground.
3. Remove soil sample from the ground. Once the soil is homogenized, the sample will be
transferred directly into the sample containers.
4. Classify soil using a modified Burmeister Classification System. Lithologic descriptions should be recorded in the field logbook.
5. Complete sampling labels on each container and place the analytical samples in coolers
for shipment and chill to 4C.
6. Complete sample logs, custody seals, and chain of custody forms.
7. Soil sampling details should be recorded in a field logbook.
8. Return excess soil material to the borehole. 9. Stake and label the location of soil borings.
10. Initiate decontamination procedures of sampling equipment.
3.4.2.2 Subsurface Soil Sampling Soil borings will be advanced at the Former Manpro-Vibra Degreasing Unit and the Former Basins B9 and B10 using a direct-push Georprobe rig or hollow stem auger rig. Continuous soil samples will be collected from each boring from ground surface to the water table. Soil samples will be collected using decontaminated or dedicated sampling equipment (i.e., liners, split spoon sampler or equivalent soil coring tool). Once the core sampler (containing the soil sample) has been withdrawn from the subsurface, the liner or split spoon will be placed on a table covered with plastic sheeting. Each soil core will be screened with a properly calibrated PID (MiniRAE 2000 or equivalent) or FID (Photovac MicroFID or equivalent). A decontaminated stainless steel spoon or knife will be used to make a longitudinal score deep along the length of the soil core to disturb the soil surface. The probe will be positioned immediately above the exposed, lateral scoring area to record PI/FID measurements in 0.5-foot intervals to determine the appropriate sample location. Based on the field screening with the PID/FID, the 0.5-foot depth interval of soil which displays the highest PID/FID readings (or other evidence of impact, such as staining or sheens) will be selected for laboratory analysis on an expedited turnaround (3 or 5 days). When evidence of contamination is observed in a soil boring, then a contingency sample will be collected at a lower interval (2 to 3 feet) to accomplish the vertical delineation. In the event that no PID/FID readings are detected above background, then a soil sample will be collected from the 0.5 feet depth interval above the water table and analysis will be performed on a normal turnaround time by a New Jersey-certified laboratory. If the results of the contingency sample exceed the EPA screening levels or the NJDEP NRDCSRS, then the field team
R2-0000312
TRC Job No. 2710 Wip/R/OU2 SUPPLEMENTAL RI WORKPLAN
37
will be directed to step out and advance a second boring within 5 feet from the first one to accomplish the vertical delineation. An EnCore sampler (one-time-use volumetric sampling and storage device) will be used to collect the sample for VOC analysis. During sample collection, the EnCore sampler will be removed from the re-sealable foil package and placed into the EnCore T-shaped handle. Prior to sample collection, the sampler must confirm that the plunger bottom is flush with the bottom of the coring body. The EnCore handle is then used to push the EnCore sampler directly into the soil matrix (of the selected 0.5 ft interval) and locked once the sample has been collected. The EnCore sampler will be removed from the handle and placed back into the foil package. The foil package will be labeled and placed in a cooler on ice for transport to a New Jersey-certified laboratory. The laboratory will extrude the soil sample from the EnCore® sampler and preserve it within 48 hours of sample collection. Following sample collection, the EnCore T-handle will be decontaminated for reuse at the next sample location. Soil samples for other analysis will be homogenized and transferred directly into the sample containers. Once the sample has been transferred into the appropriate containers, the bottles will be capped and, if necessary, the outside of the bottle wiped with a clean paper towel to remove excess soil. The sample containers will be labeled and placed in a cooler on ice to await transport to a New Jersey-certified laboratory. Sample logs, custody seals, and chain of custody forms will be completed following the sampling activities. Analysis of subsurface soil samples with evidence of contamination will be performed on an expedited turnaround by a New Jersey-certified laboratory. The expedited turnaround of sampling results will facilitate active decision making in the field to rapidly delineate the horizontal and vertical extent of site contamination (i.e., Triad approach). It is anticipated that the laboratory will analyze the soil samples and provide the results via e-mail (or facsimile) to the project manager (PM) and/or Field Team Manager within 3 to 5 days of sample collection. Based on these expedited results, the PM and/or Field Team Manager will also determine if additional horizontal and/or vertical delineation borings are necessary and direct the sampling team accordingly. Flow Diagram A-2 summarizes the sample collection protocol for subsurface soil samples. Disposable gloves will be changed between each sample location. Care will be taken to minimize contact of disposable gloves with soil to be sent for laboratory analysis. Following sample collection, the borings will be backfilled with soil removed during the sampling and the location of all soil borings will be staked and labeled. The soil will be classified using a modified Burmeister Classification System. Soil logs will be completed after sample collection to minimize losses due to volatilization and potential cross contamination due to excessive handling of the soil. All lithologic descriptions, PID readings, and soil sampling details for each boring location will be recorded in a field logbook. For quality assurance purposes, field blanks (one per day) and duplicates (one per 20 soil samples) will also be collected for analysis for the same analytical parameters. The aforementioned sampling procedure is summarized into the following step-by-step guidance:
R2-0000313

TRC Job No. 2710 Wip/R/OU2 SUPPLEMENTAL RI WORKPLAN
38
1. Clear surface debris from the sampling location. 2. Collect continuous soil samples with liners, split spoon or coring device to the water
table. Withdraw and carefully open liner or split spoon. 3. Score the soil with a knife longitudinally and screen the exposed soil with a PID/FID in
0.5-foot increments.
4. Sample the 0.5-foot zone displaying the highest PID/FID reading for VOC analysis using an EnCore® Sampler. If no PID/FID readings are observed, the sample should be collected from the 0.5-foot interval above the water table. PID/FID readings should be recorded in a field log book.
5. Prior to collecting sample, hold coring body of EnCore® Sampler, and push plunger rod
down until small o-ring rests against tabs. This will assure that the plunger moves freely.
6. Depress locking level on EnCore® T-handle. Place coring body - plunger end first - into open end of T-handle, aligning the two slots on the coring body with the two locking pins in the T-handle. Twist coring body clockwise to lock pins in slots. Double check that sampler is locked in place prior to use.
7. To collect soil sample, turn T-handle such that “T” is up and coring body is down. This
position plunger bottom flushes with the bottom of the coring body; double check that plunger bottom is in position.
8. Using T-handle, push EnCore® Sampler into soil until coring body is completely full.
When full, the small o-ring will be centered in the T-handle viewing hole.
9. Remove sampler from soil. Wipe any excess soil from the exterior of the coring body.
10. Cap coring body while it is still on T-handle. Push cap over flat area of ridge. Push and twist cap to lock in place - cap must be seated over coring body ridges to seal sampler.
11. Remove capped EnCore® Sampler by depressing the locking lever on the T-handle while
twisting and pulling sampler from T-handle.
12. Lock plunger by rotating extended plunger rod fully counter-clockwise until wings rest firmly against tabs.
13. Attach a completed label (provided with the EnCore® Sampler in the bag) to the cap on
the coring body container. Place sampler in zipper bag provided, and seal bag.
14. Place initialed custody seal(s) over the top of the closed EnCore® bag, in such a manner that the bag cannot be opened (even partially); two or more custody seals may be needed.
R2-0000314

TRC Job No. 2710 Wip/R/OU2 SUPPLEMENTAL RI WORKPLAN
39
15. Attach a completed sample tag to the bag, using tape or other method, provided that the sample tag is securely fastened to the bag and will not become dislodged in transit.
16. Collect an additional aliquot of soil from each sample location in a separate jar, for
percent moisture determination by the laboratory.
17. Classify soil using a modified Burmeister Classification System. Lithologic descriptions should be recorded in the field logbook.
18. The remaining soil in the liner or split spoon from the target interval should be
homogenized in a decontaminated, stainless steel bowl. Once the sample has been homogenized, the sample will be transferred directly into the sample containers.
19. Complete sampling labels on each container and place the analytical samples in coolers
for shipment and chill to 4C.
20. Complete sample logs, custody seals, and chain of custody forms.
21. Soil sampling details should be recorded in a field logbook.
22. Return excess soil material to the borehole and place wooden stake to mark the location.
23. Initiate decontamination procedures on sampling equipment. 3.5 Surface Water Sampling Surface water samples were collected from Hudson Branch in 1990 and 1995 and from the Burnt Mill Pond and Burnt Mill Branch in 1995. Given the passage of time, current surface water quality conditions in the Hudson Branch, Burnt Mill Pond, and Burnt Mill Branch should be re-assessed to identify, verify and delineate potential environmental impacts that may be present in these water bodies.” Surface water samples will also be collected to evaluate background conditions and to consider potential remedial measures in the Feasibility Study. Surface water samples will be collected from the same station or transect location where sediment samples will be collected. At each location, the surface water sample will be collected first, followed by the collection of sediment samples. The samples will be collected sequentially beginning at the most downstream location and ending with the upstream location, to eliminate the potential for cross-contamination between sampling locations and ensure sample quality. 3.5.1 Proposed Surface Water Sample Location and Frequency Locations of proposed surface water samples are provide on Figure 17. A summary of the proposed
R2-0000315

TRC Job No. 2710 Wip/R/OU2 SUPPLEMENTAL RI WORKPLAN
40
surface water and sediment sampling is provided in Table 7. Table 6 provides the media volume and preservation requirements for the specific analyses to be performed. 3.5.1.1 Hudson Branch A total of seven surface water samples will be collected from the center of the stream channel at transects located on the Hudson Branch, which coincide with previous stations SW/SD-01, SD-10, SD-13, SD-15, SD-18, SW/SD-04, and SD-23. The surface water samples will be analyzed for TCL VOCs, TAL metals (total and dissolved), hexavalent chromium (total and dissolved), and hardness. Surface water samples will be collected in accordance with the sampling procedures provided in Section 3.5.2. 3.5.1.2 Burnt Mill Pond Four surface water samples are proposed at previous surface water samples SW-25 and SW-27 and at locations for previous sediment samples SD-26 and SD-29 to assess current surface water conditions in the pond. The surface water samples will be analyzed for TAL metals (total and dissolved), hexavalent chromium (total and dissolved) and hardness. If VOCs are detected in the Hudson Branch exceeding the EPA Water Quality Criteria or NJDEP screening criteria, then surface water samples will be collected from the Burnt Mill Pond for analysis of TCL VOCs. Surface water samples will be collected in accordance with the sampling procedures and protocols provided in Section 3.5.2. 3.5.1.3 Burnt Mill Branch Two surface water samples are proposed downstream of the Burnt Mill Pond. One surface water sample will be collected downstream of the Burnt Mill Pond at the location of previous sediment sample SD-28 and the second surface water sample (SW-38) will be collected approximately 500 feet downstream of previous sample SD-28. The surface water samples will be analyzed for TAL metals (total and dissolved), hexavalent chromium (total and dissolved), and hardness. A total of eight surface water samples will be collected upstream of the Burnt Mill Pond to evaluate background surface water conditions. The surface water samples will be collected at previous surface water/sediment locations SW-30/SD-30 and SW-31/SD-31, intersection of Burnt Mill Branch and Columbia Ave. (SW-32), midpoint between Columbia Ave. and West Blvd. (SW-33), intersection of Burnt Mill Branch and West Blvd. (SW-34), previous sediment location SD-35, intersection of Burnt Mill Branch and Madison Ave. (SW-36), and at an upstream location near Route 40 (SW-37). The surface water grab samples will be collected from the center of the stream channel and will be analyzed for TCL VOCs, TAL metals (total and dissolved), hexavalent chromium (total and dissolved), and hardness. Surface water samples will be collected in accordance with the sampling
R2-0000316

TRC Job No. 2710 Wip/R/OU2 SUPPLEMENTAL RI WORKPLAN
41
procedures provided in Section 3.5.2. 3.5.2 Surface Water Sampling Equipment and Procedures At each proposed sampling location, the sampler will attempt to identify a location within the surface water body where the stream flow is slow (e.g., pool, embayment) and would most likely represent a depositional area. At stations where surface water samples and sediment samples are proposed to be collected, the surface water will be collected first, followed by collection of the sediment samples. The samples will be collected sequentially beginning at the most downstream location and ending with the upstream location, to eliminate the potential for cross-contamination between sampling locations and ensure sample quality. Surface water samples will be collocated spatially and temporally with sediment samples. The sampling device (open mouth container) will be fully submerged (beneath the air-water interface) and located directly above the sediment bed, pointing the open mouth of the container upstream. Once the sample has been collected, the liquid sample will be transferred directly into the pre-preserved sample bottle. The pre-preserved sample containers will be labeled and placed in a cooler on ice to await transport to a New Jersey certified laboratory. Following the sample collection, water quality measurements (including temperature, pH, redox potential, turbidity, salinity, conductivity and dissolved oxygen) will be subsequently measured using field instrumentation (Horiba® water quality meter or equivalent). The sample location and field measurements will be recorded in a field logbook. A flow meter (Global water flow probe or other equivalent digital water velocity meter) will also be utilized to measure the stream flow within the mid-point of the stream channel. Finally, the sample location will be photographed, flagged and the physical characteristics (width and depth, flow) of the stream sampling location will be recorded in the field logbook. 3.6 Sediment Sampling The objective of the sediment sampling program will be to evaluate current conditions and delineate the extent of sediment contamination in the Hudson Branch and Burnt Mill Pond. Sediment samples will also be collected from the Burnt Mill Branch to assess background conditions. The samples will be collected sequentially beginning at the most downstream location and ending with the upstream location, to eliminate the potential for cross-contamination between sampling locations and ensure sample quality. 3.6.1. Proposed Sediment Sample Location and Frequency Locations of proposed sediment samples are provided on Figure 17. Table 7 provides a summary of the proposed sediment sampling program. Table 6 provides the media volume and preservation requirements for the specific analyses to be performed. 3.6.1.1 Hudson Branch
R2-0000317
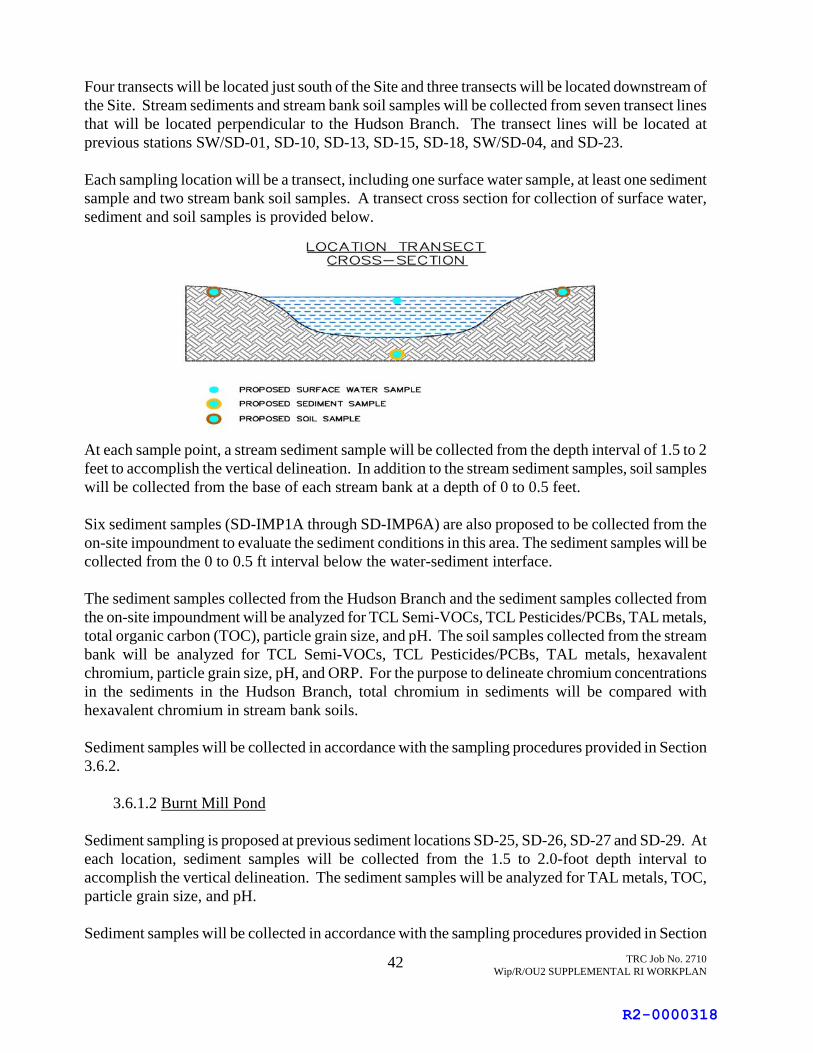
TRC Job No. 2710 Wip/R/OU2 SUPPLEMENTAL RI WORKPLAN
42
Four transects will be located just south of the Site and three transects will be located downstream of the Site. Stream sediments and stream bank soil samples will be collected from seven transect lines that will be located perpendicular to the Hudson Branch. The transect lines will be located at previous stations SW/SD-01, SD-10, SD-13, SD-15, SD-18, SW/SD-04, and SD-23. Each sampling location will be a transect, including one surface water sample, at least one sediment sample and two stream bank soil samples. A transect cross section for collection of surface water, sediment and soil samples is provided below.
At each sample point, a stream sediment sample will be collected from the depth interval of 1.5 to 2 feet to accomplish the vertical delineation. In addition to the stream sediment samples, soil samples will be collected from the base of each stream bank at a depth of 0 to 0.5 feet. Six sediment samples (SD-IMP1A through SD-IMP6A) are also proposed to be collected from the on-site impoundment to evaluate the sediment conditions in this area. The sediment samples will be collected from the 0 to 0.5 ft interval below the water-sediment interface. The sediment samples collected from the Hudson Branch and the sediment samples collected from the on-site impoundment will be analyzed for TCL Semi-VOCs, TCL Pesticides/PCBs, TAL metals, total organic carbon (TOC), particle grain size, and pH. The soil samples collected from the stream bank will be analyzed for TCL Semi-VOCs, TCL Pesticides/PCBs, TAL metals, hexavalent chromium, particle grain size, pH, and ORP. For the purpose to delineate chromium concentrations in the sediments in the Hudson Branch, total chromium in sediments will be compared with hexavalent chromium in stream bank soils. Sediment samples will be collected in accordance with the sampling procedures provided in Section 3.6.2. 3.6.1.2 Burnt Mill Pond Sediment sampling is proposed at previous sediment locations SD-25, SD-26, SD-27 and SD-29. At each location, sediment samples will be collected from the 1.5 to 2.0-foot depth interval to accomplish the vertical delineation. The sediment samples will be analyzed for TAL metals, TOC, particle grain size, and pH. Sediment samples will be collected in accordance with the sampling procedures provided in Section
R2-0000318
TRC Job No. 2710 Wip/R/OU2 SUPPLEMENTAL RI WORKPLAN
43
3.6.2. 3.6.1.3 Burnt Mill Branch Two sediment samples are proposed downstream of the Burnt Mill Pond to evaluate sediment conditions in the Burnt Mill Branch. One sediment sample is proposed at previous sediment sample SD-28 and the second sediment sample (SD-38) is proposed approximately 500 feet downstream of SD-28. At these locations, sediment samples will be collected from the 0 to 0.5-foot depth interval to evaluate current sediment conditions. The sediment samples will be analyzed for TAL metals, TOC, particle grain size, and pH. A total of eight sediment samples will be collected from the Burnt Mill Branch (upstream of the Burnt Mill Pond) to evaluate background conditions. At each location, sediment samples will be collected from the 0 to 0.5-foot depth interval beneath the sediment surface. Background sediment samples will coincide with the locations for background surface water samples. The sediment samples will be collected at previous surface water/sediment locations SW-30/SD-30 and SW-31/SD-31, intersection of Burnt Mill Branch and Columbia Ave. (SW/SD-32), midpoint between Columbia Ave. and West Blvd. (SW/SD-33), intersection of Burnt Mill Branch and West Blvd. (SW/SD-34), previous sediment location SD-35, intersection of Burnt Mill Branch and Madison Ave. (SW/SD-36), and at the upstream location near Route 40 (SW/SD-37). The background sediment samples will be collected from the center of the stream channel and will be analyzed for TCL Semi-VOCs, TCL Pesticides/PCBs, TAL metals, TOC, particle grain size, and pH. The sediment samples will be collected in accordance with the sampling procedures provided in Section 3.6.2. 3.6.2 Sediment Sampling Equipment and Procedures Prior to sample collection, a GPS unit will be used to relocate sediment sample locations. At stations where surface water samples and sediment samples are proposed to be collected, the surface water will be collected first, followed by collection of the sediment samples. The samples will be collected sequentially beginning at the most downstream location and ending with the upstream location, to eliminate the potential for cross-contamination between sampling locations and ensure sample quality. The sediment samples will be retrieved using a decontaminated 4-inch diameter PVC pipe that will be driven into the sediment to a pre-determined depth based on the proposed depth(s) of sample collection. At a minimum, the pipe will be driven 0.5-foot deeper than the deepest sample interval. Prior to installation, the pre-determined depth will be marked on the outside of the PVC piping so as to provide a visual reference during installation. Note that this depth will be modified as necessary (e.g., increased) to account for standing water. Sediment samples will be collected within the pipe using decontaminated stainless steel hand augers or a sediment core sampler. The technique will allow for the collection of sediment samples with minimal collapse of the borehole, as the PVC pipe will impede the influx of water. At locations for transects, stream bank samples will be collected from the 0.5-foot depth interval
R2-0000319

TRC Job No. 2710 Wip/R/OU2 SUPPLEMENTAL RI WORKPLAN
44
below surface. The stream bank samples will be collected using decontaminated or dedicated sampling equipment (i.e., hand augers, scoops, core samplers or stainless steel spoons). The contents from each auger, scoop, core sampler, or stainless steel spoon will be placed into a dedicated stainless steel mixing bowl and homogenized. The sediment samples will be geologically logged for grain size, color, texture, consistency, and other physical parameters (e.g., stains, odors, etc,) and the observations will be recorded in a field notebook. Once homogenized, the sample will be transferred into appropriate sample containers. The field samplers will complete sample logs, labels, custody seals, and chain of custody forms and record all sampling details in the field logbook. The sediment sample locations are subject to field adjustment, based on site conditions and observations made at the time of sample collection. Decisions regarding final sample locations may be based on accessibility restrictions, discharge points, sediment depositional zones and other factors that may be encountered or observed during the field sampling. The sediment sample locations will be photographed, flagged and the physical characteristics (width and depth, flow) of the stream sampling location will be recorded in the field logbook. It is anticipated that no wetland permits or other permits will be required to collect sediment samples from the stream since hand tools will be used to collect the sediment samples. All analysis of sediment and stream bank samples will be performed on a normal turnaround by a New Jersey-certified laboratory. Flow Diagram A-3 summarizes the sample collection protocol for sediment/soil samples. 3.7 Sample Handling and Custody Requirements The TRC Field Team Manager will coordinate with the laboratory for shipment and receipt of sample bottle, coolers, and Chain-of-Custody forms. Upon completion of sampling, the Chain-of-Custody will be filled out and returned with the samples to the laboratory. An important consideration for the collection of environmental data is the ability to demonstrate that the analytical samples have been obtained from predetermined locations and that they have reached the laboratory without alteration. Documentation will be accomplished through a Chain-of-Custody record that records each sample and the names of the individuals responsible for sample collection, transport, and receipt. A sample is considered in custody if it is:
in a person’s actual possession; in view after being in physical possession; securely sealed so that no one can tamper with it after having been in physical custody; or in a secured area, restricted to authorized personnel.
Sample custody will be initiated by field personnel upon collection of samples. Sample labels will be securely affixed to each sample container. Sample labels will clearly identify the particular sample, and delineate the following information:
Site name and designated project number;
R2-0000320

TRC Job No. 2710 Wip/R/OU2 SUPPLEMENTAL RI WORKPLAN
45
Sampling location; Sample matrix (media type); Sample identification number (following the unique sample identification included on the
media specific sampling summary tables); Date and time the sample was collected; Sample preservation method; Sample pH (if appropriate); Analytical method requested; and Laboratory turnaround (standard or expedited).
The samplers and Field Team Manager will, prior to shipment, physically inspect all sample bottles prepared for pickup or shipment. Samples will be packaged to prevent breakage or leakage during transport, and will be delivered to the laboratory by laboratory courier service or directly transported by TRC vehicle. The Field Team Manager will carefully review each Chain-of-Custody and compare it with the contents of the accompanying cooler to confirm the accuracy of the custody record. Each individual who has the sample in his or her possession will sign the Chain-of-Custody record.
The original Chain-of-Custody record will be sealed in a watertight envelope, taped to the top (inside) of the shipping container, and the shipping container sealed prior to being given to the transport technician or laboratory courier. A copy of the Chain-of-Custody record will be kept on-site. If shipping by commercial carrier, the waybill will serve as an extension of the Chain-of-Custody record between the final field custodian and receipt by the laboratory.
Upon receipt at the laboratory, a laboratory technician, or designated representative, shall open the shipping container(s), compare the contents with the Chain-of-Custody record, and sign and date the record. Any discrepancies shall be noted on the Chain-of-Custody record.
3.8 Reporting Requirements A record of field observations and procedural methodologies will be kept in field logbooks throughout the duration of the dynamic field effort. The field team will review all field notes recorded each day for accuracy and completeness. Large site maps will be maintained in the field headquarters, and all sampling locations will be marked in the field and hand-plotted on these maps each day. Plotted data are to include GPS coordinates and photograph identification numbers. The spatial relationship of data will be tracked on the maps throughout the duration of the field program, thereby assisting the field team in making in-field decisions. For some parameters and sample sets, it is anticipated that the laboratory will provide the analytical results from the previous day of sampling via e-mail (or facsimile) to the Project Manager and/or Field Team Manager within 3 to 5 days of collection. Based on these expedited results, the Project Manager/Field Team Manager will determine if additional sampling is required and direct the sampling team accordingly. All directives given by the Project Manager/Field Team Manager and other field decisions related to the additional delineation sampling will be recorded in the field logbook (e.g., area to be further delineated, sampling rationale, new sampling identification numbers, and analytical parameters).
R2-0000321

TRC Job No. 2710 Wip/R/OU2 SUPPLEMENTAL RI WORKPLAN
46
A representative of the project management team will be responsible for providing representatives of the regulatory agencies periodic project updates. At a minimum, such updates will occur when the field team believes that all field delineation efforts are about to be completed at any particular area, or in the event of an anticipated scope and/or schedule change. Representatives from the TRC project team will coordinate with USEPA representatives to meet at the field headquarters to review the findings of the dynamic field efforts prior to demobilizing from the Site. In this way, a consensus can be reached with respect to the adequate acquisition of all required field information.
3.9 Decontamination
Decontamination will be conducted in accordance with the USEPA’s August 11, 1994 SOP No. 2006, “Sampling Equipment Decontamination” and the NJDEP Field Sampling Procedures Manual (2005). Proper decontamination is required for all personnel before leaving the site. A decontamination area shall be designated within the Contamination Reduction Zone prior to the implementation of field activities and shall be cordoned off to restrict unauthorized personnel. The decontamination will be accomplished through a systematic procedure of cleaning and removing PPE. Contaminants can adhere to the surface of PPE or permeate PPE material. It is important to avoid bodily contact with contaminated material, and to prevent contamination of the Support Zone. All contaminated material that becomes attached to clothing or equipment must be removed and/or neutralized in either the Exclusion Zone or the Contamination Reduction Zone. PPE decontamination will include the following: washing of boots (or the removal and disposal of boot covers); washing, removal and disposal of disposable coveralls (or protective suits); removal and disposal of outer and inner gloves and finally, washing of hands, arms and face prior to leaving the site. Disposable PPE will be carefully removed and placed in plastic bags and sealed. When reusable personal protective equipment is worn, it must be decontaminated on site. After cleaning, the reusable protective equipment will be sealed in plastic bags for return shipment. All non-disposable equipment involved in field sampling activities will be decontaminated prior to and after sampling. Equipment leaving the Site will also be decontaminated. Alconox and water wash will be used to remove all visible particulate matter and residual oils and grease. This may be preceded by using high pressure water or steam to facilitate residual removals. All heavy equipment (e.g., Geoprobe or other drilling equipment) will be steam cleaned prior to and after use. Pressurized steam will be used to remove all visible excess material from augers, rods, drill bits, the back of the drilling rig, and other parts of the rig which contact augers, rods, and split-spoons. Field instrumentation (such as interface probes, water quality meters, etc.) will be decontaminated between sample locations by rinsing with deionized water. If visible contamination still exists on the equipment after the rinse, an Alconox detergent scrub will be added, and the probe thoroughly rinsed again. All sampling equipment will be properly decontaminated prior to entering the field and before advancing to each new sample location. The field sampling equipment cleaning and decontamination procedures are as follows:
Laboratory grade glassware detergent plus tap water wash Generous tap water rinse
R2-0000322

TRC Job No. 2710 Wip/R/OU2 SUPPLEMENTAL RI WORKPLAN
47
Distilled and deionized (ASTM Type II) water rinse 10% nitric acid rinse (trace metal or higher grade HNO3 diluted with distilled and
deionized [ASTM Type II] H2O) Distilled and deionized (ASTM Type II) water rinse Acetone (pesticide grade) rinse (if sample is analyzed for organics) Total air dry Distilled and deionized (ASTM Type II) water rinse.
All decontaminated sampling equipment will be subsequently wrapped and/or sealed in plastic (or foil) during storage and prior to use. The decontamination process will be carried out over an open drum. All decontamination wastes will be properly disposed at an approved disposal facility. The field team will document each decontamination event (time, date, equipment) in the field logbook. 3.10 Field Equipment Calibration All field equipment will be calibrated in accordance with the manufacturer’s instructions (using specific reference materials and test procedures) prior to the initiation of each field sampling. Any equipment which provides unusual responses or questionable results should be re-calibrated to perform satisfactorily. If extreme vapor concentrations are measured during field screening, the equipment should be re-calibrated to ensure proper field measurements. Any equipment that has been shown to be defective, should be deactivated, labeled and stored at a specified place until it can be repaired. The sampling team will record the daily field equipment calibration activities in the field logbook with a clear description of equipment type, manufacturer name and identification number, calibration test performed and results, time and date. 3.11 Investigation-Derived Waste Investigation derived waste (IDW) residuals will be containerized and sampled to make a hazardous waste determination. Following generation, the IDW will be containerized and staged adjacent and south of the treatment plan to await characterization. Based on the sampling results and consultation with the EPA Remedial Project Manager, a subsequent determination shall be made whether IDW can be placed on-site. Personnel directly involved in equipment decontamination will wear appropriate protective clothing, as stated in the HASP. Used PPE and any gross solids removed from the equipment during the physical removal process shall be stored in a drum. The soap and water liquid wastes will also be stored in an appropriate drum or container. The diluted acid rinsate will be stored in an appropriate container or neutralized with a base and then placed in an appropriate drum. The solvent rinse wastewater shall be placed into an appropriate container or drum. The final rinse wastewater shall be emptied onto the ground. All waste handling will be conducted in accordance with all applicable federal and state regulations. The containers used to store IDW will be new USDOT-approved drums classified as 1A1/Y 340/S (r equivalent lined with a 6-millimeter liner). The drums will be labeled with the generation date, unique drum number and a TRC I.D. sticker. The drums will be staged in a designated area and will be disposed of by TRC.
R2-0000323

TRC Job No. 2710 Wip/R/OU2 SUPPLEMENTAL RI WORKPLAN
48
3.12 Schedule A project schedule for the performance of the supplemental RI/FS activities is provided on Figure 18. The Site Characterization (Task 3) component on Figure 18 refers to the field program covered by this OU2 SUPPLEMENTAL RI WORKPLAN. This draft schedule is subject to change pending regulatory approvals and contractor availability.
R2-0000324

TRC Job No. 2710 Wip/R/OU2 SUPPLEMENTAL RI WORKPLAN
49
4.0 PROJECT ORGANIZATION AND RESPONSIBILITIES The project team will include the following personnel:
TRC PROJECT COORDINATOR will be the main TRC contact for the project and will be responsible for ensuring that the project is being implemented in accordance with the USEPA approved work plans and the OU2 SUPPLEMENTAL RI WORKPLAN. The TRC Project Coordinator is responsible for ensuring that these practices, policies, objectives and procedures are communicated to, and understood, implemented, and adhered to by all personnel. The TRC Project Coordinator, also designated as the Project Coordinator under the Order, will be the focal point for contact with the USEPA Project Coordinator and other regulatory personnel and will be directly supported by the TRC Project Manager, Field Team Manager, the TRC Quality Assurance (QA) Manager, and where appropriate, the Laboratory Manager and/or the Laboratory QA Manager. Patrick Hansen has been approved by the USEPA as the Project Coordinator for the Shieldalloy Metallurgical Site RI.
TRC PROJECT MANAGER will ensure that all the technical, administrative, and regulatory
compliance objectives are met on a day-to-day basis. The TRC Project Manager will regularly interface with the Project Coordinator and the Field Team Manager. The TRC Project Manager will serve as a secondary liaison to USEPA and other regulatory personnel, in support of the TRC Project Coordinator, and attend all regulatory meetings. The TRC Project Manager will be responsible for the successful completion of the project ( in terms of budget, schedule, data quality objectives), coordinating with technical task leaders, interpreting site data, and providing input into the development and finalization of key technical deliverables. Jorge Gomez will serve as the TRC Project Manager for this project.
TRC QA MANAGER will ensure that all elements of the QAPP are followed. Where QA or
Quality Control (QC) issues arise, the TRC QA Manager will be contacted by the Project Manager, Field Team Manager or Laboratory QA Manager, depending on the nature of the issue, for guidance and resolution. The TRC QA Manager will report directly to the TRC Project Coordinator and shall remain independent from all data generators and users. Elizabeth Denly will serve as the TRC QA Manager for this project.
TRC FIELD TEAM MANAGER will be responsible for overseeing field activities on a day-
to-day basis. The TRC Field Team Manager will ensure that all field work is conducted in accordance with the approved work plans and this OU2 SUPPLEMENTAL RI WORKPLAN. Should potential issues arise, the TRC Field Team Manager will contact the TRC Project Manager, TRC QA Manager, Laboratory QA Manager or TRC Project Coordinator, as appropriate.
TRC SITE SAFETY OFFICER will be responsible for ensuring all field activities are being
implemented in accordance with the Health & Safety Plan and when necessary, evaluating new hazards and operation changes. The Site Safety Officer has the authority to correct all noncompliance situations immediately and to stop work in cases of immediate danger.
R2-0000325

TRC Job No. 2710 Wip/R/OU2 SUPPLEMENTAL RI WORKPLAN
50
TRC ENVIRONMENTAL SCIENTISTS/GEOLOGISTS will be responsible for performing field activities in accordance with the approved workplans and this OU2 SUPPLEMENTAL RI WORKPLAN on a day-to-day basis. Should potential issues arise, these technical specialists will contact the TRC Field Team Manager or TRC Project Manager, as appropriate.
LABORATORY MANAGER will be responsible for ensuring that the laboratory follows the
laboratory QAPP and all laboratory standard operating procedures (SOPs). In addition, the Laboratory Manager will sign off on all of the data packages to further document that all Laboratory quality assurance program and SOP procedures have been followed and that the data are legally defensible. The Laboratory Manager is responsible for administering the operations of the Environmental Laboratory in accordance with N.J.A.C. 7:18, 40 CFR 136, and any other applicable regulations. This includes the reporting of tests and analyses and personal or telephone consultation with Environmental Laboratory staff and the USEPA, when necessary. If the manager is to be absent, the manager shall arrange for a substitute. The Laboratory Manager is also responsible for signing reports of analytical data and for assuring that all laboratory personnel meet the applicable requirements of N.J.A.C. 7:18-2:10(b) for their classification. If the manager assigns a designee to sign reports, the laboratory shall inform the USEPA of the designee’s name and authority to sign reports.
LABORATORY QUALITY ASSURANCE (QA) MANAGER is responsible for the day-to-
day oversight and review of all QA/QC and for overall technical operation and stewardship of the Environmental Laboratory and will be required to ensure that laboratory staff follows the Laboratory QA Manual (QAM) and SOP requirements. The Laboratory QA Manager is responsible for ensuring that all requirements of N.J.A.C. 7:18, 40 CFR Part 136 and any other applicable regulations are met. As such, the QA Manager shall monitor the performance of technical personnel performing the analyses of all parameters. He or she shall oversee the performance and result reporting of all laboratory procedures, tests, analyses, and quality assurance (for which he or she is qualified) to determine and assure compliance with applicable regulations. The QA Manager shall implement and be responsible for the Laboratory’s Quality System, per N.J.A.C. 7:18-5.5 and 8.4, and ensure that the QA policies/objectives and the QC procedures outlined in the laboratory’s Quality System manual (Appendix A for HCL, Appendix B for Paradigm Laboratory and Appendix C for TRC), in laboratory’s NJDEP Sanctioned Analytical Methods (DSAM), and in N.J.A.C. 7:18 are followed. The QA Manager shall objectively evaluate laboratory data and shall review and approve all reported compliance results. In the event that the Laboratory QA Manager is absent, he or she must designate a substitute to perform the above duties. The substitute must meet the requirements and qualifications for Laboratory QA Manager outlined in N.J.A.C. 7:18-2.10. The Laboratory QA Manager shall conduct internal audits, notify the Laboratory Manager of deficiencies found, and identify and monitor corrective action. Where technical project QA/QC issues arise, the Laboratory QA Manager must advise the Laboratory Manager, TRC QA Manager and/or the TRC Field Manager as appropriate.
LABORATORY TECHNICIANS are responsible for performing all analyses in accordance
with approved analytical methods to help control process variables and to determine
R2-0000326

TRC Job No. 2710 Wip/R/OU2 SUPPLEMENTAL RI WORKPLAN
51
compliance with the QAPP.
DRILLING SUBCONTRACTOR is responsible for drilling permits, licenses, clearances, and supplying all services (including labor), equipment, and material required to perform soil borings, in addition to all maintenance and quality control of such equipment. The drilling subcontractor will be responsible for following decontamination and health and safety procedures specified in the OU2 SUPPLEMENTAL RI WORKPLAN, HASP and in the bid package. Upon completion of the work, the drilling subcontractor will be responsible for demobilizing all equipment and properly backfilling any borings.
SURVEYING SUBCONTRACTOR is responsible for supplying all services (including
labor), equipment, and material required to perform surveys of the Site and sampling locations.
R2-0000327
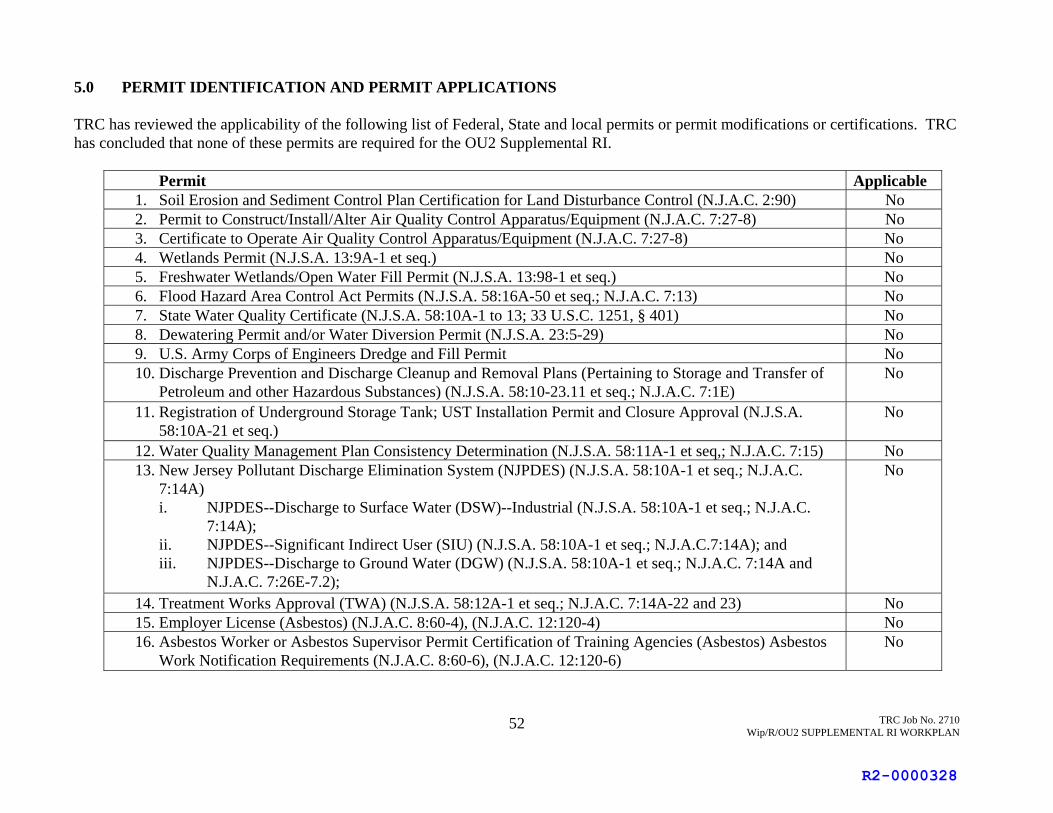
TRC Job No. 2710 Wip/R/OU2 SUPPLEMENTAL RI WORKPLAN
52
5.0 PERMIT IDENTIFICATION AND PERMIT APPLICATIONS TRC has reviewed the applicability of the following list of Federal, State and local permits or permit modifications or certifications. TRC has concluded that none of these permits are required for the OU2 Supplemental RI.
Permit Applicable 1. Soil Erosion and Sediment Control Plan Certification for Land Disturbance Control (N.J.A.C. 2:90) No 2. Permit to Construct/Install/Alter Air Quality Control Apparatus/Equipment (N.J.A.C. 7:27-8) No 3. Certificate to Operate Air Quality Control Apparatus/Equipment (N.J.A.C. 7:27-8) No 4. Wetlands Permit (N.J.S.A. 13:9A-1 et seq.) No 5. Freshwater Wetlands/Open Water Fill Permit (N.J.S.A. 13:98-1 et seq.) No 6. Flood Hazard Area Control Act Permits (N.J.S.A. 58:16A-50 et seq.; N.J.A.C. 7:13) No 7. State Water Quality Certificate (N.J.S.A. 58:10A-1 to 13; 33 U.S.C. 1251, § 401) No 8. Dewatering Permit and/or Water Diversion Permit (N.J.S.A. 23:5-29) No 9. U.S. Army Corps of Engineers Dredge and Fill Permit No 10. Discharge Prevention and Discharge Cleanup and Removal Plans (Pertaining to Storage and Transfer of
Petroleum and other Hazardous Substances) (N.J.S.A. 58:10-23.11 et seq.; N.J.A.C. 7:1E) No
11. Registration of Underground Storage Tank; UST Installation Permit and Closure Approval (N.J.S.A. 58:10A-21 et seq.)
No
12. Water Quality Management Plan Consistency Determination (N.J.S.A. 58:11A-1 et seq,; N.J.A.C. 7:15) No 13. New Jersey Pollutant Discharge Elimination System (NJPDES) (N.J.S.A. 58:10A-1 et seq.; N.J.A.C.
7:14A) i. NJPDES--Discharge to Surface Water (DSW)--Industrial (N.J.S.A. 58:10A-1 et seq.; N.J.A.C.
7:14A); ii. NJPDES--Significant Indirect User (SIU) (N.J.S.A. 58:10A-1 et seq.; N.J.A.C.7:14A); and iii. NJPDES--Discharge to Ground Water (DGW) (N.J.S.A. 58:10A-1 et seq.; N.J.A.C. 7:14A and
N.J.A.C. 7:26E-7.2);
No
14. Treatment Works Approval (TWA) (N.J.S.A. 58:12A-1 et seq.; N.J.A.C. 7:14A-22 and 23) No 15. Employer License (Asbestos) (N.J.A.C. 8:60-4), (N.J.A.C. 12:120-4) No 16. Asbestos Worker or Asbestos Supervisor Permit Certification of Training Agencies (Asbestos) Asbestos
Work Notification Requirements (N.J.A.C. 8:60-6), (N.J.A.C. 12:120-6) No
R2-0000328

TRC Job No. 2710 Wip/R/OU2 SUPPLEMENTAL RI WORKPLAN
53
17. National Emission Standards for Hazardous Air Pollutants (NESHAPs) Written Notification Requirements;
No
18. Landfill Disruption/Closure Approval (N.J.S.A. 13:1E-1 et seq.; N.J.A.C. 7:26-2A.8; N.J.A.C. 7:26-2A.9) No 19. Hazardous Waste Facility Registration (N.J.S.A. 13:1E-1 et seq.; N.J.A.C. 7:26G) No 20. Short Term Water Use Report No 21. Well Drilling Permit, and Well Certification Forms A & B; (N.J.S.A. 58:4A-14; N.J.A.C. 7:9D) No 22. Well Abandonment Form; No 23. Exemption of Waste Flow Rule (Soil Reuse); No 24. Hazardous Waste Generator Identification Number (N.J.A.C. 7:26G); No 25. Hazardous Waste TSD Facility Permit, except that hazardous waste treatment, storage, or disposal facility
permits pursuant to the Solid Waste Management Act, N.J.S.A. NOTE: THIS IS A COURTESY COPY OF THIS RULE. ALL OF THE DEPARTMENT'S RULES ARE COMPILED IN TITLE 7 OF THE NEW JERSEY ADMINISTRATIVE CODE. 141 13:1E-1 et seq., and the Hazardous Waste rules at N.J.A.C. 7:26G, shall not be required for any remediation conducted on site pursuant to the Administrative Requirements for the Remediation of Contaminated Sites rules, N.J.A.C. 7:26C; and
No
26. Any other Federal, State or local approvals that may be required. No
R2-0000329

TRC Job No. 2710 Wip/R/OU2 SUPPLEMENTAL RI WORKPLAN
54
6.0 REFERENCES N.J.A.C. 7:26E - Technical Requirements for Site Remediation (2010) NJDEP Field Sampling Procedures Manual (2005) NJDEP, 2001. Basin Closure, NJDEP letter, August 10, 2001. Schoor DePalma, 1994. Environmental Report, Wetlands and State Open Waters Delineation,
Shieldalloy Metallurgical Corporation, Newfield, New Jersey, Schoor DePalma, May 1994.
TRC, 1992. Remedial Investigation Technical Report, Shieldalloy Metallurgical Corporation,
Newfield, New Jersey, TRC Environmental Corporation, April 1992. TRC, 1993. Soil Sampling Results, Former Lagoons B9 and B10, Shieldalloy Metallurgical
Corporation, Newfield, New Jersey, TRC Environmental Corporation, March 1993. TRC, 1995. Closure Plan-Surface Impoundments B-1, B-2, B-3, B-5, B-11 and B-12,
Shieldalloy Metallurgical Corporation, Newfield, New Jersey, TRC Environmental Corporation, August 1995.
TRC, 1996a. Draft Final Feasibility Study Report, Shieldalloy Metallurgical Corporation,
Newfield, New Jersey, TRC Environmental Corporation, April 1996. TRC, 1996b. Supplemental Wetland Sediment Sampling Letter Report, Shieldalloy
Metallurgical Corporation, Newfield, New Jersey, TRC Environmental Corporation, May 1996.
TRC, 1999. Lagoon Closure Report, Shieldalloy Metallurgical Corporation, Newfield, New Jersey, TRC Environmental Corporation, December 1999. TRC, 2000. Supplemental Soil Sampling Report, Former Lagoon B11, Shieldalloy Metallurgical Corporation, Newfield, New Jersey, TRC Environmental Corporation, October 2000. TRC, 2001a. Final Supplemental Soil Sampling Report, Former Lagoons B6, B7 and B8,
Shieldalloy Metallurgical Corporation, Newfield, New Jersey, TRC Environmental Corporation, February 2001.
TRC, 2001b. Final Supplemental Soil Sampling Report, Former Lagoons B1, B2, B3, B5, B11
and B12, Shieldalloy Metallurgical Corporation, Newfield, New Jersey, TRC Environmental Corporation, February 2001.
TRC, 2006. 2006 Sediment Sampling Work Plan, Shieldalloy Metallurgical Corporation,
Newfield, New Jersey, TRC Environmental Corporation, August 2006.
R2-0000330

TRC Job No. 2710 Wip/R/OU2 SUPPLEMENTAL RI WORKPLAN
55
TRC, 2008. Phase II Supplemental Offsite Ground Water Investigation Work Plan, Shieldalloy Metallurgical Corporation, Newfield, New Jersey, TRC Environmental Corporation, August 2008.
TRC, 2009. Supplemental Sediment Sampling Summary, Shieldalloy Metallurgical Corporation,
Newfield, New Jersey, TRC Environmental Corporation, June 2009. USEPA - SOP No. 2006, “Sampling Equipment Decontamination” (August 11, 1994) USEPA, 1988 – Guidance for Conducting Remedial Investigations and Feasibility Studies Under
CERCLA. Office of Emergency and Remedial Response, USEPA, Washington, DC. USEPA Region 2 Guidance for the Development of Quality Assurance Project Plans for
Environmental Monitoring Projects, April 12, 2004. US Bankruptcy Court, 1997. Environmental Settlement Agreement (ESA) between SMC and
USEPA/NJDEP. Incorporated into SMC’s Plan of Reorganization Pursuant to Chapter 11 of the Bankruptcy Code, March 1997.
R2-0000331

FIGURES
R2-0000332

SOURCE: NEWFIELD, N.J. QUADRANGLE, 1953, PHOTOREVISED 1994, 7.5 MINUTE SERIES (USGS TOPOGRAPHIC MAP)
SITE PROPERTY BOUNDARY
0 2000 FT. ------APPROXIMATE SCALE
TRC ENVIRONMENTAL CORP. 57 East Willow Street TRC Millburn, New Jersey 07041
SITE LOCATION MAP
SHIELDALLOY METALLURGICAL CORPORATION NEWFIELD. NEW JERSEY
JOB NO.: 2710ES-112434-00SOIL-002500
JG/LB DATE: JANUARY 2011 FIGURE: 1
R2-0000333

1. :I J!!!, _
__
__
__
_ _
II I II
.. f
.. f . ' +
1
!i! I ~ ~
~ ~ I I·
%
a
+a h
~
a
f +
z t +
R2-0000334

(0�0.5)VOCs NE
RA�34
(0.5�1) (1.5�2)VOCs NE NE
RA�59
(0.5�1) (1.5�2)VOCs NE NE
RA�60
(�12�)VOCs NE
TP�01
(�11�)VOCs NE
TP�02
(�8�)VOCs NE
TP�03
(�7�)VOCs NE
TP�04
(�5�)VOCs NE
TP�05
(2�4)VOCs NE
SB�02
(2�4)VOCs NE
SB�03
(4�6)VOCs NE
SB�04
(2�4)VOCs NE
SB�05
(2�4)VOCs NE
SB�06
(4�6)VOCs NE
SB�07
(6�8)VOCs NE
SB�20
(8�10)VOCs NE
SB�22
(4�6)VOCs NE
SB�24
(2�4)VOCs NE
SB�27
(0�2) (6�8)VOCs NE NE
SB�29
(6�8)VOCs NE
SB�32(6�8)
VOCs NE
SB�39
(2�4) (8�10)VOCs NE NE
SB�40(2�4)
VOCs NE
SB�41
(0�2) (6�8) (8�10)VOCs NE NE NE
SB�42
(2�4) (4�6)VOCs NE NE
SB�45
(0�2) (6�8)VOCs NE NE
SB�46
(6�8)VOCs NE
SB�47
(6�8)VOCs NE
SB�55
(2�4)VOCs NE
SB�60
(0�2) (6�8)VOCs NE NE
SB�72
(2�4) (6�8)VOCs NE NE
SB�73
(4�6)VOCs NE
SB�77
(8�10)VOCs NE
SB�84
(0.5�1) (1.5�2)VOCs NE NE
RA�60
(0.5�1) (1.5�2)VOCs NE NE
RA�58
(0�2) (2�4)VOCs NE NE
SB�44
(4�6)VOCs NE
SB�13
(2�4)VOCs NE
SB�01
(2�3)VOCs NE
SG�23
(2�3)VOCs NE
SG�14
(5�6)VOCs NE
SG�6
(2�3) (5�6) (9�10)VOCs NE NE NE
SG�3
(5�6)VOCs NE
SG�1
(���)VOCs NE
B9�2
(���)VOCs NE
B10�3
Analyte
Trichloroethene (TCE) 14 20Tetrachloroethene (PCE) 2.6 51,2-Dichloroethene 9,200 3Benzene 5.4 5Toluene 45,000 91,000Ethylbenzene 27 110,000Total Xylenes 2,700 170,000
EPA REGIONAL SCREENING LEVELS, INDUSTRIAL SOIL, MAY 2010.NJDEP NON-RESIDENTIAL DIRECT CONTACT SOIL REMEDIATION STANDARDS, 2008CONCENTRATIONS ARE REPORTED IN PARTS PER MILLION (PPM) OR MILLIGRAMS PER KILOGRAM (MG/KG)
NJDEP NRDCSRS (2)EPA Screening Levels
Industrial Soil (1)
R2-0000335
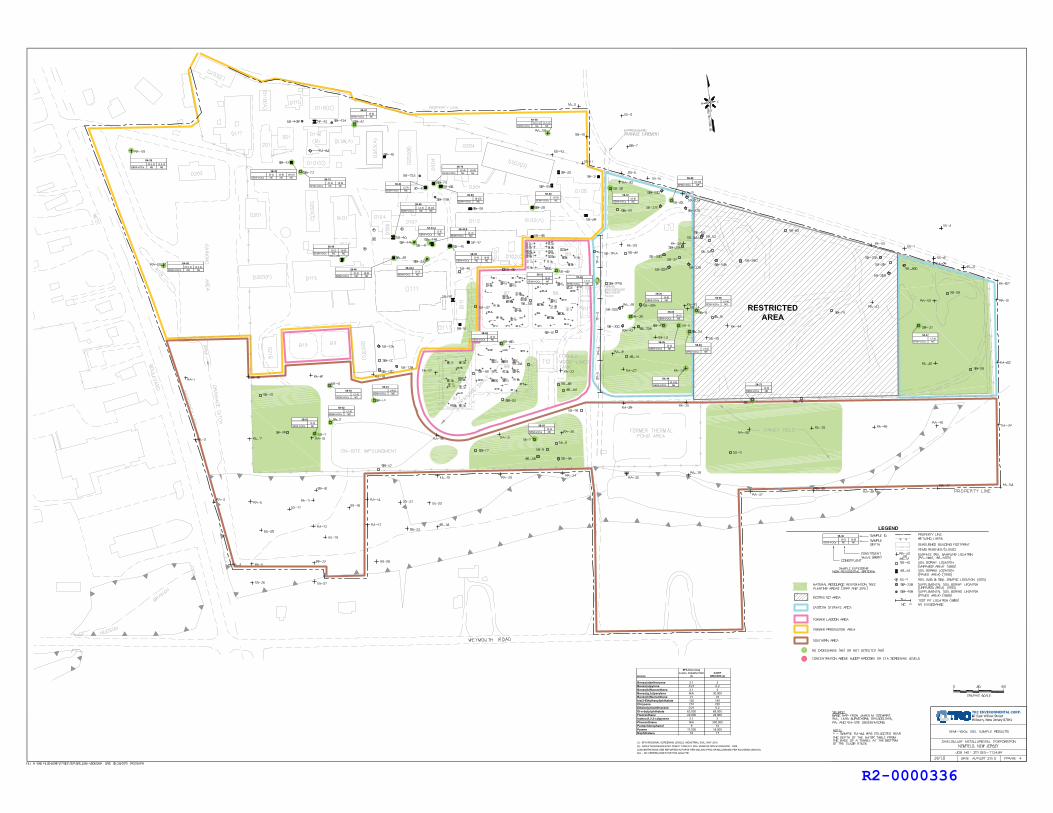
NJDEPAnalyte NRDCSRS (2)
Benzo(a)anthracene 2.1 2Benzo(a)pyrene 0.21 0.2Benzo(b)fluoranthene 2.1 2Benzo(g,h,i)perylene N/A 30,000Benzo(k)fluoranthene 21 23bis(2-Ethylhexyl)phthalate 120 140Chrysene 210 230Dibenz(a,h)anthracene 0.21 0.2Di-n-butyl phthalate 62,000 68,000Fluoranthene 22,000 24,000Indeno(1,2,3-cd)pyrene 2.1 2Phenanthrene N/A 300,000Pentachlorophenol 9 10Pyrene 17,000 18,000Naphthalene 18 17
(1) - EPA REGIONAL SCREENING LEVELS, INDUSTRIAL SOIL, MAY 2010.(2) - NJDEP NON-RESIDENTIAL DIRECT CONTACT SOIL REMEDIATION STANDARDS, 2008CONCENTRATIONS ARE REPORTED IN PARTS PER MILLION (PPM) OR MILLIGRAMS PER KILOGRAM (MG/KG)N/A - NO CRITERIA EXIST FOR THIS ANALYTE
EPA Screening Levels, Industrial Soil
(1)
(0�0.5)SEMI-VOCs NE
RA�34
(0.5�1) (1.5�2)SEMI-VOCs NE NE
RA�59
(0.5�1) (1.5�2)SEMI-VOCs NE NE
RA�60
(�11�)SEMI-VOCs NE
TP�02
(2�4)SEMI-VOCs NE
SB�01
(2�4)SEMI-VOCs ND
SB�02
(2�4)SEMI-VOCs ND
SB�03
(4�6)SEMI-VOCs NE
SB�04
(2�4)SEMI-VOCs NE
SB�05
(2�4)SEMI-VOCs ND
SB�06
(4�6)SEMI-VOCs NE
SB�07
(4�6)SEMI-VOCs NE
SB�13
(6�8)SEMI-VOCs NE
SB�20
(8�10)SEMI-VOCs NE
SB�22
(4�6)SEMI-VOCs NE
SB�24
(2�4)SEMI-VOCs NE
SB�27
(0�2) (6�8)SEMI-VOCs NE NE
SB�29
(6�8)SEMI-VOCs NE
SB�32(6�8)
SEMI-VOCs NE
SB�39
(2�4) (8�10)SEMI-VOCs NE NE
SB�40
(2�4)SEMI-VOCs NE
SB�41
(0�2) (6�8) (8�10)SEMI-VOCs NE NE NE
SB�42
(2�4) (6�8)SEMI-VOCs NE NE
SB�45
(0�2) (6�8)SEMI-VOCs NE NE
SB�46
(6�8)SEMI-VOCs NE
SB�47
(2�4)SEMI-VOCs NE
SB�60
(0�2) (6�8)SEMI-VOCs NE NE
SB�72
(2�4) (6�8)SEMI-VOCs NE NE
SB�73
(4�8)SEMI-VOCs ND
SB�77
(8�10)SEMI-VOCs NE
SB�84
(1�3)SEMI-VOCs NE
SB�44�A
(1�3)SEMI-VOCs ND
SB�44�B
(1�3)SEMI-VOCs ND
SB�44�C
(0�2) (6�8)SEMI-VOCs NE NE
SB�46
(6�8)SEMI-VOCs NE
SB�55
(0.5�1) (1.5�2)SEMI-VOCs NE NE
RA�58
R2-0000336

(0�0.5)Pesticides NDPCBS Aroclor-1248 1.9 Aroclor-1254 1.5
RA�34
(0.5�1) (1.5-2)Pesticides ND NDPCBS ND ND
RA�59
(0.5�1) (1.5-2)Pesticides ND NDPCBS ND ND
RA�60
(�11�)Pesticides NDPCBS ND
TP�02
(2�4)Pesticides NDPCBS ND
SB�01
(2�4)Pesticides NDPCBS ND
SB�05
(4�6)Pesticides 4,4-DDT NEPCBS ND
SB�07
(4�6)Pesticides 4,4-DDT NEPCBS ND
SB�13
(4�6)Pesticides NDPCBS ND
SB�24
(2�4)Pesticides NDPCBS ND
SB�27
(0�2) (6-8)PCBS ND ND
SB�30
(0�2) (6-8)PCBS Aroclor-1254 NE ND
SB�31
(0�2) (6-8)Pesticides N/A NDPCBS Aroclor-1254 NE ND
SB�32
(0�2) (6-8)PCBS Aroclor-1254 NE ND
SB�33
(0�2) (6-8)PCBS ND ND
SB�34
(0�2) (6-8)PCBS ND ND
SB�35
(6�8)Pesticides 4,4-DDT NEPCBS ND
SB�39
(8�10)Pesticides NDPCBS ND
SB�42
(6�8)Pesticides NDPCBS ND
SB�47
(6�8)Pesticides NDPCBS ND
SB�55
(2�4)Pesticides NDPCBS ND
SB�60
(4�6)Pesticides NDPCBS ND
SB�77
(8�10)Pesticides NDPCBS Aroclor-1260 NE
SB�84
(0�1)PCBS ND
SS�13
(0�1)PCBS Aroclor-1254 NE
SS�14
(0�1)PCBS Aroclor-1254 NE
SS�15
(8�10)Pesticides NDPCBS ND
SB�22�A
(8�10)Pesticides NDPCBS ND
SB�22�B
(8�10)Pesticides NDPCBS ND
SB�22�C
(8�10)Pesticides NDPCBS ND
SB�22�D
(6�8)Pesticides NDPCBS ND
SB�20�A
(6�8)Pesticides NDPCBS ND
SB�20�B
(6�8)Pesticides NDPCBS ND
SB�20�C
(6�8)Pesticides NDPCBS ND
SB�20�D
(2�4) (4-6) (6-8)Pesticides ND ND NDPCBS ND ND ND
SB�73
(6�8)Pesticides NDPCBS ND
SB�73�A
(6�8)Pesticides NDPCBS ND
SB�73�B
(0�2) (6-8)PCBS ND ND
SB�34
(0.5�1) (1.5�2)Pesticides ND NDPCBS ND ND
RA�58
(0�2) (2�4) (4-6) (6-8) (8-10)Pesticides ND ND ND ND NDPCBS ND ND ND ND ND
SB�22
(0�2) (2-4) (4-6) (6-8)Pesticides ND ND ND NDPCBS ND ND ND ND
SB�20
EPA ScreeningLevels NJDEP
Analyte Industrial Soil (1) NRDCSRS (2)
PESTICIDES4,4-DDD 7.2 134,4-DDE 5.1 94,4-DDT 7 8
PCBsAroclor-1016 21 1Aroclor-1221 0.54 1Aroclor-1232 0.54 1Aroclor-1242 0.74 1Aroclor-1248 0.74 1Aroclor-1254 0.74 1Aroclor-1260 0.74 1
(1) - EPA REGIONAL SCREENING LEVELS, INDUSTRIAL SOIL, MAY 2010.(2) - NJDEP NON-RESIDENTIAL DIRECT CONTACT SOIL REMEDIATION STANDARDS, 2008CONCENTRATIONS ARE REPORTED IN PARTS PER MILLION (PPM) OR MILLIGRAMS PER KILOGRAM (MG/KG)
R2-0000337

(0�0.5)METALS NE
RA�38 (0�0.5)METALS NE
RA�45
(0�0.5)METALS NE
RA�46
(0�0.5)METALS NE
RA�51
(0�0.5)METALS NE
RA�52
(0.5�1) (3.5�4)METALS NE NE
RA�59
(0�0.5) (3.5�4)METALS NE NE
RA�60
(2�4)METALS NE
SB�01
(2�4)METALS NE
SB�05
(4�6)METALS NE
SB�16
(0�2) (6�8)METALS NE NE
SB�38
(0�1)Be NE
SS�25
(0�1)METALS NE
SS�28
(0�1)Be NE
SS�27
(6�8)Be NE
SB�25�A
(6�8)Be NE
SB�25�B
(6�8)Be NE
SB�25�C
(6�8)Be NE
SB�54�A
(8�10)Be NE
SB�23�A
(8�10)Be NE
SB�23�B
(8�10)Be NE
SB�23�C
(8�10)Be NE
SB�23�D
(2�4)Be NE
SB�9�A
(2�4)Be NE
SB�9�B
(0�2) (2�4) (4�6)Be NE NE NE
SB�12
(4�6)Be NE
SB�12�A
(4�6)Be NE
SB�12�B
(4�6)Be NE
SB�12�C
(10�12)Be NE
SB�TP1�A
(10�12)Be NE
SB�TP1�A
(1�3)As NE
SB�43�A(1�3)
As NE
SB�43�B
(0�2) (6�8)METALS NE NE
SB�38
(0�0.5)METALS NE
RA�01
(0�0.5)METALS NE
RA�02
(0�0.5)METALS NE
RA�03
RA�04(0�0.5)
METALS NE (0�0.5)METALS NE
RA�05
(0�0.5)METALS NE
RA�06
(0�0.5)METALS NE
RA�07
(0�0.5)METALS NE
RA�08(0�0.5)
METALS NE
RA�09
(0�0.5)METALS NE
RA�10
(0�0.5)METALS NE
RA�11
(0�0.5)METALS NE
RA�12
(0�0.5)METALS NE
RA�13
(0�0.5)METALS NE
RA�14
(0�0.5)METALS NE
RA�16
(0�0.5)METALS NE
RA�17
(0�0.5)METALS NE
RA�18
(0�0.5)METALS NE
RA�19
(0�0.5)METALS NE
RA�20
(0�0.5)METALS NE
RA�21
(0�0.5)METALS NE
RA�22
(0�0.5)METALS NE
RA�23
(0�0.5)METALS NE
RA�24
(0�0.5)METALS NE
RA�25
(0�0.5)METALS NE
RA�26
(0�0.5)METALS NE
RA�27
(0�0.5)METALS NE
RA�28
(0�0.5)METALS NE
RA�29
(0�0.5)METALS NE
RA�30
(0�0.5)METALS NE
RA�31
(0�0.5)METALS NE
RA�32
(0�0.5)METALS NE
RA�33
(0�0.5)METALS NE
RA�34
(0�0.5)METALS NE
RA�35
(0�0.5)METALS NE
RA�36
(0�0.5)METALS NE
RA�37
(0�0.5)METALS NE
RA�39
(0�0.5)METALS NE
RA�40
(0�0.5)METALS NE
RA�41(0�0.5)
METALS NE
RA�42
(0�0.5)METALS NE
RA�43
(0�0.5)METALS NE
RA�44
(0�0.5)METALS NE
RA�47
(0�0.5)METALS NE
RA�48
(0�0.5)METALS NE
RA�49
(0�0.5)METALS NE
RA�50
(0�0.5)METALS NE
RA�53
(0�0.5)METALS NE
RA�54
(0�0.5)METALS NE
RA�55
(0�0.5)METALS NE
RA�56
(0�0.5)METALS NE
RA�57
(0.5�1) (3.5�4)METALS NE NE
RA�58
(0�0.5)As 69.8
RA�64
12METALS NE
TP�01
11METALS NE
TP�02
8METALS NE
TP�03
7METALS NE
TP�04
5METALS NE
TP�05
(0�2) (4�6)METALS NE NE
SB�07
(0�2) (2�4)METALS NE NE
SB�08
(0�2) (2�4)METALS NE NE
SB�09
(0�2) (4�6)METALS NE NE
SB�10
(0�2) (2�4)METALS NE NE
SB�11
(4�6)METALS NE
SB�12
(0�2) (4-6)METALS NE NE
SB�13
(0�2) (2-4)METALS NE NE
SB�15 (0�2) �����METALS NE NE
SB�17
(0�2) �����METALS NE NE
SB�18
(4�6)METALS NE
SB�19
(0�2) (6�8)METALS NE NE
SB�20
(0�2) (6�8)METALS NE NE
SB�21
(0�2) (6�8)METALS NE NE
SB�22
(0�2) (8�10)METALS NE NE
SB�23
(4�6)METALS NE
SB�24
(0�2) (6�8)METALS NE NE
SB�25
(0�2) (6�8)METALS NE NE
SB�26
(2�4) (6�8)METALS NE NE
SB�27
(0�2) (6�8)METALS NE NE
SB�28
(0�2) (6�8)METALS NE NE
SB�29
(0�2) (6�8)METALS NE NE
SB�30
(0�2) (6�8)METALS NE NE
SB�31
(0�2) (6�8)METALS NE NE
SB�32
(0�2) (6�8)METALS NE NE
SB�33(0�2) (6�8)
METALS NE NE
SB�34
(0�2) (6�8)METALS NE NE
SB�35
(0�2) (6�8)METALS NE NE
SB�36
(0�2) (6�8)METALS NE NE
SB�37
(0�2) (6�8)METALS NE NE
SB�39
(2�4) (8�10)METALS NE NE
SB�40
(8�10)METALS NE
SB�42
(0�2) (6�8)As 43.1 NE
SB�43
(0�2) (2�4)METALS NE NE
SB�44
(2�4) (4�6)METALS NE NE
SB�45
(0�2) (6�8)METALS NE NE
SB�46
(0�2) (6�8)METALS NE NE
SB�47
(0�2) (6�8)METALS NE NE
SB�48
(0�2) (6�8)METALS NE NE
SB�49
(0�2) (6�8)METALS NE NE
SB�50
(0�2) (2�4)METALS NE NE
SB�51
(0�2) (6�8)METALS NE NE
SB�52
(0�2) (6�8)METALS NE NE
SB�53
(0�2) (6�8)METALS NE NE
SB�54
(0�2) (6�8)METALS NE NE
SB�55(0�2) (6�8)
METALS NE NE
SB�56
(0�2) (4�6)METALS NE NE
SB�57
(0�2) (6�8)METALS NE NE
SB�60
(0�2) (6�8)METALS NE NE
SB�61
(0�2) (6�8)METALS NE NE
SB�62
(0�2) (6�8)METALS NE NE
SB�63
(0�2) (6�8)METALS NE NE
SB�64
(0�2) (4�6)METALS NE NE
SB�77(0�2) (4�6)
METALS NE NE
SB�78
(0�2) (2�4)METALS NE NE
SB�79
(0�2) (4�6)METALS NE NE
SB�80
(0�2) (4�6)METALS NE NE
SB�81
(0�2) (4�6)METALS NE NE
SB�82
(0�2) (4�6)METALS NE NE
SB�83
(0�1)Be NE
SS�11
(0�1)Be NE
SS�12
(0�1)METALS NE
SS�16
(0�1)METALS NE
SS�17
(0�1)METALS NE
SS�18
(0�1)METALS NE
SS�19
(0�1)METALS NE
SS�20
(0�1)Be NE
SS�1
(0�1)Be NE
SS�2
(0�1)Be NE
SS�3
(0�1)Be NE
SS�4
(0�1)Be NE
SS�5(0�1)Be NE
SS�6
(0�1)Be NE
SS�7
(0�1)Be NE
SS�8
(0�1)METALS NE
SS�21
(0�1)METALS NE
SS�22
(0�1)METALS NE
SS�23 (0�1)METALS NE
SS�24
(0�1)Be NE
SS�26
(6�8)Be NE
SB�54�B(6�8)
Be NE
SB�54�C
(0�2) (2�4) (4�6) (6�8) (8�10)Be NE NE NE NE NE
SB�23
(0�2) (2�4) (4�6) (6�8) (8�10)Be NE NE NE NE NE
SB�54
(0�2) (2�4) (4�6) (6�8) (8�10)Be NE NE NE NE NE
SB�25
(�������)METALS NE
B9�1(�������)
METALS NE
B9�2
(�������)METALS NE
B9�3
(�������)METALS NE
B9�4
(�������)METALS NE
B10�1(�������)
METALS NE
B10�2
(�������)METALS NE
B10�3
(�������)METALS NE
B10�4
(2���3)METALS NE
BERM�1
(2���3)METALS NE
BERM�2
(2���3)METALS NE
BERM�3
(2���3)METALS NE
BERM�4
(0�0.5)Be ND
SS�100
(0�0.5)Be NE
SS�101
(0�0.5) (1-1.5)Be NE NE
SS�102
(0�0.5)Be ND
SS�103
(0�0.5)Be NE
SS�104
(0�0.5)Be NE
SS�105
(0�0.5)Be NE
SS�106
(0�0.5)Be NE
SS�107
(0�0.5)Be ND
SS�108
(0�0.5)Be NE
SS�109
(0�0.5) (1-1.5)Be NE NE
SS�110
(0�0.5)Be NE
SS�111
(0�0.5)Be NE
SS�112
(0�0.5)Be NE
SS�113
(0�0.5)Be NE
SS�114
(0�0.5) (1-1.5)Be NE NE
SS�115
EPA Screening Levels NJDEP
Analyte Symbol Industrial Soil (1) NRDCSRS (2)(ppm) (ppm)
Aluminum Al 990,000 N/AAntimony Sb 412 450Arsenic As 1.6 (3) 19Barium Ba 190,000 59,000Beryllium Be 2,000 140Cadmium Cd 800 78Calcium Ca N/A N/AChromium Cr N/A N/AChromium VI Cr+6 5.6 20Cobalt Co 300 590Copper Cu 41,000 45,000Iron Fe 720,000 N/ALead Pb 800 800Magnesium Mn N/A N/AManganese Mg N/A 5,900Mercury Hg 34 65Nickel Ni 20,000 23,000Potassium K N/A N/ASelenium Se 5,100 5,700Silver Ag 5,100 5,700Sodium Na N/A N/AThallium Tl N/A 79Vanadium V 72 1,100Zinc Zn 310,000 110,000Cyanide 20,000 23,000
(1) - USEPA INDUSTRIAL REGIONAL SCREENING LEVELS (MAY 2010)(2) - NJDEP NON-RESIDENTIAL DIRECT CONTACT SOIL REMEDIATION STANDARDS, 2008(3) - NJDEP SOIL REMEDIATION STANDARD IS BASED ON NATURAL BACKGROUND IN NEW JERSEY;THEREFORE IT IS USED AS THE BASIS FOR SCREENING SOIL ARSENIC LEVELS CONCENTRATIONS ARE REPORTED IN PARTS PER MILLION (PPM) OR MILLIGRAMS PER KILOGRAM (MG/KG)N/A - NO CRITERIA EXIST FOR THIS ANALYTE
R2-0000338
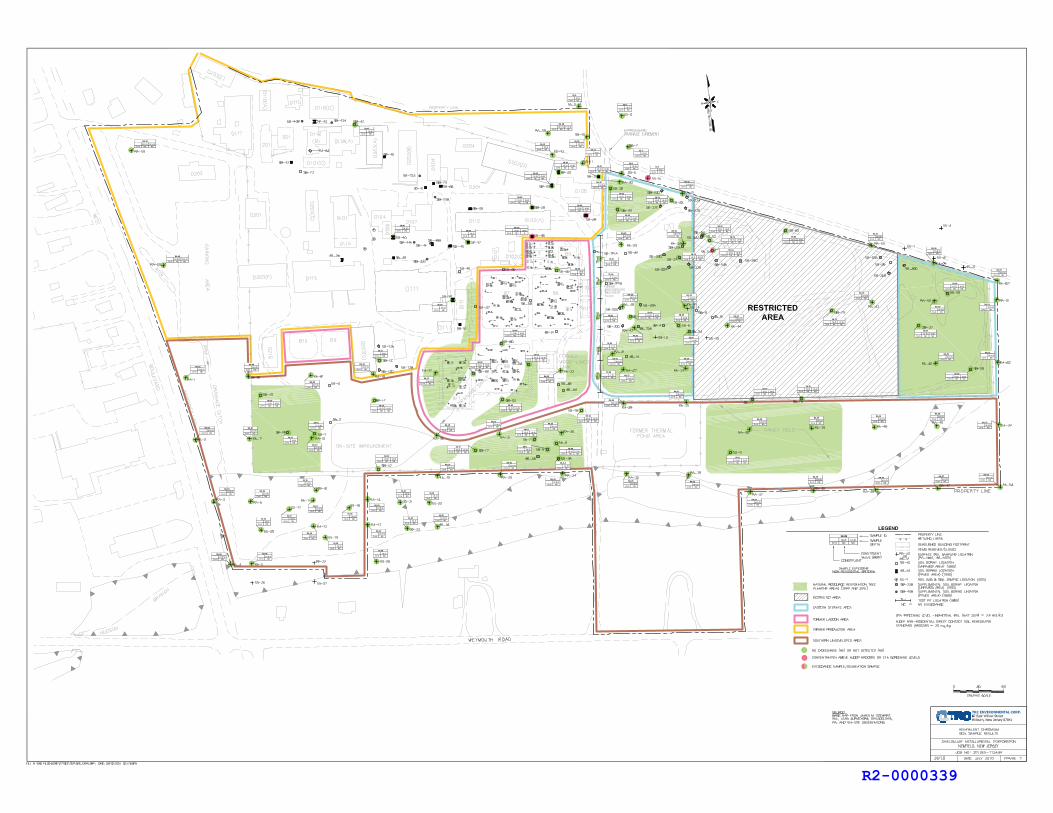
(0�0.5)Cr+6 ND
RA�02
(0�0.5)Cr+6 ND
RA�01
(0�0.5)Cr+6 ND
RA�03
(0�0.5)Cr+6 ND
RA�04(0�0.5)
Cr+6 ND
RA�05
(0�0.5)Cr+6 ND
RA�06
(0�0.5)Cr+6 ND
RA�07
(0�0.5)Cr+6 ND
RA�08
(0�0.5)Cr+6 ND
RA�09
(0�0.5)Cr+6 ND
RA�10
(0�0.5)Cr+6 ND
RA�11
(0�0.5)Cr+6 ND
RA�12 (0�0.5)Cr+6 NE
RA�13
(0�0.5)Cr+6 ND
RA�14
(0�0.5)Cr+6 ND
RA�16
(0�0.5)Cr+6 NE
RA�17
(0�0.5)Cr+6 NE
RA�18
(0�0.5)Cr+6 ND
RA�19 (0�0.5)Cr+6 ND
RA�20
(0�0.5)Cr+6 ND
RA�21
(0�0.5)Cr+6 NE
RA�22
(0�0.5)Cr+6 NE
RA�23
(0�0.5)Cr+6 ND
RA�24
(0�0.5)Cr+6 ND
RA�25
(0�0.5)Cr+6 ND
RA�26
(0�0.5)Cr+6 ND
RA�27
(0�0.5)Cr+6 NE
RA�28
(0�0.5)Cr+6 NE
RA�29
(0�0.5)Cr+6 NE
RA�30(0�0.5)
Cr+6 ND
RA�31
(0�0.5)Cr+6 NE
RA�32
(0�0.5)Cr+6 NE
RA�33
(0�2) (2�4)Cr+6 ND ND
SB�08
(0�0.5)Cr+6 ND
RA�34
(0�0.5)Cr+6 ND
RA�35
(0�0.5)Cr+6 ND
RA�36
(0�0.5)Cr+6 ND
RA�37
(0�0.5)Cr+6 ND
RA�38(0�0.5)
Cr+6 ND
RA�39
(0�0.5)Cr+6 ND
RA�40
(0�0.5)Cr+6 NE
RA�41
(0�0.5)Cr+6 NE
RA�42
(0�0.5)Cr+6 ND
RA�43
(0�0.5)Cr+6 NE
RA�44
(0�0.5)Cr+6 ND
RA�45
(0�0.5)Cr+6 ND
RA�46(0�0.5)
Cr+6 ND
RA�47
(0�0.5)Cr+6 ND
RA�48
(0�0.5)Cr+6 ND
RA�49
(0�0.5)Cr+6 ND
RA�50 (0�0.5)Cr+6 ND
RA�51
(0�0.5)Cr+6 ND
RA�52
(0�0.5)Cr+6 ND
RA�53
(0�0.5)Cr+6 ND
RA�54
(0�0.5)Cr+6 ND
RA�55
(0�0.5)Cr+6 ND
RA�56
(0�0.5)Cr+6 ND
RA�57
(0.5�1) (3.5�4)Cr+6 ND ND
RA�58
(0.5�1) (3.5�4)Cr+6 ND ND
RA�59
(0�0.5) (3.5�4)Cr+6 ND ND
RA�60
(�12�)Cr+6 NE
TP�01
(�11�)Cr+6 NE
TP�02
(�8�)Cr+6 NE
TP�03
(�7�)Cr+6 NE
TP�04
(�5�)Cr+6 ND
TP�05
(2�4)Cr+6 ND
SB�01
(2�4)Cr+6 ND
SB�05
(0�2) (4�6)Cr+6 NE ND
SB�07
(0�2) (2�4)Cr+6 ND ND
SB�08
(0�2) (4�6)Cr+6 ND ND
SB�10
(0�2) (2�4)Cr+6 ND ND
SB�11
(4�6)Cr+6 NE
SB�12
(0�2) (4�6)Cr+6 ND ND
SB�13
(0�2) (2�4)Cr+6 ND ND
SB�15
(4�6)Cr+6 ND
SB�16
(0�2) (2�4)Cr+6 ND ND
SB�17
(0�2) (2�4)Cr+6 NE ND
SB�18
(0�2) (6�8)Cr+6 NE ND
SB�20
(0�2) (6�8)Cr+6 NE ND
SB�22
(0�2) (8�10)Cr+6 NE NE
SB�23
(4�6)Cr+6 ND
SB�24
(0�2) (6�8)Cr+6 ND ND
SB�26
(2�4) (6�8)Cr+6 ND ND
SB�27
(0�2) (6�8)Cr+6 ND NE
SB�28
(0�2) (6�8)Cr+6 NE ND
SB�30
(0�2) (6�8)Cr+6 NE NE
SB�31
(0�2) (6�8)Cr+6 NE ND
SB�32
(0�2) (6�8)Cr+6 ND ND
SB�33
(0�2) (6�8)Cr+6 ND 9.1
SB�34
(0�2) (6�8)Cr+6 NE ND
SB�35
(0�2) (6�8)Cr+6 NE NE
SB�39
(8�10)Cr+6 ND
SB�40
(6�8)Cr+6 ND
SB�47
(0�2) (6�8)Cr+6 NE NE
SB�52
(0�2) (6�8)Cr+6 NE NE
SB�53
(2�4) (6�8)Cr+6 ND ND
SB�60
(0�2) (6�8)Cr+6 ND NE
SB�62
(0�2) (6�8)Cr+6 ND NE
SB�63
(0�2) (6�8)Cr+6 ND ND
SB�64
(0�2) (4�6)Cr+6 NE ND
SB�77 (0�2) (4�6)Cr+6 NE ND
SB�78
(0�2) (2�4)Cr+6 NE NE
SB�79
(0�2) (4�6)Cr+6 ND NE
SB�80
(0�1)Cr+6 NE
SS�9
(0�1)Cr+6 NE
SS�10
(0�1)Cr+6 NE
SS�11(0�1)
Cr+6 NE
SS�12
(0�1)Cr+6 NE
SS�16
(0�1)Cr+6 NE
SS�17 (0�1)Cr+6 ND
SS�18
(0�1)Cr+6 NE
SS�19
(0�1)Cr+6 ND
SS�20
(0�1)Cr+6 ND
SS�28
(0�1)Cr+6 5.9
SS�5(0�1)Cr+6 NE
SS�6
(0�1)Cr+6 ND
SS�7
(0�1)Cr+6 ND
SS�8
(0�1)Cr+6 ND
SS�21
(0�1)Cr+6 ND
SS�22
(0�1)Cr+6 ND
SS�23 (0�1)Cr+6 ND
SS�24
(2�4)Cr+6 NE
SB�9�A
(0�2) (6�8)Cr+6 18.1 8
SB�36
(0�2) (6�8)Cr+6 8.6 NE
SB�54
(0�2)Cr+6 NE
SB�9
(0�2)Cr+6 NE
SB�37
(0�2)Cr+6 NE
SB�50
(6�8)Cr+6 NE
SB�55
R2-0000339

(0�0.5)V 203
RA�05
(0�0.5)V 124
RA�09
(0�0.5)V 403
RA�11
(0�0.5)V 12,100
RA�12(0�0.5)
V 1,360
RA�13
(0�0.5)V 2,560
RA�14
(0�0.5)V 131
RA�16
(0�0.5)V 175
RA�21
(0�0.5)V 654
RA�22
(0�0.5)V 1,810
RA�23
(0�0.5)V 280
RA�26
(0�0.5)V 453
RA�27
(0�0.5)V 4,750
RA�28
(0�0.5)V 1,270
RA�29
(0�0.5)V 390
RA�30
(0�0.5)V 102
RA�31
(0�0.5)V 436
RA�32
(0�0.5)V 1,510
RA�33
(0�0.5)V 2,450
RA�34
(0�0.5)V 302
RA�35
(0�0.5)V 715
RA�41
(0�0.5)V 1,770
RA�42
(0�0.5)V 3,780
RA�43
(0�0.5)V 551
RA�44
(0�0.5)V 5,760
RA�49
(0�0.5)V 2,660
RA�50
(0�0.5)V 208
RA�56
(2�4)V 105
SB�05
(0�2) (2�4)V 128 145
SB�07
(0�2) (2�4)V 472 182
SB�08
(0�2) (2�4)V 324 1,630
SB�09
(4�6)V 903
SB�12
(0�2) (2�4)V 417 229
SB�13
(0�2) (2�4)V 517 NE
SB�18
(4�6)V 245
SB�19
(0�2) (6�8)V 1,160 NE
SB�20
(0�2) (6�8)V 1,810 NE
SB�21
(0�2) (6�8)V 93.8 732
SB�23
(0�2) (6�8)V 2,780 3,660
SB�25
(0�2) (6�8)V 3,630 NE
SB�28
(0�2) (6�8)V 262 NE
SB�30
(0�2) (6�8)V 109 NE
SB�31
(0�2) (6�8)V 1,190 NE
SB�32(0�2) (6�8)
V 145 NE
SB�33
(0�2) (4�6)V 1,760 75.8
SB�77
(0�2) (4�6)V 612 532
SB�81
(0�2) (2�4)V 209 NE
SB�79
(0�2) (4�6)V 1,120 NE
SB�80
(0�2) (6�8)V 433 721
SB�54
(0�2) (6�8)V 1,510 NE
SB�53
(0�2) (6�8)V 742 NE
SB�52
(0�2) (6�8)V 671 NE
SB�55
(0�2) (6�8)V 1,250 NE
SB�36
(0�2) (6�8)V 328 82.6
SB�39
(0�2) (6�8)V 3,950 NE
SB�56
(0�2) (6�8)V NE 76.7
SB�38
(0�2) (6�8)V 594 NE
SB�37
(0�2) (4�6)V 802 146
SB�57
(0�2) (6�8)V 826 154
SB�49
(0�2) (6�8)V 86.8 NE
SB�45
(0�2) (6�8)V 4,110 121
SB�47
(0�2) (2�4)V 1,280 NE
SB�44
(0�2) (6�8)V 176 NE
SB�43
(0�2) (6�8)V 928 265
SB�50
(0�2) (2�4)V 308 NE
SB�46
(0�2) (2�4)V 466 NE
SB�51
(0�2) (4�6)V 91.2 NE
SB�83
(0�2) (6�8)V NE 125
SB�63
(12)V 736
TP�1
(11)V 298
TP�2
(8)V 335
TP�3
(4�5)V 100
SB7�6
(8�9)V 180
SB7�8
(7.5�8.5)V 530
SB6�18�&�SB6�18R
(0�2) (2�4)V 517 NE
SB�18
(0�0.5)V NE
RA�01
(0�0.5)V NE
RA�02
(0�0.5)V NE
RA�03
(0�0.5)V NE
RA�04
(0�0.5)V NE
RA�06
(0�0.5)V NE
RA�07
(0�0.5)V NE
RA�08
(0�0.5)V NE
RA�10
(0�0.5)V NE
RA�17
(0�0.5)V NE
RA�19
(0�0.5)V NE
RA�20
(0�0.5)V NE
RA�18
(0�0.5)V NE
RA�24 (0�0.5)V NE
RA�25
(0�0.5)V NE
RA�36
(0�0.5)V NE
RA�37
(0�0.5)V NE
RA�38
(0�0.5)V NE
RA�39
(0�0.5)V NE
RA�40
(0�0.5)V NE
RA�45
(0�0.5)V NE
RA�46 (0�0.5)V NE
RA�47
(0�0.5)V NE
RA�48
(0�0.5)V NE
RA�51
(0�0.5)V NE
RA�52
(0�0.5)V NE
RA�53
(0�0.5)V NE
RA�54
(0�0.5)V NE
RA�55
(0�0.5)V NE
RA�57
(0.5�1) (3.5�4)V NE NE
RA�58
(0.5�1) (3.5�4)V NE NE
RA�59
(0�0.5) (3.5�4)V NE NE
RA�60
(0�0.5)V NE
RA�64
(�5�)V NE
TP�05
(2�4)V NE
SB�01
(0�2) (4�6)V NE NE
SB�10
(0�2) (2�4)V NE NE
SB�11
(4�6)V NE
SB�16
(4�6)V NE
SB�24
(0�2) (6�8)V NE ND
SB�26
(2�4) (6�8)V NE NE
SB�27
(0�2) (6�8)V NE NE
SB�29
(0�2) (6�8)V NE NE
SB�34
(0�2) (6�8)V NE ND
SB�35
(2�4) (8�10)V NE ND
SB�40
(8�10)V NE
SB�42
(0�2) (6�8)V NE NE
SB�48
(2�4) (6�8)V NE NE
SB�60
(0�2) (6�8)V NE NE
SB�61
(0�2) (6�8)V NE NE
SB�62
(0�2) (6�8)V NE NE
SB�64
(0�2) (4�6)V NE NE
SB�78
(0�2) (4�6)V NE NE
SB�82
(0�1)V NE
SS�16
(0�1)V NE
SS�17
(0�1)V NE
SS�18
(0�1)V NE
SS�28
(0�1)V NE
SS�8
(0�1)V NE
SS�21
(0�1)V NE
SS�22
(0�1)V NE
SS�23
(0�1)V NE
SS�24
(0�1)V 1,120
SS�19
(0�1)V 83.9
SS�20
(0�2) (2�4)V 139 NE
SB�15
(0�2) (2�4)V 153 NE
SB�17
(0�2) (6�8)V 82.9 NE
SB�22
(0�1)V 739
SS�5(0�1)V 275
SS�6
(0�1)V 101
SS�7
(0�1)V 292
SS�11
(0�1)V 317
SS�12
(�7�)V NE
TP�04
(�������)V NE
B9�1(�������)
V NE
B9�2
(�������)V NE
B9�3 (�������)V NE
B9�4
(�������)V NE
B10�1(�������)
V NE
B10�2
(�������)V 395
B10�3
(�������)V NE
B10�4
(2���3)V NE
BERM�1
BERM�2(2���3)
V NE
(2���3)V NE
BERM�3
(2���3)V NE
BERM�4
R2-0000340

(8�9)
Cr+6 58.3
1019�B1�S1�&�B1�S1R(11.4�12.4)
Cr+6 15.3
1030�B1�S2�&�B1�S2R*
(11�12)
Cr+6 6.9
1030�B1�S4�&�B1�S4R*
(10�11)
Cr+6 7.5
1117�B2�S1�&�B2�S1R
(10�11)
Cr+6 33.8
1117�B2�S2�&�B2�S2R
(9�10)
Cr+6 20
1117�B2�S3�&�B2�S3R
(9�10)
Cr+6 26.3
1117�B2�S4�&�B2�S4R
(14.5�15.5)
Cr+6 34.6
1030�B3�S1�&�B3�S1R*
(14.5�15.5)
Cr+6 35.7
1030�B3�S2�&�B3�S2R*
(9.5�10.5)
Cr+6 5.6
1010�B3�S3�&�B3�S3R
(10�11)
Cr+6 20.4
1010�B3�S4R�&�B3�S4R
(6.5�7.5)
Cr+6 70
1018�B5�S3�&�B2�S3R
(8�9)
Cr+6 8
SB7�11�&�SB7�11R
(8�9)
Cr+6 32.2
SB7�23R
(6�7)
Cr+6 5.6
SB8�15�&�SB8�15R
(2.9�3.9)
Cr+6 5.9
0929�B11�S4�&�B11�S4R
(2.3�3.3)
Cr+6 13.3
1020�B12�S2�&�B12�S2R
(2.3�3.3)
Cr+6 13.3
1020�B12�S2�&�B12�S2R
(3.5�4.5)Cr+6 ND
B11�S1
(2.3�3.3)Cr+6 ND
B11�S2
(3.2�4.2)Cr+6 ND
B11�S3
(3.2�4.2)Cr+6 ND
B11�S5
(8.4�9.4)Cr+6 ND
SB6�7R
(7.8�8.8)Cr+6 ND
SB6�14R
(11�12)Cr+6 ND
SB6�15R
(7.8�8.8)Cr+6 11.3
SB6�16R
(8.8�9.8)Cr+6 ND
SB6�17R
(7.6�8.6)Cr+6 ND
SB6�18R
(8�9)Cr+6 ND
SB6�19R
(9.4�10.4)Cr+6 NE
SB6�20R
(8�9)Cr+6 ND
SB6�21R
(7�8)Cr+6 14
SB6�23R
Cr+6 NE
SB6�24R
(8.8�9.8)Cr+6 ND
SB6�25R
(7.6�8.6)Cr+6 ND
SB7�12R
(7.3�8.3)Cr+6 ND
SB7�13R(7�8)
Cr+6 NE
SB7�14R
(8�9)Cr+6 NE
SB7�15R
(7.8�8.8)Cr+6 ND
SB7�16R
(8.2�9.2)Cr+6 ND
SB7�17R
(9�10)Cr+6 ND
SB7�18R
(7.7�8.7)Cr+6 ND
SB7�19R
(7�8)Cr+6 NE
SB7�20R
(8�9)Cr+6 NE
SB7�24R
(5.5�6.5�)Cr+6 NE
SB8�10R
(6�7)Cr+6 NE
SB8�11R(6.8�7.8�)
Cr+6 NE
SB8�12R
(5.5�6.5�)Cr+6 ND
SB8�13R
(5.5�6.5�)Cr+6 ND
SB8�14R
(7.4�8.4�)Cr+6 ND
SB8�16R
(6.8�7.8�)Cr+6 NE
SB8�17R
(6.2�7.2�)Cr+6 ND
SB8�18R
(6.8�7.8�)Cr+6 NE
SB8�20R
(7�8�)Cr+6 NE
SB8�21R
(7�8�)Cr+6 ND
SB8�22R
(8�9�)Cr+6 ND
B1�S3R
(7�8)Cr+6 ND
B5�S1R
(6.3�7.3)Cr+6 NE
B5�S2R
(8.4�9.4)Cr+6 ND
B5�S4R
(4�5)Cr+6 NE
B12�S1R
(4�5)Cr+6 ND
B12�S3R
(3.2�4.2)Cr+6 ND
B12�S4R
(4�5)Cr+6 ND
B12�S5R
(0�0.5)Cr+6 NE
RA�17
(0�0.5)Cr+6 NE
RA�22
(0�2) (6�8)Cr+6 NE ND
SB�56
(2�4) (6�8)Cr+6 ND ND
SB�60
(0�2) (6�8)Cr+6 ND NE
SB�62
(0�2) (6�8)Cr+6 ND NE
SB�63
(0�2) (6�8)Cr+6 ND ND
SB�64
(6�8)Cr+6 NE
SB�55
R2-0000341
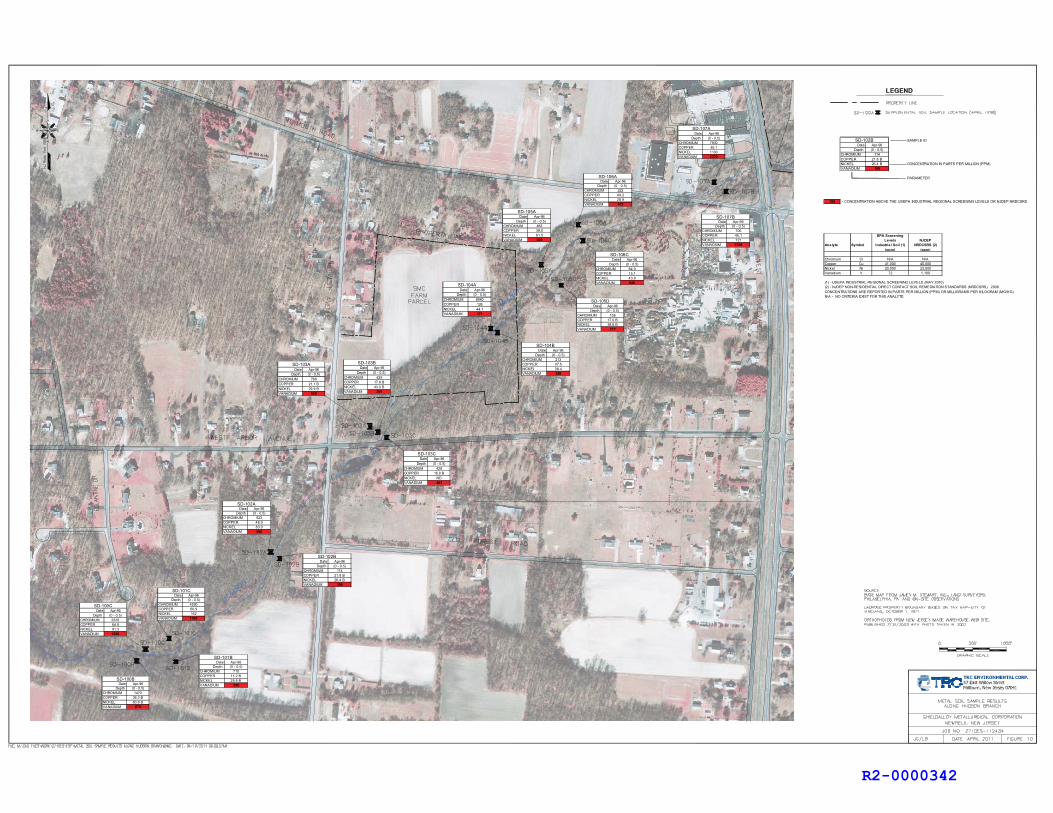
SAMPLE IDDate Apr-96
Depth (0 - 0.5)CHROMIUM 114COPPER 21.8 BNICKEL 26.4 B CONCENTRATION IN PARTS PER MILLION (PPM)VANADIUM 199
PARAMETER
199 - CONCENTRATION ABOVE THE USEPA INDUSTRIAL REGIONAL SCREENING LEVELS OR NJDEP NRDCSRS
SD-102B
EPA Screening Levels NJDEP
Analyte Symbol Industrial Soil (1) NRDCSRS (2)(ppm) (ppm)
Chromium Cr N/A N/ACopper Cu 41,000 45,000Nickel Ni 20,000 23,000Vanadium V 72 1,100
(1) - USEPA INDUSTRIAL REGIONAL SCREENING LEVELS (MAY 2010)(2) - NJDEP NON-RESIDENTIAL DIRECT CONTACT SOIL REMEDIATION STANDARDS (NRDCSRS), 2008CONCENTRATIONS ARE REPORTED IN PARTS PER MILLION (PPM) OR MILLIGRAMS PER KILOGRAM (MG/KG)N/A - NO CRITERIA EXIST FOR THIS ANALYTE
Date Apr-96Depth (0 - 0.5)
CHROMIUM 7830COPPER 85.1NICKEL 1100VANADIUM 2370
SD-107A
Date Apr-96Depth (0 - 0.5)
CHROMIUM 700COPPER 45.1NICKEL 121VANADIUM 1320
SD-107B
Date Apr-96Depth (0 - 0.5)
CHROMIUM 222COPPER 49.2NICKEL 28.9VANADIUM 473
SD-106A
Date Apr-96Depth (0 - 0.5)
CHROMIUM 84.9COPPER 15.1NICKEL 43.8VANADIUM 645
SD-106C
Date Apr-96Depth (0 - 0.5)
CHROMIUM 463COPPER 38.0NICKEL 61.5VANADIUM 665
SD-105A
Date Apr-96Depth (0 - 0.5)
CHROMIUM 156COPPER 17.0 BNICKEL 38.6 BVANADIUM 777
SD-105D
Date Apr-96Depth (0 - 0.5)
CHROMIUM 8940COPPER 126NICKEL 44.1VANADIUM 171
SD-104A
Date Apr-96Depth (0 - 0.5)
CHROMIUM 213COPPER 37.5NICKEL 38.4VANADIUM 349
SD-104B
Date Apr-96Depth (0 - 0.5)
CHROMIUM 766COPPER 21.1 BNICKEL 29.9 BVANADIUM 529
SD-103ADate Apr-96
Depth (0 - 0.5)CHROMIUM 429COPPER 17.8 BNICKEL 43.0 BVANADIUM 386
SD-103B
Date Apr-96Depth (0 - 0.5)
CHROMIUM 428COPPER 16.8 BNICKEL NDVANADIUM 403
SD-103C
Date Apr-96Depth (0 - 0.5)
CHROMIUM 523COPPER 48.0NICKEL 83.0VANADIUM 588
SD-102A
Date Apr-96Depth (0 - 0.5)
CHROMIUM 114COPPER 21.8 BNICKEL 26.4 BVANADIUM 199
SD-102B
Date Apr-96Depth (0 - 0.5)
CHROMIUM 4530COPPER 60.9NICKEL 162VANADIUM 1420
SD-101C
Date Apr-96Depth (0 - 0.5)
CHROMIUM 710COPPER 11.2 BNICKEL 28.8 BVANADIUM 290
SD-101B
Date Apr-96Depth (0 - 0.5)
CHROMIUM 2610COPPER 64.9NICKEL 91.3VANADIUM 1030
SD-100C
Date Apr-96Depth (0 - 0.5)
CHROMIUM 1470COPPER 36.3 BNICKEL 60.8 BVANADIUM 679
SD-100B
R2-0000342

Oct-90VOCs NESEMI VOCs NEPESTICIDES/PCB NDMETALs Antimony 44.2 D Arsenic 2 D Chromium 43.3 Iron 4,660 Lead 28 Vanadium 272
SW01
Oct-90VOCs NESEMI VOCs NAMETALs Antimony 151 Arsenic 34.6 Barium 962 Beryllium 25.1 Cadmium 9 Chromium 8,520 Cobalt 62.2 Cyanide, total 11 Iron 71,000 Mercury 21.4 Nickel 618 Vanadium 5,700 Zinc 1,070
SW02
Oct-90VOCs NESEMI VOCs NAMETALs Chromium 120 Iron 1,210 Lead 7.6 Vanadium 310
SW03Oct-90VOCs TCE 3 JSEMI VOCs b(2-e)P 2 JPESTICIDES/PCB NDMETALs Arsenic 2.4 D Chromium 208 Chromium VI 54 Lead 3.8 D Vanadium 246
SW04
Oct-90VOCs NESEMI VOCs NAMETALs Chromium 99 Lead 5.5 D Vanadium 286
SW05
Aug-95METALs Arsenic 3.2 Chromium 101 Lead 2.9 Vanadium 64.3 Zinc 287
SW-8
Aug-95METALs Chromium 47.6 Iron 1,710 Vanadium 33
SW-11
Aug-95METALs NE Vanadium 257
SW-21
Aug-95METALs Arsenic 2.8 Chromium 46.8 Iron 3,080 Lead 2.7 Vanadium 413
SW-25
Aug-95METALs Lead 3.4 Vanadium 145
SW-27
Aug-95METALs NE
SW-30
Aug-95METALs NE
SW-31
Oct-90VOCs NESEMI VOCs NAMETALs Chromium 99 Lead 5.5 D Vanadium 286
SW05
USEPANRWQC **Freshwater
CCCUnits (ppb) (ppb) (ppb)
PARAMETERSVOCs Trichloroethene (TCE) 47 1 N/ASEMI VOCs
0.3 1.2 N/AMETALs Antimony 80 5.6 N/A Arsenic 150 0.017 150 Barium 220 2,000 N/A Beryllium 3.6 6 N/A Cadmium 0.25 3.4 0.25 Chromium 42 92 74 Chromium VI 10 N/A 11 Cobalt 24 N/A N/A Cyanide, total 5.2 140 5.2 Iron 1,000 N/A 1,000 Lead 5.4 5 2.5 Mercury 0.77 0.05 0.77 Nickel 52 500 52 Vanadium 12 N/A N/A Zinc 120 7,400 120
* - NJDEP ECOLOGICAL SCREENING CRITERIA, FRESHWATER CRITERIA, MARCH 2009** EPA NATIONAL RECOMMENDED WATER QUALITY CRITERIA, 2009BOLD - CONCENTRATION ABOVE THE NJDEP SCREENING CRITERIA AND/OR EPA WATER QUALITY CRITERIACONCENTRATIONS ARE REPORTED IN PARTS PER BILLION (PPB) OR MICROGRAMS PER LITER (UG/L)
NJDEP Ecological
Bis(2-ethylhexyl) phthalate
Screening Criteria *Aquatic Chronic
Human Health
R2-0000343

Date Aug-95Depth (0 - 0.5)
PESTICIDES/PCB'S4,4-DDE 0.0124,4-DDT 0.014
SD-6B
Date Oct-90Depth (0 - 0.5)
VOLATILE ORGANICS NE
BASE NEUTRAL / ACIDSPHENOL 1 JBENZOIC ACID 1 Jbis(2-ETHYLHEXYL)PHTHALATE 0.580 J
PESTICIDES/PCB'S4,4-DDE 0.018 J4,4-DDD 0.0053 J4,4-DDT 0.033 JAROCLOR-1254 0.160 J
SD01
Date Oct-90Depth (0 - 0.5)
VOLATILE ORGANICSMethylene Chloride 0.870 B
SD02
Date Oct-90Depth (0 - 0.5)
VOLATILE ORGANICS NE
SD03
Date Oct-90Depth (0 - 0.5)
VOLATILE ORGANICS NE
BASE NEUTRAL / ACIDSPHENOL 0.520 JBENZOIC ACID 3.2 Jbis(2-ETHYLHEXYL)PHTHALATE 0.270 JBenzo(b)fluoranthene 0.110 J
PESTICIDES/PCB'S4,4-DDE 0.011 J4,4-DDD 0.018 J4,4-DDT 0.028 JAROCLOR-1254 0.095 J
SD04
Date Oct-90Depth (0 - 0.5)
VOLATILE ORGANICSCarbon Disulfide 0.0040 J
SD05
Date Aug-95Depth (0 - 0.5)
PESTICIDES/PCB'S4,4-DDE 0.0124,4-DDT 0.014
SD-6B
Date Aug-95Depth (0 - 0.5)
PESTICIDES/PCB'S ND
SD-11Date Aug-95
Depth (0 - 0.5)PESTICIDES/PCB'SAROCLOR-1248 1.3AROCLOR-1260 0.59
SD-15
Date Aug-95Depth (0 - 0.25)
PESTICIDES/PCB'S4,4-DDE 0.0464,4-DDD 0.0744,4-DDT 0.051
SD-21
Date Aug-95Depth (0 - 0.5)
PESTICIDES/PCB'S ND
SD-24
NJDEP EPA Ecological
Region III ScreeningBTAG * Criteria **
VOLATILE ORGANICS (ppm)METHYLENE CHLORIDE N/A 0.159CARBON DISULFIDE 0.000851 N/ATRICHLOROETHENE 0.0969 0.112
BASE NEUTRAL / ACIDS (ppm)PHENOL 0.42 0.0491BENZOIC ACID 0.65 N/Abis(2-ETHYLHEXYL)PHTHALATE 0.18 0.182Benzo(b)fluoranthene 0.0272 10.4
PESTICIDES/PCB'S (ppm)4,4-DDE 0.00316 0.0054,4-DDD 0.00488 0.0084,4-DDT 0.00416 0.007AROCLOR-1248 0.0598 (a) 0.03AROCLOR-1254 0.0598 (a) 0.06AROCLOR-1260 0.0598 (a) 0.005
* EPA Region III BTAG Freshwater Sediment Screening Benchmarks, August 2006.** NJDEP Ecological Screening Criteria, Sediment, Freshwater Criteria, Lowest Effects Levels (LEL), March 2009.
Bold - Concentration above the NJDEP Screening Criteria and/or EPA Screening BenchmarkAll concentrations reported in parts per million (ppm) or milligrams per kilogram (mg/kg)
(a) Criteria for total PCB usedN/A No Criteria Available
R2-0000344

Date Oct-90Depth (0 - 0.5)
ALUMINUM 13,500ANTIMONY NDARSENIC 5.1BARIUM 129BERYLLIUM 9.1CADMIUM NDCALCIUM 2,960CHROMIUM 1,220CHROMIUM VI NDCOBALT 6.0 DCOPPER 25.3IRON 13,600LEAD 364MAGNESIUM 868 DMANGANESE 238MERCURY NDNICKEL 64.1POTASSIUM 597 DSELENIUM 4.4SILVER NDSODIUM 199 DVANADIUM 1,890ZINC 231THALLIUM ND
SD01Date Oct-90
Depth (0 - 0.5)ALUMINUM 26,500ANTIMONY 270ARSENIC 16.1 DBARIUM 408 DBERYLLIUM 22.8CADMIUM NDCALCIUM 3,790 DCHROMIUM 15,700CHROMIUM VI NDCOBALT 45.3 DCOPPER 327IRON 17800LEAD 338MAGNESIUM 1,300 DMANGANESE 227MERCURY 2.2NICKEL 423POTASSIUM NDSELENIUM NDSILVER NDSODIUM 860 DVANADIUM 4850ZINC 529
SD02
Date Oct-90Depth (0 - 0.5)
ALUMINUM 5,070ANTIMONY 36.3ARSENIC 12.3BARIUM 146BERYLLIUM 5.9CADMIUM NDCALCIUM 1,210 DCHROMIUM 1,950CHROMIUM VI NDCOBALT 16.5 DCOPPER 93.0IRON 8500LEAD 104MAGNESIUM 507 DMANGANESE 227MERCURY 0.16NICKEL 257POTASSIUM 471 DSELENIUM NDSILVER NDSODIUM 553 DVANADIUM 1160ZINC 164THALLIUM ND
SD03
Date Oct-90 Mar-09Depth (0 - 0.5) (0-0.5)
ALUMINUM 6780 NAANTIMONY 28.7 NAARSENIC 8.4 3.3 J BARIUM 194 NABERYLLIUM 3.8 NACADMIUM ND NDCALCIUM 1,500 D N/ACHROMIUM 1,770 657 JCHROMIUM VI ND NACOBALT 14.2 NACOPPER 149 32.6 JIRON 8300 6,380 JLEAD 51.8 34.6 JMAGNESIUM 447 D NAMANGANESE 336 238 JMERCURY 0.88 0.21 JNICKEL 135 49.7 JPOTASSIUM ND NASELENIUM 1.1 D NASILVER ND NASODIUM 257 D NAVANADIUM 647 NAZINC 115 57.7 JTHALLIUM ND NA
SD04
Date Oct-90Depth (0 - 0.5)
ALUMINUM 9750ANTIMONY 35.8 DARSENIC 9.8BARIUM 307BERYLLIUM 5.6CADMIUM NDCALCIUM 3470CHROMIUM 2,350CHROMIUM VI NDCOBALT 21.3 DCOPPER 65.8IRON 10,400LEAD 69.8MAGNESIUM 745 DMANGANESE 655MERCURY 1.1NICKEL 96.5POTASSIUM NDSELENIUM 1.9 DSILVER NDSODIUM 554 DVANADIUM 800ZINC 175THALLIUM ND
SD05
Date Aug-95 Sep-95 Aug-95Depth (0-0.5) (0 - 0.5) (0.5-1)
ALUMINUM 21,500 29,900 9,050ANTIMONY 96 122 44.7ARSENIC 8.2 24.8 6.2BARIUM 390 462 213BERYLLIUM 4 14.6 1.2CADMIUM 3.1 2.3 NDCALCIUM 2,790 3,170 3,310CHROMIUM 5,360 7,620 2,200CHROMIUM VI 2.4 NA NDCOBALT 36 36.4 8.7COPPER 230 241 43.5IRON 40,500 40,800 14,300LEAD 336 381 108MAGNESIUM 1,960 2,440 1,120MANGANESE 731 696 985MERCURY 0.81 1.4 0.16NICKEL 559 472 73POTASSIUM 922 1,930 636SELENIUM 1.3 1 NDSILVER ND ND NDSODIUM 1,240 1,990 1,510VANADIUM 3,530 3,030 713ZINC 513 574 146THALLIUM ND 1.1 ND
SD-10
Date Aug-95 Sep-95 Aug-95 Mar-09Depth (0-0.5) (0 - 0.5) (0.5-1.2) (0 - 0.5)
ALUMINUM 4,320 4,220 2,710 NAANTIMONY ND ND ND NAARSENIC 2 2.7 1.8 NDBARIUM 236 198 296 NABERYLLIUM 1.6 1.6 1.1 NACADMIUM 2.1 ND 1.8 NDCALCIUM 3,090 2,420 4,560 NACHROMIUM 6.8 5.9 4.9 7.8 JCHROMIUM VI NA NA 11.4 NACOBALT 31.7 28.1 12.5 NACOPPER 9.6 6.2 8.1 NDIRON 4,210 4,770 3,970 5,620 JLEAD 58.5 35.8 ND 56.3 JMAGNESIUM 705 539 1,030 NAMANGANESE 271 328 279 406 JMERCURY 1.3 1.2 0.3 0.70 JNICKEL 16.2 12.8 4.8 NDPOTASSIUM 385 ND 500 NASELENIUM ND 0.99 ND NASILVER ND ND ND NASODIUM 192 186 251 NAVANADIUM 10.9 7.8 12.7 NAZINC 68.7 39.9 23.2 78.6 JTHALLIUM ND ND ND NA
SD-30
NJDEP EPA Ecological
Region III ScreeningBTAG * Criteria **
METALS (PPM)ALUMINUM N/A 25,500ANTIMONY 2 N/AARSENIC 9.8 6BARIUM N/A N/ABERYLLIUM N/A N/ACADMIUM 0.99 0.6CALCIUM N/A N/ACHROMIUM 43.4 26CHROMIUM VI N/A N/ACOBALT 50 50COPPER 31.6 16IRON 20000 N/ALEAD 35.8 31MAGNESIUM N/A N/AMANGANESE 460 630MERCURY 0.18 0.2NICKEL 22.7 16POTASSIUM N/A N/ASELENIUM 2 N/ASILVER 1 0.5SODIUM N/A N/AVANADIUM N/A N/AZINC 121 120THALLIUM N/A N/A
* EPA Region III BTAG Freshwater Sediment Screening Benchmarks, August 2006.** NJDEP Ecological Screening Criteria, Sediment, Freshwater Criteria,
Lowest Effects Levels (LEL), March 2009.Bold - Concentration above the NJDEP Screening Criteria and/or EPA Screening Benchmark
All concentrations reported in parts per million (ppm) or milligrams per kilogram (mg/kg)N/A No Criteria Available
DateDepth (0 - 0.5) (0.5 - 1.2)
ALUMINUM 3,860 2,540ANTIMONY ND NDARSENIC 1.2 0.6BARIUM 39 52.3BERYLLIUM 0.18 0.24CADMIUM ND 0.62CALCIUM 245 596CHROMIUM 4.4 3.5COBALT 3.8 6COPPER 2 3.8IRON 3,310 2,710LEAD 11.6 21.4MAGNESIUM 241 240MANGANESE 41.3 90.3MERCURY ND 0.1NICKEL 2.4 3.1POTASSIUM 201 240SELENIUM 0.27 NDSILVER ND NDSODIUM 56.8 100VANADIUM 7.2 5.5ZINC 8.7 36.3THALLIUM ND ND
Aug-95SD-29
DateDepth (0 - 0.5) (0.5 - 1.2)
ALUMINUM 276 852ANTIMONY ND NDARSENIC 0.36 2.3BARIUM 32.9 78.2BERYLLIUM 0.21 0.46CADMIUM ND NDCALCIUM 607 1960CHROMIUM 110 210COBALT 1.6 2.7COPPER 1.8 3.6IRON 448 1810LEAD 4.4 20.2MAGNESIUM 138 441MANGANESE 56.9 129MERCURY ND NDNICKEL 2.7 6.7POTASSIUM 70.1 171SELENIUM ND 0.91SILVER ND NDSODIUM 140 295VANADIUM 32.2 68.6ZINC 5.9 9.7THALLIUM ND ND
Aug-95SD-26
Date Aug-95Depth (0 - 0.5)
ALUMINUM 622ANTIMONY NDARSENIC 1.6BARIUM 23BERYLLIUM 0.39CADMIUM NDCALCIUM 468CHROMIUM 122COBALT 2.3COPPER 2.4IRON 2,040LEAD 17MAGNESIUM 97.9MANGANESE 34.9MERCURY 0.08NICKEL 3.2POTASSIUM 177SELENIUM NDSILVER NDSODIUM 86.4VANADIUM 62.9ZINC 11.6THALLIUM ND
SD-28
DateDepth (0 - 0.5) (0.5 - 1.2)
ALUMINUM 430 436ANTIMONY ND NDARSENIC 0.39 0.33BARIUM 14.2 14.9BERYLLIUM 0.18 0.27CADMIUM ND NDCALCIUM 171 160CHROMIUM 72.4 41.4COBALT 3.7 2.5COPPER 1.8 1.8IRON 486 354LEAD 5.8 5.5MAGNESIUM 43.7 43.7MANGANESE 16.6 72.2MERCURY ND NDNICKEL 1.9 3.5POTASSIUM 175 94.9SELENIUM ND NDSILVER ND NDSODIUM 89.1 60.7VANADIUM 15.2 9.8ZINC 7.6 9.1THALLIUM ND ND
SD-27Aug-95
DateDepth (0 - 0.5) (0.5- 1.2)
ALUMINUM 667 1,110ANTIMONY ND NDARSENIC 1.1 0.48BARIUM 47.8 44.2BERYLLIUM 0.34 0.23CADMIUM ND NDCALCIUM 990 1,140CHROMIUM 83.4 12.2COBALT 1.5 1.8COPPER 2.4 1.8IRON 952 835LEAD 5.4 4.7MAGNESIUM 181 393MANGANESE 147 106MERCURY ND 0.1NICKEL 3.3 2POTASSIUM 113 198SELENIUM 0.44 0.77SILVER ND NDSODIUM 265 543VANADIUM 36.7 7.1ZINC 8.3 2.7THALLIUM ND ND
SD-24Aug-95 Date Aug-95 Sep-95 Mar-09
Depth (0 - 0.5) (0 - 0.5) (0 - 0.5)ALUMINUM 10,800 11,900 NAANTIMONY 33.7 72 NAARSENIC 11.8 22.4 4.4 JBARIUM 273 284 NABERYLLIUM 4.9 3.1 NACADMIUM 1.6 1.6 NDCALCIUM 3,410 3,140 NACHROMIUM 3,500 2,880 418 JCOBALT 13.9 20.9 NACOPPER 75.9 73 22.3 JIRON 13,600 14,600 6,290 JLEAD 68.2 84.7 35.5 JMAGNESIUM 948 1,020 NAMANGANESE 370 465 85.7 JMERCURY 0.43 0.32 0.13 JNICKEL 108 95.6 18.1 JPOTASSIUM 214 579 NASELENIUM ND 1.8 NASILVER ND ND NASODIUM 1,420 1,510 NAVANADIUM 658 479 NAZINC 131 187 63.8 JTHALLIUM ND NA NA
SD-23
Date Aug-95Depth (0 - 0.5)
ALUMINUM 3,730ANTIMONY 41ARSENIC 7.6BARIUM 146BERYLLIUM 2.2CADMIUM NDCALCIUM 2,060CHROMIUM 1,360COBALT 7.6COPPER 41.3IRON 5,670LEAD 44.2MAGNESIUM 375MANGANESE 436MERCURY 0.24NICKEL 57POTASSIUM NDSELENIUM NDSILVER NDSODIUM 681VANADIUM 283ZINC 90.1THALLIUM ND
SD-22Date
Depth (0 - 0.25)(0.25-0.75)ALUMINUM 24,000 1,420ANTIMONY 56.3 NDARSENIC 22.1 0.48BARIUM 473 17.1BERYLLIUM 6.4 0.25CADMIUM ND NDCALCIUM 3,760 169CHROMIUM 5,820 133COBALT 27.6 0.8COPPER 196 5.8IRON 27,300 1,110LEAD 174 4.2MAGNESIUM 1,500 91.2MANGANESE 928 28.8MERCURY 1.3 NDNICKEL 122 6.3POTASSIUM 465 NDSELENIUM 0.61 NDSILVER ND NDSODIUM 1,090 122VANADIUM 791 38.7ZINC 249 9.9THALLIUM ND ND
Aug-95SD-21
Date Aug-95 Sep-95 Mar-09Depth (0 - 0.5) (0 - 0.5) (0-0.5)
ALUMINUM 18,300 32,700 NAANTIMONY 25 107 NAARSENIC 24.6 77.6 2.4 JBARIUM 444 688 NABERYLLIUM 16.3 22.6 NACADMIUM ND 2.9 NDCALCIUM 3,190 5,110 NACHROMIUM 4,060 7,630 388 JCHROMIUM VI 6.9 NA NACOBALT 47.3 67.3 NACOPPER 181 323 22.9 JIRON 27,000 43,500 3,660 JLEAD 147 266 25.8 JMAGNESIUM 1,230 2,220 NAMANGANESE 1,160 1,210 173 JMERCURY 1.4 4.4 0.14 JNICKEL 572 959 52.7 JPOTASSIUM 366 1,650 NASELENIUM 2.3 3.4 NASILVER ND 3.9 NASODIUM 1,900 2,450 NAVANADIUM 2,690 4,870 NAZINC 427 767 39.1 JTHALLIUM ND NA NA
SD-19
Date Aug-95 Mar-09Depth (0 - 0.5) (0-0.5)
ALUMINUM 15,500 NAANTIMONY 41.1 NAARSENIC 7.5 27.5 JBARIUM 121 NABERYLLIUM 5.4 NACADMIUM ND NDCALCIUM 1,270 NACHROMIUM 3,620 6,160 JCOBALT 18.9 NACOPPER 112 230 JIRON 17,200 24,200 JLEAD 143 177 JMAGNESIUM 896 NAMANGANESE 125 460 JMERCURY 8.3 2.5 JNICKEL 210 332 JPOTASSIUM 813 NASELENIUM ND NASILVER ND NASODIUM 1,280 NAVANADIUM 753 NAZINC 117 258 JTHALLIUM ND NA
SD-18 Date Aug-95Depth (0 - 0.5)
ALUMINUM 26,700ANTIMONY 77.8ARSENIC 14.6BARIUM 506BERYLLIUM 13.2CADMIUM NDCALCIUM 2,830CHROMIUM 8,050COBALT 25.4COPPER 244IRON 33,500LEAD 208MAGNESIUM 1,770MANGANESE 286MERCURY 1.6NICKEL 142POTASSIUM 1,150SELENIUM 1.4SILVER NDSODIUM 2,250VANADIUM 2,010ZINC 316THALLIUM ND
SD-13Date Aug-95
Depth (0 - 0.5) (0-0.5) (0.5-1) (1-2)ALUMINUM 24,100 NA NA NAANTIMONY 170 NA NA NAARSENIC 23.8 7.1 J 5.4 2.5BARIUM 288 NA NA NABERYLLIUM 3.5 NA NA NACADMIUM ND ND ND NDCALCIUM 2,380 NA NA NACHROMIUM 9,740 2,960 J 152 J 30.3 JCOBALT 19.5 NA NA NACOPPER 361 148 J 17.4 4.8IRON 30,500 14,600 J 4,380 2,500LEAD 280 108 J 31.2 10.2MAGNESIUM 1,590 NA NA NAMANGANESE 401 48.7 J 12 50.6MERCURY 1.9 1.5 J 0.47 0.26NICKEL 199 58.6 J 8.5 17.8POTASSIUM ND NA NA NASELENIUM 5.3 NA NA NASILVER ND NA NA NASODIUM 3,370 NA NA NAVANADIUM 2,720 NA NA NAZINC 374 81.8 J 19 41.9THALLIUM ND NA NA NA
Mar-09SD-12 Date Aug-95 Sep-95 Aug-95
Depth (0 - 0.5) (0 - 0.5) (0.5 - 1) (0-0.5) (0.5-1)ALUMINUM 10,500 20,800 1,350 NA NAANTIMONY 78.4 60.5 ND NA NAARSENIC 7.3 14.5 0.31 5.5 J NDBARIUM 323 449 10.1 NA NABERYLLIUM 2.4 8.6 0.16 NA NACADMIUM ND ND ND 1.2 J NDCALCIUM 3720 3870 278 NA NACHROMIUM 4,600 5,130 48.4 5,440 J 219 JCOBALT 14.4 21.7 ND NA NACOPPER 101 95.8 2.1 80.4 J 4.1IRON 15,900 27,600 400 16,700 J 794LEAD 117 222 3.7 124 J 4.2MAGNESIUM 1590 1890 114 NA NAMANGANESE 362 498 20.6 153 J 33.7MERCURY ND 0.54 ND 0.31 J NDNICKEL 131 168 ND 114 J 11.5POTASSIUM 896 1,960 ND NA NASELENIUM 1.8 1.9 0.24 NA NASILVER ND ND ND NA NASODIUM 2,610 2,970 335 NA NAVANADIUM 1,050 1,620 11.4 NA NAZINC 241 310 5.1 231 J 24.9THALLIUM ND ND ND NA NA
Mar-09SD-9A
Date Aug-95Depth (0 - 0.5)
ALUMINUM 5,170ANTIMONY NDARSENIC 0.46BARIUM 83.7BERYLLIUM 1CADMIUM 0.6CALCIUM 1,180CHROMIUM 150COBALT 2.5COPPER 6.1IRON 4,310LEAD 109MAGNESIUM 1,050MANGANESE 210MERCURY NDNICKEL 24POTASSIUM 333SELENIUM 0.83SILVER NDSODIUM 136VANADIUM 137ZINC 47.6THALLIUM ND
SD-7
Date Aug-95 Mar-09Depth (0 - 0.5) (0 - 0.5)
ALUMINUM 13,500 NAANTIMONY ND NAARSENIC 1.9 12.7BARIUM 122 NABERYLLIUM 1.8 NACADMIUM 0.55 0.86CALCIUM 2,910 NACHROMIUM 61.5 270 JCOBALT 5 NACOPPER 10.5 29.5IRON 16,800 36,800LEAD 97.8 278MAGNESIUM 1,620 NAMANGANESE 297 945MERCURY 0.09 0.12NICKEL 25.2 115POTASSIUM 322 NASELENIUM 0.27 NASILVER ND NASODIUM 99.9 NAVANADIUM 284 NAZINC 59.2 216THALLIUM ND NA
SD-6ADate Aug-95
Depth (0 - 0.5)ALUMINUM 5,090ANTIMONY NDARSENIC 1.4BARIUM 43BERYLLIUM 0.81CADMIUM 0.59CALCIUM 1,350CHROMIUM 30.1COBALT 2.2COPPER 4.5IRON 7,210LEAD 59.6MAGNESIUM 635MANGANESE 137MERCURY 0.06NICKEL 11.7POTASSIUM 219SELENIUM NDSILVER NDSODIUM 80.7VANADIUM 134ZINC 23.8THALLIUM ND
SD-6BDate Aug-95
Depth (0 - 0.5)ALUMINUM 12,400ANTIMONY NDARSENIC 2.1BARIUM 123BERYLLIUM 1.6CADMIUM 0.48CALCIUM 2,530CHROMIUM 66.2COBALT 3.9COPPER 8.7IRON 12,400LEAD 97.2MAGNESIUM 1,760MANGANESE 320MERCURY 0.09NICKEL 29.5POTASSIUM 330SELENIUM 0.38SILVER NDSODIUM 93.3VANADIUM 261ZINC 58.3THALLIUM ND
SD-6C
Date Aug-95Depth (0 - 0.5)
ALUMINUM 5,350ANTIMONY 31.8ARSENIC 1BARIUM 190BERYLLIUM 1.4CADMIUM NDCALCIUM 2,540CHROMIUM 628COBALT 4.8COPPER 46.2IRON 4470LEAD 46.9MAGNESIUM 917MANGANESE 109MERCURY 0.16NICKEL 80.9POTASSIUM 234SELENIUM 0.93SILVER NDSODIUM 846VANADIUM 150ZINC 125THALLIUM ND
SD-8
Date Aug-95 Aug-95Depth (0 - 0.5) (0.5 - 1)
ALUMINUM 9,340 1,200ANTIMONY 29.6 NDARSENIC 4.6 0.32BARIUM 163 22.4BERYLLIUM 1.8 0.32CADMIUM ND NDCALCIUM 2,630 352CHROMIUM 1,400 227COBALT 5.6 NDCOPPER 34.3 4.3IRON 7280 895LEAD 97.7 7.9MAGNESIUM 935 147MANGANESE 248 22.5MERCURY 0.14 NDNICKEL 57.1 9.7POTASSIUM 663 NDSELENIUM 2 0.32SILVER ND NDSODIUM 1,290 378VANADIUM 781 91.1ZINC 101 14.9THALLIUM ND ND
SD-9Date Aug-95Depth (0 - 0.5)
ALUMINUM 15,800ANTIMONY 48.8ARSENIC 16.3BARIUM 165BERYLLIUM 8.2CADMIUM 2.4CALCIUM 1,830CHROMIUM 4,040COBALT 16.4COPPER 361IRON 19,500LEAD 148MAGNESIUM 1,510MANGANESE 387MERCURY 1.2NICKEL 256POTASSIUM 465SELENIUM 3.4SILVER NDSODIUM 1,830VANADIUM 1,330ZINC 468THALLIUM ND
SD-11Date Aug-95 Sep-95
Depth (0 - 0.5) (0 - 0.5)ALUMINUM 22,700 23,400ANTIMONY 86.5 91.6ARSENIC 18.7 30.7BARIUM 334 405BERYLLIUM 6 9.4CADMIUM ND 3.6CALCIUM 3,400 3,300CHROMIUM 8,190 6,700COBALT 21.2 28.3COPPER 185 249IRON 22,700 29,100LEAD 144 264MAGNESIUM 1,740 1,650MANGANESE 265 296MERCURY 1.2 1.2NICKEL 124 222POTASSIUM 705 1,110SELENIUM 1.6 3.8SILVER ND NDSODIUM 2,350 2,410VANADIUM 710 1,740ZINC 216 350THALLIUM ND NA
SD-14Date Aug-95
Depth (0 - 0.5)ALUMINUM 17,000ANTIMONY 70.8ARSENIC 11.6BARIUM 425BERYLLIUM 11.7CADMIUM NDCALCIUM 5,070CHROMIUM 6,730COBALT 21.2COPPER 335IRON 12,900LEAD 149MAGNESIUM 1,820MANGANESE 1,200MERCURY 0.46NICKEL 552POTASSIUM 522SELENIUM NDSILVER NDSODIUM 778VANADIUM 1,740ZINC 484THALLIUM ND
SD-16
Date Aug-95Depth (0 - 0.5) (0-0.5) (0.5-1) (1-2)
ALUMINUM 6,800 NA NA NAANTIMONY ND NA NA NAARSENIC 16.1 8 J 5.6 J NDBARIUM 228 NA NA NABERYLLIUM 21.1 NA NA NACADMIUM ND ND 0.52 J NDCALCIUM 918 NA NA NACHROMIUM 2,100 698 J 1,190 J 568 JCOBALT 30.6 NA NA NACOPPER 276 85.8 J 59.8 J 18IRON 14,500 17,700 J 11,800 J 2,690LEAD 140 85.5 J 62.3 J 18MAGNESIUM 1250 NA NA NAMANGANESE 141 272 J 287 J 70.3MERCURY 0.89 0.48 J 0.36 J 0.057NICKEL 1090 218 J 145 J 52.7POTASSIUM ND NA NA NASELENIUM 1.3 NA NA NASILVER MD NA NA NASODIUM 794 NA NA NAVANADIUM 3,680 NA NA NAZINC 374 128 J 91.8 J 23.8THALLIUM ND NA NA NA
Mar-09SD-15
Date Aug-95 Sep-95Depth (0 - 0.5) (0 - 0.5) (0-0.5) (0.5-1)
ALUMINUM 8,360 18,700 NA NAANTIMONY 54.3 147 NA NAARSENIC 12.6 49.3 15.6 J 4.5 JBARIUM 262 349 NA NABERYLLIUM 4.6 7.5 NA NACADMIUM ND 2.4 0.59 J NDCALCIUM 2,460 3,320 NA NACHROMIUM 5,760 8,500 3,150 J 1,060 JCOBALT 27.2 39.5 NA NACOPPER 123 163 147 J 14.7 JIRON 18,300 32,400 16,700 J 8,050 JLEAD 133 320 156 J 49.3 JMAGNESIUM 1,540 2,220 NA NAMANGANESE 977 1030 291 J 82.8 JMERCURY 0.45 0.56 0.63 J 0.42 JNICKEL 428 655 356 J 20 JPOTASSIUM 630 1,730 NA NASELENIUM ND 1.3 NA NASILVER ND ND NA NASODIUM 1,110 2,910 NA NAVANADIUM 658 1,330 NA NAZINC 315 427 192 J 27.4 JTHALLIUM ND ND NA NA
SD-17Mar-09
Date Sep-95 Mar-09Depth (0 - 0.5) (0 - 0.5)
ALUMINUM 3,900 NAANTIMONY ND NAARSENIC 1.5 NDBARIUM 82.7 NABERYLLIUM ND NACADMIUM ND NDCALCIUM 908 NACHROMIUM 7.5 38.3 JCOBALT 5.8 NACOPPER 6.6 28.3 JIRON 2,470 15,000 JLEAD 25.8 91.9 JMAGNESIUM 324 NAMANGANESE 35.4 66.9 JMERCURY 0.92 1.5 JNICKEL ND 22.3 JPOTASSIUM ND NASELENIUM 1.6 NASILVER ND NASODIUM 128 NAVANADIUM 7 NAZINC 11.3 87.6 J
SD-35
Date Aug-95Depth (0 - 0.5)
ALUMINUM 1,070ANTIMONY NDARSENIC NDBARIUM 25.3BERYLLIUM 0.18CADMIUM NDCALCIUM 331CHROMIUM 1.6COBALT 8.9COPPER 1.3IRON 590LEAD 4MAGNESIUM 93.6MANGANESE 91.4MERCURY 0.07NICKEL 2.6POTASSIUM NDSELENIUM NDSILVER NDSODIUM 70.5VANADIUM 1.4ZINC 10.6
SD-31
Date Aug-95 Mar-09Depth (0 - 0.5) (0-0.5)
ALUMINUM 5,340 NAANTIMONY 6.6 NAARSENIC 2.3 2.2 JBARIUM 129 NABERYLLIUM 1.3 NACADMIUM ND NDCALCIUM 1,450 NACHROMIUM 736 344 JCOBALT 5.2 NACOPPER 15.7 23.3 JIRON 3,770 4,610 JLEAD 21.3 19.9 JMAGNESIUM 509 NAMANGANESE 273 179 JMERCURY 0.21 0.32 JNICKEL 22 39.4 JPOTASSIUM 278 NASELENIUM 0.29 NASILVER ND NASODIUM 767 NAVANADIUM 122 NAZINC 32.6 41.9 J
SD-20
Date Mar-09Depth (0 - 0.5) (0.5-1.2) (0 - 0.5)
ALUMINUM 729 2,300 NAANTIMONY 8.2 ND NAARSENIC 1.7 2.3 3 JBARIUM 68.8 178 NABERYLLIUM 0.76 1.9 NACADMIUM ND ND NDCALCIUM 1,360 4,130 NACHROMIUM 340 242 594 JCOBALT 2.7 2.6 NACOPPER 4.8 4.4 13.2 JIRON 961 3,390 3,830 JLEAD 5.3 3.4 29.1 JMAGNESIUM 289 913 NAMANGANESE 92.5 215 224 JMERCURY 0.2 0.2 0.15 JNICKEL 10.3 9 22.4 JPOTASSIUM 281 529 NASELENIUM 0.62 1.6 NASILVER ND ND NASODIUM 296 661 NAVANADIUM 91.9 114 NAZINC 10.9 11.1 56.5 J
Aug-95SD-25
Date Aug-95 Mar-09Depth (0 - 0.5) (0-0.5)
ALUMINUM 5,340 NAANTIMONY 6.6 NAARSENIC 2.3 2.2 JBARIUM 129 NABERYLLIUM 1.3 NACADMIUM ND ND
SD-20
Date Apr-96Depth (0 - 0.5)
CHROMIUM 2720COPPER 178NICKEL 371VANADIUM 1820
SD-106BDate Apr-96
Depth (0 - 0.5)CHROMIUM 3410COPPER 73.7NICKEL 243VANADIUM 3130
SD-105B
Date Apr-96Depth (0 - 0.5)
CHROMIUM 3460COPPER 82.3NICKEL 175VANADIUM 4110
SD-105C
Date Apr-96Depth (0 - 0.5)
CHROMIUM 3220COPPER 39.1NICKEL 46.6
SD-101A
Date Apr-96Depth (0 - 0.5)
CHROMIUM 415COPPER 12.1NICKEL 41.2VANADIUM 136
SD-100A
R2-0000345
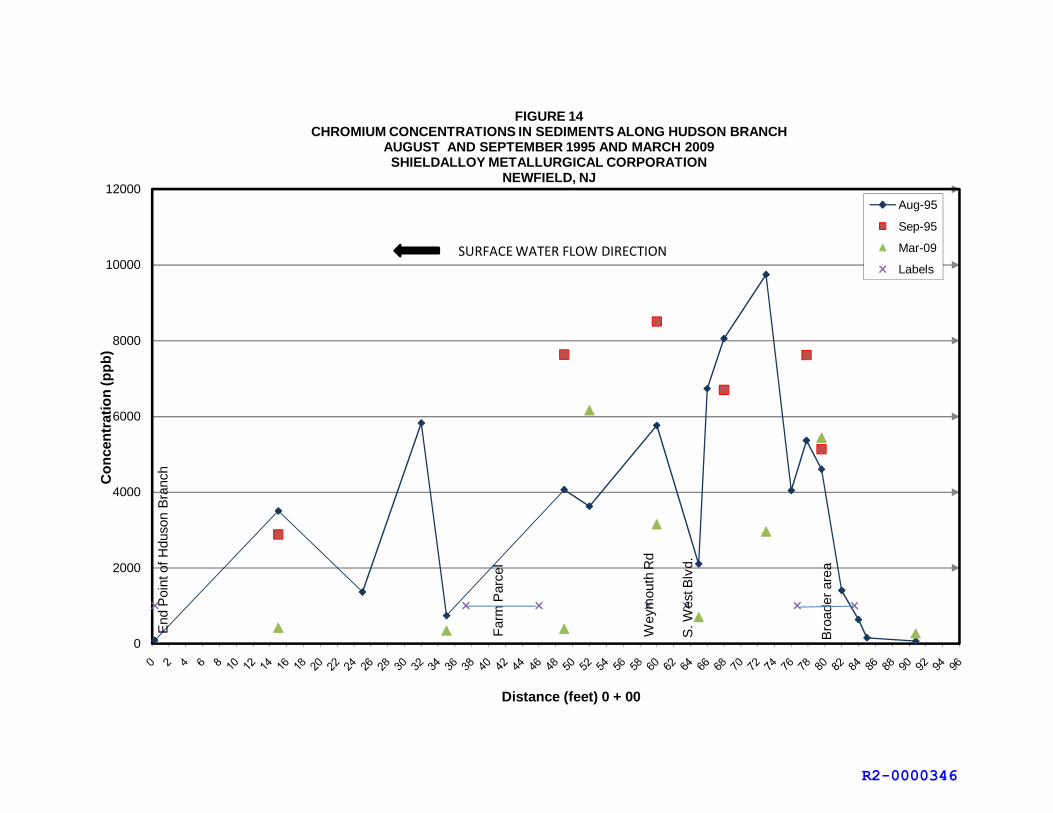
End
Poi
nt o
f H
duso
n B
ranc
h
Far
m P
arce
l
Wey
mou
th R
d
S. W
est B
lvd.
Bro
ader
are
a
0
2000
4000
6000
8000
10000
12000
Con
cent
ratio
n (p
pb)
Distance (feet) 0 + 00
FIGURE 14CHROMIUM CONCENTRATIONS IN SEDIMENTS ALONG HUDSON BRANCH
AUGUST AND SEPTEMBER 1995 AND MARCH 2009SHIELDALLOY METALLURGICAL CORPORATION
NEWFIELD, NJ
Aug-95
Sep-95
Mar-09
Labels
SURFACEWATER FLOW DIRECTION
R2-0000346

I I
I I
I I
I I
I I
I I
I I
I I
I I \L_
0 ~~~~
\~L__ -d)o~
1=1_
,.---
1~[
I I
I I
I I
I I
I I
I I
I I l ,--
. ,_
____
__ _
I l!!!-
--------
11 I
I I
• i
. f
: +
~ ~~ ~I ~
----
1 ~
R2-0000347

R2-0000348

R2-0000349

ID Task Name Duration Start Finish
1 OU2 SUPPLEMENTAL RI 619 days 5/27/11 7/17/132 TASK I - SUPPLEMENTAL RI WORKPLAN 70 days 5/27/11 8/25/11
3 Submit Supplemental Remedial Investigation (RI)Workplan (QAPP, HASP, CSM, SLERA)
0 days 5/27/11 5/27/11
4 USEPA Review 40 days 5/27/11 7/19/11
5 Prepare Revised Supplemental Work Plan 15 days 7/19/11 8/5/11
6 Submit Revised Supplemental Work Plan 0 days 8/5/11 8/5/11
7 USEPA Review & Approval of the Work Plan 15 days 8/5/11 8/25/11
8 TASK II - COMMUNITY RELATIONS 1 day 8/25/11 8/25/119 (To Be Developed by USEPA) 1 day 8/25/11 8/25/11
10 TASK III - SITE CHARACTERIZATION 419.25 days 8/25/11 2/5/1311 2 Week Notice to USEPA 10 days 8/25/11 9/7/11
12 Conduct Field Investigation 150 days 9/7/11 3/15/12
13 Notify USEPA of Completed Field Work 0 days 3/15/12 3/15/12
14 Laboratory Sample Analysis 24 days 3/15/12 4/13/12
15 Perform Usability Assessment and Data Validation 47 days 4/26/12 6/26/12
16 Submit Validated Data to USEPA 0 days 6/26/12 6/26/12
17 Prepare Site Characterization Summary Rep. 35 days 6/26/12 8/9/12
18 Submit Site Characterization Summary Rep. 0 days 8/9/12 8/9/12
19 USEPA Review 26 days 8/9/12 9/12/12
20 Prepare Revised Site Characterization SummaryRep.
15 days 10/2/12 10/19/12
21 Submit Revised Site Characterization SummaryRep.
0 days 10/22/12 10/22/12
22 USEPA Approval of Revised Site CharacterizationSummary Rep.
18 days 10/24/12 11/15/12
23 Prepare a Reuse Assessment 26 days 11/15/12 12/18/12
24 Submit Reuse Assessment to USEPA 0 days 12/18/12 12/18/12
25 USEPA Review of Reuse Assessment 20 days 12/18/12 1/10/13
26 Prepare Revised Reuse Assessment 20 days 1/10/13 2/5/13
27 Submit Revised Reuse Assessment to USEPA 0 days 2/5/13 2/5/13
28 TASK IV - SUPPLEMENTAL RI REPORT (RIR) 196 days 11/15/12 7/17/1329 Prepare Draft Supplemental RIR 95 days 11/15/12 3/13/13
30 Submit Draft Supplemental RIR to USEPA 0 days 3/15/13 3/15/13
31 USEPA Review 25 days 3/15/13 4/16/13
32 Prepare Final Supplemental RIR 50 days 4/16/13 6/17/13
33 Submit Final Supplemental RIR to USEPA 0 days 6/17/13 6/17/13
34 USEPA Review and Approval of Final RIR 24 days 6/17/13 7/17/13
35 TASK VII - BASELINE RISK ASSESSMENT 596.38 days 5/27/11 6/19/1336 Submit CSM and Memo on Exposure Scenarios &
Assumptions to USEPA0 days 5/27/11 5/27/11
37 USEPA Review 40 days 5/27/11 7/19/11
38 Prepare Revised CSM and Memo on ExposureScenarios & Assumptions
15 days 7/19/11 8/5/11
39 Submit Revised CSM & Memo to USEPA 15.75 days 8/5/11 9/9/11
40 USEPA Review & Approval 25 days 9/12/11 10/12/11
41 Prepare Pathways Analysis Report (PAR) 85 days 11/30/12 3/15/13
42 Submit PAR to USEPA 0 days 3/15/13 3/15/13
43 USEPA Review 30 days 3/18/13 4/24/13
44 Prepare Revised PAR 30 days 4/24/13 5/30/13
45 Submit Revised PAR to USEPA 0 days 5/30/13 5/30/13
46 USEPA Approval of Revised PAR 15 days 5/30/13 6/19/13
47 Submit Revised Screening-Level Ecological RiskAssessment (SLERA)
0 days 5/27/11 5/27/11
48 USEPA Review and Approval of Revised SLERA 40 days 5/27/11 7/19/11
49 Prepare a Revised Baseline Ecological RiskAssessment (BERA) Report
85 days 12/20/12 4/4/13
50 Submit Revised BERA Report to USEPA 0 days 4/4/13 4/4/13
51 USAEPA Review and Approval 30 days 4/4/13 5/13/13
5/27
8/5
3/15
6/26
8/9
10/22
12/18
2/5
3/15
6/17
5/27
3/15
5/30
5/27
4/4
7 29 20 12 3 25 16 8 30 21 13 4 26 17 10 1 23 15 6 28 20 11 2 24 16 7 29 21 12 3 25 19 10 2 24 15 7 29 20 1May 15, '11 Jul 3, '11 Aug 21, '11 Oct 9, '11 Nov 27, '11 Jan 15, '12 Mar 4, '12 Apr 22, '12 Jun 10, '12 Jul 29, '12 Sep 16, '12 Nov 4, '12 Dec 23, '12 Feb 10, '13 Mar 31, '13 May 19, '13 Jul 7, '13 Aug 25, '
Task
Split
Progress
Milestone
Summary
Project Summary
External Tasks
External Milestone
Deadline
Figure 18. Project ScheduleShieldalloy Metallurgical Corporation
Newfield, NJ
Page 1
OU2 SUPPLEMENTAL RI/FS SCHED1
R2-0000350
TABLES
R2-0000351

TABLE 1
Potential Federal and State Chemical-Specific ARARS and TBCs Criteria
FEDERAL ARARS RCRA Subtitle C: Hazardous Waste and
Implementing Regulations Subtitle D: Solid Waste and Implementing
Regulations Safe Drinking Water Act
Including but not limited to Drinking Water Standards
Clean Water Act and its implementing regulations
Surface Water Quality Criteria Surface Water Quality Standards
NPDES Permit Program Section 404 Wetlands Program Executive Order 11988, Floodplain Management Executive Order 11990, Protection of Wetlands EPA’s 1985 Statement of Policy on
Floodplains/Wetlands Assessments for CERCLA Actions
TSCA and its implementing regulations
40CFR Part 761 40 CFR Part 6 Appendix A Clean Air Act Hazardous Materials Transportation Act Endangered Species Act National Historic Preservation Act
TBCs Guidance Documents on conducting RI/FS under CERCLA CERCLA Guidance Documents on Presumptive Remedy for Municipal Landfills CERCLA Guidance Documents on Conducting Risk Assessments CERCLA Guidance Documents on Reusing Cleaned Up Superfund Sites CERCLA Soil Screening Guidance USEPA Ecological Soil Screening Levels for Industrial Soil (May 2010) USEPA Freshwater Sediment Screening Benchmarks (Region III BTAG, August 2006) USEPA Contract Laboratory Program
R2-0000352

TABLE 1
Potential Federal and State Chemical-Specific ARARS and TBCs Criteria
NEW JERSEY ARARs New Jersey Solid Waste Act and
implementing regulations New Jersey Safe Drinking Water Act
and implementing regulations, including but not limited to the New Jersey Drinking Water Standards
NJAC 7:26E Technical Requirements
for Site Remediation NJAC 7:9C Ground Water Quality
Standards NJAC 7:9B Surface Water Quality
Standards NJAC 2:90 Soil Erosion and Sediment
Control Plan Certification New Jersey Flood Area Hazard Control
Act and its implementing regulations New Jersey Freshwater Wetlands
Protection Act and implementing regulations, NJAC 7:7A
NJAC 7:9D Well Construction and
Drilling Permits NJAC 7:18 Laboratory Certification
Regulations
TBCs NJDEP Field Sampling Procedures Manual Soil Remediation Standards (Non-Residential) NJDEP Guidance for Sediment Quality Evaluation
R2-0000353

AREAS SOIL SAMPLES SOIL SAMPLESABOVE CRITERIA (1)
Former Production AreaVOCs 34 0Semi-VOCs 28 0Pesticides/PCBs 23 0Metals 62 2Cr+6 28 3Vanadium 55 25
Former Lagoon AreasVOCs 4 0Semi-VOCs 2 0Pesticides/PCBs 2 0Metals 30 0Cr+6 78 18Vanadium 21 7
Eastern Storage AreasVOCs 13 0Semi-VOCs 9 0Pesticides/PCBs 29 1Metals 47 0Cr+6 42 1Vanadium 42 26
Southern AreaVOCs 5 0Semi-VOCs 5 0Pesticides/PCBs 3 0Metals 62 0Cr+6 62 0Vanadium 62 23
NOTES:(1) - Soil samples exceeding the EPA Screening Industrial Soil Level (2010) and/or the NJDEP Non-Residential Direct Contact Soil Remediation Standards (NRDCSRS).
NUMBER OF SOIL SAMPLES COLLECTED BY AREATABLE 2
R2-0000354

SURFACE WATER SAMPLESSURFACE WATER ABOVE EPA (1) and
AREAS SAMPLES NJDEP WATER CRITERIA (2)
Hudson BranchVOCs 5 1Semi-VOCs 2 1Pesticides/PCBs 2 0Metals 8 8
Burnt Mill PondVOCs 0 0Semi-VOCs 0 0Pesticides/PCBs 0 0Metals 2 2
Burnt Mill BranchVOCs 0 0Semi-VOCs 0 0Pesticides/PCBs 0 0Metals 2 0
NOTES:(1) - National Recommended Water Quality Criteria (2009)(2) - NJDEP Surface Water Quality Criteria (SWQC) for Freshwater FW2-classified waters (2009)
NUMBER OF SURFACE WATER SAMPLES COLLECTED BY AREATABLE 3
R2-0000355

SEDIMENT SAMPLESABOVE EPA SCREENING (1) and
AREAS SEDIMENT SAMPLES NJDEP SCREENING CRITERIA (2)
Hudson BranchVOCs 5 2Semi-VOCs 2 2Pesticides 7 4PCBs 7 3Metals 54 53
Burnt Mill PondVOCs 0 0Semi-VOCs 0 0Pesticides/PCBs 0 0Metals 9 8
Burnt Mill BranchVOCs 0 0Semi-VOCs 0 0Pesticides/PCBs 0 0Metals 8 7
NOTES:(1) - EPA Freshwater Sediment Screening Benchmarks (Region III BTAG, August 2006)(2) - NJDEP Ecological Screening Criteria (March 2009)
NUMBER OF SEDIMENT SAMPLES COLLECTED BY AREATABLE 4
R2-0000356

Table 5Proposed Soil Samples
Shieldalloy Metallurgical CorporationNewfield, New Jersey
Sample IDDepth Interval
(ft) Analytical Protocols Sample Collection ProtocolMinimum # of
SamplesMaximum # of Samples Comment
FORMER PRODUCTION AREA
SB-84 0 - 0.5 Vanadium, pH
SEE FLOW DIAGRAM A-1 Collect soil sample from the 0.5 ft interval below surface. If pavement is present in the area, collect sample within 0.5 ft below the pavement area. If lab results are above the USEPA or NJDEP guidance, then TRC and USEPA may determine if additional sampling is required.
1 2 Surface Soil Sample
SB-85 0 - 0.5 Vanadium, pH
SEE FLOW DIAGRAM A-1 Collect soil sample from the 0.5 ft interval below surface. If pavement is present in the area, collect sample within 0.5 ft below the pavement area. If lab results are above the USEPA or NJDEP guidance, then TRC and USEPA may determine if additional sampling is required.
1 2 Surface Soil Sample
SB-86 0 - 0.5 Vanadium, pH
SEE FLOW DIAGRAM A-1 Collect soil sample from the 0.5 ft interval below surface. If pavement is present in the area, collect sample within 0.5 ft below the pavement area. If lab results are above the USEPA or NJDEP guidance, then TRC and USEPA may determine if additional sampling is required.
1 2 Surface Soil Sample
SB-87 0 - 0.5 Vanadium, pH
SEE FLOW DIAGRAM A-1 Collect soil sample from the 0.5 ft interval below surface. If pavement is present in the area, collect sample within 0.5 ft below the pavement area. If lab results are above the USEPA or NJDEP guidance, then TRC and USEPA may determine if additional sampling is required.
1 2 Surface Soil Sample
SB-88 SEE FLOW DIAGRAM A-2
TCL VOC
SEE FLOW DIAGRAM A-2 Collect soil sample for analysis from the 0.5 ft interval with highest PID/FID reading or greatest impact (i.e., staining, sheens). If evidence of contamination is encountered, then collect a contingency sample 2 to 3 feet below the first sample. If no evidence of contamination, collect sample from the 0.5 ft interval above the water table. If the contingency results are above the USEPA or NJDEP guidance, then the field team will be directed to step out and advance a second boring to accomplish delineation.
1 2 Subsurface Soil Sample
SB-89 SEE FLOW DIAGRAM A-2
TCL VOC
SEE FLOW DIAGRAM A-2 Collect soil sample for analysis from the 0.5 ft interval with highest PID/FID reading or greatest impact (i.e., staining, sheens). If evidence of contamination is encountered, then collect a contingency sample 2 to 3 feet below the first sample. If no evidence of contamination, collect sample from the 0.5 ft interval above the water table. If the contingency results are above the USEPA or NJDEP guidance, then the field team will be directed to step out and advance a second boring to accomplish delineation.
1 2 Subsurface Soil Sample
1 of 6R2-0000357

Table 5Proposed Soil Samples
Shieldalloy Metallurgical CorporationNewfield, New Jersey
Sample IDDepth Interval
(ft) Analytical Protocols Sample Collection ProtocolMinimum # of
SamplesMaximum # of Samples Comment
SB-90 SEE FLOW DIAGRAM A-2
TCL VOC
SEE FLOW DIAGRAM A-2 Collect soil sample for analysis from the 0.5 ft interval with highest PID/FID reading or greatest impact (i.e., staining, sheens). If evidence of contamination is encountered, then collect a contingency sample 2 to 3 feet below the first sample. If no evidence of contamination, collect sample from the 0.5 ft interval above the water table. If the contingency results are above the USEPA or NJDEP guidance, then the field team will be directed to step out and advance a second boring to accomplish delineation.
1 2 Subsurface Soil Sample
SB-91 SEE FLOW DIAGRAM A-2
TCL VOC
SEE FLOW DIAGRAM A-2 Collect soil sample for analysis from the 0.5 ft interval with highest PID/FID reading or greatest impact (i.e., staining, sheens). If evidence of contamination is encountered, then collect a contingency sample 2 to 3 feet below the first sample. If no evidence of contamination, collect sample from the 0.5 ft interval above the water table. If the contingency results are above the USEPA or NJDEP guidance, then the field team will be directed to step out and advance a second boring to accomplish delineation.
1 2 Subsurface Soil Sample
SB-92 SEE FLOW DIAGRAM A-2
TCL VOC
SEE FLOW DIAGRAM A-2 Collect soil sample for analysis from the 0.5 ft interval with highest PID/FID reading or greatest impact (i.e., staining, sheens). If evidence of contamination is encountered, then collect a contingency sample 2 to 3 feet below the first sample. If no evidence of contamination, collect sample from the 0.5 ft interval above the water table. If the contingency results are above the USEPA or NJDEP guidance, then the field team will be directed to step out and advance a second boring to accomplish delineation.
1 2 Subsurface Soil Sample
FORMER LAGOONS AREA
SB-93A 0 - 0.5TCL VOC, total Cr, Cr+6, Vanadium,
pH, ORP
SEE FLOW DIAGRAM A-1 Collect soil sample from the 0.5 ft interval below surface. Soil sample for VOC analysis will be collected from 0.5 to 1 foot below ground. Surface soil samples will be collected to confirm previous post lagoon closure samples results.
1 2 Surface Soil
SB-94A 0 - 0.5TCL VOC, total Cr, Cr+6, Vanadium,
pH, ORP
SEE FLOW DIAGRAM A-1 Collect soil sample from the 0.5 ft interval below surface. Soil sample for VOC analysis will be collected from 0.5 to 1 foot below ground. Surface soil samples will be collected to confirm previous post lagoon closure samples results.
1 2 Surface Soil
2 of 6R2-0000358
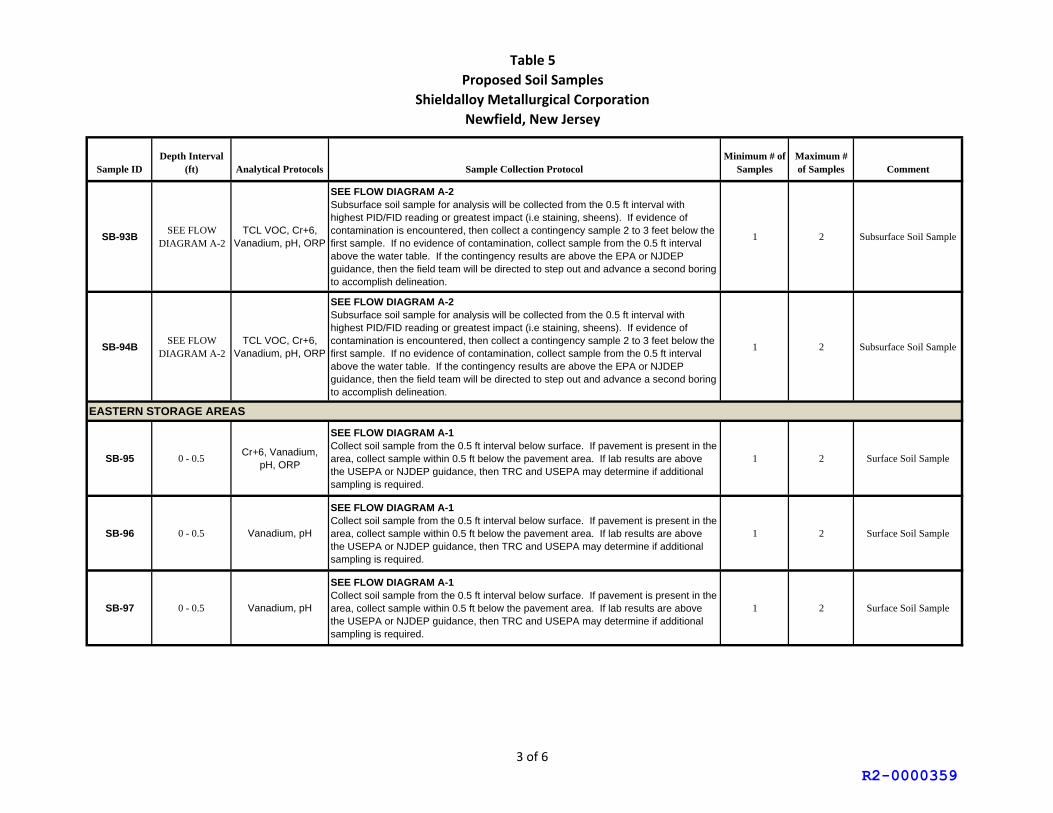
Table 5Proposed Soil Samples
Shieldalloy Metallurgical CorporationNewfield, New Jersey
Sample IDDepth Interval
(ft) Analytical Protocols Sample Collection ProtocolMinimum # of
SamplesMaximum # of Samples Comment
SB-93B SEE FLOW DIAGRAM A-2
TCL VOC, Cr+6, Vanadium, pH, ORP
SEE FLOW DIAGRAM A-2 Subsurface soil sample for analysis will be collected from the 0.5 ft interval with highest PID/FID reading or greatest impact (i.e staining, sheens). If evidence of contamination is encountered, then collect a contingency sample 2 to 3 feet below the first sample. If no evidence of contamination, collect sample from the 0.5 ft interval above the water table. If the contingency results are above the EPA or NJDEP guidance, then the field team will be directed to step out and advance a second boring to accomplish delineation.
1 2 Subsurface Soil Sample
SB-94B SEE FLOW DIAGRAM A-2
TCL VOC, Cr+6, Vanadium, pH, ORP
SEE FLOW DIAGRAM A-2 Subsurface soil sample for analysis will be collected from the 0.5 ft interval with highest PID/FID reading or greatest impact (i.e staining, sheens). If evidence of contamination is encountered, then collect a contingency sample 2 to 3 feet below the first sample. If no evidence of contamination, collect sample from the 0.5 ft interval above the water table. If the contingency results are above the EPA or NJDEP guidance, then the field team will be directed to step out and advance a second boring to accomplish delineation.
1 2 Subsurface Soil Sample
EASTERN STORAGE AREAS
SB-95 0 - 0.5Cr+6, Vanadium,
pH, ORP
SEE FLOW DIAGRAM A-1 Collect soil sample from the 0.5 ft interval below surface. If pavement is present in the area, collect sample within 0.5 ft below the pavement area. If lab results are above the USEPA or NJDEP guidance, then TRC and USEPA may determine if additional sampling is required.
1 2 Surface Soil Sample
SB-96 0 - 0.5 Vanadium, pH
SEE FLOW DIAGRAM A-1 Collect soil sample from the 0.5 ft interval below surface. If pavement is present in the area, collect sample within 0.5 ft below the pavement area. If lab results are above the USEPA or NJDEP guidance, then TRC and USEPA may determine if additional sampling is required.
1 2 Surface Soil Sample
SB-97 0 - 0.5 Vanadium, pH
SEE FLOW DIAGRAM A-1 Collect soil sample from the 0.5 ft interval below surface. If pavement is present in the area, collect sample within 0.5 ft below the pavement area. If lab results are above the USEPA or NJDEP guidance, then TRC and USEPA may determine if additional sampling is required.
1 2 Surface Soil Sample
3 of 6R2-0000359

Table 5Proposed Soil Samples
Shieldalloy Metallurgical CorporationNewfield, New Jersey
Sample IDDepth Interval
(ft) Analytical Protocols Sample Collection ProtocolMinimum # of
SamplesMaximum # of Samples Comment
SOUTHERN AREA
SB-98 0 - 0.5TCL VOC, TAL
Metals, Cr+6, pH, ORP
SEE FLOW DIAGRAM A-1 Collect soil sample from the 0.5 ft interval below surface. Soil samples for VOC analysis will be collected from 0.5 to 1 foot below surface. If lab results are above the USEPA or NJDEP guidance, then TRC and USEPA may determine if additional sampling is required.
1 2 Surface Soil Sample
SB-99 0 - 0.5TCL VOC, TAL
Metals, Cr+6, pH, ORP
SEE FLOW DIAGRAM A-1 Collect soil sample from the 0.5 ft interval below surface. Soil samples for VOC analysis will be collected from 0.5 to 1 foot below surface. If lab results are above the USEPA or NJDEP guidance, then TRC and USEPA may determine if additional sampling is required.
1 2 Surface Soil Sample
SB-100 0 - 0.5TCL VOC, TAL
Metals, Cr+6, pH, ORP
SEE FLOW DIAGRAM A-1 Collect soil sample from the 0.5 ft interval below surface. Soil samples for VOC analysis will be collected from 0.5 to 1 foot below surface. If lab results are above the USEPA or NJDEP guidance, then TRC and USEPA may determine if additional sampling is required.
1 2 Surface Soil Sample
SB-101 0 - 0.5TCL VOC, TAL
Metals, Cr+6, pH, ORP
SEE FLOW DIAGRAM A-1 Collect soil sample from the 0.5 ft interval below surface. Soil samples for VOC analysis will be collected from 0.5 to 1 foot below surface. If lab results are above the USEPA or NJDEP guidance, then TRC and USEPA may determine if additional sampling is required.
1 2 Surface Soil Sample
SB-102 0 - 0.5TCL VOC, TAL
Metals, Cr+6, pH, ORP
SEE FLOW DIAGRAM A-1 Collect soil sample from the 0.5 ft interval below surface. Soil samples for VOC analysis will be collected from 0.5 to 1 foot below surface. If lab results are above the USEPA or NJDEP guidance, then TRC and USEPA may determine if additional sampling is required.
1 2 Surface Soil Sample
4 of 6R2-0000360
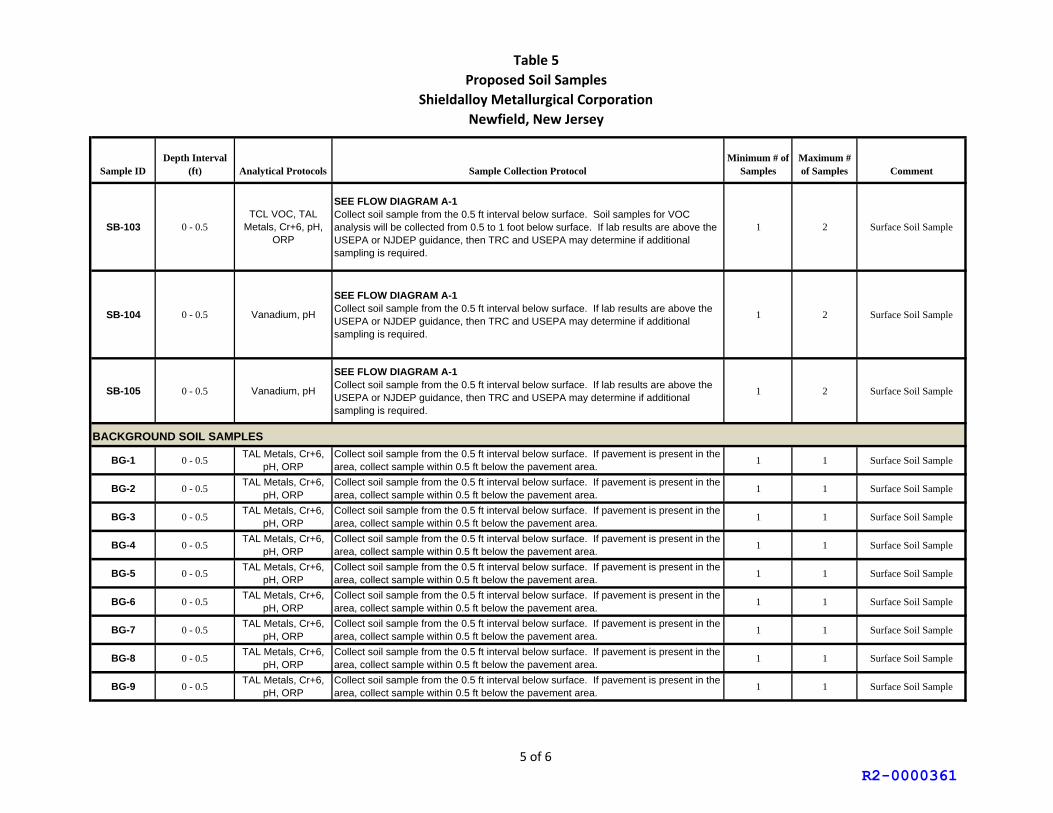
Table 5Proposed Soil Samples
Shieldalloy Metallurgical CorporationNewfield, New Jersey
Sample IDDepth Interval
(ft) Analytical Protocols Sample Collection ProtocolMinimum # of
SamplesMaximum # of Samples Comment
SB-103 0 - 0.5TCL VOC, TAL
Metals, Cr+6, pH, ORP
SEE FLOW DIAGRAM A-1 Collect soil sample from the 0.5 ft interval below surface. Soil samples for VOC analysis will be collected from 0.5 to 1 foot below surface. If lab results are above the USEPA or NJDEP guidance, then TRC and USEPA may determine if additional sampling is required.
1 2 Surface Soil Sample
SB-104 0 - 0.5 Vanadium, pH
SEE FLOW DIAGRAM A-1 Collect soil sample from the 0.5 ft interval below surface. If lab results are above the USEPA or NJDEP guidance, then TRC and USEPA may determine if additional sampling is required.
1 2 Surface Soil Sample
SB-105 0 - 0.5 Vanadium, pH
SEE FLOW DIAGRAM A-1 Collect soil sample from the 0.5 ft interval below surface. If lab results are above the USEPA or NJDEP guidance, then TRC and USEPA may determine if additional sampling is required.
1 2 Surface Soil Sample
BACKGROUND SOIL SAMPLES
BG-1 0 - 0.5TAL Metals, Cr+6,
pH, ORPCollect soil sample from the 0.5 ft interval below surface. If pavement is present in the area, collect sample within 0.5 ft below the pavement area.
1 1 Surface Soil Sample
BG-2 0 - 0.5TAL Metals, Cr+6,
pH, ORPCollect soil sample from the 0.5 ft interval below surface. If pavement is present in the area, collect sample within 0.5 ft below the pavement area.
1 1 Surface Soil Sample
BG-3 0 - 0.5TAL Metals, Cr+6,
pH, ORPCollect soil sample from the 0.5 ft interval below surface. If pavement is present in the area, collect sample within 0.5 ft below the pavement area.
1 1 Surface Soil Sample
BG-4 0 - 0.5TAL Metals, Cr+6,
pH, ORPCollect soil sample from the 0.5 ft interval below surface. If pavement is present in the area, collect sample within 0.5 ft below the pavement area.
1 1 Surface Soil Sample
BG-5 0 - 0.5TAL Metals, Cr+6,
pH, ORPCollect soil sample from the 0.5 ft interval below surface. If pavement is present in the area, collect sample within 0.5 ft below the pavement area.
1 1 Surface Soil Sample
BG-6 0 - 0.5TAL Metals, Cr+6,
pH, ORPCollect soil sample from the 0.5 ft interval below surface. If pavement is present in the area, collect sample within 0.5 ft below the pavement area.
1 1 Surface Soil Sample
BG-7 0 - 0.5TAL Metals, Cr+6,
pH, ORPCollect soil sample from the 0.5 ft interval below surface. If pavement is present in the area, collect sample within 0.5 ft below the pavement area.
1 1 Surface Soil Sample
BG-8 0 - 0.5TAL Metals, Cr+6,
pH, ORPCollect soil sample from the 0.5 ft interval below surface. If pavement is present in the area, collect sample within 0.5 ft below the pavement area.
1 1 Surface Soil Sample
BG-9 0 - 0.5TAL Metals, Cr+6,
pH, ORPCollect soil sample from the 0.5 ft interval below surface. If pavement is present in the area, collect sample within 0.5 ft below the pavement area.
1 1 Surface Soil Sample
5 of 6R2-0000361

Table 5Proposed Soil Samples
Shieldalloy Metallurgical CorporationNewfield, New Jersey
Sample IDDepth Interval
(ft) Analytical Protocols Sample Collection ProtocolMinimum # of
SamplesMaximum # of Samples Comment
BG-10 0 - 0.5TAL Metals, Cr+6,
pH, ORPCollect soil sample from the 0.5 ft interval below surface. If pavement is present in the area, collect sample within 0.5 ft below the pavement area.
1 1 Surface Soil Sample
BG-11 0 - 0.5TAL Metals, Cr+6,
pH, ORPCollect soil sample from the 0.5 ft interval below surface. If pavement is present in the area, collect sample within 0.5 ft below the pavement area.
1 1 Surface Soil Sample
BG-12 0 - 0.5TAL Metals, Cr+6,
pH, ORPCollect soil sample from the 0.5 ft interval below surface. If pavement is present in the area, collect sample within 0.5 ft below the pavement area.
1 1 Surface Soil Sample
BG-13 0 - 0.5TAL Metals, Cr+6,
pH, ORPCollect soil sample from the 0.5 ft interval below surface. If pavement is present in the area, collect sample within 0.5 ft below the pavement area.
1 1 Surface Soil Sample
6 of 6R2-0000362
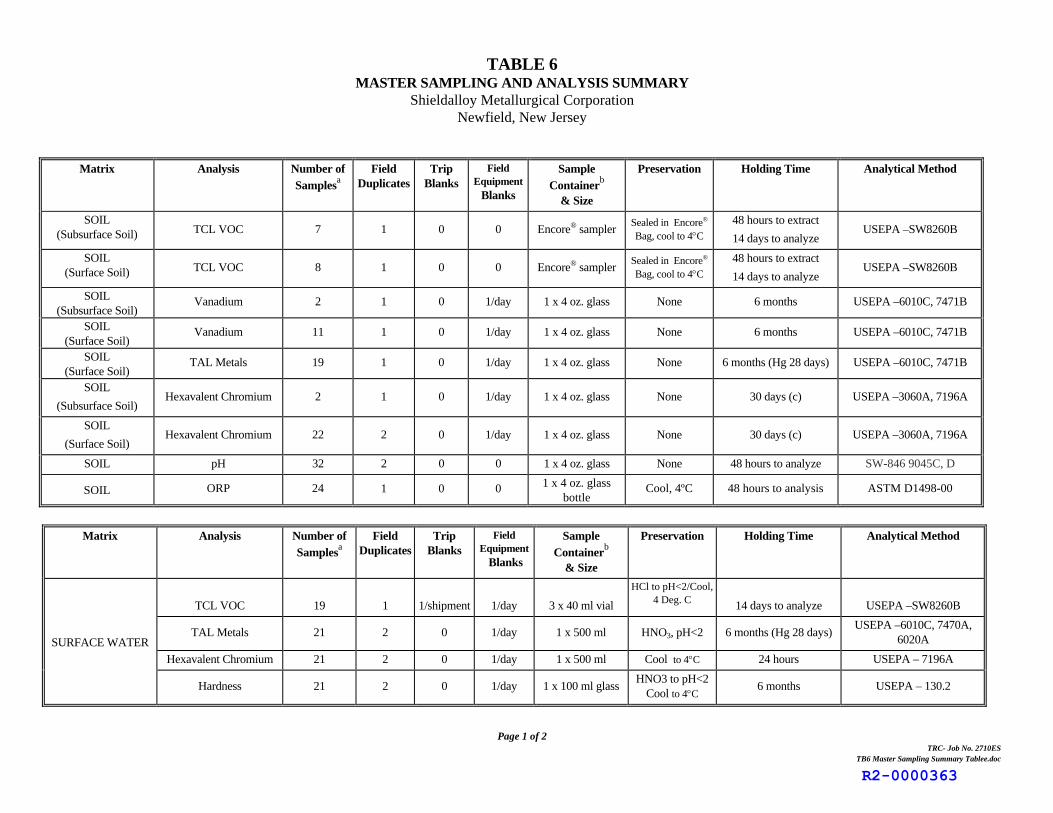
TABLE 6
MASTER SAMPLING AND ANALYSIS SUMMARY Shieldalloy Metallurgical Corporation
Newfield, New Jersey
Page 1 of 2 TRC- Job No. 2710ES
TB6 Master Sampling Summary Tablee.doc
Matrix Analysis Number of
Samplesa
Field Duplicates
Trip Blanks
Field Equipment
Blanks
Sample
Containerb
& Size
Preservation Holding Time Analytical Method
SURFACE WATER
TCL VOC
19
1
1/shipment
1/day
3 x 40 ml vial
HCl to pH<2/Cool, 4 Deg. C
14 days to analyze
USEPA –SW8260B
TAL Metals 21 2 0 1/day 1 x 500 ml HNO3, pH<2 6 months (Hg 28 days) USEPA –6010C, 7470A,
6020A
Hexavalent Chromium 21 2 0 1/day 1 x 500 ml Cool to 4C 24 hours USEPA – 7196A
Hardness 21 2 0 1/day 1 x 100 ml glass HNO3 to pH<2
Cool to 4C 6 months USEPA – 130.2
Matrix Analysis Number of
Samplesa
Field Duplicates
Trip Blanks
Field Equipment
Blanks
Sample
Containerb
& Size
Preservation Holding Time Analytical Method
SOIL (Subsurface Soil) TCL VOC 7 1 0 0 Encore® sampler
Sealed in Encore®
Bag, cool to 4C
48 hours to extract
14 days to analyze USEPA –SW8260B
SOIL (Surface Soil) TCL VOC 8 1 0 0 Encore® sampler
Sealed in Encore®
Bag, cool to 4C
48 hours to extract
14 days to analyze USEPA –SW8260B
SOIL (Subsurface Soil)
Vanadium 2 1 0 1/day 1 x 4 oz. glass None 6 months USEPA –6010C, 7471B
SOIL (Surface Soil)
Vanadium 11 1 0 1/day 1 x 4 oz. glass None 6 months USEPA –6010C, 7471B
SOIL (Surface Soil)
TAL Metals 19 1 0 1/day 1 x 4 oz. glass None 6 months (Hg 28 days) USEPA –6010C, 7471B
SOIL
(Subsurface Soil) Hexavalent Chromium 2 1 0 1/day 1 x 4 oz. glass None 30 days (c) USEPA –3060A, 7196A
SOIL
(Surface Soil) Hexavalent Chromium 22 2 0 1/day 1 x 4 oz. glass None 30 days (c) USEPA –3060A, 7196A
SOIL pH 32 2 0 0 1 x 4 oz. glass None 48 hours to analyze SW-846 9045C, D
SOIL ORP 24 1 0 0 1 x 4 oz. glass bottle
Cool, 4ºC 48 hours to analysis ASTM D1498-00
R2-0000363

TABLE 6
MASTER SAMPLING AND ANALYSIS SUMMARY Shieldalloy Metallurgical Corporation
Newfield, New Jersey
Page 2 of 2 TRC Raviv Job No. 2710ES
TB6 Master Samplling and Analysis Summary Table.doc
a Estimated minimum number. Additional samples may be collected for delineation. Actual number will depend on field conditions and analytical results. b Some parameters may be analyzed from the same container used to sample soil, sediment or surface water. c 30 days to digestion, 7 days to analysis.
Matrix Analysis Number of
Samplesa
Field Duplicates
Trip Blanks
Field Equipment
Blanks
Sample
Containerb
& Size
Preservation Holding Time Analytical Method
SEDIMENT/SOIL
TCL Semi-VOC 35 2 0 1/day 1 x 4 oz. glass Cool to 4C 14 days to extract
40 days to analyze
USEPA –SW8270C
USEPA - SW8270D
TCL PCBs
35
2
0
1/day
1 x 4 oz. glass
Cool to 4C
14 days to extract
40 days to analyze USEPA –SW8082A
TCL Pesticides
35
2
0
1/day
1 x 4 oz. glass
Cool to 4C
14 days to extract
40 days to analyze USEPA –SW8081B
TAL Metals 41 3 0 1/day 1 x 4 oz. glass None 6 months (Hg 28 days) USEPA –6010C, 7471B
Hexavalent Chromium 14 1 0 1/day 1 x 4 oz. glass None 30 days (c) USEPA –3060A, 7196A
Total Organic Carbon 27 2 0 0 1 x 4 oz. glass Cool to 4C 14 days Lloyd Kahn
Grain Size Distribution 27 2 0 0 1 x 8 oz. glass None None ASTM D422-63
pH 41 3 0 0 1 x 4 oz. glass None 48 hours to analyze SW-846 9045C, D
ORP 14 1 0 0 1 x 4 oz. glass bottle
Cool, 4ºC 48 hours to analysis ASTM D1498-00
R2-0000364

TABLE 7PROPOSED SURFACE WATER AND SEDIMENT SAMPLES
SHIELDALLOY METALLURGICAL CORPORATION NEWFIELD, NEW JERSEY
STATION LOCATION Sample IDs Media Analytical Protocols Sample Depth (Feet)
(SEE NOTE 1)
Sample Rationale
Hudson Branch 1 Quiescent, Low Energy Area SW-01 Surface Water TCL VOCs, TAL Metals, Cr+6, Hardness, FP 0.5 BAWI To assess stream quality within the Hudson Branch2 Transect, Mid-Channel Sediment SD-01B Sediment TCL Semi-VOCs and pesticides/PCBs, TAL Metals, TOC, PGS, pH 1.5 - 2 BWSI in the unnamed pond area at the location of previous 3 Transect, North Bank Soil SD-01N Soil TCL Semi-VOCs and pesticides/PCBs, TAL Metals, Cr+6, pH, ORP 0 - 0.5 BGS surface water and sediment sample SW/SD-014 Transect, South Bank Soil SD-01S Soil TCL Semi-VOCs and pesticides/PCBs, TAL Metals, Cr+6, pH, ORP 0 - 0.5 BGS5 Quiescent, Low Energy Area SW-10 Surface Water TCL VOCs, TAL Metals, Cr+6, Hardness, FP 0.5 BAWI To assess stream quality within the Hudson Branch6 Transect, Mid-Channel Sediment SD-10B Sediment TCL Semi-VOCs and pesticides/PCBs, TAL Metals, TOC, PGS, pH 1.5 - 2 BWSI in the unnamed pond area at the location of previous 7 Transect, North Bank Soil SD-10N Soil TCL Semi-VOCs and pesticides/PCBs, TAL Metals, Cr+6, pH, ORP 0 - 0.5 BGS sediment sample SD-108 Transect, South Bank Soil SD-10S Soil TCL Semi-VOCs and pesticides/PCBs, TAL Metals, Cr+6, pH, ORP 0 - 0.5 BGS9 Quiescent, Low Energy Area SW-13 Surface Water TCL VOCs, TAL Metals, Cr+6, Hardness, FP 0.5 BAWI To assess stream quality within the Hudson Branch10 Transect, Mid-Channel Sediment SD-13B Sediment TCL Semi-VOCs and pesticides/PCBs, TAL Metals, TOC, PGS, pH 1.5 - 2 BWSI downstream of unnamed pond at the location of previous 11 Transect, North Bank Soil SD-13N Soil TCL Semi-VOCs and pesticides/PCBs, TAL Metals, Cr+6, pH, ORP 0 - 0.5 BGS sediment sample SD-1312 Transect, South Bank Soil SD-13S Soil TCL Semi-VOCs and pesticides/PCBs, TAL Metals, Cr+6, pH, ORP 0 - 0.5 BGS13 Quiescent, Low Energy Area SW-15 Surface Water TCL VOCs, TAL Metals, Cr+6, Hardness, FP 0.5 BAWI To assess stream quality within the Hudson Branch14 Transect, Mid-Channel Sediment SD-15B Sediment TCL Semi-VOCs and pesticides/PCBs, TAL Metals, TOC, PGS, pH 1.5 - 2 BWSI near the soutwest corner of the property at the location 15 Transect, North Bank Soil SD-15N Soil TCL Semi-VOCs and pesticides/PCBs, TAL Metals, Cr+6, pH, ORP 0 - 0.5 BGS of previous sediment sample SD-1516 Transect, South Bank Soil SD-15S Soil TCL Semi-VOCs and pesticides/PCBs, TAL Metals, Cr+6, pH, ORP 0 - 0.5 BGS17 Quiescent, Low Energy Area SW-18 Surface Water TCL VOCs, TAL Metals, Cr+6, Hardness, FP 0.5 BAWI To assess stream quality within the Hudson Branch18 Transect, Mid-Channel Sediment SD-18B Sediment TCL Semi-VOCs and pesticides/PCBs, TAL Metals, TOC, PGS, pH 1.5 - 2 BWSI downstream of car wash area at the location of previous 19 Transect, North Bank Soil SD-18N Soil TCL Semi-VOCs and pesticides/PCBs, TAL Metals, Cr+6, pH, ORP 0 - 0.5 BGS sediment sample SD-1820 Transect, South Bank Soil SD-18S Soil TCL Semi-VOCs and pesticides/PCBs, TAL Metals, Cr+6, pH, ORP 0 - 0.5 BGS21 Quiescent, Low Energy Area SW-04 Surface Water TCL VOCs, TAL Metals, Cr+6, Hardness, FP 0.5 BAWI To assess stream quality within the Hudson Branch22 Transect, Mid-Channel Sediment SD-04B Sediment TCL Semi-VOCs and pesticides/PCBs, TAL Metals, TOC, PGS, pH 1.5 - 2 BWSI at the Former Parcel at the location of previous 23 Transect, North Bank Soil SD-04N Soil TCL Semi-VOCs and pesticides/PCBs, TAL Metals, Cr+6, pH, ORP 0 - 0.5 BGS surface water and sediment sample SW/SD-0424 Transect, South Bank Soil SD-04S Soil TCL Semi-VOCs and pesticides/PCBs, TAL Metals, Cr+6, pH, ORP 0 - 0.5 BGS25 Quiescent, Low Energy Area SW-23 Surface Water TCL VOCs, TAL Metals, Cr+6, Hardness, FP 0.5 BAWI To assess stream quality within the Hudson Branch26 Transect, Mid-Channel Sediment SD-23B Sediment TCL Semi-VOCs and pesticides/PCBs, TAL Metals, TOC, PGS, pH 1.5 - 2 BWSI downstream of the Former Parcel at the location of 27 Transect, North Bank Soil SD-23N Soil TCL Semi-VOCs and pesticides/PCBs, TAL Metals, Cr+6, pH, ORP 0 - 0.5 BGS previous sediment sample SD-2328 Transect, South Bank Soil SD-23S Soil TCL Semi-VOCs and pesticides/PCBs, TAL Metals, Cr+6, pH, ORP 0 - 0.5 BGS29 Pond, Depositional Area SD-IMP1A Sediment TCL Semi-VOCs and pesticides/PCBs, TAL Metals, TOC, PGS, pH 0 - 0.5 BWSI To assess sediment quality within the on-site impoundment30 Pond, Depositional Area SD-IMP2A Sediment TCL Semi-VOCs and pesticides/PCBs, TAL Metals, TOC, PGS, pH 0 - 0.5 BWSI31 Pond, Depositional Area SD-IMP3A Sediment TCL Semi-VOCs and pesticides/PCBs, TAL Metals, TOC, PGS, pH 0 - 0.5 BWSI32 Pond, Depositional Area SD-IMP4A Sediment TCL Semi-VOCs and pesticides/PCBs, TAL Metals, TOC, PGS, pH 0 - 0.5 BWSI33 Pond, Depositional Area SD-IMP5A Sediment TCL Semi-VOCs and pesticides/PCBs, TAL Metals, TOC, PGS, pH 0 - 0.5 BWSI34 Pond, Depositional Area SD-IMP6A Sediment TCL Semi-VOCs and pesticides/PCBs, TAL Metals, TOC, PGS, pH 0 - 0.5 BWSI
Burnt Mill Pond35 Quiescent, Low Energy Area SW-25 Surface Water TAL Metals, Cr+6, Hardness, FP, VOCs* 0.5 BAWI To assess stream quality within the Burnt Mill Pond, at the 36 Pond, Depositional Area SD-25B Sediment TAL Metals, TOC, PGS, pH 1.5 - 2 BWSI location of previous surface water and sediment sample SW/SD-2537 Quiescent, Low Energy Area SW-26 Surface Water TAL Metals, Cr+6, Hardness, FP, VOCs* 0.5 BAWI To assess stream quality within the Burnt Mill Pond, at the 38 Pond, Depositional Area SD-26B Sediment TAL Metals, TOC, PGS, pH 1.5 - 2 BWSI location of previous sediment sample SD-2639 Quiescent, Low Energy Area SW-27 Surface Water TAL Metals, Cr+6, Hardness, FP, VOCs* 0.5 BAWI To assess stream quality within the Burnt Mill Pond, at the 40 Pond, Depositional Area SD-27B Sediment TAL Metals, TOC, PGS, pH 1.5 - 2 BWSI location of previous sediment sample SD-2741 Quiescent, Low Energy Area SW-29 Surface Water TAL Metals, Cr+6, Hardness, FP, VOCs* 0.5 BAWI To assess stream quality within the Burnt Mill Pond, at the 42 Pond, Depositional Area SD-29B Sediment TAL Metals, TOC, PGS, pH 1.5 - 2 BWSI location of previous sediment sample SD-29
Burnt Mill Branch43 Quiescent, Low Energy Area SW-28 Surface Water TAL Metals, Cr+6, Hardness, FP 0.5 BAWI To assess stream quality within the Burnt Mill Branch, downstream44 Transect, Mid-Channel Sediment SD-28A Sediment TAL Metals, TOC, PGS, pH 0 - 0.5 BWSI of Burnt Mill Pond at the location of previous sample SD-2845 Quiescent, Low Energy Area SW-38 Surface Water TAL Metals, Cr+6, Hardness, FP 0.5 BAWI To assess stream quality within the Burnt Mill Branch, downstream46 Transect, Mid-Channel Sediment SD-38A Sediment TAL Metals, TOC, PGS, pH 0 - 0.5 BWSI of Burnt Mill Pond and previous sample SD-28
Page 1 of 2TRC Job No. 2710ES
C:\Documents and Settings\JGomez\Desktop\SMC\Workplan\Tables\Table 7-Proposed Surface Water-Sediment Samples.xlsx
R2-0000365

TABLE 7PROPOSED SURFACE WATER AND SEDIMENT SAMPLES
SHIELDALLOY METALLURGICAL CORPORATION NEWFIELD, NEW JERSEY
STATION LOCATION Sample IDs Media Analytical Protocols Sample Depth (Feet)
(SEE NOTE 1)
Sample Rationale
Burnt Mill Branch (Background Locations)47 Quiescent, Low Energy Area SW-30 Surface Water TCL VOCs, TAL Metals, Cr+6, Hardness, FP 0.5 BAWI To assess background conditions within the Burnt Mill Branch, 48 Transect, Mid-Channel Sediment SD-30A Sediment TCL Semi-VOCs and pesticides/PCBs, TAL Metals, TOC, PGS, pH 0 - 0.5 BWSI at previous sediment sample SD-3049 Quiescent, Low Energy Area SW-31 Surface Water TCL VOCs, TAL Metals, Cr+6, Hardness, FP 0.5 BAWI To assess background conditions within the Burnt Mill Branch, 50 Transect, Mid-Channel Sediment SD-31A Sediment TCL Semi-VOCs and pesticides/PCBs, TAL Metals, TOC, PGS, pH 0 - 0.5 BWSI at previous sediment sample SD-3151 Quiescent, Low Energy Area SW-32 Surface Water TCL VOCs, TAL Metals, Cr+6, Hardness, FP 0.5 BAWI To assess background conditions within the Burnt Mill Branch, 52 Transect, Mid-Channel Sediment SD-32A Sediment TCL Semi-VOCs and pesticides/PCBs, TAL Metals, TOC, PGS, pH 0 - 0.5 BWSI upstream of sediment sample SD-3153 Quiescent, Low Energy Area SW-33 Surface Water TCL VOCs, TAL Metals, Cr+6, Hardness, FP 0.5 BAWI To assess background conditions within the Burnt Mill Branch, 54 Transect, Mid-Channel Sediment SD-33A Sediment TCL Semi-VOCs and pesticides/PCBs, TAL Metals, TOC, PGS, pH 0 - 0.5 BWSI between Columbia Ave. and West Blvd.55 Quiescent, Low Energy Area SW-34 Surface Water TCL VOCs, TAL Metals, Cr+6, Hardness, FP 0.5 BAWI To assess background conditions within the Burnt Mill Branch, 56 Transect, Mid-Channel Sediment SD-34A Sediment TCL Semi-VOCs and pesticides/PCBs, TAL Metals, TOC, PGS, pH 0 - 0.5 BWSI at intersection with West Blvd.57 Quiescent, Low Energy Area SW-35 Surface Water TCL VOCs, TAL Metals, Cr+6, Hardness, FP 0.5 BAWI To assess background conditions within the Burnt Mill Branch, 58 Transect, Mid-Channel Sediment SD-35A Sediment TCL Semi-VOCs and pesticides/PCBs, TAL Metals, TOC, PGS, pH 0 - 0.5 BWSI at previous sediment sample SD-3559 Quiescent, Low Energy Area SW-36 Surface Water TCL VOCs, TAL Metals, Cr+6, Hardness, FP 0.5 BAWI To assess background conditions within the Burnt Mill Branch, 60 Transect, Mid-Channel Sediment SD-36A Sediment TCL Semi-VOCs and pesticides/PCBs, TAL Metals, TOC, PGS, pH 0 - 0.5 BWSI at intersection with Madison Ave.61 Quiescent, Low Energy Area SW-37 Surface Water TCL VOCs, TAL Metals, Cr+6, Hardness, FP 0.5 BAWI To assess background conditions within the Burnt Mill Branch, 62 Transect, Mid-Channel Sediment SD-37A Sediment TCL Semi-VOCs and pesticides/PCBs, TAL Metals, TOC, PGS, pH 0 - 0.5 BWSI Upstream location
Notes: 1) For Surface Water, sample collection will be 0.5 feet below air-water interface (BAWI). 2) For Sediment, sample collection depth intervals will be 0 - 0.5 feet or 1.5 - 2.0 feet below water-sediment interface (BWSI).3) For Soil, sample collection depth interval will be 0 - 0.5 feet below ground surface (BGS)4) Photographs and physical measurements will be collected from each sample location including stream channel width and depth, and stream flow rate5) QA Samples will include one duplicate per 20 samples and One field blank (from sampling equipment) per day of sampling TCL+30 = TCL VO+10 (via USEPA Method 8260B) and TCL Semi-VOCs+20 (via USEPA Method 8270D); Pest/PCBs = TCL Pesticides and TCL PCBs (via USEPA Method 8081Aand 8082A, respectively); TAL = TAL Metals (via USEPA Method 6010B, 6020A, 7471A) - Total (unfiltered) and dissolved (filtered); Hexavalent chromium = (via USEPA Method 7196A); FP: Field Parameters include Dissolved Oxygen [DO], pH, eH (REDOX potential), specific conductance, temperature, turbidity and salinity . PGS = Particle Grain Size Distribution (via ASTM Method D422-63)* Contingency VOC surface water samples will be collected from the Mill Burnt Pond. VOC analysis will be conducted if VOCs are detected in the Hudson Branch
Page 2 of 2TRC Job No. 2710ES
C:\Documents and Settings\JGomez\Desktop\SMC\Workplan\Tables\Table 7-Proposed Surface Water-Sediment Samples.xlsx
R2-0000366

APPENDIX A
SOIL SAMPLING PROTOCOLS – FLOW DIAGRAMS
R2-0000367

1
4
Laboratory ResultsExpeditedTurnaround
Flow Diagram A-1Surface Soil Sampling ProtocolShieldalloy Metallurgical Corporation
Newfield, New Jersey
Use a bucket hand auger, macro liner or scoop to retrieve soil
2
3Soil should be homogenized in a Stainless Steel Bowl
5Note on sample chain‐of‐custody
Expedite analysis of surface soil sample *
Collect soil sample from the 0.5 feet depth interval below surface, concrete slab or asphalt pavement
Characterize soil (Burmeister)
Submit sample to laboratory
If results for surface soil samples Do Not Exceed the EPA screening levels or NJDEP NRDCSRS, the
If results for surface soil sample Exceed the EPA screening levels or NJDEP NRDCSRS, TRC and6
* Surface soil samples from Former Basin B9 and B10 and the Former Thermal Pond Area will be analyzed on a normal turnaround time.
perimeter has been delineated and no further sampling is necessary
screening levels or NJDEP NRDCSRS, TRC and USEPA may determine if additional sampling is required.
6
R2-0000368

Sample Collection FromDepth Intervals: Continuous soil samples to the water table
1
2
If NO PID/FID readings above background If PID/FID readings above background
4
Retrieve soil core from macro liner or split spoon
Disturb (Score) soil core longitudinally and screen disturbed soil in 0.5‐foot increments with PID or FID
Collect sample from the 0.5‐foot interval displaying the highest PID reading or greatest impact (i.e. staining, sheens)
3Collect soil sample from the 0.5‐foot interval above the water table
Flow Diagram A-2Subsurface Soil Sampling Protocol
Unsaturated Zone InvestigationShieldalloy Metallurgical Corporation
Newfield, New Jersey
Collect contingency sample at a deeper interval, as long as the sample with the highest PID/FID reading or greatest impact was not collected within 2 feet of the water table.
A) Record PID/FID measurment A) Record PID/FID measurement
Laboratory ResultsExpedited Turnaround
If result for contingency sample exceed the EPA screening levels or NJDEP NRDCSRS, Field team will be directed to step out to collect samples to accomplish delineation
8
5
Note on chain of custody ‐ Expedite analysis of sample with the highest PID/FID reading or greatest impact. Contingency samples will be placed on hold
6
If results exceed the EPA screening levels or NJDEP NRDCSRS, lab will be directed to analyze contingency sample
If results Do Not exceed the EPA screening levels or NJDEP NRDCSRS, lab will be directed to discard contingency sample
B) Characterize soil (Burmeister)
7
B) Characterize soil (Burmeister)
Submit sample to laboratory Submit samples to laboratory
R2-0000369

Sediment/Soil Sample Collection FromPre-Determinated Depth Intervals: 0 - 0.5 ft or 1.5 - 2 ft
1
2
3
Laboratory ResultsExpedited Turnaround
Submit samples to laboratory
Note on chain of custody ‐ Normal TAT
4
Record observations on the field notebook
Flow Diagram A-3Sediment/Soil Sampling Protocol
Shieldalloy Metallurgical CorporationNewfield, New Jersey
Collect sediment/soil samples from pre‐determined depth intervals (i.e., 0 ‐ 0.5 ft or 1.5 ‐ 2 ft) for laboratory analysis
Retrieve samples with a hand auger, scoop, core sampler or stainless steel spoons
If results exceed the EPA screening levels or NJDEP screening criteria, Field team will be directed to collect additional samples to delineate the contamination
Note on chain of custody ‐ Normal TAT
5If results Do Not exceed the EPA screening levels or NJDEP screening criteria, no additional samples or analysis will be required
R2-0000370