phase diagrams a review - american university of beirut phase diagrams.… · example: solubility...
TRANSCRIPT

Phase Diagramsa Review
Topic 2

Review of Phase Transformation
Diagrams

Example: Solubility of salt in waterThere exists a maximum amount of salt that can be completely dissolved in water; excess of salt stays as solid. This maximum amount is the solubility of salt in water. The solution containing the maximum concentration of salt is a saturated solution.
Cooling of saturated solution results in the formation of solid salt from the solution, indicating that solubility decreases with decreasing T. This process is called precipitation and the solid formed is a precipitate. Heating the solution will lead to the dissolving of the precipitate back into solution.
Salty water – the solution
Solid salt – the precipitate
The same concepts apply to solids: solid solution, saturation, solubility, precipitation
In this example there exist two phases in the system and the two phases stay in equilibrium:
Solution Soliddissolving
precipitation
Solution and Solubility

Phase diagrams are used to map out the existence and conditions of various phases of a give system. The phase diagram of water is a common example. Water may stay in liquid, solid or gaseous states in different pressure-temperature regions. Boundaries of the regions express the equilibrium conditions in terms of P and T. Water is a monolithic system. For binary systems, which contains two constituents, such as binary alloys, phase diagrams are often expressed in the temperature-composition plane.
Liquid
Solid
Gas
Sup
er-c
ritic
al
fluid
Triple point
Critical point
Temperature0°C 100°C 374°C
0 bar
1 bar
221 bar
Pre
ssur
e
phase diagram of water
Phase Diagrams

The simplest type of binary phase diagrams is the isomorphous system, in which the two constituents form a continuous solid solution over the entire composition range. An example is the Ni-Cu system.
Solidification of alloy Co starts on
cooing at T1. The first solid formed has
a composition of Cs1 and the liquid
Co. On further cooling the solid
particles grow larger in size and change their composition to Cs2 and then Co,
following the solidus whereas the liquid decrease in volume and changes its composition from Co to CL3 following
the liquidus. The solidification completes at T3.
1455°C
1085°C
Cu Ni
α phase (fcc) -Solid solution of Cu and Ni
liquid phase -Solution of Cu and Ni
Composition
Tem
pera
ture CS
1
T1
CL2
Co
T2
T3CS2Co
CL3
L
α
Binary Phase Diagrams
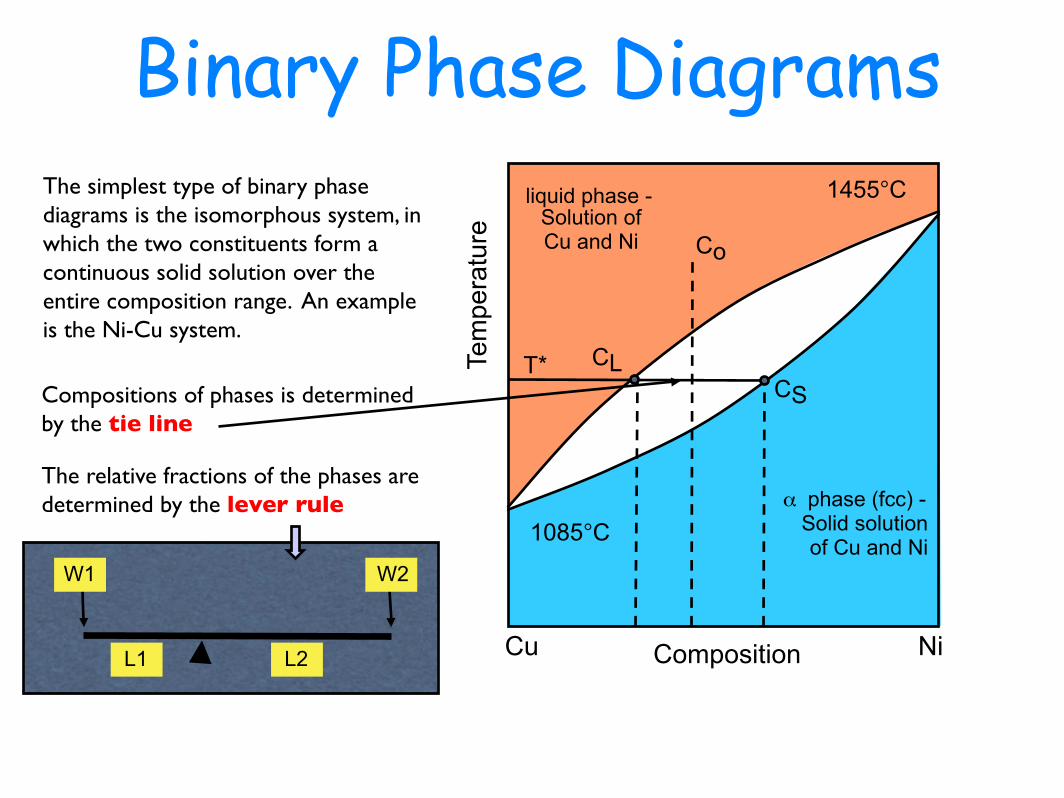
The simplest type of binary phase diagrams is the isomorphous system, in which the two constituents form a continuous solid solution over the entire composition range. An example is the Ni-Cu system.
Compositions of phases is determined by the tie line
The relative fractions of the phases are determined by the lever rule
W1 W2
L2L1
1455°C
1085°C
Cu Ni
α phase (fcc) -Solid solution of Cu and Ni
liquid phase -Solution of Cu and Ni
Composition
Tem
pera
ture
CST* CL
Co
Binary Phase Diagrams

W1 W2
L2L1
Weight fractions:
Lever Rule

Read from the tie line:Liquid phase:Cu-30%Niα-phase: Cu-55%Ni
CL CSCo
At temperature T1, alloy Co is in the dual phase region,
comprising the liquid phase and the α-phase.
(i) Determine the compositions of the two phases;(ii) Determine the weight fractions of the two phases
50%NiCu Ni
1455°C
1085°C
CS
C0
CL T1
55%Ni30%Ni
Example
55 50 0.2 20%55 30
s oL
s L
C CWC C
− −= = = =
− −
50 30 0.8 80%55 30
1 1 0.2 0.8 80%
o L
s L
L
C CWC C
orW W
α
α
− −= = = =
− −
= − = − = =

determination of Phase diagrams
T1085°C
II
(thermal arrest)
T
t
T2
T1
I
Cu Ni
T
%
II I III
1455°C
1085°C
T1
T2
Solidus
Liquidus
Cooling Curves

Pb-Sn phase diagram
β phase: solid solution of Pb in
tetragonal Snα phase: solid solution of Sn
in fcc Pb
Liquid
Pb (Fcc)
Sn (Tetra)
0
50
100
150
200
250
300
350
0 10 20 30 40 50 60 70 80 90 100
Tem
pera
ture
Wt%
The Pb-Sn system is characteristic of a valley in the middle. Such system is known as the Eutectic system. The central point is the Eutectic point and the transformation though this point is called Eutectic reaction: Lα+βPb has a fcc structure and Sn has a tetragonal structure. The system has three phases: L, α and β.
solvussolvus
solidus
Liquidus
Eutectic point
α + β
α + LL + β
Eutectic Systems

Alloy I:At point 1: LiquidSolidification starts at liquidusAt point 2: L+αThe amount α ↑ with ↓ T Solidification finishes at solidusAt point 3: αPrecipitation starts at solvusAt point 4: α+βFurther cooling leads to formation and growth of more β precipitates whereas Sn% in α decreases following the solvus.
The cooling curve of this alloy is similar to cooling curve I shown in slide 9.
I
1
2
3
4
III II
Solidification of Eutectic Systems
Pb-Sn phase diagram
Liquid
Pb (Fcc)
Sn (Tetra)
0
50
100
150
200
250
300
350
0 10 20 30 40 50 60 70 80 90 100
Tem
pera
ture
Wt%
αβ

L
L
(1)
α
L(2)
β
α
(4)
α
(3)
Precipitates in a Al-Si alloy; (a) optical microscopy, (b) scanning electron
microscopy of fracture surface
(a)
(b)

Pb-Sn phase diagram
Liquid
Pb (Fcc)
Sn (Tetra)
0
50
100
150
200
250
300
350
0 10 20 30 40 50 60 70 80 90 100
Tem
pera
ture
Wt%
αβ
III
2
3
III
1
Alloy II:At point 1: LiquidSolidification starts at eutectic point (where liquidus and solidus join)At point 2: L(α+β) (eutectic reaction)The amounts of α and β increase in proportion with time.Solidification finishes at the same temperature.At point 3: α+βFurther cooling leads to the depletion of Sn in α and the depletion of Pb in β.
The cooling curve of this alloy is similar to cooling curve II shown in slide 9.
Solidification of Eutectic Systems

L
L
(1)
L(2)
Pb-Sn eutectic
(3) Nucleation of colonies of α and β laminates
Eutectic structure of intimate mix of α and β to minimise diffusion path

Pb-Sn phase diagram
Liquid
Pb (Fcc)
Sn (Tetra)
0
50
100
150
200
250
300
350
0 10 20 30 40 50 60 70 80 90 100
Tem
pera
ture
Wt%
αβ
III
Alloy III:At point 1: LiquidSolidification starts at liquidusAt point 2: LL+α (pre-eutectic α)The amount α ↑ with ↓T At point 3: L (α+β) (eutectic reaction)Solidification finishes at the eutectic temperatureAt point 4: α+β (pre-eutectic α + (α+β) eutectic mixture)Further cooling leads to the depletion of Sn in α and the depletion of Pb in β.
The cooling curve of this alloy is a combination of the two cooling curves shown in slide 9.
I
2
II
1
3
4
Solidification of Eutectic Systems

L
L
(1)
α
L(2)
α
L
(3)
α
Eut
(3)
Eutectic laminate of α and β
Cu-Ag alloyPre-eutectic α
Cooling curve

Can you describe the solidification process of alloy IV, including microstructure evolution, morphology of phases and cooling curve?
Sn
I III II IV
Liquid
Pb
α + β
0
50
100
150
200
250
300
350
α β
Hypoeutectic Hypereutectic
Solidification of Eutectic Systems

Gibbs phase rule F =C+N-PF: degree of freedomC: number of chemical variablesN: number of non-chemical variablesP: number of phases
Application of Gibbs phase rule:For a binary system at ambient pressure:C=2 (2 elements)N=1 (temperature, no pressure)For single phase: F=2: % and T (a region)For a 2-phase equilibrium: F=1:% or T (a line)For a 3-phase equilibrium: F=0, (invariant point)
May we have a 4-phase equilibrium, in a binary system, or in any system?
Pb Sn
α + β
α β
L one-phase region
two-phase equilibrium (line)
three-phase equilibrium (point)
Gibbs Phase Rule
Some transformations do not cause changes in composition, such as the solidification of a pure metal, whereas some other do, such as the solidification of an alloy into a solid solution. The former is known as congruent transformation and the latter incongruent transformations. Congruent transformations are cooling rate insensitive and incongruent transformations are cooling rate sensitive – they rely on interdiffusion to proceed. Solidification under a fast cooling rate, where diffusion is insufficient to homogenise the composition simultaneously during the process is known as the non-equilibrium solidification. A common consequence of non-equilibrium solidification is coring.
Non-Equilibrium Solidification

Alloy Co starts solidification at T1. The first
solid formed has composition Cs1. On
further cooling to T2, an outer shell of composition Cs2 is formed surrounding
Cs1. Due to inadequate diffusion on fast
cooling, a composition difference is created. The average composition of the solid composite at T2 is, thus, somewhere between Cs1 and Cs2: Cs2*. The same
situation continues throughout the process.Under equilibrium condition solidification completes at T3. However, under non-equilibrium condition, the average composition of solid at T3 is Cs3* <Co,
indicating that solidification is not completed yet. Solidification actually ends when the average composition of solid equals Co, i.e.,
at T4.
A %B
Equilibrium solidus
T2
T3 (end of solidification under equilibrium)
T4 (actual end of solidification)
T1 (start of solidification)
Effective solidus
Co
Cs1
Cs2
Cs
2*
Cs
3*
Non-equilibrium solidification lowers effective melting temperature.
Coring

L
Cs1
T1
Cs1
Cs2
T2
T3
Average solid composition: Cs2*
Average solid composition: Cs3*
T4
Average solid composition: Co
The cored structure: composition segregation, enrichment of high-Tm constituent in the core
A %B
Equilibrium solidus
T2
T3 (end of solidification under equilibrium)
T4 (actual end of solidification)
T1 (start of solidification)
Effective solidus
Co
Cs1
Cs2
Cs
2*
Cs
3*
Coring

A B
α + β
α β
L
Coring leads to increase of weight fraction of eutectic products
a b c d
coAccording to the lever rule, the weight fraction of the eutectic products can be computed as:
Under equilibrium condition:
Under non-equilibrium condition:
eutc bWd b−
=−
*eut
c aWd a−
=−
*eut eutW W>
Coring in Eutectic Systems

A %B
LS
S LCo
CS
CL
CS
CL
Co
C
x
x
T Tm
T
Supercooling window caused by rising Tm, resulting in unstable
interface
Constitutional Supercooling

A consequence of constitutional supercooling and destabilisation of solid-liquid interface is the formation of dendritic structure, as commonly found in alloy castings. In such structure, gaps between dendrites and between dentitic fingers are regions rich of low-melting temperature phases and impurities. Dendritic branches themselves are often cored, too. This often require post-casting heat treatment to homogenise the structure.
Dendrite Structure of Metals