pharmaceuticals in municipal wastewater
TRANSCRIPT
Photo image area measures 2” H x 6.93” W and can be masked by a
collage strip of one, two or three images.
The photo image area is located 3.19” from left and 3.81” from top of page.
Each image used in collage should be reduced or cropped to a maximum of
2” high, stroked with a 1.5 pt white frame and positioned edge-to-edge with
accompanying images.
Mitch Kostich, Angela Batt, Susan Glassmeyer and Jim Lazorchak
Pharmaceuticals in municipal wastewater
Office of Research and DevelopmentNational Exposure Research Laboratory
Although this work was reviewed by EPA and approved for publication, it may not necessarily reflect official Agency policy.
September 24, 2014
2
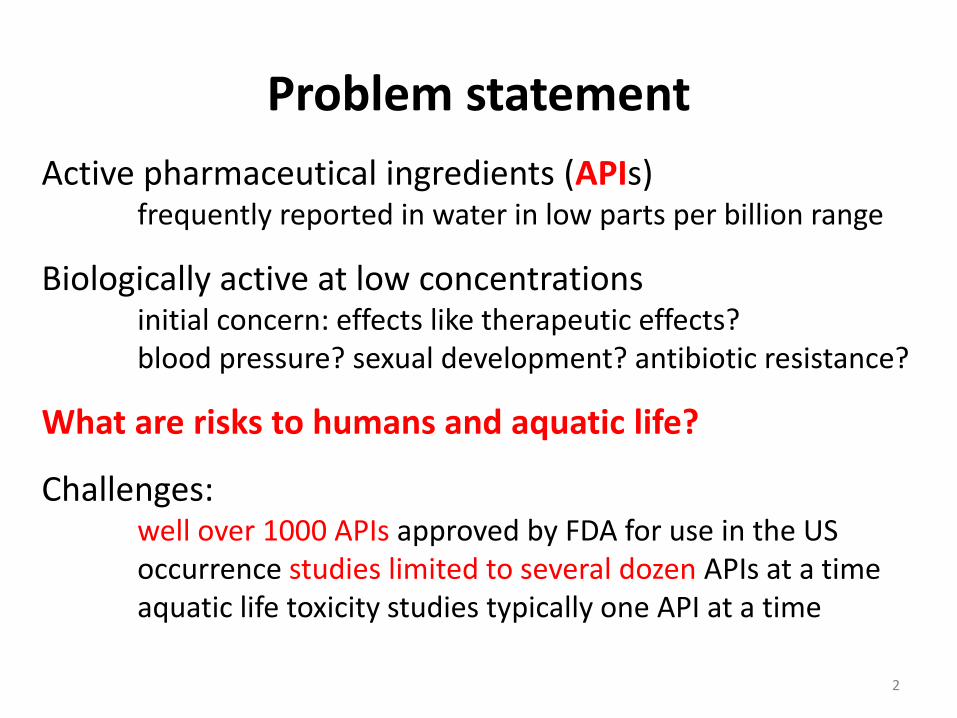
Problem statement
Active pharmaceutical ingredients (APIs) frequently reported in water in low parts per billion range
Biologically active at low concentrationsinitial concern: effects like therapeutic effects?blood pressure? sexual development? antibiotic resistance?
What are risks to humans and aquatic life?
Challenges: well over 1000 APIs approved by FDA for use in the USoccurrence studies limited to several dozen APIs at a timeaquatic life toxicity studies typically one API at a time
3
4
Project intent
Inform prioritization of EPA research related to:Clean Water Act: discharges into ambient watersSafe Drinking Water Act: drinking water quality
Provide screening level estimates of riskfor humans and aquatic lifenarrow the scope of concernwhich drugs? effect types? intensity? target populations?
Risk-based prioritization for potential future occurrence or toxicology studiesfocus on the drugs most likely to present risksidentify the critical (for risk estimation) unknowns
5
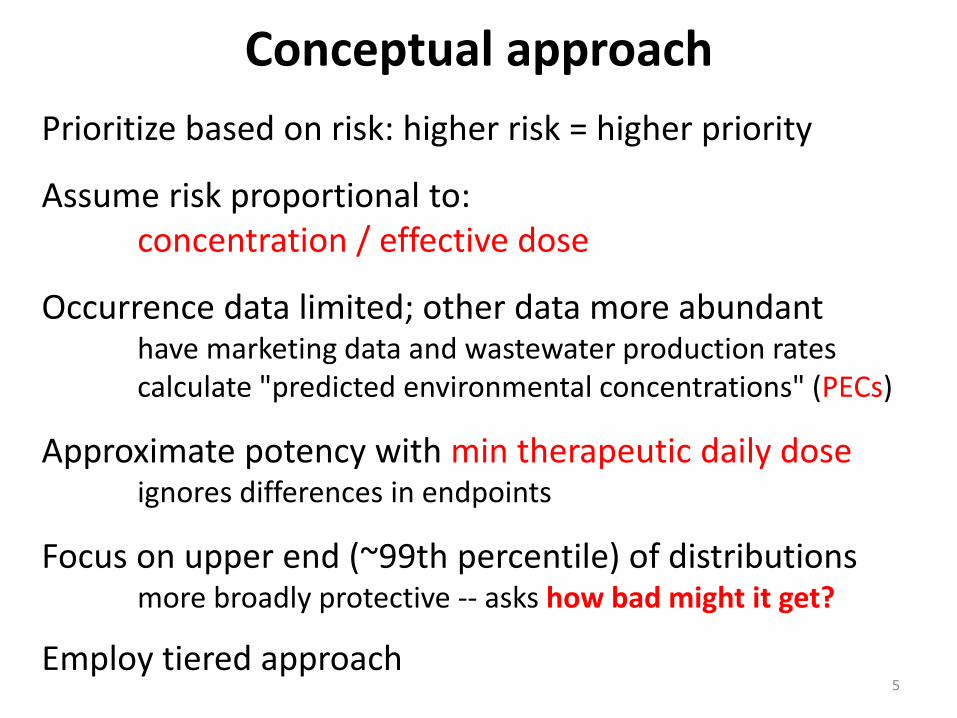
Conceptual approach
Prioritize based on risk: higher risk = higher priority
Assume risk proportional to: concentration / effective dose
Occurrence data limited; other data more abundanthave marketing data and wastewater production ratescalculate "predicted environmental concentrations" (PECs)
Approximate potency with min therapeutic daily doseignores differences in endpoints
Focus on upper end (~99th percentile) of distributionsmore broadly protective -- asks how bad might it get?
Employ tiered approach

6
Tolerating uncertainty
There are a lot of uncertainties in model parameters like:physiological degradation, WWTP removal,
in-stream removal, ecotoxicology, etc.
Replace unknowns with protective defaults: translates uncertainty into higher risk quotientprioritization highlights critical uncertaintiesfalse positives much more likely than false negatives
How much uncertainty can we accept?
For example: if 105 PPT is 'safe' level then:if PEC is 100 PPT: 0.1-fold (up to 110 PPT) may be problemif PEC is 0.01 PPT: 1000-fold (up to 10 PPT) is ok

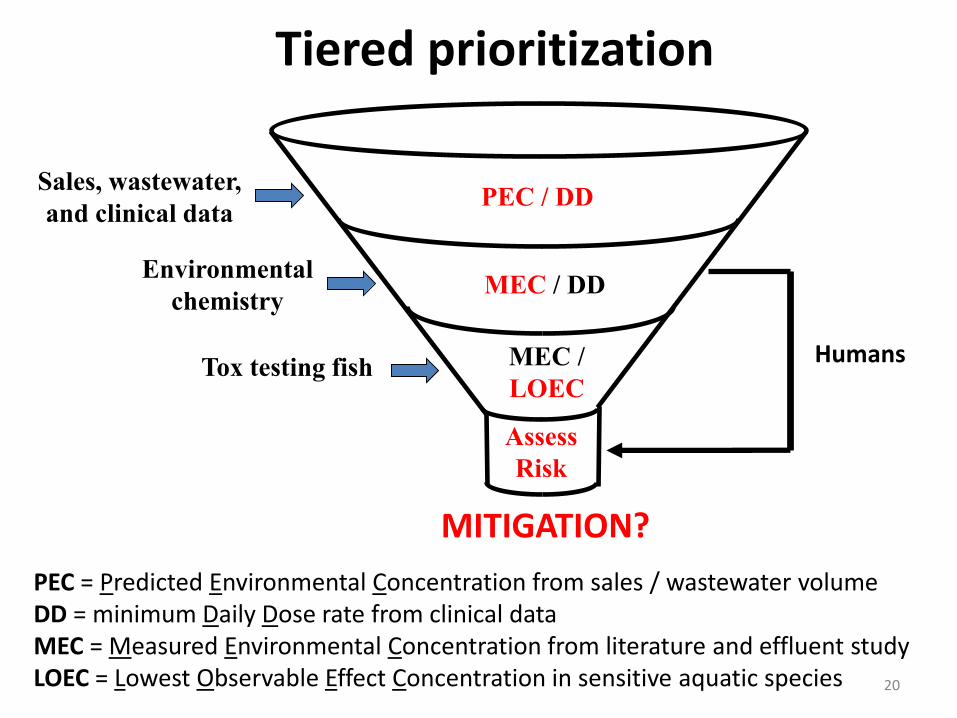
Tiered prioritization
PEC / DD
MEC / DD
MEC /
LOEC
MITIGATION?
Assess
Risk
Humans
Sales, wastewater,
and clinical data
Environmental
chemistry
Tox testing fish
PEC = Predicted Environmental Concentration from sales / wastewater volumeDD = minimum Daily Dose rate from clinical dataMEC = Measured Environmental Concentration from literature and effluent studyLOEC = Lowest Observable Effect Concentration in sensitive aquatic species 7
8
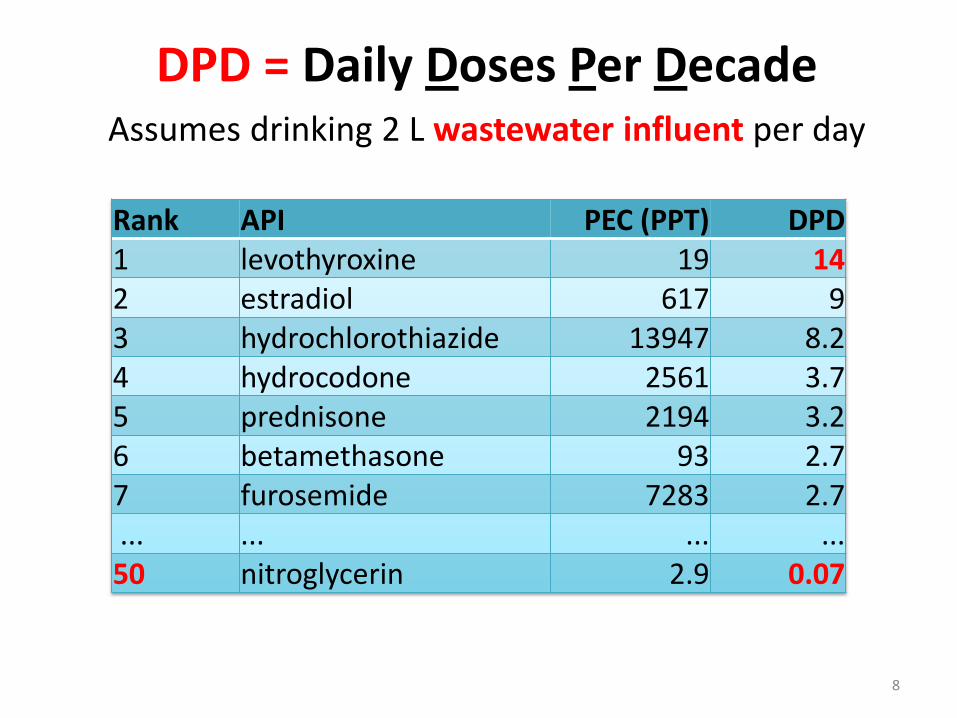
DPD = Daily Doses Per DecadeAssumes drinking 2 L wastewater influent per day
Rank API PEC (PPT) DPD 1 levothyroxine 19 142 estradiol 617 93 hydrochlorothiazide 13947 8.24 hydrocodone 2561 3.75 prednisone 2194 3.26 betamethasone 93 2.77 furosemide 7283 2.7... ... ... ... 50 nitroglycerin 2.9 0.07

9
What about mixtures?
Mode of action API / Mode DPDthyroid hormone modulator 3 30.7neurotransmitter modulator 105 28.1anti-inflammatory 32 26.5anti-hypertensive 36 22.4reproductive modulator 26 22anti-hyperglycemic 7 6.6lipid modifier 9 5.4h1 anti-histamine 11 1.9antibacterial 32 1.9gastric antacid 9 1.2
A few APIs dominate each mode of action (MOA)
10
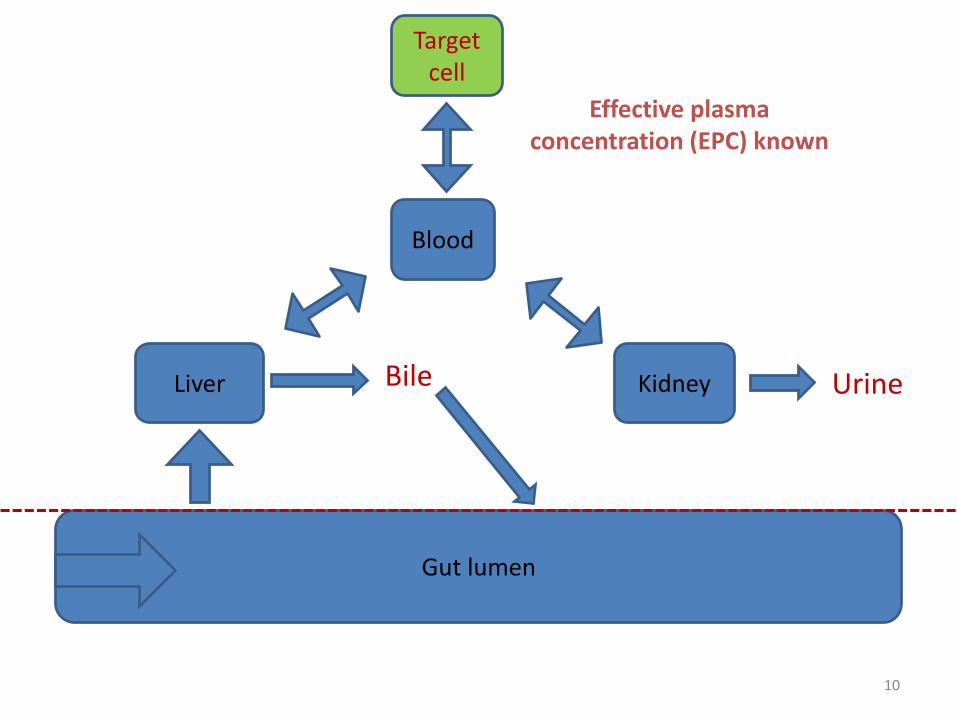
Liver
Blood
Gut lumen
Kidney
Targetcell
UrineBile
Effective plasmaconcentration (EPC) known

11
Liver
Blood
Gut lumen
Kidney
Targetcell

12
Wastewater influent
Targetcell
Compare effectiveplasma concentration (EPC)
directly to PEC
100% bioavailability, no systemic detoxification
13
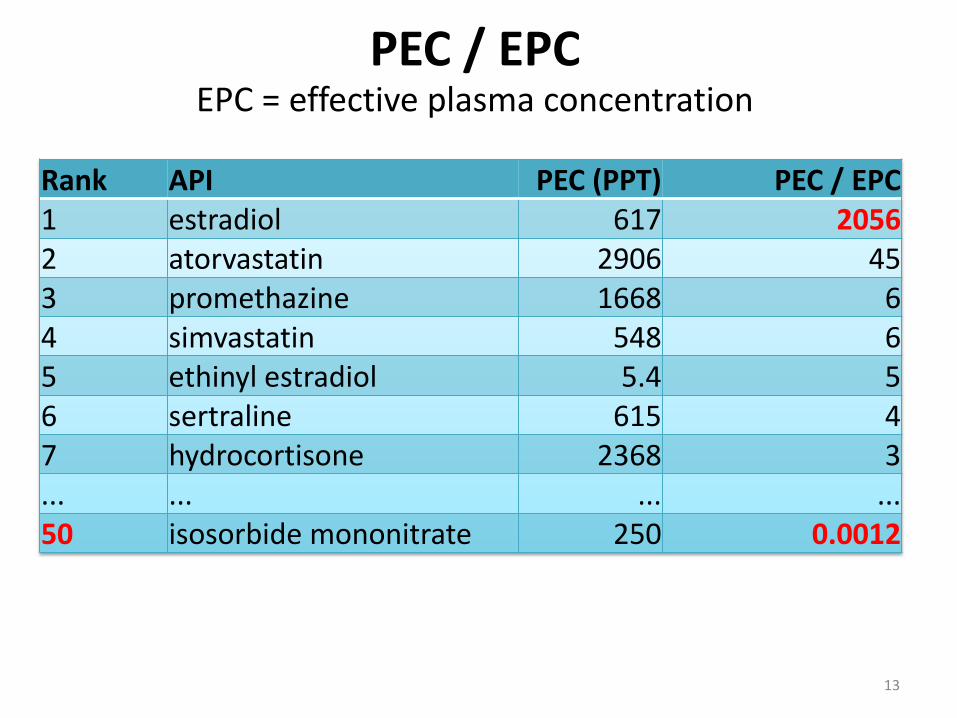
PEC / EPCEPC = effective plasma concentration
Rank API PEC (PPT) PEC / EPC 1 estradiol 617 20562 atorvastatin 2906 453 promethazine 1668 64 simvastatin 548 65 ethinyl estradiol 5.4 56 sertraline 615 47 hydrocortisone 2368 3... ... ... ... 50 isosorbide mononitrate 250 0.0012
14
14
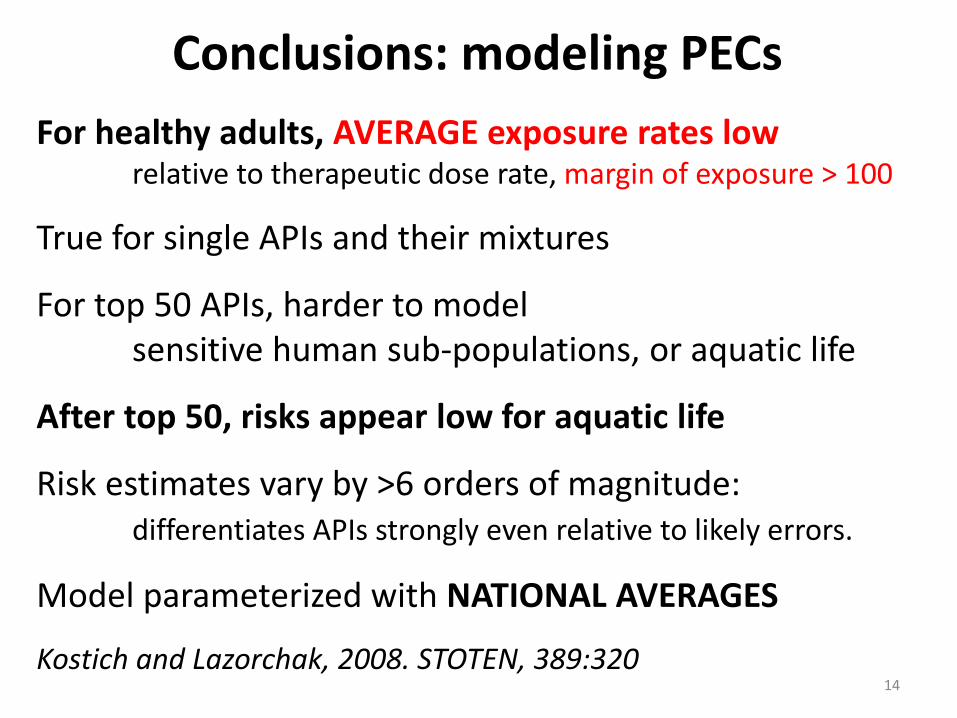
Conclusions: modeling PECs
For healthy adults, AVERAGE exposure rates lowrelative to therapeutic dose rate, margin of exposure > 100
True for single APIs and their mixtures
For top 50 APIs, harder to model sensitive human sub-populations, or aquatic life
After top 50, risks appear low for aquatic life
Risk estimates vary by >6 orders of magnitude: differentiates APIs strongly even relative to likely errors.
Model parameterized with NATIONAL AVERAGES
Kostich and Lazorchak, 2008. STOTEN, 389:320

15
DEA data (controlled APIs)
Amount dispensed within 3-digit zip code from DEAfor 9 controlled APIs
Population size within 3-digit zip code from US Census
Calculate average per capita consumption within area

16
Wastewater Plant Data
Plant ID Zip CodeTotal Flow
MGD Population
08209000098 81301 0.3 4350
13000211002 31601 1.21 10900
22000980001 71247 0.05 475
42006166001 15767 1.48 10243
39008371001 45619 0.77 10203
10,631 more wastewater plant records. From US EPA
Clean Watersheds Needs Survey
17
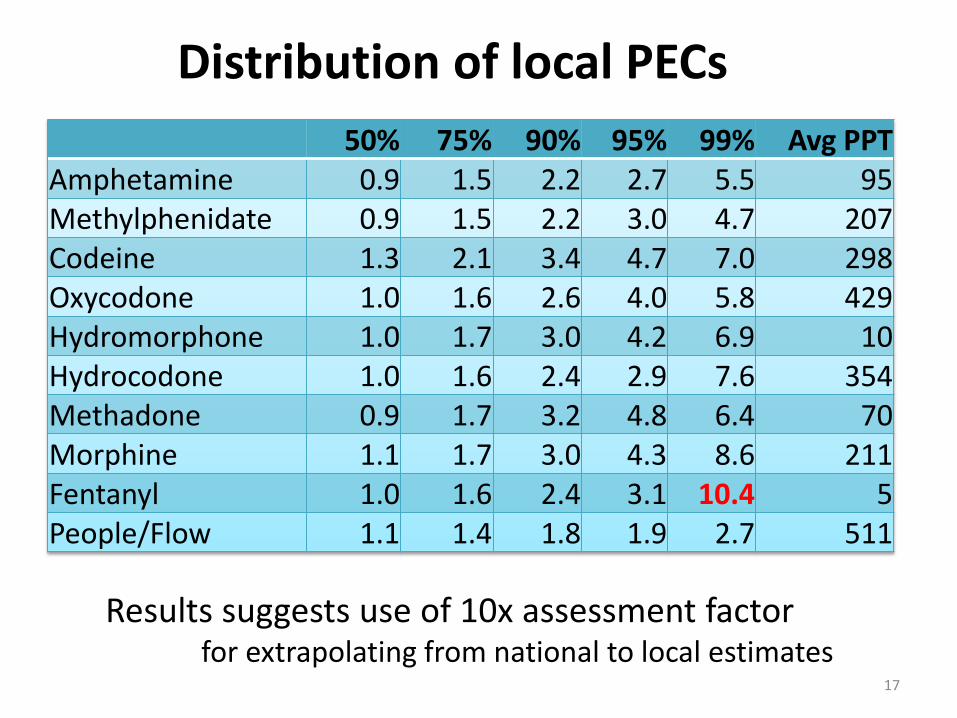
Distribution of local PECs
50% 75% 90% 95% 99% Avg PPTAmphetamine 0.9 1.5 2.2 2.7 5.5 95Methylphenidate 0.9 1.5 2.2 3.0 4.7 207Codeine 1.3 2.1 3.4 4.7 7.0 298Oxycodone 1.0 1.6 2.6 4.0 5.8 429Hydromorphone 1.0 1.7 3.0 4.2 6.9 10Hydrocodone 1.0 1.6 2.4 2.9 7.6 354Methadone 0.9 1.7 3.2 4.8 6.4 70Morphine 1.1 1.7 3.0 4.3 8.6 211Fentanyl 1.0 1.6 2.4 3.1 10.4 5People/Flow 1.1 1.4 1.8 1.9 2.7 511
Results suggests use of 10x assessment factorfor extrapolating from national to local estimates
18
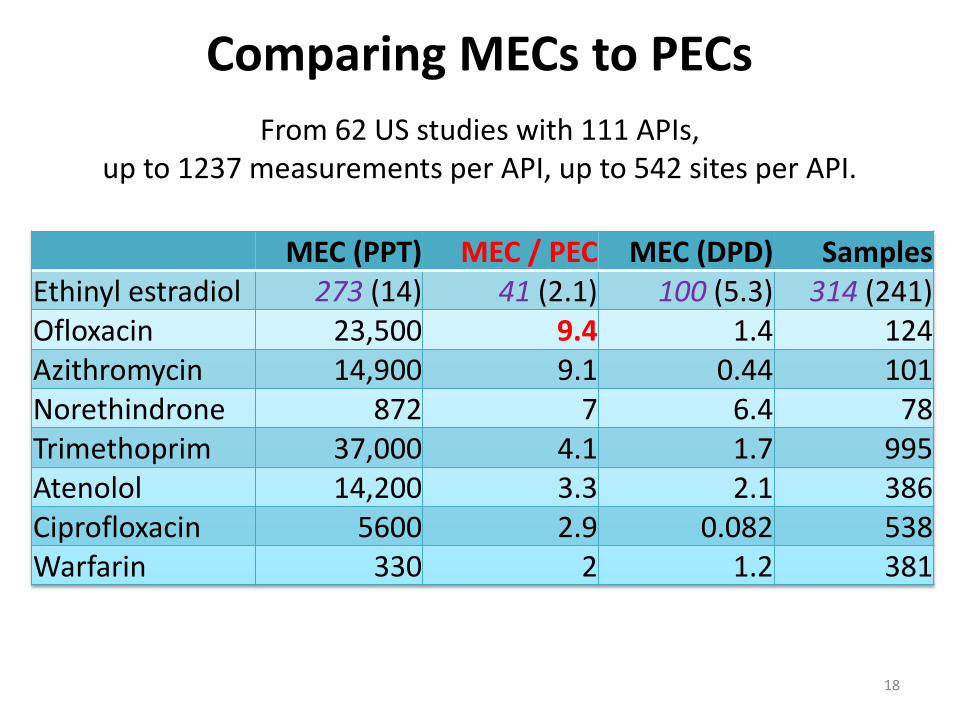
Comparing MECs to PECs
From 62 US studies with 111 APIs, up to 1237 measurements per API, up to 542 sites per API.
MEC (PPT) MEC / PEC MEC (DPD) SamplesEthinyl estradiol 273 (14) 41 (2.1) 100 (5.3) 314 (241)Ofloxacin 23,500 9.4 1.4 124Azithromycin 14,900 9.1 0.44 101Norethindrone 872 7 6.4 78Trimethoprim 37,000 4.1 1.7 995Atenolol 14,200 3.3 2.1 386Ciprofloxacin 5600 2.9 0.082 538Warfarin 330 2 1.2 381
19
19
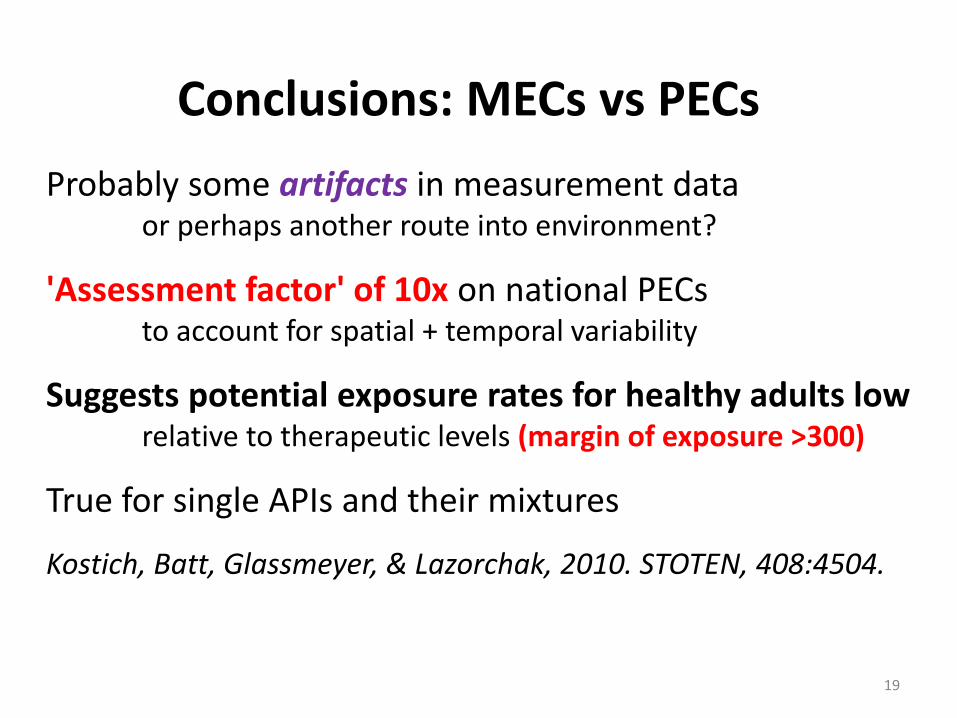
Probably some artifacts in measurement dataor perhaps another route into environment?
'Assessment factor' of 10x on national PECsto account for spatial + temporal variability
Suggests potential exposure rates for healthy adults lowrelative to therapeutic levels (margin of exposure >300)
True for single APIs and their mixtures
Kostich, Batt, Glassmeyer, & Lazorchak, 2010. STOTEN, 408:4504.
Conclusions: MECs vs PECs
Tiered prioritization
PEC / DD
MEC / DD
MEC /
LOEC
MITIGATION?
Assess
Risk
Humans
Sales, wastewater,
and clinical data
Environmental
chemistry
Tox testing fish
PEC = Predicted Environmental Concentration from sales / wastewater volumeDD = minimum Daily Dose rate from clinical dataMEC = Measured Environmental Concentration from literature and effluent studyLOEC = Lowest Observable Effect Concentration in sensitive aquatic species 20

Municipal Effluent Study
24-hour composite samples from 50 very large WWTPs (15 to >500 MGD)
Assume effluent is worst case water concentrationrelevant to humans and aquatic life
These 50 WWTPs serve 46M people, produce ~17% of all municipal WWTP effluent
Analytes selected using PEC-based DPD estimatessteroidal estrogens, androgens, and other emerging contaminants will be reported elsewhere.
LC-MS/MS with isotopically labeled standards.
Kostich, Batt, and Lazorchak, 2014. Env Pol, 184:354.21
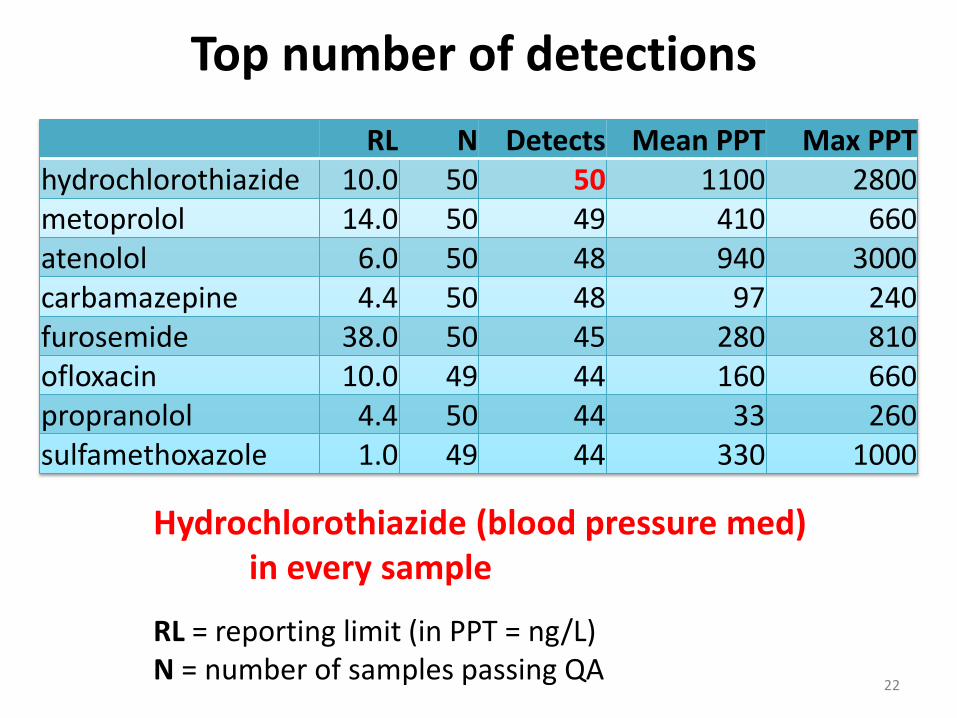
Top number of detections
Hydrochlorothiazide (blood pressure med) in every sample
RL = reporting limit (in PPT = ng/L)N = number of samples passing QA
RL N Detects Mean PPT Max PPThydrochlorothiazide 10.0 50 50 1100 2800metoprolol 14.0 50 49 410 660atenolol 6.0 50 48 940 3000carbamazepine 4.4 50 48 97 240furosemide 38.0 50 45 280 810ofloxacin 10.0 49 44 160 660propranolol 4.4 50 44 33 260sulfamethoxazole 1.0 49 44 330 1000
22
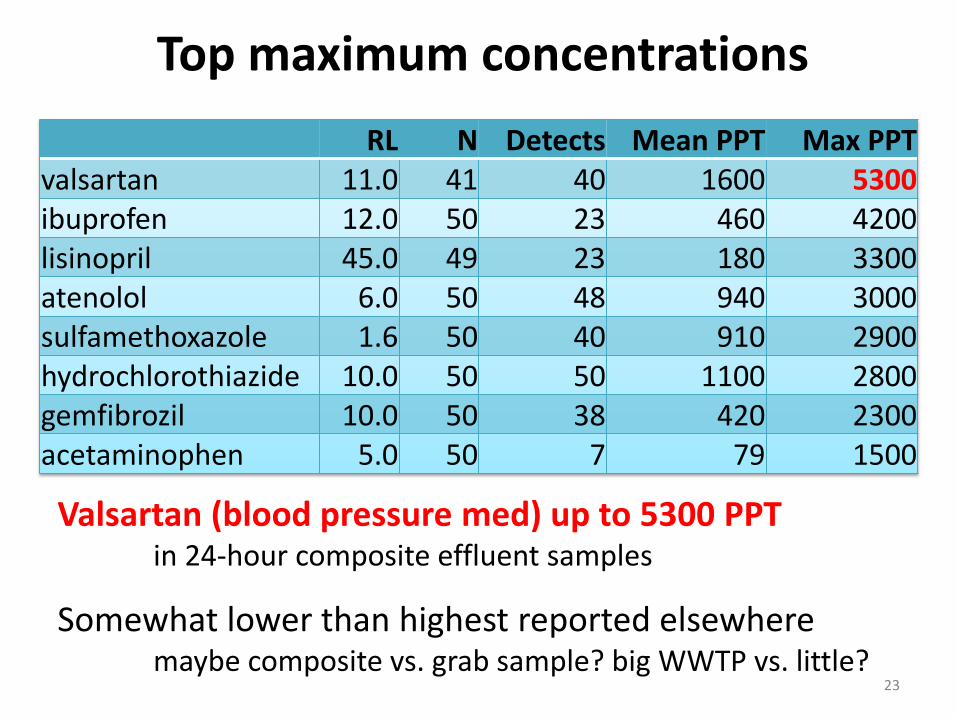
Top maximum concentrations
Valsartan (blood pressure med) up to 5300 PPT in 24-hour composite effluent samples
Somewhat lower than highest reported elsewhere maybe composite vs. grab sample? big WWTP vs. little?
RL N Detects Mean PPT Max PPTvalsartan 11.0 41 40 1600 5300ibuprofen 12.0 50 23 460 4200lisinopril 45.0 49 23 180 3300atenolol 6.0 50 48 940 3000sulfamethoxazole 1.6 50 40 910 2900hydrochlorothiazide 10.0 50 50 1100 2800gemfibrozil 10.0 50 38 420 2300acetaminophen 5.0 50 7 79 1500
23
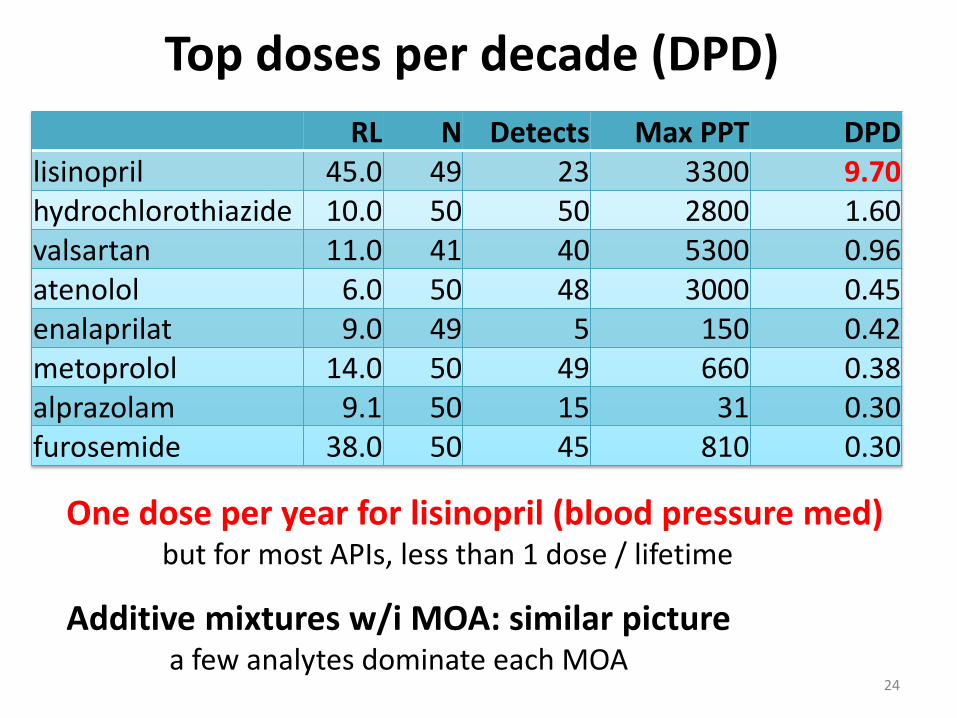
Top doses per decade (DPD)
One dose per year for lisinopril (blood pressure med) but for most APIs, less than 1 dose / lifetime
Additive mixtures w/i MOA: similar picturea few analytes dominate each MOA
RL N Detects Max PPT DPDlisinopril 45.0 49 23 3300 9.70hydrochlorothiazide 10.0 50 50 2800 1.60valsartan 11.0 41 40 5300 0.96atenolol 6.0 50 48 3000 0.45enalaprilat 9.0 49 5 150 0.42metoprolol 14.0 50 49 660 0.38alprazolam 9.1 50 15 31 0.30furosemide 38.0 50 45 810 0.30
24

Top ( MEC / EPC )
Below 1 for all, but four APIs a bit close for comfortfor rest: less than 10% of EPC (effective plasma conc)
For a few APIs: Potential risks to aquatic life?suggests study of concentration-response across taxa
RL N Detects Max PPT PPT / EPCsertraline 5.0 50 32 71 0.71propranolol 4.4 50 44 260 0.65desmethylsertraline 9.4 50 9 24 0.24valsartan 11.0 41 40 5300 0.18furosemide 38.0 50 45 810 0.08lisinopril 45.0 49 23 3300 0.07
25

Top ( MEC / Breakpoint )
All below 0.1% of clinical resistance breakpoint (BP)
Unlikely to directly select for clinical resistanceMEC << tolerable concentration for patients
RL N Detects Max PPT PPT / BPofloxacin 10.0 49 44 660 0.0003ciprofloxacin 10.0 49 30 260 0.0003trimethoprim 2.5 43 37 370 0.00009sulfamethoxazole 1.6 50 40 2900 0.00004sulfamethazine 10.0 49 1 87 0.000002
26
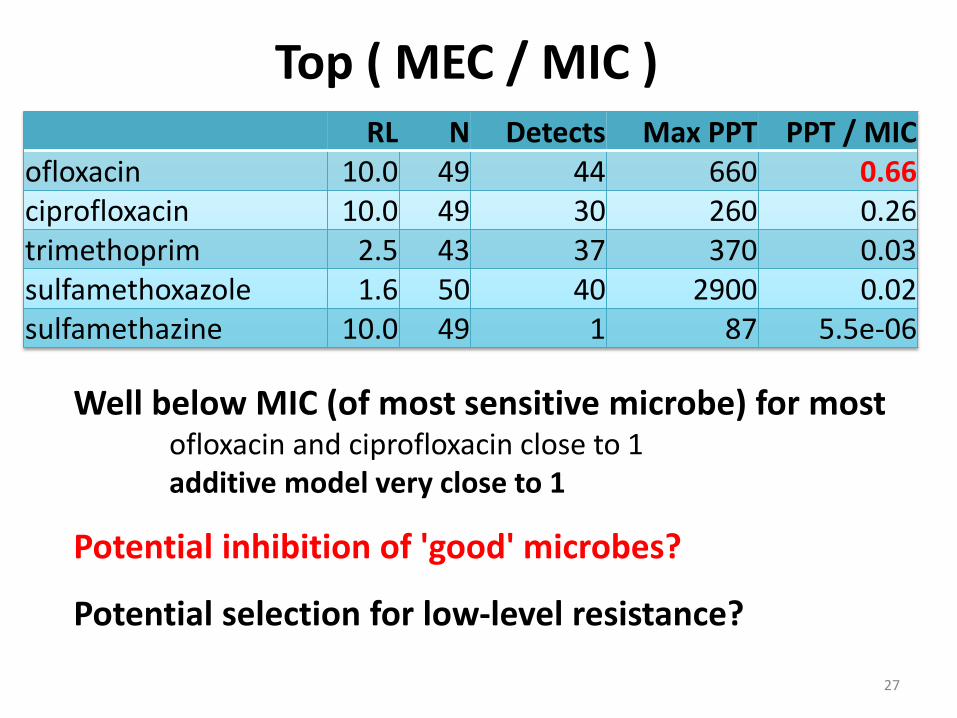
Top ( MEC / MIC )
Well below MIC (of most sensitive microbe) for mostofloxacin and ciprofloxacin close to 1 additive model very close to 1
Potential inhibition of 'good' microbes?
Potential selection for low-level resistance?
RL N Detects Max PPT PPT / MICofloxacin 10.0 49 44 660 0.66ciprofloxacin 10.0 49 30 260 0.26trimethoprim 2.5 43 37 370 0.03sulfamethoxazole 1.6 50 40 2900 0.02sulfamethazine 10.0 49 1 87 5.5e-06
27

Max ( MEC / PEC )
Well within 10-fold 'assessment factor'accounts for spatio-temporal variability
Suggests reliability of model estimatesand very low risks for lower priority, unmeasured APIsbased on applying assessment factor to PECs
RL N Detects Max PPT MEC / PEClisinopril 45.0 49 23 3308 4.06valsartan 11.0 41 40 5263 2.00atenolol 6.0 50 48 3046 0.74metoprolol 14.0 50 49 656 0.45enalaprilat 9.0 49 5 145 0.39alprazolam 9.1 50 15 31 0.30propranolol 4.4 50 44 260 0.26
28

Tiered prioritization
PEC / DD
MEC / DD
MEC /
LOEC
MITIGATION?
Assess
Risk
Humans
Sales, wastewater,
and clinical data
Environmental
chemistry
Tox testing fish
PEC = Predicted Environmental Concentration from sales / wastewater volumeDD = minimum Daily Dose rate from clinical dataMEC = Measured Environmental Concentration from literature and effluent studyLOEC = Lowest Observable Effect Concentration in sensitive aquatic species 29
30
30
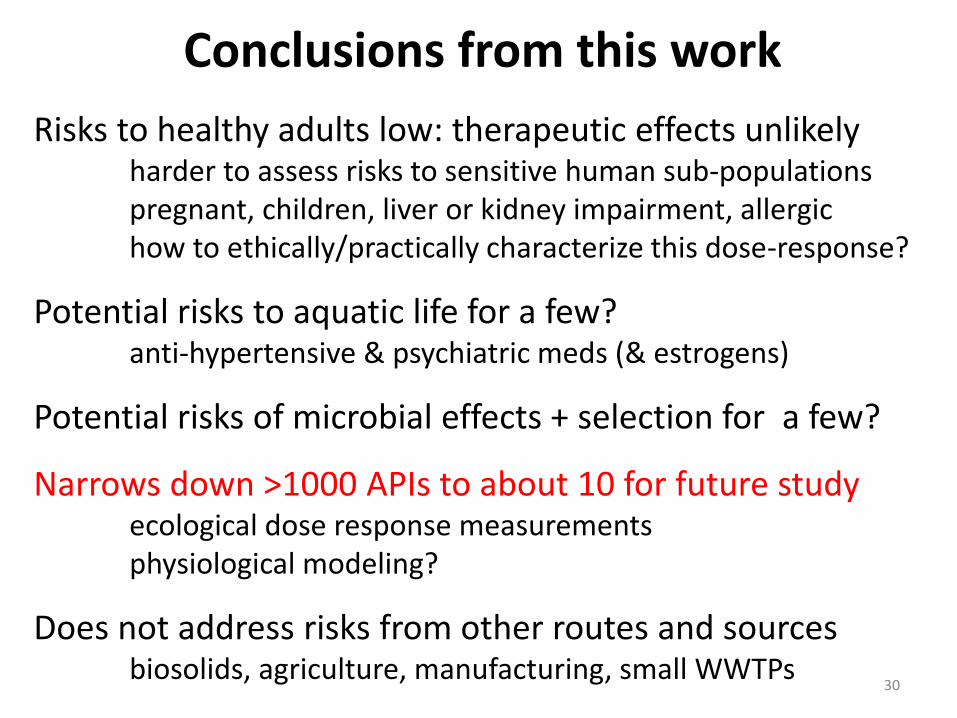
Conclusions from this work
Risks to healthy adults low: therapeutic effects unlikelyharder to assess risks to sensitive human sub-populationspregnant, children, liver or kidney impairment, allergichow to ethically/practically characterize this dose-response?
Potential risks to aquatic life for a few?anti-hypertensive & psychiatric meds (& estrogens)
Potential risks of microbial effects + selection for a few?
Narrows down >1000 APIs to about 10 for future studyecological dose response measurementsphysiological modeling?
Does not address risks from other routes and sourcesbiosolids, agriculture, manufacturing, small WWTPs
31
31
Acknowledgements
Mark Smith Herman HaringMarc Mills Shoji NakayamaThe McConnell Group Kidus TadeleMohamed Amin Stephen HaleTowana Joseph Kathleen FoleyThuan Tan Robert MorrellRandy Braun David PrattJohn Houlihand
USEPA Region 2 Division of Environmental Science and AssessmentUSEPA Region 7 Environmental Services Division
50 WWTPs whose voluntary participation made this study possible
32
32
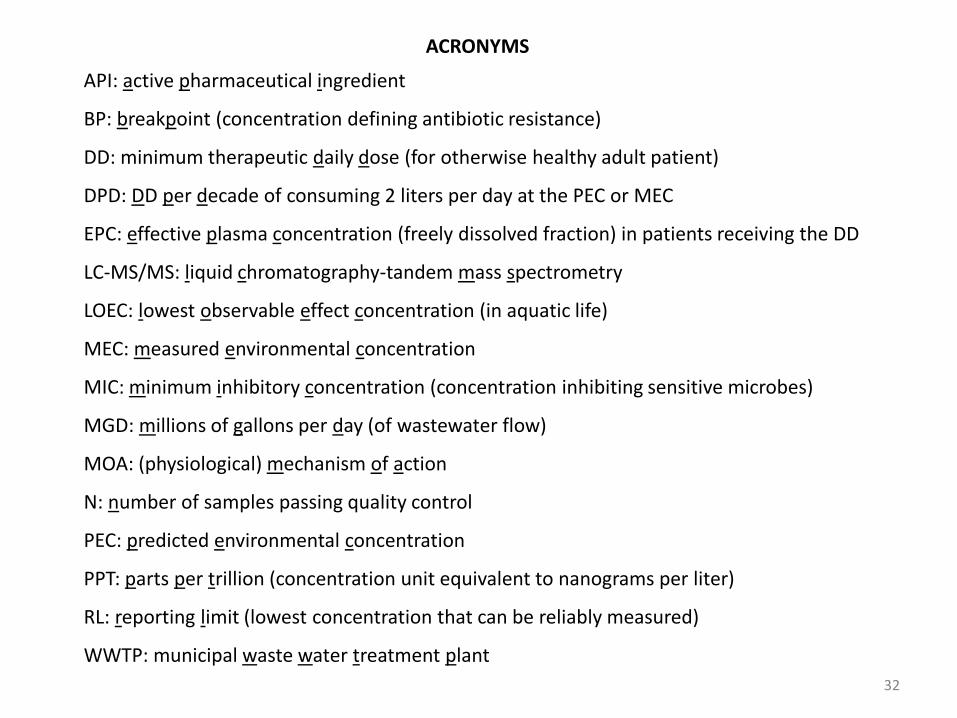
ACRONYMS
API: active pharmaceutical ingredient
BP: breakpoint (concentration defining antibiotic resistance)
DD: minimum therapeutic daily dose (for otherwise healthy adult patient)
DPD: DD per decade of consuming 2 liters per day at the PEC or MEC
EPC: effective plasma concentration (freely dissolved fraction) in patients receiving the DD
LC-MS/MS: liquid chromatography-tandem mass spectrometry
LOEC: lowest observable effect concentration (in aquatic life)
MEC: measured environmental concentration
MIC: minimum inhibitory concentration (concentration inhibiting sensitive microbes)
MGD: millions of gallons per day (of wastewater flow)
MOA: (physiological) mechanism of action
N: number of samples passing quality control
PEC: predicted environmental concentration
PPT: parts per trillion (concentration unit equivalent to nanograms per liter)
RL: reporting limit (lowest concentration that can be reliably measured)
WWTP: municipal waste water treatment plant

Photo image area measures 2” H x 6.93” W and can be masked by a
collage strip of one, two or three images.
The photo image area is located 3.19” from left and 3.81” from top of page.
Each image used in collage should be reduced or cropped to a maximum of
2” high, stroked with a 1.5 pt white frame and positioned edge-to-edge with
accompanying images.
Mitch Kostich, Angela Batt, Susan Glassmeyer and Jim Lazorchak
Pharmaceuticals in municipal wastewater
Office of Research and DevelopmentNational Exposure Research Laboratory
Although this work was reviewed by EPA and approved for publication, it may not necessarily reflect official Agency policy.
September 24, 2014