ph of lysosomes and of the yeast vacuole · ! 1! the fab1/pikfyve phosphoinositide phosphate kinase...
TRANSCRIPT
1
The Fab1/PIKfyve Phosphoinositide Phosphate Kinase Is Not Necessary to Maintain the pH of Lysosomes and of the Yeast Vacuole Cheuk Y. Ho1,2, Christopher H. Choy1,2, Christina A. Wattson1, Danielle E. Johnson3 and Roberto J. Botelho1,2,3. 1Dept. Chemistry and Biology and 2Molecular Science Program, Ryerson University, Toronto, Ontario, M5B2K3, Canada, 3Program in Cell Biology, Hospital for Sick Children, Toronto, Ontario, Canada Running title: Lysosomal pH and Fab1/PIKfyve
4To whom correspondence should be sent: Department of Chemistry and Biology, Ryerson University, 350 Victoria Street, Toronto, ON, M5B2K3, Canada; Phone: (416) 979 5000 ext. 2059 [email protected] Keywords: Lysosome, yeast, phosphoinositides, organellar pH homeostasis, organelle, lysosome pH Background: Based on qualitative pH probes, loss of Fab1/PIKfyve was thought to impair vacuolar/lysosomal acidification. Results: Using several quantitative assays, vacuoles/lysosomes remained acidic in Fab1/PIKfyve-inhibited cells in a V-ATPase-dependent manner. Conclusion: Fab1/PIKfyve is not necessary to maintain the steady-state vacuolar/lysosomal pH. Significance: Contrary to current thought, we propose a model in which Fab1/PIKfyve is dispensable to maintain vacuolar/lysosomal acidification. Abstract Lysosomes and the yeast vacuole are degradative and acidic organelles. Phosphatidylinositol-3,5-bisphosphate [PtdIns(3,5)P2], a master architect of endolysosome and vacuole identity, is thought to be necessary for vacuolar acidification in yeast. There is also evidence that PtdIns(3,5)P2 may play a role in lysosomal acidification in higher-eukaryotes. Nevertheless, these conclusions rely on qualitative assays of lysosome/vacuole pH. For example, quinacrine, an acidotropic fluorescent base, does not accumulate in the vacuoles of fab1∆ yeast. Fab1, and its mammalian ortholog PIKfyve, is the lipid
kinase responsible for synthesizing PtdIns(3,5)P2. In this study, we employed several assays that quantitatively assessed the lysosomal and vacuolar pH in PtdIns(3,5)P2-depleted cells. Using ratiometric imaging, we conclude that lysosomes retain a pH <5 in PIKfyve-inhibited mammalian cells. In addition, quantitative fluorescence microscopy of vacuole-targeted pHluorin, a pH-sensitive GFP variant, indicates that fab1∆ vacuoles are as acidic as wild-type yeast. Importantly, we also employed fluorimetry of vacuoles loaded with cDCFDA, a pH-sensitive dye, to show that both wild-type and fab1∆ vacuoles have a pH <5.0. In comparison, the vacuolar pH of the V-ATPase mutant, vph1∆, or of vph1∆ fab1∆ double mutants was 6.1. While the steady-state vacuolar pH is not affected by PtdIns(3,5)P2 depletion, it may have a role in stabilizing the vacuolar pH during salt-shock. Overall, we propose a model in which PtdIns(3,5)P2 does not govern the steady-state pH of vacuoles or lysosomes. Introduction Lysosomes are a degradative powerhouse in cells – they are enriched in hydrolytic enzymes that digest nutrients, cellular debris and even engulfed pathogens (1, 2). In addition, numerous channel and transporter proteins are embedded in the lysosomal
http://www.jbc.org/cgi/doi/10.1074/jbc.M114.613984The latest version is at JBC Papers in Press. Published on February 20, 2015 as Manuscript M114.613984
Copyright 2015 by The American Society for Biochemistry and Molecular Biology, Inc.
by guest on February 22, 2020http://w
ww
.jbc.org/D
ownloaded from
2
membrane that control transport of small molecules like amino acids, sugars and ions into and out of the lysosome (1, 3–5). Hence, lysosome dysfunction can build up debris and impair cell metabolism leading to a variety of lysosomal storage diseases (3). The yeast vacuole is the analogue of the lysosome, serving as the main degradative, storage and detoxification compartment in yeast (6). Due to its functional similarities to the lysosome and its easy manipulation, the yeast vacuole is an excellent model system for studying lysosomal regulation and function.
Both lysosomes and vacuoles are highly acidic which is crucial for proper lysosomal/vacuolar functions. The acidic pH is required for the delivery and activation of hydrolytic enzymes in the lysosome (6, 7). In addition, the H+ electrochemical gradient across the lysosomal membrane drives the transport of amino acids, ions, and metals into and out the lysosome/vacuole lumen (5, 8, 9). This H+ gradient is achieved by the vacuolar-type H+-ATPase (V-ATPase), a highly conserved multi-subunit enzyme that pumps H+ from the cytosol into the vacuolar lumen by coupling to ATP hydrolysis. The V-ATPase consists of a peripheral (V1) complex, the site of ATP hydrolysis, and an integral (V0) complex that forms the proton pore (10–12). The mammalian Subunit a (Vph1p in yeast), a subunit of the V0 complex, is important for connecting the V1 and V0 on the membrane (12, 13). ATP hydrolysis by the V1 complex drives the rotation of the V0 complex and allow the translocation of protons across the vacuolar membrane (13–17). The V-ATPase is regulated by a number of different mechanisms, one of which is believed to be phosphatidylinositol-3,5-bisphosphate [PtdIns(3,5)P2] (18, 19). PtdIns(3,5)P2 is a low abundance phosphoinositide found mainly on the vacuolar membrane in yeast and on endolysosomes in higher-eukaryotes (18, 20, 21). PtdIns(3,5)P2 is involved in a variety of cellular functions including controlling lysosome/vacuole size, membrane recycling, and ion transport (22–25).
Deletion of genes involved in the synthesis of PtdIns(3,5)P2, including FAB1
which encodes the phosphatidylinositol-3-phosphate 5-kinase, impairs vacuolar accumulation of quinacrine, a fluorescence base that generally accumulates in acidic compartments (25–28). This led to the belief that PtdIns(3,5)P2 is required to maintain an acidic vacuolar lumen. In fact, recently, PtdIns(3,5)P2 was suggested to bind to the V0 complex to stabilize the assembly of the V-ATPase and increase its activity during salt stress (29). In contrast, the role of PtdIns(3,5)P2 in establishing acidic lysosomes in higher-eukaryotes is unclear. Some studies have suggested that acidotropic probes like acridine orange accumulate in enlarged lysosomes induced by antagonists of PIKfyve, the mammalian ortholog of Fab1 (30). Others have suggested that LysoTracker, another acidotropic agent, does not accumulate in enlarged lysosomes in PIKfyve-inhibited cells (31, 32). However, these acidotrophic dyes are not quantitative and do not provide information about the actual pH in PtdIns(3,5)P2-depleted cells.
In this study, we measured the lysosomal and vacuolar pH to better understand the role of PtdIns(3,5)P2 in lysosome/vacuolar acidification. To determine the vacuolar pH, we employed the pH-sensitive fluorescent dye, 5-(and-6)-carboxy-2´,7´-dichlorofluorescein diacetate (cDCFDA), and super-ecliptic pHluorin. cDCFDA was previously used to measure the vacuolar pH in Cryptococcus neoformans by fluorimetry (33). In addition, the super-ecliptic pHluorin, a pH-sensitive GFP variant, can be targeted to the vacuolar lumen to query the pH-status of yeast vacuoles (34). We also utilized ratiometric imaging of lysosomes labelled with FITC-dextran to quantitate the lysosomal pH (35). Using these methods, we revealed that yeast vacuoles lacking PtdIns(3,5)P2 were as acidic as wild-type cells. Similarly, both control and PIKfyve-abated mammalian cells exhibited similarly acidic lysosomes.
Experimental procedures
Media and Reagents 7-amino-4-chloromethylcoumarin (CMAC), 5-(and-6)-carboxy-2´,7´-dichlorofluorescein
by guest on February 22, 2020http://w
ww
.jbc.org/D
ownloaded from
3
diacetate (cDCFDA), FITC-dextran, LysoTracker DND-99, fetal bovine serum (FBS), HBSS and DMEM were purchased from Life Technologies (Carlsbad, CA). Quinacrine, nigericin, and monensin were purchased from Sigma-Aldrich (St. Louis, MO). Yeast media and nutrients were from Biobasic (Toronto, ON). Concanamycin A, concanavalin A and carbonyl cyanide m-chlorophenylhydrazone (CCCP) were purchased from BioShop(Burlington, ON). Apillimod was purchased from Toronto Research Chemicals. MF4 was a kind gift from Dr. Kevan Shokat (UCSF). Yeast Strains The strains used in this study are listed in Table 1. We employed the PCR-based gene deletion method described in (36), using F1 and R1 primer plasmid-specific sequences, to generate vph1∆ in the SEY6210 background. DNA for gene deletions was generated using the Phusion high-fidelity DNA polymerase (New England BioLabs). Yeast transformation was performed according to standard procedures using the lithium acetate method and homologous recombination was confirmed by PCR. Mating was used to generate fab1Δ vph1Δ in the SEY6210 background, and fab1Δ Mup1-pHluorin and vph1Δ Mup1-pHluorin. Cell Culture RAW 264.7 macrophage-like cell line was maintained in DMEM supplemented with 5% FBS (Wisent, QC) at 5% CO2 and 37°C. Vacuole Staining and Hyperosmotic Shock Yeast cultures were grown overnight in synthetic-complete (SC) media (yeast nitrogen base without nitrogen and ammonium sulfate, sodium glutamate, 2% glucose, supplemented with appropriate amino acids) to an OD600 of ~0.6. Cells were washed and re-suspended in SC media buffered to pH 7.5. Vacuoles were labelled with 200 µM quinacrine for 10 min at 26°C in 100 mM Hepes-KOH pH 7.6. Cells were washed and re-suspended in 25 µl ice-cold 100 mM Hepes-KOH pH 7.6 with 2% glucose. For CMAC staining, vacuoles were
labelled with 100 µM CMAC in the dark for 15-min at room temperature in SC media. Cells were washed and re-suspended in 25 µl SC media. For cDCFDA staining, vacuoles were labelled with 50 µM cDCFDA for 1 hour at 26°C, washed and re-suspended in SC media, pH 7.5. For osmotic shock, after cDCFDA staining, cells were exposed to 0.9 M NaCl for 10-min, followed by fluorimetric measurement immediately after and for every 5 min over a period of 25-min. Fluorimetry About 10 mL of yeast cells were continuously grown in SC media to OD600 0.6. About 2 million cells were then incubated in 100 µl of yeast calibration media (50 mM MES, 50 mM Hepes, 50 mM KCl, 50 mM NaCl, 0.2 M ammonium acetate, 10 mM NaN3, and 10 mM 2-deoxyglucose, pH 7.5) for 4-min without CCCP to obtain basal fluorescence intensity. Subsequently, individual aliquots of 2 million cells were incubated for 4 min in yeast calibration media containing 50 µM CCCP and set to pH 4.5-7.5. Fluorescence intensity was measured immediately. When necessary, cells were treated with 1 µM ConA for 1-hour before calibration. Fluorescence intensity was measured using excitation scan between 400-520 nm and emission at 535 nm with the fluorimeter (Hitachi F-2500). The samples were measured in triplicate. Importantly, this assay is independent of absolute fluorescence intensity because each sample is internally calibrated – in other words, the basal fluorescence and calibration curves for each condition are all derived from a single population of cells labelled with cDCFDA. The GraphPad Prism 6 software was used to calculate a calibration curve as a function of the measured values relative to the pH values of the calibration buffer. The data were then fitted to a sigmoidal-dose response curve for each sample. Statistical analysis is based on a minimum of three independent experiments. Microscopy Fluorescence, bright field or differential interference contrast (DIC) images of quinacrine, CMAC, and cDCFDA-labeled cells
by guest on February 22, 2020http://w
ww
.jbc.org/D
ownloaded from
4
were obtained with a DM5000X Leica epifluorescence microscope. Time-lapse imaging was captured using an Olympus IX81 quorum spinning disk microscope with the Perkin Elmer Volocity software. For ratiometric imaging, images were captured using a DM-IRB Leica epifluorescence microscope with the MetaFluor software (MDS Analytical Technologies). Fluorescence intensity of FITC-labelled lysosomes and Mup1-pHluorin-labeled vacuoles were analysed with ImageJ 1.47v. Mup1-pHluorin and imaging analysis Yeast culture were grown overnight in synthetic medium deficient in methionine to an OD600 of ~0.5. Methionine was added to the yeast culture at a concentration of 20 µg/ml, and incubated for two hour at 26°C. Cells were then washed and re-suspended in SC media buffered to pH 7.5. Cells were seeded onto concanavalin A-coated glass cover slips for microscopy or ratiometric imaging analysis. Fluorescence intensity was measured until the signal was stable and then 50 µM CCCP was added to the samples. The cells were allowed 10-min to equilibrate to media of pH 7.5. Fluorescence intensity was again measured until the signal was stable. Statistical analysis is based on 300-500 cells over a minimum of three independent experiments. Lysosomal labelling RAW cells were grown on glass cover slips in DMEM supplemented with 10% FBS and 5% CO2 at 37°C. Cells were pulsed with 2 mg/ml FITC-dextran for an hour and chased for an hour at 37°C. Cells were then treated with either 200 nM MF4, 20 nM apilimod or 1 µM concanamycin A, or an equivalent volume of DMSO for an hour. For time-lapse imaging, cells were labelled with 1 µM LysoTracker for 10-min and then 5 images were captured per second for 10 s. Live-cell images were captured in an environmental chamber at 37 °C with 5% CO2. Ratiometric analysis of mammalian lysosomal pH
Ratiometric analysis of lysosomal pH was done as reported previously (35, 37). Briefly, resting cells in calibration media (145 mM KCl, 10 mM glucose, 1 mM MgCl2, and 20 mM Hepes, pH 7.2) were imaged in a Leiden chamber maintained at 37 °C. The cells were rapidly excited by light transmitted through a 485 nm and 438 nm excitation filters from an XFO X-Cite 120 lamp. The fluorescence ratio of 485/438 nm were measured until the signal was stable. Subsequently, 10 µM nigericin and 5 µM monensin were then added to calibration media set to different pH values (7.5, 6.5, 5.5, and 4.5). For each calibration point, cells were incubated and imaged for 5 min to obtain stable 485/438 nm fluorescence ratio. When necessary, cells were treated with concanamycin A before calibration. To quantify lysosomal pH, the fluorescence intensity of 125-400 randomly-selected swollen and wild-type lysosomes in 100-300 cells was measured over three independent experiments. The Graphpad Prism 6 software was used to calculate a calibration curve as a function of the measured values relative to the pH values of the calibration buffer (the data are fitted to a Boltzmann sigmoidal-dose response curve). Phosphoinositide labeling and HPLC-coupled flow scintillation RAW cells were incubated for 24 h in inositol-free DMEM (MP Biomedical, CA) with 10 µCi/mL myo-[2-3H(N)] inositol (Perkin Elmer, MA), 10% dialyzed FBS (Gibco), 4 mM L-glutamine (Sigma Aldrich), 1x insulin-transferrin-selenium-ethanolamine (Gibco), 20 mM Hepes (Gibco), and 1x penicillin/streptomycin (Sigma Aldrich). At the end of the incubation, macrophages were treated with 20 nM apilimod for 1 h. Cells were then treated with 600 µL of 4.5% perchloric acid (v/v) on ice for 15 min, scraped, and pelleted at 12,000 x g for 10 minutes. Pellets were washed with 1 mL of ice cold 0.1 M EDTA and resuspended in 50 µL of water. Phospholipids were deacylated with 500 µL of methanol/40% methylamine/1-
by guest on February 22, 2020http://w
ww
.jbc.org/D
ownloaded from
5
butanol (45.7% methanol: 10.7% methylamine: 11.4% 1-butanol (v/v)) for 50 min at 53°C. Samples were vacuum-dried and washed twice by resuspending in 300 µL of water and drying. Dried samples were then resuspended in 450 µL of water and extracted with 300 µL of 1-butanol/ethyl ether/ethyl formate (20:4:1), vortexed for 5 min and centrifugation at 12,000 x g for 2 min. The bottom aqueous layer was collected and extracted twice more. The aqueous layer was vacuum dried and resuspended in 50 µL of water. Equal counts of 3H were separated by HPLC (Agilent Technologies, CA) through an anion exchange 4.6 x 250-mm column (Phenomenex, CA) with a flow rate of 1 mL/min and subjected to a gradient of water (buffer A) and 1 M (NH4)2HPO4, pH 3.8 (adjusted with phosphoric acid) (buffer B) as follows: 0% B for 5 min, 0 to 2% B for 15 minutes, 2% B for 80 minutes, 2 to 10% B for 20 minutes, 10% B for 30 minutes, 10 to 80% B for 10 minutes, 80% B for 5 minutes, 80 to 0% B for 5 minutes. The radiolabeled eluate was detected by β-RAM 4 (LabLogic, FL) with a 1:2 ratio of eluate to scintillant (LabLogic, FL) and analyzed by Laura 4 software. Each of the PIPs were normalized against the parent PI peak.
Statistical analysis Experimental values are given as the mean of a minimum of three independent experiments and include standard error of the mean (SEM). The population size is indicated in the text or figure legends. Comparisons between groups were made by Student’s t-test or using an ANOVA test, followed by Tukey’s post-hoc test as appropriate. Results
Lysosomes remain acidic in PIKfyve-inhibited cells Lysosomes depend on their highly acidic milieu for optimal degradative capacity and to drive molecular transport across its
membrane. Therefore, it is important to understand the mechanisms that establish and maintain lysosomal acidification. The role of PtdIns(3,5)P2 in controlling lysosomal acidification in mammalian cells remains unclear.
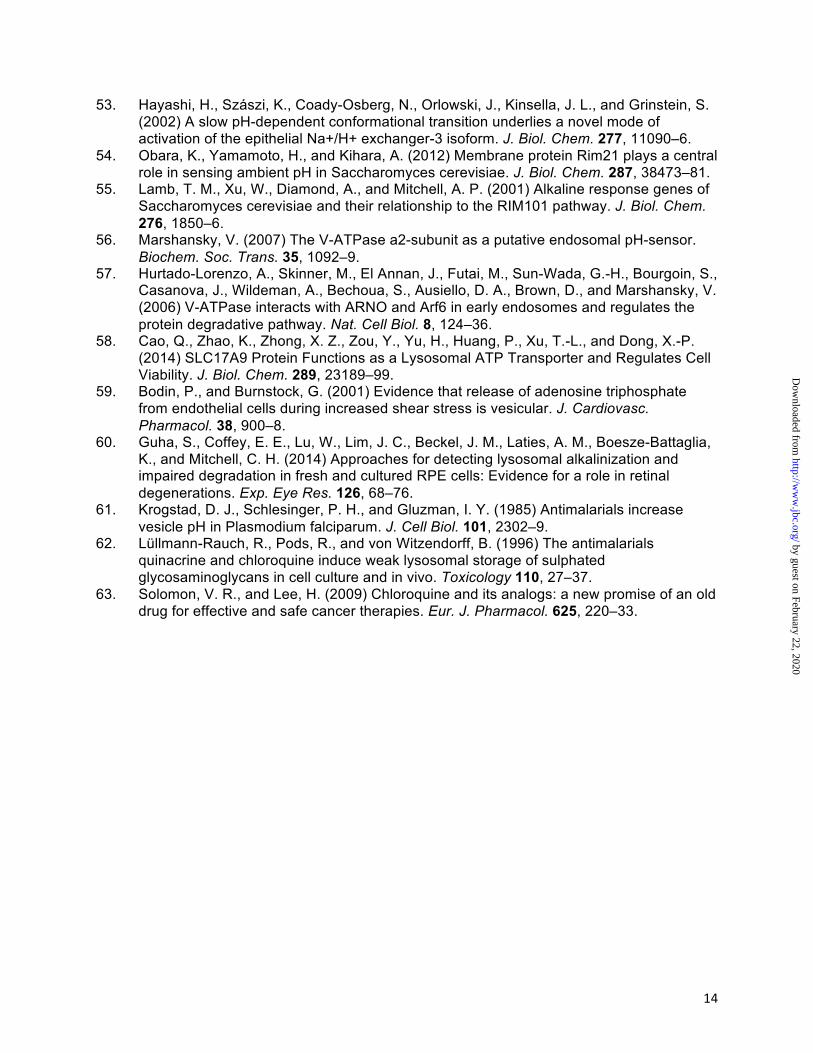
To better address this issue, we employed RAW264.7 (RAW) macrophages as a model cell line given the importance of lysosomes in eliminating pathogens. RAW macrophages were treated for 1 h with 20 nM apilimod, a potent PIKfyve antagonist (38). Importantly, we limited PIKfyve inhibition to 1 h to avoid non-specific, indirect effects of prolonged PIKfyve abatement. First, we used myo-[2-3H]-inositol labelling and HPLC-coupled flow scintillation to show that 20 nM apilimod treatment was sufficient to cause a ~80% reduction in PtdIns(3,5)P2 levels relative to control cells and a concurrent increase in PtdIns(3)P, consistent with previous work [Fig. 1A, (38)]. The loss of PtdIns(3,5)P2 coincided with extensive vacuolation as previously observed [Fig. 1B, (39)].
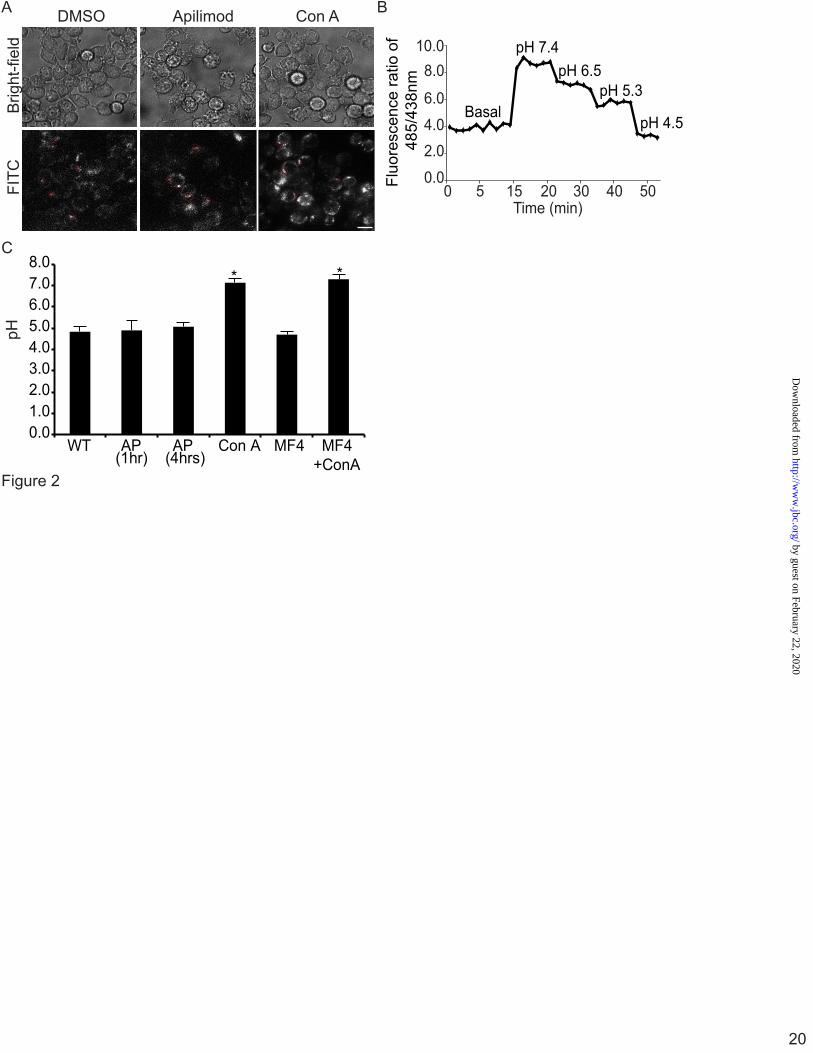
Subsequently, cells were exposed to LysoTracker to label acidic compartments. In control cells, LysoTracker labelled punctate structures (Fig. 1B; supplementary Movie 1). In contrast, LysoTracker decorated the limiting membrane of vacuoles induced by PIKfyve inhibition (Fig. 1C). In addition, LysoTracker also associated with what appeared to be intraluminal vesicles (ILVs) within the swollen lysosomes (Fig. 1C). These ILVs freely moved within the vacuoles as depicted by live-cell time-resolved imaging (Fig. 1C, arrowheads and supplementary Movie 2). Notably, swollen lysosomes were never homogenously filled with LysoTracker. We observed similar results when cells were treated with 200 nM MF4, a distinct PIKfyve antagonist [(30); data not shown]. Overall, our data suggest that swollen lysosomes in PIKfyve-inhibited cells are still acidic. Since LysoTracker provides only a qualitative indication of lysosomal pH, we used the ratiometric pH-sensitive fluorescein (FITC) fluorochrome to quantitatively measure lysosomal pH by ratiometric imaging (35). Lysosomes were labelled by pinocytosis of
by guest on February 22, 2020http://w
ww
.jbc.org/D
ownloaded from
6
FITC-labelled dextran. Since PtdIns(3,5)P2 may be involved in vesicular trafficking to lysosomes (40, 41), we first labelled lysosomes with FITC-dextran before treatment with MF4 or apilimod. Cells were then imaged and analysed by ratiometric imaging as described in materials and methods (Fig. 2A, B). Control cells had a lysosomal pH of 4.8 ± 0.2, which is consistent with prior measurements (35, 37). Notably, the lysosomal pH in macrophages treated with apilimod or MF4 for 1 h was 4.9 ± 0.4 and 4.7± 0.1, respectively (Fig. 2C), which were not significantly different from control cells. To test if prolonged loss of PtdIns(3,5)P2 disrupted lysosomal pH, we treated cells for 4 h with 20 nM apilimod. Despite the protracted drug treatment, the lysosomal pH remained acidic (5.1 ± 0.2) and comparable to control cells (Fig. 2C). In contrast, lysosomal acidification was perturbed with concanamycin A (ConA), a V-ATPase inhibitor, which increased the pH to 7.1 ± 0.2 (Fig. 2C). Importantly, ConA treatment also dissipated the lysosomal pH in RAW cells treated with PIKfyve inhibitors, suggesting that the V-ATPase was responsible for lysosome acidification in PIKfyve-hindered cells (Fig. 2C). Thus, lysosomal pH remains acidic after treatment with apilimod or MF4, indicating that PtdIns(3,5)P2 is not necessary for maintaining baseline lysosomal pH.
Mup1-pHluorin suggests that fab1∆ vacuoles are acidic We next examined the pH status of the enlarged vacuoles in fab1∆ yeast strains. We expected a defect in acidification given that past reports showed that quinacrine does not accumulate in the vacuoles of PtdIns(3,5)P2-deficient yeast (27, 28). We first employed the super-eclipitic pHluorin, a GFP variant whose fluorescence is potently quenched in low pH (34). pHluorin can be targeted to the lumen of yeast vacuoles by fusing it to Mup1 (34). Mup1 is a methionine transporter that localizes to the plasma membrane under low levels of methionine (34). However, excess extracellular methionine triggers the endocytosis of Mup1, followed by sorting into
multivesicular bodies and trafficking to the vacuole for degradation (42). Consequently, by using the Mup1-pHluorin chimera, pHluorin accumulates in the vacuole in the presence of methionine [(34); Fig. 3A].
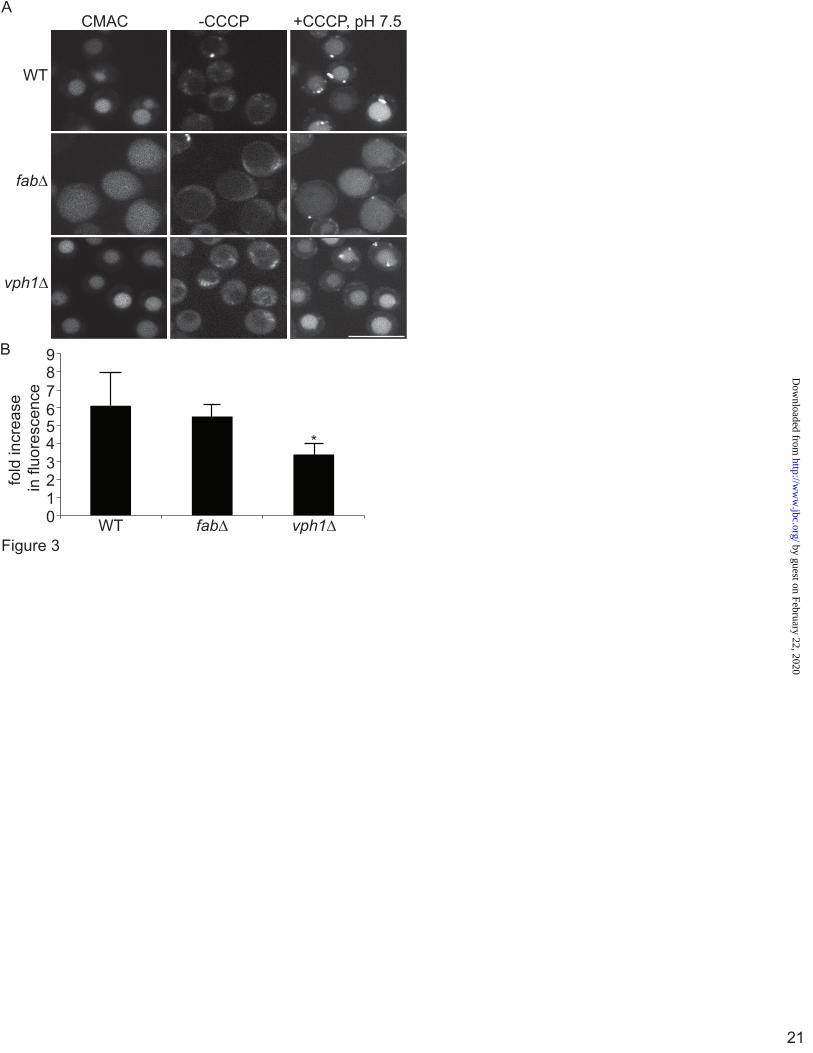
To observe the pH-status of vacuoles in PtdIns3,5P2-deficient yeast, fab1Δ Mup1-pHluorin and vph1Δ Mup1-pHluorin were generated. In wild-type, fab1∆ and vph1∆, there was dim pHluorin-associated fluorescence signal in CMAC-labelled vacuoles, suggesting that pHluorin was being quenched by acidification (Fig. 3A). To better evaluate the vacuolar pH in these strains using pHluorin, we then measured its fluorescence intensity before and after alkalinization with the proton ionophore, CCCP, in media at pH 7.5. CCCP quickly dissipates the pH gradient and forces the vacuolar pH to equilibrate to the pH of the medium (43, 44). Wild-type, fab1∆ and vph1∆ cells all exhibited an increase in the fluorescence intensity of vacuole-targeted pHluorin after alkalinization (Fig. 3A). But strikingly, when we quantified the ratio of fluorescence intensity after and before alkalinization, both wild-type and fab1Δ showed similar fold-increases in fluorescence intensity, which were not significantly different from each other (6.1± 1.9 and 5.5± 0.67, respectively). By contrast, there was only a 3.4± 0.63 fold increase in pHluorin-based fluorescence in vph1Δ vacuoles (Fig. 3B). These data convey that fab1∆ and wild-type vacuoles are similarly acidic, while vph1∆ vacuoles are more alkaline.
Accumulation of quinacrine and cDCFDA in yeast vacuoles The Mup1-pHluorin assay produced an unexpected result – that fab1∆ and wild-type vacuoles appear to be similarly acidic. To ensure that our fab1∆ strain was not altered, we stained yeast vacuoles with quinacrine. As stated previously, quinacrine is a fluorescent dye that is thought to accumulate in the vacuole upon protonation. Therefore, quinacrine is often used to report on vacuolar acidification. Previous work showed that quinacrine fails to accumulate in vacuoles in cells depleted for PtdIns(3,5)P2 (25–28).
by guest on February 22, 2020http://w
ww
.jbc.org/D
ownloaded from
7
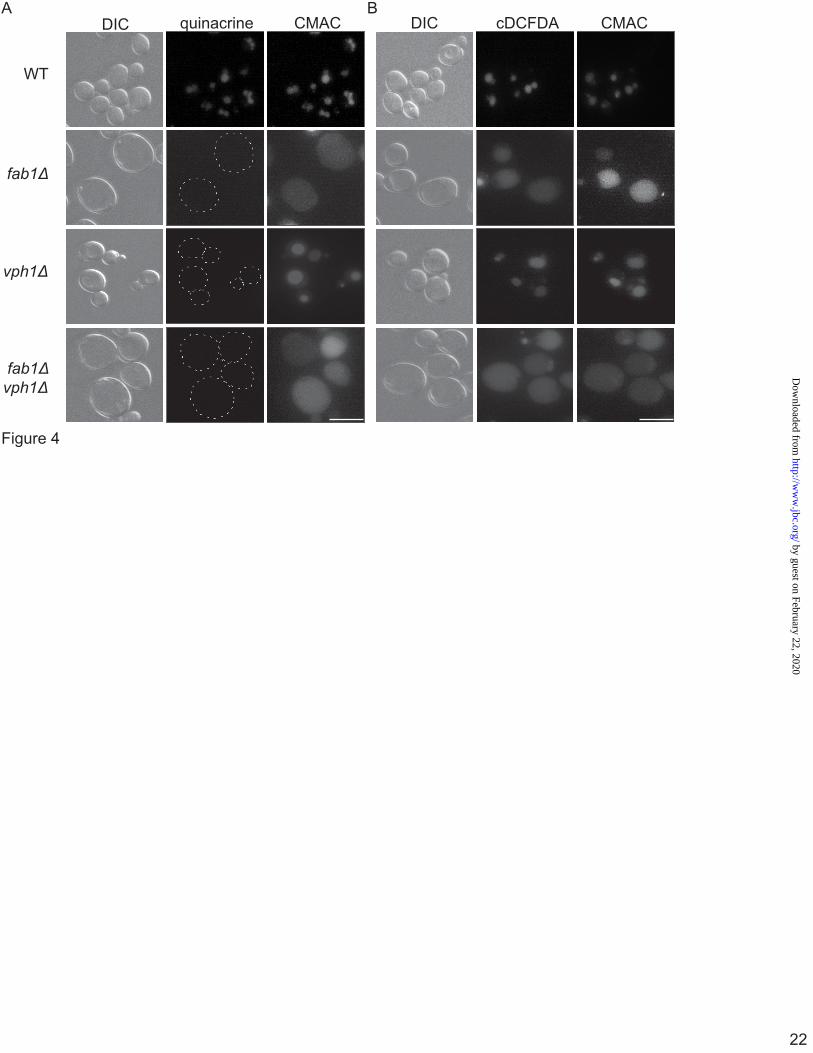
Consistent with the literature, we confirm that quinacrine failed to accumulate in vacuoles stained with CMAC, a vacuolar probe, of fab1∆, vph1Δ and of fab1∆ vph1∆ double mutants (Fig. 4A). In contrast, wild-type vacuoles, also identified by CMAC, were enriched in quinacrine (Fig. 4A).
To better understand the apparently contradictory data provided by the Mup1-pHluorin and the quinacrine assays, we employed an alternative method to quantitatively measure the vacuolar pH. The pH-sensitive fluorescent base, cDCFDA, was previously shown to accumulate in and to measure the pH of vacuoles in Cryptococcus neoformans (33). Therefore, we explored whether cDCFDA would be suitable to measure the pH of vacuoles in S. cerevisiae. Foremost, we show here that cDCFDA can accumulate in the vacuoles irrespective of apparent vacuolar acidification; cDCFDA accumulated in vacuoles identified by CMAC-staining in wild-type, fab1Δ, vph1Δ and fab1∆ vph1∆ yeast cells (Fig. 4B).
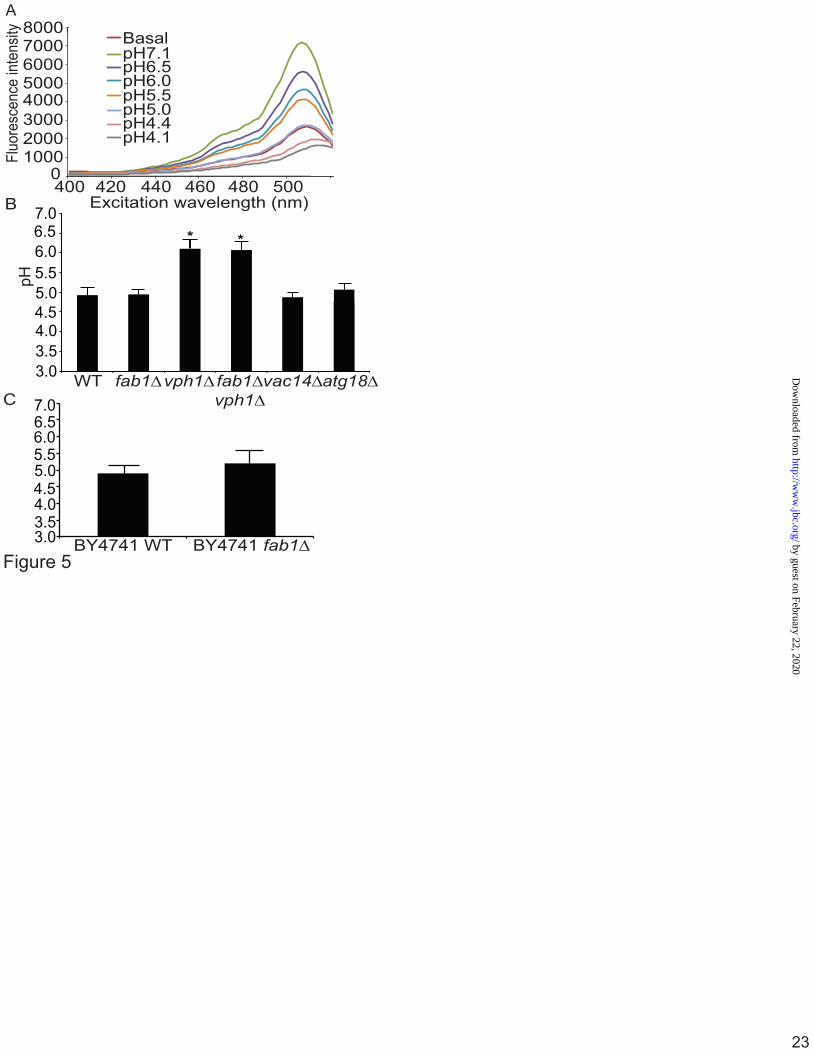
Quantitative pH assays indicate that fab1∆ vacuoles are acidic To quantify the vacuolar pH, cells were labelled with cDCFDA in SC media. From a single pool of labelled cells, an aliquot was used to measure the baseline fluorescence intensity of cDCFDA by fluorimetry in SC media at pH 7.5, recording the peak fluorescence intensity. After reading the baseline fluorescence, subsequent aliquots from the same culture were then treated with calibration buffer containing CCCP for 4 min to force the vacuolar pH to equilibrate to known media pH (pH 4 to 7) and the peak fluorescence intensity was recorded (Fig. 5A). These values were used to generate a standard curve of fluorescence intensity versus pH, which was then fit to a sigmoidal curve to extrapolate the baseline vacuolar pH for each strain. This method avoids the need for ratiometric fluorimetry since each reading is an average of millions of cells and because calibration is internally controlled for each sample, i.e., the baseline and calibration readings use the same population of cells.
Importantly, we first assessed the effect of extracellular pH on the vacuole pH measured by cDCFDA-fluorimetry by labelling cells in SC media at pH 5.5 or 7.5 for one hour. There was no observable difference in the apparent vacuolar pH in wild-type cells labelled in media at pH 5.5 or 7.5 (data not shown). Therefore, all measurements were done with cells labelled in media at pH 7.5. Strikingly, the steady-state vacuolar pH in fab1Δ cells was comparable to wild-type (pH = 4.9 ± 0.1 and 4.9 ± 0.2, respectively, Fig. 5B), while a V-ATPase mutant, vph1Δ, had a more alkalinized vacuolar pH (pH = 6.1 ± 0.2; Fig. 5B), which was significantly different from both wild-type and fab1∆ cells. Importantly, the vacuolar pH of fab1Δ vph1Δ double mutants was 6.1 ± 0.2, comparable to vph1Δ (Fig. 5B). Since our assay produced similar vacuolar pH values for both vph1∆ and fab1∆ vph1∆ strains, then this suggests that cDCFDA fluorescence is not being quenched by other factors altered in fab1∆ cells that might lead to a falsely acidic reading of fab1∆ vacuoles. Lastly, the strains that we used in this study were based on the SEY6210 genetic background. Thus, we also measured the vacuolar pH in the BY4741 background and found that there was no significant difference between wild-type and fab1Δ (pH=4.9 ± 0.2 and 5.2 ± 0.4; Fig. 5C). This suggests that the genetic background does not account for the unexpected acidic vacuoles in fab1∆ identified by our assays.
We also tested whether the vacuolar pH remained intact upon deletion of VAC14 and ATG18, two key regulators of the PtdIns(3,5)P2-pathway. In vac14∆ cells, active Fab1 protein complexes fail to assemble reducing Ptdin(3,5)P2 levels to 10% of the wild-type (27, 28, 45, 46). In comparison, atg18∆ cells exhibit a 5- to 10-fold increase in the levels of PtdIns(3,5)P2 (47). Upon measuring the vacuolar pH, we observed no significant differences in the vacuolar pH between these strains, wild-type and fab1Δ, cells (Fig. 5B). Thus, steady-state vacuolar pH seems unaffected in cells deficient in or with elevated PtdIns(3,5)P2 levels.
by guest on February 22, 2020http://w
ww
.jbc.org/D
ownloaded from
8
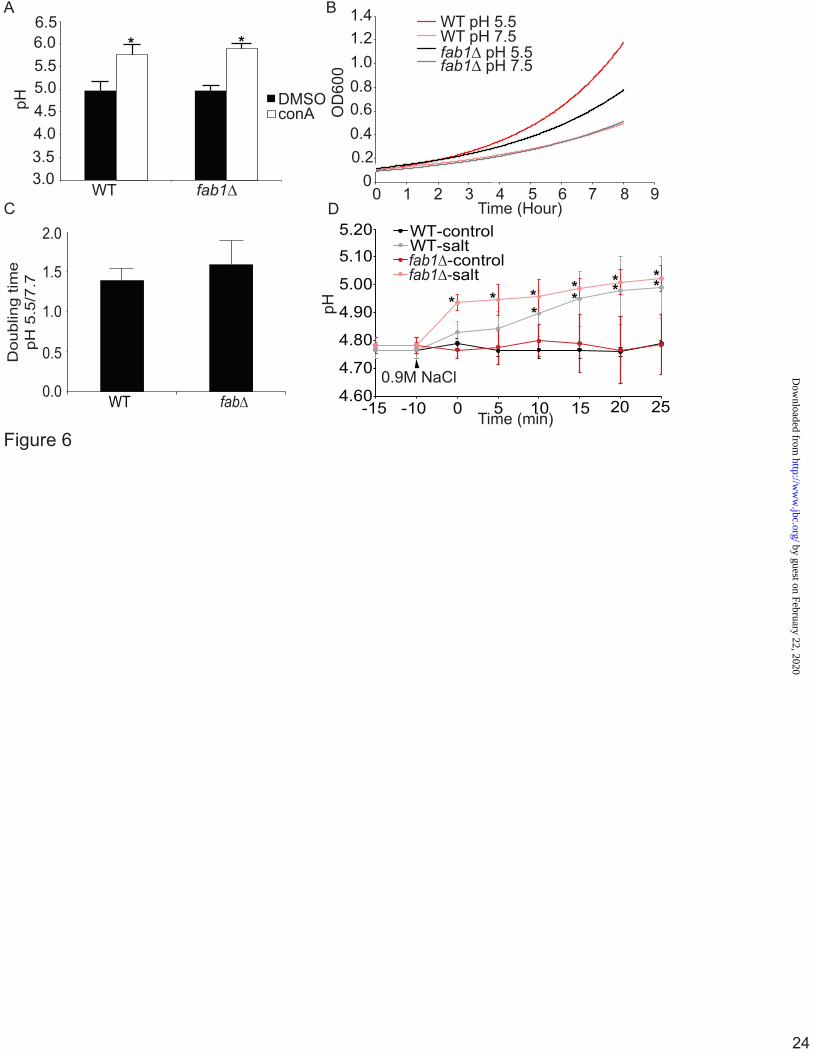
The acidification of fab1∆ vacuoles requires V-ATPase activity Our data strongly indicate that fab1∆ vacuoles are not defective in acidification. It remained possible that vacuole acidity in fab1∆ yeast was independent of V-ATPase activity. To test for this possibility we treated fab1∆ cells with ConA, a potent V-ATPase antagonist. Importantly, both wild-type and fab1Δ cells treated with ConA displayed an alkalinized vacuolar pH (pH = 5.8 ± 0.2 and 5.9 ± 0.1, respectively; Fig. 6). This is consistent with our measurements obtained for vph1 and vph1∆ fab1∆ strains. Thus, we show here that fab1∆ vacuoles undergo a V- ATPase-dependent acidification. In addition, since V-ATPase mutants cannot grown in high pH media, we also tested whether fab1∆ cells could grow in media set to pH 5 or 7. We found that both wild-type and fab1∆ cells grew less well in media at pH 7 relative to media at pH 5 (Fig. 6B). However, because fab1∆ cells grow slower than wild-type cells even at pH 5, we normalized the growth rates for both strains at pH 7 media to pH 5 media. We found that there was little difference in normalized growth rates between wild-type and fab1∆ cells (Fig. 6C). This is consistent with the reported observation that fab1∆ cells do not exhibit a vma growth defect typical of V-ATPase mutants i.e., fab1∆ cells can grow in the presence of high CaCl2 concentration and high pH (48).
Recently, it was shown that PtdIns(3,5)P2 stimulates V-ATPase assembly during hyperosmotic shock, although the authors did not measure vacuolar pH (29). Salt-shock is known to cause a 5- to 10-fold increase in PtdIns(3,5)P2 levels (20). Thus, we next tested if salt-shock might disturb the vacuolar pH and in a Fab1-dependent manner. First, we observed a mild- alkalinisation of the vacuoles in both wild-type and fab1∆ cells exposed to 0.9 M NaCl over a period of 25 min (Fig. 6D). Interestingly, this alkalinisation was not significant until 10 min post-salt shock in wild-type cells (Fig. 6D). By contrast, fab1∆ cells suffered a greater rate of alkalinisation induced by salt-shock, becoming significantly different immediately after the hyperosmotic stress (Fig. 6D). Thus,
it appears that salt-shock can disturb the vacuole pH and that PtdIns(3,5)P2-deficient cells are more prone to this than wild-type cells. This is supportive of the notion that PtdIns(3,5)P2 may play a role in stabilizing the V-ATPase during salt-shock, as previously suggested (29). Overall, using several quantitative assays, we report here that PIKfyve and Fab1 inactivation does not cause a defect in the steady-state pH of lysosomes and yeast vacuoles, respectively. This conclusion suggests that the role of PtdIns(3,5)P2 in vacuolar acidification is more nuanced than previously thought.
Discussion Depletion of PtdIns(3,5)P2 has been thought to alkalinise the yeast vacuole, and in some instances, to alkalinize lysosomes in higher-eukaryotes (26, 29, 32, 41, 49). However, these studies employed qualitative assays that did not probe the actual pH of the yeast vacuole and of lysosomes. In contrast, we provide quantitative evidence that suggests that the luminal pH of mammalian lysosomes and of the yeast vacuole remains acidic in PtdIns(3,5)P2-depleted cells.
The lysosomal pH in PIKfyve-inhibited mammalian cells Up to this point, the requirement for PIKfyve in maintaining the acidic lumen of lysosomes in higher-eukaryotes has remained unclear. For instance, there was no apparent difference in acridine orange accumulation between control and MF4-treated mammalian cells (30). In contrast, others have suggested that cells treated with YM201636, another PIKfyve inhibitor, had reduced LysoTracker accumulation in swollen lysosomes (31).
Here, we show that LysoTracker does indeed decorate swollen lysosomes, indicating that they are still acidic. However, LysoTracker fluorescence was not present throughout the lumen of the swollen lysosomes, as might be expected. Instead, LysoTracker adhered to ILVs within and with the limiting membrane of swollen lysosomes. Others have reported this LysoTracker behaviour in PIKfyve-hindered cells but
by guest on February 22, 2020http://w
ww
.jbc.org/D
ownloaded from

9
interpreted this as a defect in acidification (31). Moreover, Hazeki et al. depicted LysoTracker labelling of the limiting membrane of swollen lysosomes in PIKfyve-inhibited RAW cells, though they did not emphasize this (50). While we cannot rule out that this LysoTracker behaviour is specific to PIKfyve-inhibited cells, we speculate that LysoTracker also adheres to ILVs and to the limiting membrane of lysosomes in control cells, but this is not resolvable because “normal” lysosomes are diffraction-limited when observed by light microscopy. We also speculate that because LysoTracker does not decorate the luminal space of swollen lysosomes, this may have led to mis-interpretation about the acidic state of lysosomes in PIKfyve-inhibited cells. Either way, acidotropic dyes like LysoTracker and acridine orange, do not quantitatively assess pH. To resolve this caveat, we employed ratiometric imaging, which provides accurate and absolute pH values. Thus, using ratiometric imaging, we conclusively show that lysosomes in control and PIKfyve-hindered cells retain a pH 4.8-4.9.
Overall, our results best support a model in which PIKfyve does not play a direct role in maintaining the acidic pH of mammalian lysosomes. Nevertheless, there are a few caveats in our study. First, it remains possible that chronic loss of PIKfyve (as in a knockout) may indirectly lead to less acidic lysosomes. However, given that lysosomes remained acidic even after 4 h of PIKfyve-inhibition, this may be unlikely. Second, drug-treated mammalian cells retain small levels of PtdIns(3,5)P2 that may suffice to maintain acidic lysosomes. Yet, at these small levels of PtdIns(3,5)P2 many other defects are observed including lysosome swelling, phagosome maturation arrest, cytokine production defects and trafficking inhibition (38, 39, 51). Third, we do not exclude the possibility that extremely enlarged lysosomes may be more prone to alkalinisation, as suggested before (31). Lastly, our observations may not apply to all mammalian cells or eukaryotic models.
The vacuolar pH in fab1∆ yeast cells
Yeast vacuoles depleted of PtdIns(3,5)P2 fail to accumulate quinacrine (25–27). This led to the conclusion that these vacuoles are not acidic. However, our data suggest otherwise. First, we targeted the super-ecliptic pHluorin to the lumen of vacuoles. Both the wild-type and fab1∆ vacuoles displayed dim pHluorin-associated fluorescence after the addition of methionine. Strikingly, forced equilibration of the vacuole to pH 7.5 caused a similar large increase in fluorescence signal in control and fab1∆ vacuoles. This suggests that fab1∆ vacuoles were as acidic as wild-type cells. In contrast, vph1∆ cells exhibited a lower increase in pHluorin fluorescence, consistent with a more alkaline vacuolar pH in these cells. Second, we employed cDCFDA-based fluorimetry to measure the vacuolar pH in S. cerevisiae by modifying a method used to quantify the vacuolar pH in Cryptococucs neoformans (33). Consistent with the Mup1-pHluorin assay, the vacuolar pH of wild-type and fab1∆ cells was indistinguishable at pH 4.9. In addition, different levels of PtdIns(3,5)P2 present in fab1∆, vac14∆, and atg18∆ showed no effect on vacuolar pH.
The validity of these results is supported by two key observations: i) cDCFDA reported a pH above 6 for both vph1∆ and fab1∆ vph1∆ double mutants, making it unlikely that cDCFDA is reporting the behaviour of another factor, like Ca+2, that might be altered in fab1∆ vacuoles and that might mask an alkaline vacuolar pH and ii) both wild-type and fab1∆ vacuoles became alkaline after V-ATPase inhibition. This result is also consistent with the fact that fab1∆ cells do not exhibit a vma phenotype, defined by the inability of V-ATPase mutants (vma) to grow in media with high CaCl2 and high pH (48). Overall, we present our data as evidence that fab1∆ vacuoles are as acidic as wild-type cells.
Recent elegant work indicates that PtdIns(3,5)P2 binds to the V-ATPase and helps to stabilize the V1-V0 assembly in vitro and in vivo (29). In addition, PtdIns(3,5)P2 appears to stimulate the ATPase activity of the V-ATPase using in vitro assays (29). However, it is important to note that the authors did not measure the actual pH of the
by guest on February 22, 2020http://w
ww
.jbc.org/D
ownloaded from
10
vacuoles. While seemingly contradictory, we believe these observations are not mutually exclusive with our data. First, we speculate that the vacuolar membrane is equipped with a pH-sensing protein that adjusts H+ efflux to offset reduced H+ influx if indeed the V-ATPase is less active in the absence of PtdIns(3,5)P2. While the identity of such a sensor in the lysosomal/vacuolar membrane is not known, there are examples of pH-sensing proteins in other systems; the activity of NHE3, an epithelial sodium/proton exchanger, is responsive to cytosolic pH (52, 53); Rim21 appears to sense external pH to modulate the Rim101 pathway, responsible for yeast adaptation to environmental pH (54, 55); even the V-ATPase may sense luminal endosomal pH to control Arf6 and ARNO membrane recruitment (56, 57). Second, a dearth of PtdIns(3,5)P2 may down-regulate specific channel and/or transporter activity that might reduce H+ efflux; as a precedent, PtdIns(3,5)P2 gates TRPML1, a lysosomal Ca+2 channel (24). Third, PtdIns(3,5)P2 may still control V-ATPase activity in response to a specific stimuli but be dispensable for steady-state conditions (29). Indeed, fab1∆ cells appeared to alkalinise more quickly than wild-type cells upon salt-shock, consistent with this notion (Fig. 6D).
Lastly, despite an acidic vacuolar pH, quinacrine does not accumulate in fab1∆ vacuoles. There are at least two possibilities
that might explain why quinacrine does not decorate fab1∆ vacuoles. First, quinacrine may require an unknown PtdIns(3,5)P2-dependent factor to enter or stay in the vacuole. For instance, quinacrine is known to bind ATP and other nucleotides and has been used to label ATP-rich vesicles (58, 59). Second, both quinacrine and chloroquine are weak bases that have been used to treat malaria, and in fact, chloroquine is often used to dissipate lysosomal pH (60–63). Based on this, we speculate that fab1∆ vacuoles may be more sensitive to quinacrine-mediated alkalinization than wild-type vacuoles, perhaps mimicking other stress conditions like hyperosmotic shock.
Summary Overall, the work presented here makes use of potent quantitative tools including ratiometric imaging, fluorimetry and quantitative fluorescence microscopy to show that mammalian lysosomes and yeast vacuoles retain a pH <5.0 in cells depleted for PtdIns(3,5)P2, and that this is indistinguishable from control cells. We also show that this is dependent on the V-ATPase. We argue that PtdIns(3,5)P2 has no role in maintaining a steady-state acidic pH in lysosomes/vacuoles, contrary to present thought.
by guest on February 22, 2020http://w
ww
.jbc.org/D
ownloaded from
11
References 1. Luzio, J. P., Pryor, P. R., and Bright, N. A. (2007) Lysosomes: fusion and function. Nat.
Rev. Mol. Cell Biol. 8, 622–32. 2. Eskelinen, E., and Saftig, P. (2009) Autophagy: a lysosomal degradation pathway with a
central role in health and disease. Biochim. Biophys. Acta. 1793, 664–73. 3. Schneider, L., and Zhang, J. (2010) Lysosomal function in macromolecular homeostasis
and bioenergetics in Parkinson ’ s disease. Mol. Neurodegeration 5, 1–13. 4. Ruivo, R., Anne, C., Sagné, C., and Gasnier, B. (2009) Molecular and cellular basis of
lysosomal transmembrane protein dysfunction. Biochim. Biophys. Acta 1793, 636–49. 5. Kiselyov, K., Colletti, G., and Terwilliger, A. (2011) TRPML: transporters of metals in
lysosomes essential for cell survival? Cell Calcium 50, 288–294. 6. Li, S. C., and Kane, P. M. (2010) The yeast lysosome-like vacuole: Endpoint and
crosscroads. Biochim Biophs Acta. 1793, 650–663. 7. Klionsky, D. J., Nelson, H., and Nelson, N. (1992) Compartment acidification is required
for efficient sorting of proteins to the vacuole in Saccharomyces cerevisiae. J. Biol. Chem. 267, 3416–22.
8. Miseta, A., Kellermayer, R., Aiello, D. P., Fu, L., and Bedwell, D. M. (1999) The vacuolar Ca2+/H+ exchanger Vcx1p/Hum1p tightly controls cytosolic Ca2+ levels in S. cerevisiae. FEBS Lett. 451, 132–6.
9. Russnak, R., Konczal, D., and McIntire, S. L. (2001) A family of yeast proteins mediating bidirectional vacuolar amino acid transport. J. Biol. Chem. 276, 23849–57.
10. Ho, M. N., Hirata, R., Umemoto, N., Ohya, Y., Takatsuki, a, Stevens, T. H., and Anraku, Y. (1993) VMA13 encodes a 54-kDa vacuolar H(+)-ATPase subunit required for activity but not assembly of the enzyme complex in Saccharomyces cerevisiae. J. Biol. Chem. 268, 18286–92.
11. Zhang, J., Myers, M., and Forgac, M. (1992) Characterization of the V0 domain of the coated vesicle (H+)-ATPase. J. Biol. Chem. 267, 9773–8.
12. Manolson, M. F., Proteau, D., Preston, R. A., Stenbit, A., Roberts, B. T., Hoyt, M. A., Preuss, D., Mulholland, J., Botstein, D., and Jones, E. W. (1992) The VPH1 gene encodes a 95-kDa integral membrane polypeptide required for in vivo assembly and activity of the yeast vacuolar H(+)-ATPase. J. Biol. Chem. 267, 14294–303.
13. Leng, X.H. and Manolson, M. F. (1998) Function of the COOH-terminal Domain of Vph1p in Activity and Assembly of the Yeast V-ATPase. J. Biol. Chem. 273, 6717–6723.
14. Forgac, M. (1999) Structure and properties of the vacuolar (H+)-ATPases. J. Biol. Chem. 274, 12951–12954.
15. Graham, L., Powell, B., and Stevens, T. (2000) Composition and assembly of the yeast vacuolar H (+)-ATPase complex. J. Exp. Med. 203, 61–70.
16. Tanabe, M., Nishio, K., Iko, Y., Sambongi, Y., Iwamoto-Kihara, A., Wada, Y., and Futai, M. (2001) Rotation of a complex of the gamma subunit and c ring of Escherichia coli ATP synthase. The rotor and stator are interchangeable. J. Biol. Chem. 276, 15269–74.
17. Vik, S. B., and Antonio, B. J. (1994) A mechanism of proton translocation by F1F0 ATP synthases suggested by double mutants of the a subunit. J. Biol. Chem. 269, 30364–9.
18. Ho, C. Y., Alghamdi, T. A., and Botelho, R. J. (2012) Phosphatidylinositol-3,5-bisphosphate: no longer the poor PIP2. Traffic 13, 1–8.
19. McCartney, A. J., Zhang, Y., and Weisman, L. S. (2014) Phosphatidylinositol 3,5-bisphosphate: low abundance, high significance. Bioessays 36, 52–64.
20. Dove, S. K., Cooke, F. T., Douglas, M. R., Sayers, L. G., Parker, P. J., and Michell, R. H. (1997) Osmotic stress activates phosphatidylinositol-3,5-bisphosphate synthesis. Nature 390, 187–92.
by guest on February 22, 2020http://w
ww
.jbc.org/D
ownloaded from
12
21. Ikonomov, O. C., Sbrissa, D., and Shisheva, A. (2001) Mammalian cell morphology and endocytic membrane homeostasis require enzymatically active phosphoinositide 5-kinase PIKfyve. J. Biol. Chem. 276, 26141–7.
22. Cooke, F. T., Dove, S. K., McEwen, R. K., Painter, G., Holmes, A. B., Hall, M. N., Michell, R. H., and Parker, P. J. (1998) The stress-activated phosphatidylinositol 3-phosphate 5-kinase Fab1p is essential for vacuole function in S. cerevisiae. Curr. Biol. 8, 1219–22.
23. Ikonomov, O. C., Sbrissa, D., Dondapati, R., and Shisheva, A. (2007) ArPIKfyve-PIKfyve interaction and role in insulin-regulated GLUT4 translocation and glucose transport in 3T3-L1 adipocytes. Exp. Cell Res. 313, 2404–16.
24. Dong, X., Shen, D., Wang, X., Dawson, T., Li, X., Zhang, Q., Cheng, X., Zhang, Y., Weisman, L. S., Delling, M., and Xu, H. (2010) PI(3,5)P(2) controls membrane trafficking by direct activation of mucolipin Ca(2+) release channels in the endolysosome. Nat. Commun. 1, 38.
25. Gary, J. D., Wurmser, A. E., Bonangelino, C. J., Weisman, L. S., and Emr, S. D. (1998) Fab1p is essential for PtdIns(3)P 5-kinase activity and the maintenance of vacuolar size and membrane homeostasis. J. Cell Biol. 143, 65–79.
26. Bonangelino, C. J., Catlett, N. L., and Weisman, L. S. (1997) Vac7p, a novel vacuolar protein, is required for normal vacuole inheritance and morphology. Mol. Cell. Biol. 17, 6847–58.
27. Bonangelino, C. J., Nau, J. J., Duex, J. E., Brinkman, M., Wurmser, A. E., Gary, J. D., Emr, S. D., and Weisman, L. S. (2002) Osmotic stress-induced increase of phosphatidylinositol 3,5-bisphosphate requires Vac14p, an activator of the lipid kinase Fab1p. J. Cell Biol. 156, 1015–28.
28. Dove, S. K., McEwen, R. K., Mayes, A., Hughes, D. C., Beggs, J. D., and Michell, R. H. (2002) Vac14 controls PtdIns(3,5)P(2) synthesis and Fab1-dependent protein trafficking to the multivesicular body. Curr. Biol. 12, 885–93.
29. Li, S. C., Diakov, T. T., Xu, T., Tarsio, M., Zhu, W., Couoh-Cardel, S., Weisman, L. S., and Kane, P. M. (2014) The signaling lipid PI(3,5)P2 stabilizes V1-Vo sector interactions and activates the V-ATPase. Mol. Biol. Cell 25, 1251–62.
30. De Lartigue, J., Polson, H., Feldman, M., Shokat, K., Tooze, S. A., Urbé, S., and Clague, M. J. (2009) PIKfyve regulation of endosome-linked pathways. Traffic 10, 883–93.
31. Jefferies, H. B. J., Cooke, F. T., Jat, P., Boucheron, C., Koizumi, T., Hayakawa, M., Kaizawa, H., Ohishi, T., Workman, P., Waterfield, M. D., and Parker, P. J. (2008) A selective PIKfyve inhibitor blocks PtdIns(3,5)P(2) production and disrupts endomembrane transport and retroviral budding. EMBO Rep. 9, 164–70.
32. Nicot, A.-S., Fares, H., Payrastre, B., Chisholm, A. D., Labouesse, M., and Laporte, J. (2006) The phosphoinositide kinase PIKfyve/Fab1p regulates terminal lysosome maturation in Caenorhabditis elegans. Mol. Biol. Cell 17, 3062–3074
33. Harrison, T., and Chen, J. (2002) Determination of the pH of the Cryptococcus neoformans vacuole. Med. Myc. 40, 329–32.
34. Prosser, D. C., Whitworth, K., and Wendland, B. (2011) Quantitative analysis of endocytosis with cytolasmic pHluorin chimeras. Traffic 11, 1141–1150
35. Steinberg, B. E., Huynh, K. K., Brodovitch, A., Jabs, S., Stauber, T., Jentsch, T. J., and Grinstein, S. (2010) A cation counterflux supports lysosomal acidification. J. Cell Biol. 189, 1171–86.
36. Longtine, M. S., McKenzie, A., Demarini, D. J., Shah, N. G., Wach, A., Brachat, A., Philippsen, P., and Pringle, J. R. (1998) Additional modules for versatile and economical PCR-based gene deletion and modification in Saccharomyces cerevisiae. Yeast 14, 953–61.
37. Botelho, R. J., Hackam, D. J., Schreiber, A. D., and Grinstein, S. (2000) Role of COPI in phagosome maturation. J. Biol. Chem. 275, 15717–27.
by guest on February 22, 2020http://w
ww
.jbc.org/D
ownloaded from
13
38. Cai, X., Xu, Y., Cheung, A. K., Tomlinson, R. C., Alcázar-Román, A., Murphy, L., Billich, A., Zhang, B., Feng, Y., Klumpp, M., Rondeau, J.-M., Fazal, A. N., Wilson, C. J., Myer, V., Joberty, G., Bouwmeester, T., Labow, M. A., Finan, P. M., Porter, J. A., Ploegh, H. L., Baird, D., De Camilli, P., Tallarico, J. A., and Huang, Q. (2013) PIKfyve, a class III PI kinase, is the target of the small molecular IL-12/IL-23 inhibitor apilimod and a player in Toll-like receptor signaling. Chem. Biol. 20, 912–21.
39. Kim, G. H. E., Dayam, R. M., Prashar, A., Terebiznik, M., and Botelho, R. J. (2014) PIKfyve inhibition interferes with phagosome and endosome maturation in macrophages. Traffic, 15,1143-63.
40. Ikonomov, O. C., Sbrissa, D., Foti, M., Carpentier, J.-L., and Shisheva, A. (2003) PIKfyve controls fluid phase endocytosis but not recycling/degradation of endocytosed receptors or sorting of procathepsin D by regulating multivesicular body morphogenesis. Mol. Biol. Cell 14, 4581–91.
41. Rusten, T. E., Rodahl, L. M. W., Pattni, K., Englund, C., Samakovlis, C., Dove, S., Brech, A., and Stenmark, H. (2006) Fab1 phosphatidylinositol 3-phosphate 5-kinase controls trafficking but not silencing of endocytosed receptors. Mol. Biol. Cell 17, 3989–4001
42. Menant, A., Barbey, R., and Thomas, D. (2006) Substrate-mediated remodeling of methionine transport by multiple ubiquitin-dependent mechanisms in yeast cells. EMBO J. 25, 4436–47.
43. Kasianowicz, J., Benz, R., and McLaughlin, S. (1984) The kinetic mechanism by which CCCP (carbonyl cyanide m-chlorophenylhydrazone) transports protons across membranes. J. Membr. Biol. 82, 179–90.
44. Benz, R., and McLaughlin, S. (1983) The molecular mechanism of action of the proton ionophore FCCP (carbonylcyanide p-trifluoromethoxyphenylhydrazone). Biophys. J. 41, 381–98.
45. Botelho, R. J., Efe, J. A., Teis, D., and Emr, S. D. (2008) Assembly of a Fab1 phosphoinositide kinase signaling complex requires the Fig4 phosphoinositide phosphatase. Mol. Biol. Cell 19, 4273–4286
46. Alghamdi, T. A., Ho, C. Y., Mrakovic, A., Taylor, D., Mao, D., and Botelho, R. J. (2013) Vac14 protein multimerization is a prerequisite step for Fab1 protein complex assembly and function. J. Biol. Chem. 288, 9363–9372
47. Dove, S. K., Piper, R. C., McEwen, R. K., Yu, J. W., King, M. C., Hughes, D. C., Thuring, J., Holmes, A. B., Cooke, F. T., Michell, R. H., Parker, P. J., and Lemmon, M. A. (2004) Svp1p defines a family of phosphatidylinositol 3,5-bisphosphate effectors. EMBO J. 23, 1922–33.
48. Sambade, M., Alba, M., Smardon, A. M., West, R. W., and Kane, P. M. (2005) A genomic screen for yeast vacuolar membrane ATPase mutants. Genetics 170, 1539–1551.
49. Jefferies, H. B. J., Cooke, F. T., Jat, P., Boucheron, C., Koizumi, T., Hayakawa, M., Kaizawa, H., Ohishi, T., Workman, P., Waterfield, M. D., and Parker, P. J. (2008) A selective PIKfyve inhibitor blocks PtdIns(3,5)P(2) production and disrupts endomembrane transport and retroviral budding. EMBO Rep. 9, 164–70.
50. Hazeki, K., Uehara, M., Nigorikawa, K., and Hazeki, O. (2013) PIKfyve Regulates the Endosomal Localization of CpG Oligodeoxynucleotides to Elicit TLR9-Dependent Cellular Responses. PLoS One 8
51. Cai, X., Xu, Y., Kim, Y.-M., Loureiro, J., and Huang, Q. (2014) PIKfyve, a class III lipid kinase, is required for TLR-induced type I IFN production via modulation of ATF3. J. Immunol. 192, 3383–9.
52. Babich, V., Vadnagara, K., and Di Sole, F. (2013) The biophysical and molecular basis of intracellular pH sensing by Na+/H+ exchanger-3. FASEB J. 27, 4646–58.
by guest on February 22, 2020http://w
ww
.jbc.org/D
ownloaded from
14
53. Hayashi, H., Szászi, K., Coady-Osberg, N., Orlowski, J., Kinsella, J. L., and Grinstein, S. (2002) A slow pH-dependent conformational transition underlies a novel mode of activation of the epithelial Na+/H+ exchanger-3 isoform. J. Biol. Chem. 277, 11090–6.
54. Obara, K., Yamamoto, H., and Kihara, A. (2012) Membrane protein Rim21 plays a central role in sensing ambient pH in Saccharomyces cerevisiae. J. Biol. Chem. 287, 38473–81.
55. Lamb, T. M., Xu, W., Diamond, A., and Mitchell, A. P. (2001) Alkaline response genes of Saccharomyces cerevisiae and their relationship to the RIM101 pathway. J. Biol. Chem. 276, 1850–6.
56. Marshansky, V. (2007) The V-ATPase a2-subunit as a putative endosomal pH-sensor. Biochem. Soc. Trans. 35, 1092–9.
57. Hurtado-Lorenzo, A., Skinner, M., El Annan, J., Futai, M., Sun-Wada, G.-H., Bourgoin, S., Casanova, J., Wildeman, A., Bechoua, S., Ausiello, D. A., Brown, D., and Marshansky, V. (2006) V-ATPase interacts with ARNO and Arf6 in early endosomes and regulates the protein degradative pathway. Nat. Cell Biol. 8, 124–36.
58. Cao, Q., Zhao, K., Zhong, X. Z., Zou, Y., Yu, H., Huang, P., Xu, T.-L., and Dong, X.-P. (2014) SLC17A9 Protein Functions as a Lysosomal ATP Transporter and Regulates Cell Viability. J. Biol. Chem. 289, 23189–99.
59. Bodin, P., and Burnstock, G. (2001) Evidence that release of adenosine triphosphate from endothelial cells during increased shear stress is vesicular. J. Cardiovasc. Pharmacol. 38, 900–8.
60. Guha, S., Coffey, E. E., Lu, W., Lim, J. C., Beckel, J. M., Laties, A. M., Boesze-Battaglia, K., and Mitchell, C. H. (2014) Approaches for detecting lysosomal alkalinization and impaired degradation in fresh and cultured RPE cells: Evidence for a role in retinal degenerations. Exp. Eye Res. 126, 68–76.
61. Krogstad, D. J., Schlesinger, P. H., and Gluzman, I. Y. (1985) Antimalarials increase vesicle pH in Plasmodium falciparum. J. Cell Biol. 101, 2302–9.
62. Lüllmann-Rauch, R., Pods, R., and von Witzendorff, B. (1996) The antimalarials quinacrine and chloroquine induce weak lysosomal storage of sulphated glycosaminoglycans in cell culture and in vivo. Toxicology 110, 27–37.
63. Solomon, V. R., and Lee, H. (2009) Chloroquine and its analogs: a new promise of an old drug for effective and safe cancer therapies. Eur. J. Pharmacol. 625, 220–33.
by guest on February 22, 2020http://w
ww
.jbc.org/D
ownloaded from

15
Footnotes We thank Dr. Kevan Shokat (UCSF, CA) for kindly providing MF4. We thank Dr. Brenda Andrews (University of Toronto, Toronto, Canada) for providing BY4741 wild-type and fab1∆ strains, Dr. Beverly Wendland (John Hopkins University, MD) for kindly providing the Mup1-pHluorin::KanX yeast strain and Dr. Scott Emr (Cornell University, NY) for fab1∆, vac14∆ and atg18∆ strains. We also would like to thank Dr. Sergio Grinstein (Hospital for Sick Children, Toronto) for kindly giving access to the ratiometric imaging system in his lab. This research was supported by a grant from the Natural Sciences and Engineering Research Council of Canada to R.J.B. C.Y.H. was supported by a graduate scholarship from the Ontario Government. Abbreviations used: 5-(and-6)-carboxy-2´,7´-dichlorofluorescein diacetate (cDCFDA); carbonyl cyanide m-chlorophenylhydrazone (CCCP); concanamycin A (ConA); intraluminal vesicles (ILVs); phosphatidylinositol-3,5-bisphosphate [PtdIns(3,5)P2]; standard error of the mean (SEM); vacuolar-type H+-ATPase (V-ATPase);
by guest on February 22, 2020http://w
ww
.jbc.org/D
ownloaded from
16
Figure legends
Figure 1. LysoTracker decorates the limiting membrane and intraluminar vesicles in swollen lysosomes induced by PIKfyve inhibition. A, Levels of PtdIns, PtdIns(3)P and PtdIns(3,5)P2 from [3H]-myo-inositol-labeled cells after treatment with vector (DMSO) or 20 nM apilimod for 1 h. Levels are relative to PtdIns and normalized to vector-treated cells. B and C, RAW cells were treated with vector alone (B, DMSO) or with 20 nM apilimod (C) for 1-hour, followed by labelling with LysoTracker for 10-min. Live-cells were then imaged at 5-frames per sec for 10 seconds by Spinning Disc Confocal Microscopy. Each illustrated frame is 1-sec apart, showing a 5-second sequence. Arrowheads point to a LysoTracker-positive lysosome (B) or to a moving ILV in apilimod-treated cells (C). Please see also the supplementary Movie S1 and Movie S2. Scale bar is 5 µm. Figure 2. Ratiometric imaging shows that lysosomes are acidic in PIKfyve-inhibited cells by ratiometric imaging. A, Lysosomes in RAW cells were labelled with FITC-dextran for one hour and chased for one hour. Cells were then treated with vector alone (DMSO), 20 nM apilimod (AP) to inhibit PIKfyve for 1 h or 4 h, or treated with 1 µM concanamycin A (ConA). Shown are corresponding bright field images for each treatment (top) and representative images of FITC-dextran labelled lysosomes (bottom). Note that images are composed of 2x2 binned pixels for increased signal intensity for ratiometric imaging. Randomized individual lysosomes were then selected using regions of interest (red dashed circles). B, for each condition, one field of cells was imaged live to acquire baseline FITC-dextran fluorescence, followed by addition of monensin and nigericin in high potassium media of known pH ranging from pH 7.4 to pH 4.5. This generated a calibration curve to convert fluorescence values to pH values. C, the lysosomal pH in RAW cells was calculated from cells treated with DMSO (based on n=362 lysosomes), AP 1 h (n=412 lysosomes), AP 4 h (n=125 lysosomes) or concanamycin A (n=355 lysosomes). Values are means and SEM from a minimum of three different experiments. Using ANOVA and Tukey’s post-hoc test, we could show that the lysosomal pH in DMSO, apilimod- and MF4-treated cells were not statistically different, while * indicates a statistical significant difference between ConA-treated cells versus samples not treated with ConA (p<0.01). Figure 3. Vacuole-targeted pHluorin suggests that fab1∆ vacuoles are acidic. A, Wild-type (WT), fab1Δ, and vph1Δ yeast cells carrying a genomic copy of Mup1-pHluorin were grown in the presence of methionine and stained with CMAC to label vacuoles. Cells were then mounted on concanavalin-coated slides and imaged live by spinning disc confocal microscopy before and after the addition of CCCP, a proton ionophore, in media set to pH 7.5. Scale bar = 10 µm. B, to measure changes in pHluorin intensity, images were obtained using epifluorescence ratiometric imaging. Regions of interest were then drawn over vacuoles to obtain the fluorescence intensity of pHluorin before and after CCCP addition. Fluorescence intensities were then background corrected and the fluorescence ratio after and before CCCP addition was calculated. Shown is the mean plus SEM for wild-type (5 experiments with a total of 514 vacuoles), fab1Δ (5 experiments with a total of 372 vacuoles), and vph1Δ (3 experiments with a total of 324 vacuoles). Using ANOVA and Tukey’s post-hoc test, we could show that there was no statistical difference between wild-type and fab1∆ cells, but there was a significant difference between vph1∆ cells against control or fab1∆ cells (p<0.01 for wild-type and p<0.05 for fab1Δ).
by guest on February 22, 2020http://w
ww
.jbc.org/D
ownloaded from
17
Figure 4. Vacuolar accumulation of quinacrine and cDCFDA. The vacuoles of wild-type, fab1Δ, vph1Δ, and fab1Δ vph1Δ double mutant yeast cells were labelled with CMAC and with either 200 µM quinacrine for 10-min (A) or with 50 µM cDCFDA for 1-hour (B). A, dashed lines outline cells with little to no quinacrine signal. Corresponding DIC images are also shown. Live-cell imaging was done with an epifluorescence microscope (scale bar = 10µm). Figure 5. Quantification of vacuolar pH using cDCFDA-based fluorimetry. A, a representative fluorimetry scan using wild-type yeast cells loaded with cDCFDA. Fluorescence intensity scan was obtained for resting yeast cells (basal), followed by fluorescence intensity scans of cells from the same labelled population but whose vacuolar pH was equilibrated to the indicated pH by incubating with CCCP for 4-min. B, peak intensities from calibration scans as shown in A were then used to generate calibration curves using a sigmoidal fit for the indicated strains to identify the basal pH. Using this method, we calculated the mean vacuolar pH and SEM for wild-type (n = 10, where each n is one independent experiment), fab1Δ (n=10), vph1Δ (n=3), fab1Δ vph1Δ double mutants (n=3), vac14Δ (n=3), and for atg18Δ (n=3). Using ANOVA and Tukey’s post-hoc test, there was a significant different (*) for vph1∆ and vph1∆ fab1∆ against wild-type, fab1∆, vac14Δ, and atg18Δ (p<0.01) but not between wild-type, fab1∆, vac14Δ, and atg18Δ cells. C, the vacuolar pH for wild-type (n=4) and fab1Δ (n=3) in the BY4741 background strain. There was no significant difference between these strains and those from the SEY6210 using Student’s t-test. Figure 6. Basal vacuolar acidification in PtdIns(3,5)P2-deficient cells is dependent on V-ATPase activity. A, the vacuolar pH for cells labelled with cDCFDA and treated with 1 µM ConA or vector alone (DMSO) for 1-hour. For each condition, three different independent experiments performed. The mean and SEM are shown. Using Student’s t-test, there was a significant difference (*) between control (DMSO) and ConA-treated cells for either wild-type or fab1∆ cells (p<0.01). B, overnight cultures grown in normal SC media were cut back to OD600 0.15 in SC media set to pH 5.5 or 7.5. Cells were then incubated at 26 °C and the OD600 measured each hour, up to 8 hours. Shown is a representative growth trace. C, the ratio between doubling time of cells grown at pH 5.5 versus 7.5 from two independent experiments, each with three replicates. There was no significant difference in this ratio between wild-type and fab1∆ cells. D, the calibrated vacuolar pH for wild-type (n=3) and fab1Δ (n=3) before (-15 and -10 min) and after 10-min exposure to 0.9M NaCl (0 min), followed by pH measurements over 25-min in 5-min intervals. Using two-way ANOVA and Tukey’s post-hoc test, there was a significant change (*) relative to resting pH (-15, -10 min) in the vacuolar pH in fab1∆ starting at 0-min and for wild-type 10-min after salt exposure (p<0.05).
by guest on February 22, 2020http://w
ww
.jbc.org/D
ownloaded from

18
Tables TABLE 1 S. cerevisiae strains employed in this study Strain Name Genotype Source SEY6210 MATα his3-Δ200 trp1-Δ901 leu2-3 ura3-52 lys2-801 suc2-Δ9 S. Emr SEY6211 MATa leu2-3,112 ura3-52 his3-Δ200 trp1-Δ901 ade2-101 suc2-Δ9 S. Emr fab1Δ2 SEY6210; fab1Δ::HIS3 S. Emr SRY13 SEY6210; atg18::HIS3 S. Emr JGY145 SEY6210; vac14Δ::TRP1 S. Emr SHY4 SEY6210; vph1Δ::TRP1 This study SHY1 SEY6210; fab1Δ::HIS3 vph1Δ::TRP1 This study BWY3818 SEY6210; Mup1-pHluorin::KAN B. Wendland SHY2 SEY6210; fab1Δ::HIS3 Mup1-pHluorin::KAN This study SHY3 SEY6210; vph1Δ::TRP1 Mup1-pHluorin::KAN This study BY4741 MATa his3∆1 leu2∆0 met15∆0 ura3∆0 B. Andrews BY4741 fab1Δ Mat a fab1Δ::Kan his3Δ1 leu2Δ0 ura3Δ0 met15Δ0 B. Andrews
by guest on February 22, 2020http://w
ww
.jbc.org/D
ownloaded from
DM
SOAp
ilimod
Figure 1
B
C
1s 2s 3s 4s 5s
19
020406080
100120140160
PtdIns PtdIns(3)P PtdIns(3,5)P2
Inos
itol L
ipid
s (%
of c
ontro
l)
DMSOApilimod
A by guest on February 22, 2020
http://ww
w.jbc.org/
Dow
nloaded from
Brig
ht-fi
eld
AFI
TCDMSO Apilimod
Time (min)
Basal
pH 7.4pH 6.5
pH 5.3
pH 4.5
8.010.0
6.04.02.00.0
50 15 20 30 40 50
B
Fluo
resc
ence
ratio
of
485/
438n
m
Con A
20
C
pH
0.01.02.03.04.05.06.07.08.0
WT AP(1hr)
AP(4hrs)
Con A MF4 MF4 +ConA
* *
Figure 2
by guest on February 22, 2020http://w
ww
.jbc.org/D
ownloaded from
ACMAC -CCCP
WT
fab∆
vph1∆
+CCCP, pH 7.5
B
vph1∆fab∆WT
9876543210
fold
incr
ease
in
fluo
resc
ence
*
Figure 3
21
by guest on February 22, 2020http://w
ww
.jbc.org/D
ownloaded from
WT
fab1Δ
vph1Δ
fab1Δvph1Δ
DIC quinacrine CMAC DIC cDCFDA CMAC
Figure 4
A B
22
by guest on February 22, 2020http://w
ww
.jbc.org/D
ownloaded from
A
pH7.1pH6.5pH6.0pH5.5pH5.0pH4.4pH4.1
BasalFl
uore
scen
ce in
tens
ity
Excitation wavelength (nm)
80007000600050004000300020001000
0400 420 440 460 480 500
pH
B
WT fab1∆vph1∆ fab1∆vph1∆
vac14∆
6.57.0
6.05.55.04.54.03.53.0
7.06.56.05.55.04.54.03.53.0
* *
atg18∆
BY4741 WT BY4741 fab1∆
C
Figure 5
23
by guest on February 22, 2020http://w
ww
.jbc.org/D
ownloaded from
pH
WT
6.56.05.55.04.54.03.53.0
DMSOconA
fab1∆
* *
A
4.60
4.70
4.80
4.90
5.00
5.105.20
-15 -10 0 5 10 15 20 25
WT-controlWT-saltfab1∆-controlfab1∆-salt
B
C
pH
Time (min)
0
0.2
0.4
0.6
0.8
1
1.2
1.4
0 1 2 3 4 5 6 7 8 9
WT pH 5.5WT pH 7.5fab1∆ pH 5.5fab1∆ pH 7.5
OD
600
Time (Hour)0 1 2 3 4 5 6 7 8 9
00.20.40.60.81.01.21.4
D
WT fab∆
Dou
blin
g tim
e pH
5.5
/7.7
0.0
0.5
1.0
1.5
2.0
* * * * ** * *
Figure 6
0.9M NaCl
* *
24
by guest on February 22, 2020http://w
ww
.jbc.org/D
ownloaded from
J. BotelhoCheuk Y. Ho, Christopher H. Choy, Christina A. Wattson, Danielle E. Johnson and Roberto
pH of lysosomes and of the yeast vacuoleThe fab1/PIKfyve phosphoinositide phosphate kinase is not necessary to maintain the
published online February 20, 2015J. Biol. Chem.
10.1074/jbc.M114.613984Access the most updated version of this article at doi:
Alerts:
When a correction for this article is posted•
When this article is cited•
to choose from all of JBC's e-mail alertsClick here
Supplemental material:
http://www.jbc.org/content/suppl/2015/02/20/M114.613984.DC1
by guest on February 22, 2020http://w
ww
.jbc.org/D
ownloaded from