pfe_cha
DESCRIPTION
etatTRANSCRIPT

Date29-Dec-89 42.2500 - 31-Dec-90 34.3750 3.00 -11.54% #VALUE!31-Dec-91 28.8750 1.60 -11.35% #VALUE!31-Dec-92 32.2500 1.40 16.54%31-Dec-93 54.8750 0.80 72.64%30-Dec-94 42.1250 0.80 -21.78%29-Dec-95 52.8750 1.10 28.13%31-Dec-96 55.7500 1.60 8.46%31-Dec-97 60.7500 5.59 19.00%31-Dec-98 71.5625 2.00 21.09%31-Dec-99 72.6875 14.15 21.34%
14.25% #VALUE!
0.0638 #VALUE!
25.25% #VALUE!
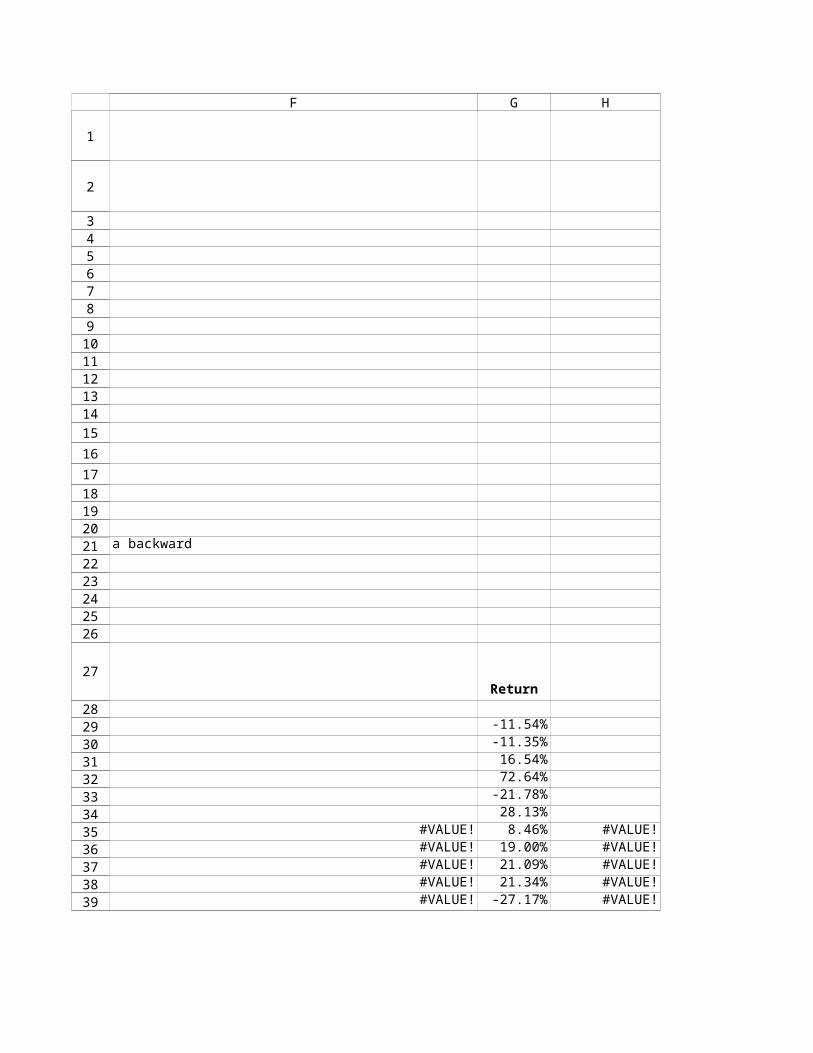
Ignore the material below unless you want to know how to make a backwardadjustment of prices for dividends.
Date Adjusted price29-Dec-89 42.2500 - 23.32 31-Dec-90 34.3750 3.00 37.38 20.63 31-Dec-91 28.8750 1.60 30.48 18.29 31-Dec-92 32.2500 1.40 33.65 21.31 31-Dec-93 54.8750 0.80 55.68 36.80 30-Dec-94 42.1250 0.80 42.93 28.78 29-Dec-95 52.8750 1.10 53.98 36.88 31-Dec-96 55.7500 1.60 57.35 40.00 31-Dec-97 60.7500 5.59 66.34 47.60 31-Dec-98 71.5625 2.00 73.56 57.64 31-Dec-99 72.6875 14.15 86.84 69.94 29-Dec-00 50.9375 2.00 52.94 50.94
PRICE AND DIVIDEND DATA FOR GENERAL MOTORS (GM)
Closing Price Dividend
Annual return
Average return, E(rGM)
Variance of return, s2GM
Standard deviation of return, sGM
Closing Price
Dividend Cash
Amount
Price plus
dividend
A B C D E
1
2
3456789
1011121314
15
16
17
181920212223242526
27
282930313233343536373839
Return
-11.54%-11.35%16.54%72.64%
-21.78%28.13%
#VALUE! 8.46% #VALUE!#VALUE! 19.00% #VALUE!#VALUE! 21.09% #VALUE!#VALUE! 21.34% #VALUE!#VALUE! -27.17% #VALUE!
F G H
1
2
3456789
1011121314
15
16
17
181920212223242526
27
282930313233343536373839

Date29-Dec-89 87.000031-Dec-90 75.2500 2.0 for 131-Dec-91 111.2500 1.5 for 131-Dec-92 85.3750 1.5 for 131-Dec-93 80.6250 no30-Dec-94 61.1250 2.0 for 129-Dec-95 87.7500 no31-Dec-96 82.6250 2.0 for 131-Dec-97 129.2500 no31-Dec-98 138.6875 2.0 for 131-Dec-99 116.7500 2.0 for 1
Date29-Dec-89 87.0000 1 87.00 31-Dec-90 75.2500 2.0 for 1 2 150.50 72.99%31-Dec-91 111.2500 1.5 for 1 3 333.75 121.76%31-Dec-92 85.3750 1.5 for 1 4.5 384.19 15.11%31-Dec-93 80.6250 no 4.5 362.81 -5.56%30-Dec-94 61.1250 2.0 for 1 9 550.13 51.63%29-Dec-95 87.7500 no 9 789.75 43.56%31-Dec-96 82.6250 2.0 for 1 18 1,487.25 88.32%31-Dec-97 129.2500 no 18 2,326.50 56.43%31-Dec-98 138.6875 2.0 for 1 36 4,992.75 114.60%31-Dec-99 116.7500 2.0 for 1 72 8,406.00 68.36%
62.72%
14.43%
37.99%
PRICE AND STOCK SPLIT
DATA FOR MICROSOFT (MSFT)
Closing Price
Stock split
during year?
Closing Price
Stock split
during year?
Cumulativeadjustment
factorAdjusted
priceAnnualreturn
Average return, E(rMSFT)
Variance of return, s2MSFT
Standard deviation of return, sMSFT
The cumulative adjustment factor is the product of all the splits:72 = 2*1.5*1.5*2*2*2*2
A B C D E F
1
2
3456789
101112131415
16
171819202122232425262728
29
30
31
3233

#VALUE!#VALUE!
#VALUE!
#VALUE!
#VALUE!
G
1
2
3456789
101112131415
16
171819202122232425262728
29
30
31
3233

Date29-Dec-89 1.208331-Dec-90 2.0903 73.00% #VALUE!31-Dec-91 4.6354 121.76% #VALUE!31-Dec-92 5.3359 15.11% #VALUE!31-Dec-93 5.0391 -5.56% #VALUE!30-Dec-94 7.6406 51.63% #VALUE!29-Dec-95 10.9688 43.56% #VALUE!31-Dec-96 20.6562 88.32% #VALUE!31-Dec-97 32.3125 56.43% #VALUE!31-Dec-98 69.3438 114.60% #VALUE!31-Dec-99 116.7500 68.36% #VALUE!
62.72% #VALUE!
14.43% #VALUE!
37.99% #VALUE!
DOWNLOADED GM PRICE DATA, YAHOO
Date Close29-Dec-89 21.731-Dec-90 19 -12.44% -11.54%31-Dec-91 16.47 -13.32% -11.35%31-Dec-92 19.12 16.09% 16.54%31-Dec-93 33.15 73.38% 72.64%30-Dec-94 25.86 -21.99% -21.78%29-Dec-95 33.28 28.69% 28.13%31-Dec-96 36.16 8.65% 8.46%31-Dec-97 43.17 19.39% 19.00%31-Dec-98 52.37 21.31% 21.09%31-Dec-99 66.05 26.12% 21.34%
Note: The reason the Yahoo computed returnsare different from the ones computed in the textis that the text assumes (wrongly--Yahoo is right)that dividends are paid and reinvested at the end of the year.
DOWNLOADED ADJUSTED DATA FROM YAHOOFOR MICROSOFT
MSFT adjusted
price
Average return, E(rMSFT)
Variance of return, s2MSFT
Standard deviation of return, sMSFT
return in text
A B C D
1
2
3456789
1011121314
15
16
17
1819
20
212223242526272829303132333435363738

GM AND MSFT, ANNUAL RETURN DATA
Date31-Dec-90 -11.54% 72.99%31-Dec-91 -11.35% 121.76%31-Dec-92 16.54% 15.11%31-Dec-93 72.64% -5.56%30-Dec-94 -21.78% 51.63%29-Dec-95 28.13% 43.56%31-Dec-96 8.46% 88.32%31-Dec-97 19.00% 56.43%31-Dec-98 21.09% 114.60%31-Dec-99 21.34% 68.36%
14.25% 62.72%
6.38% 14.43%
25.25% 37.99%
-0.0552
-0.5755-0.5755
GM return
MSFT return
Average return, E(rGM) and E(rMSFT)
Variance of return, s2GM and s2
MSFT
Standard deviation of return, sGM and sMSFT
Covariance of returns, Cov(rGM,rMSFT)
Correlation of returns, rGM,MSFT
A B C
1
2
3456789
10111213
14
15
16
17
18
19

GM AND MSFT, ANNUAL RETURN DATA
#VALUE!
#VALUE!#VALUE!
D
1
2
3456789
10111213
14
15
16
17
18
19
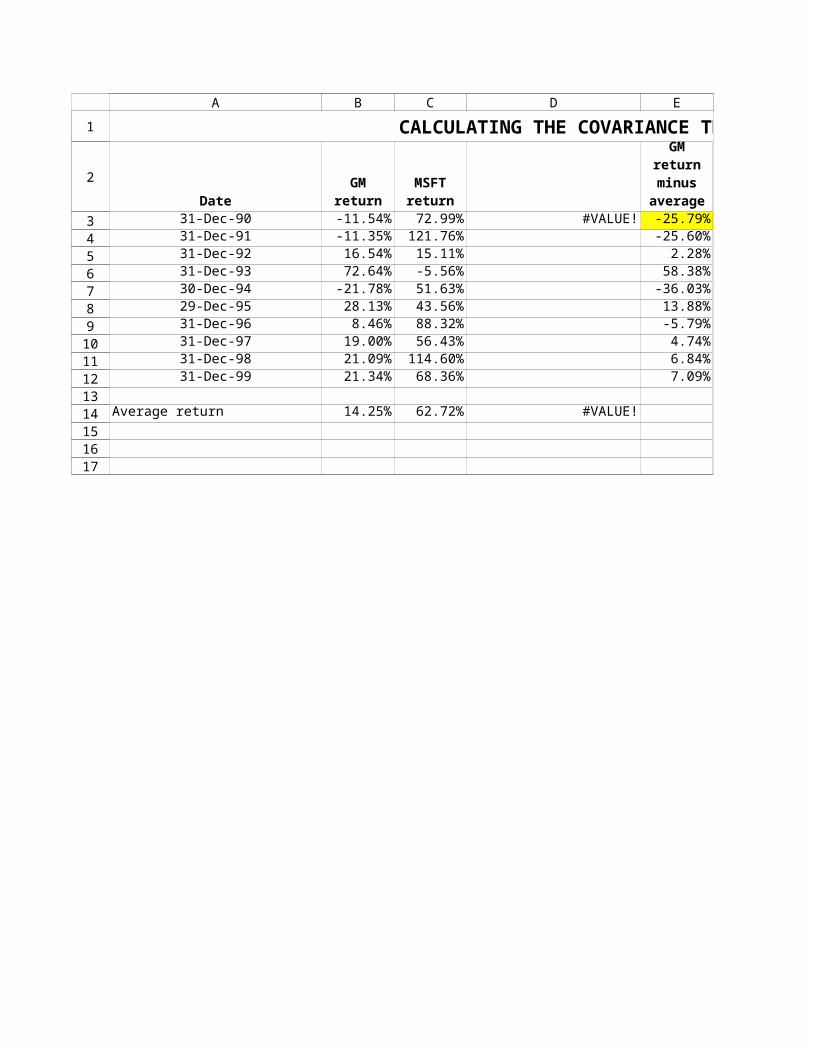
CALCULATING THE COVARIANCE THE LONG TEDIOUS WAY
Date31-Dec-90 -11.54% 72.99% #VALUE! -25.79%31-Dec-91 -11.35% 121.76% -25.60%31-Dec-92 16.54% 15.11% 2.28%31-Dec-93 72.64% -5.56% 58.38%30-Dec-94 -21.78% 51.63% -36.03%29-Dec-95 28.13% 43.56% 13.88%31-Dec-96 8.46% 88.32% -5.79%31-Dec-97 19.00% 56.43% 4.74%31-Dec-98 21.09% 114.60% 6.84%31-Dec-99 21.34% 68.36% 7.09%
Average return 14.25% 62.72% #VALUE!
GM return
MSFT return
GM returnminus
average
A B C D E
1
2
3456789
1011121314151617
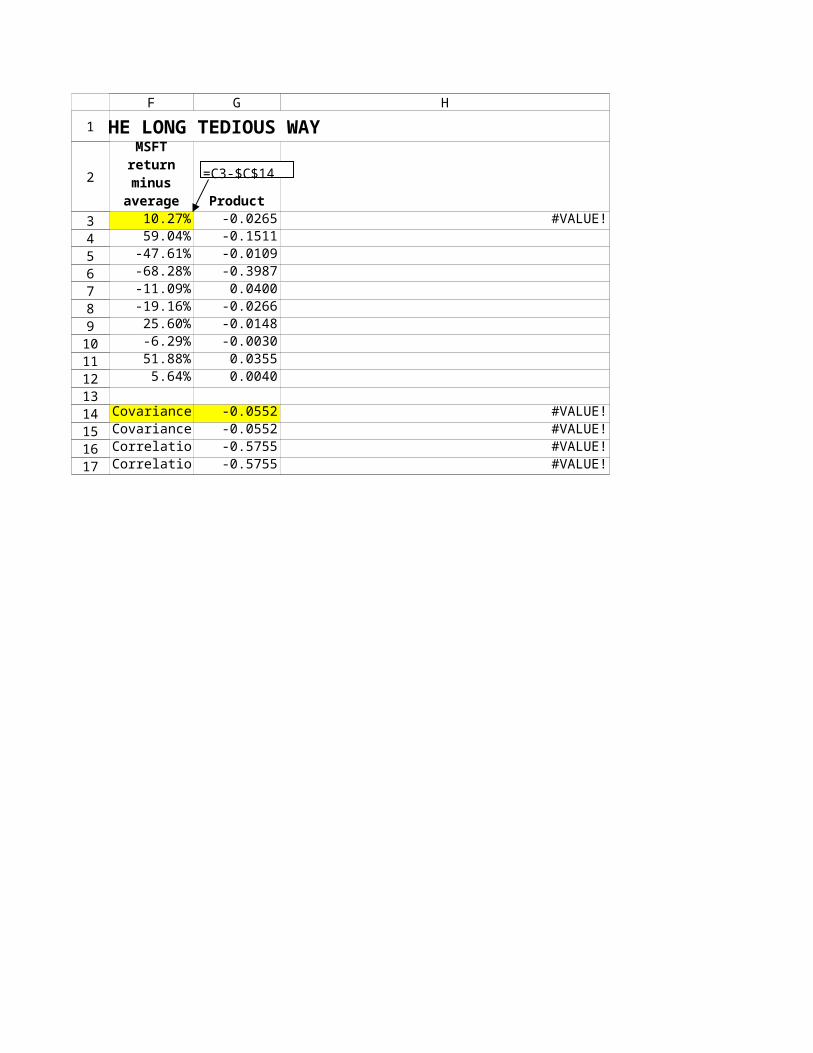
CALCULATING THE COVARIANCE THE LONG TEDIOUS WAY
Product10.27% -0.0265 #VALUE!59.04% -0.1511
-47.61% -0.0109-68.28% -0.3987-11.09% 0.0400-19.16% -0.026625.60% -0.0148-6.29% -0.003051.88% 0.0355
5.64% 0.0040
Covariance -0.0552 #VALUE!Covariance -0.0552 #VALUE!Correlation -0.5755 #VALUE!Correlation -0.5755 #VALUE!
MSFT returnminus
average
=C3-$C$14
F G H
1
2
3456789
1011121314151617

Date29-Dec-8931-Dec-90 -11.54 72.9931-Dec-91 -11.35 121.7631-Dec-92 16.54 15.1131-Dec-93 72.64 -5.5630-Dec-94 -21.78 51.6329-Dec-95 28.13 43.5631-Dec-96 8.46 88.3231-Dec-97 19.00 56.4331-Dec-98 21.09 114.6031-Dec-99 21.34 68.36
14.25 62.72
637.80 1442.92
25.25 37.99
-552.10 #VALUE!
-0.5755 #VALUE!-0.5755 #VALUE!
-0.5755 #VALUE!
GM AND MSFT, ANNUAL RETURN DATAPercentages presented as whole numbers
GM annual return
MSFT annualreturn
Average return, E(rGM) and E(rMSFT)
Variance of return, s2GM and s2
MSFT
Standard deviation of return, sGM and sMSFT
Covariance of returns, Cov(rGM,rMSFT)
Correlation of returns, rGM,MSFT
Correlation is symmetric, rMSFT,GM
A B C D
1
2
3456789
1011121314
15
16
17
18
19
2021
22

Year1990 30.73% 21.44% #VALUE!1991 55.21% 36.13%1992 15.82% 12.49%1993 33.54% 23.12%1994 14.93% 11.96%1995 35.84% 24.50%1996 48.39% 32.03%1997 37.71% 25.63%1998 67.85% 43.71%1999 44.85% 29.91%
Correlation 1.00 #VALUE!
CORRELATION +1Adams Farm and Morgan Sausage Stocks
rMorgan Sausage,t = 3% + 0.6*rAdams Farm,t
AdamsFarm stock
return
MorganSausage
stockreturn
10% 20% 30% 40% 50% 60% 70%0%
5%
10%
15%
20%
25%
30%
35%
40%
45%
50%
Annual Stock Returns, Adams Farm and Morgan Sausage
Adams Farm
Mo
rga
n S
au
sa
ge
A B C D
1
2
3456789
1011121314151617181920212223242526272829303132

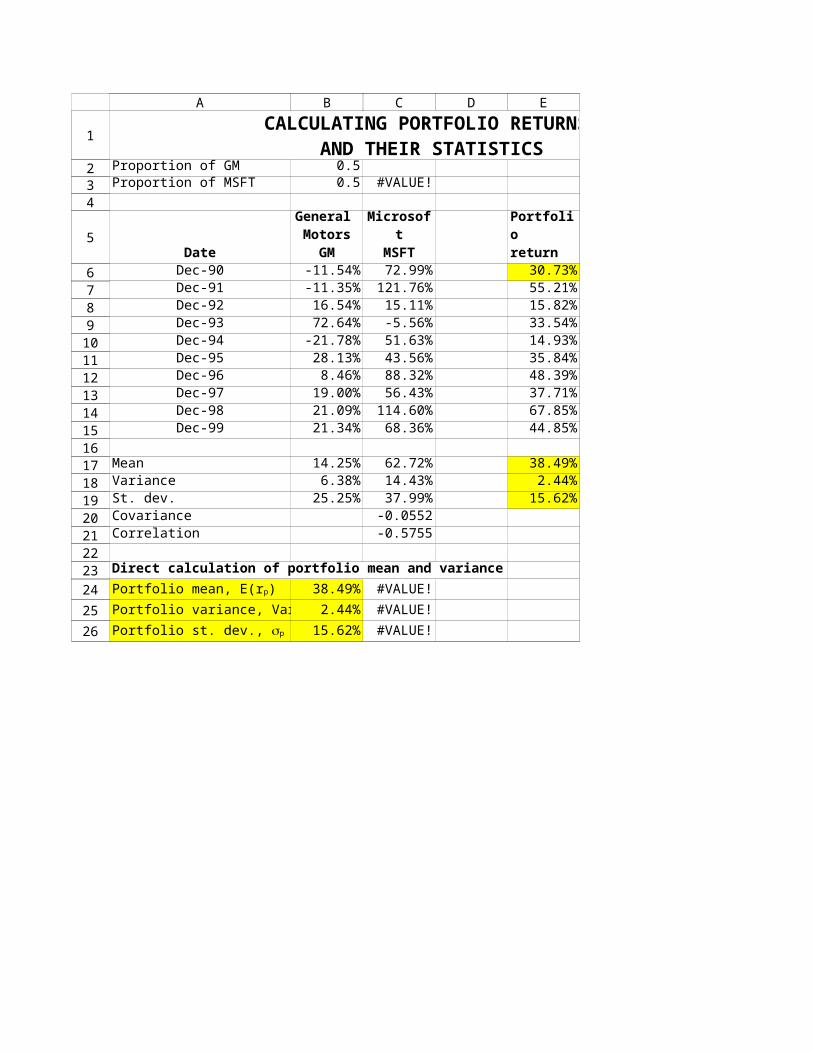
Proportion of GM 0.5Proportion of MSFT 0.5 #VALUE!
DateDec-90 -11.54% 72.99% 30.73% #VALUE!Dec-91 -11.35% 121.76% 55.21%Dec-92 16.54% 15.11% 15.82%Dec-93 72.64% -5.56% 33.54%Dec-94 -21.78% 51.63% 14.93%Dec-95 28.13% 43.56% 35.84%Dec-96 8.46% 88.32% 48.39%Dec-97 19.00% 56.43% 37.71%Dec-98 21.09% 114.60% 67.85%Dec-99 21.34% 68.36% 44.85%
Mean 14.25% 62.72% 38.49% #VALUE!Variance 6.38% 14.43% 2.44% #VALUE!St. dev. 25.25% 37.99% 15.62% #VALUE!Covariance -0.0552Correlation -0.5755
Direct calculation of portfolio mean and variance
38.49% #VALUE!
2.44% #VALUE!
15.62% #VALUE!
CALCULATING PORTFOLIO RETURNS AND THEIR STATISTICS
General Motors
GMMicrosoft
MSFTPortfolioreturn
Portfolio mean, E(rp)
Portfolio variance, Var(rp)
Portfolio st. dev., sp
A B C D E F
1
234
5
6789
1011121314151617181920212223
24
25
26
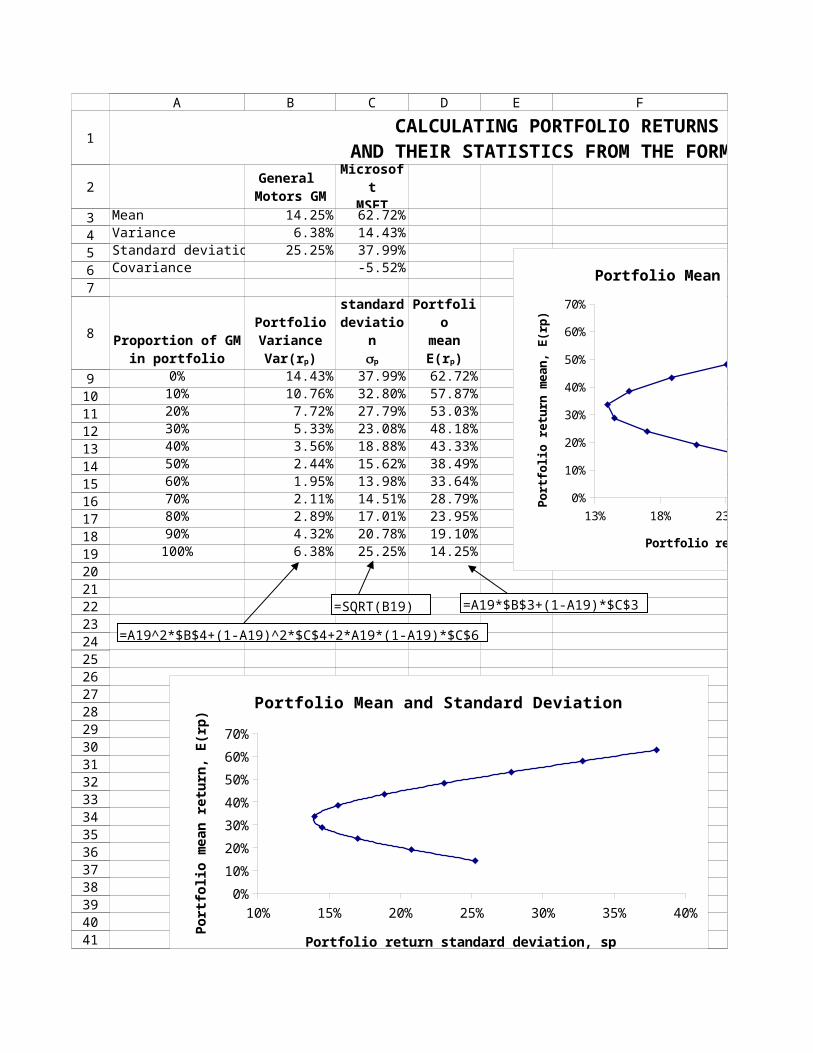
Mean 14.25% 62.72%Variance 6.38% 14.43%Standard deviation 25.25% 37.99%Covariance -5.52%
0% 14.43% 37.99% 62.72%10% 10.76% 32.80% 57.87%20% 7.72% 27.79% 53.03%30% 5.33% 23.08% 48.18%40% 3.56% 18.88% 43.33%50% 2.44% 15.62% 38.49%60% 1.95% 13.98% 33.64%70% 2.11% 14.51% 28.79%80% 2.89% 17.01% 23.95%90% 4.32% 20.78% 19.10%
100% 6.38% 25.25% 14.25%
CALCULATING PORTFOLIO RETURNS AND THEIR STATISTICS FROM THE FORMULAS
General Motors GM
MicrosoftMSFT
Proportion of GMin portfolio
PortfolioVariance
Var(rp)
Portfoliostandarddeviation
sp
PortfoliomeanE(rp)
10% 15% 20% 25% 30% 35% 40%0%
10%
20%
30%
40%
50%
60%
70%
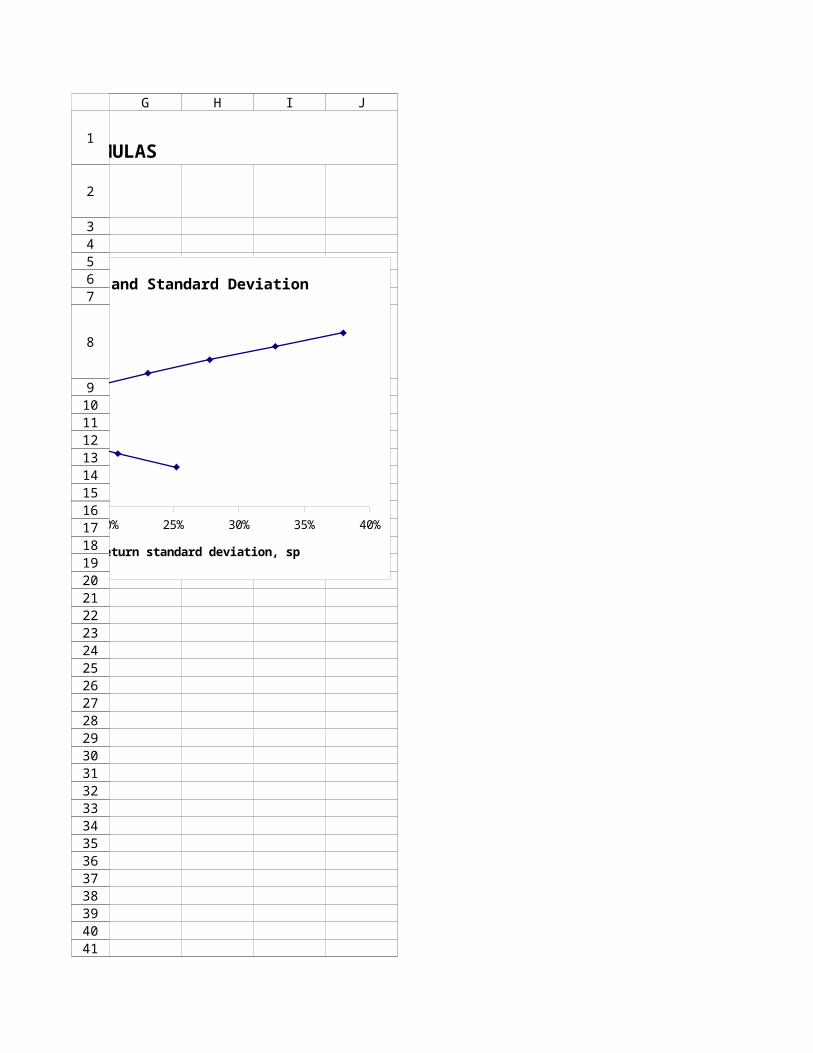
Portfolio Mean and Standard Deviation
Portfolio return standard deviation, sp
Po
rtfo
lio
me
an
re
turn
, E
(rp
)
=A19*$B$3+(1-A19)*$C$3
=A19^2*$B$4+(1-A19)^2*$C$4+2*A19*(1-A19)*$C$6
=SQRT(B19)
13% 18% 23% 28% 33% 38% 43%0%
10%
20%
30%
40%
50%
60%
70%
Portfolio Mean and Standard Deviation
Portfolio return standard deviation, sp
Po
rtfo
lio r
etu
rn m
ea
n, E
(rp
)
A B C D E F
1
2
34567
8
91011121314151617181920212223242526272829303132333435363738394041
10% 15% 20% 25% 30% 35% 40%0%
10%
20%
30%
40%
50%
60%
70%
Portfolio Mean and Standard Deviation
Portfolio return standard deviation, sp
Po
rtfo
lio
me
an
re
turn
, E
(rp
)
A B C D E F4243
CALCULATING PORTFOLIO RETURNS AND THEIR STATISTICS FROM THE FORMULAS
13% 18% 23% 28% 33% 38% 43%0%
10%
20%
30%
40%
50%
60%
70%
Portfolio Mean and Standard Deviation
Portfolio return standard deviation, sp
Po
rtfo
lio r
etu
rn m
ea
n, E
(rp
)
G H I J
1
2
34567
8
91011121314151617181920212223242526272829303132333435363738394041

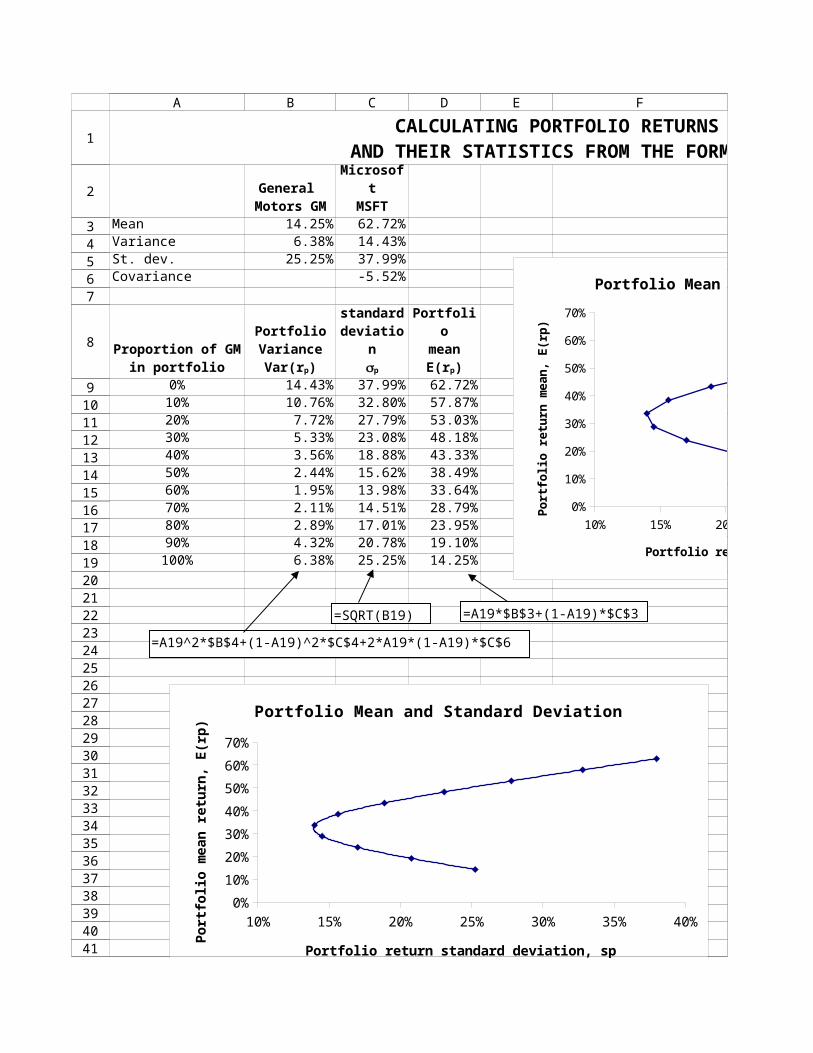
Mean 14.25% 62.72%Variance 6.38% 14.43%St. dev. 25.25% 37.99%Covariance -5.52%
0% 14.43% 37.99% 62.72%10% 10.76% 32.80% 57.87%20% 7.72% 27.79% 53.03%30% 5.33% 23.08% 48.18%40% 3.56% 18.88% 43.33%50% 2.44% 15.62% 38.49%60% 1.95% 13.98% 33.64%70% 2.11% 14.51% 28.79%80% 2.89% 17.01% 23.95%90% 4.32% 20.78% 19.10%
100% 6.38% 25.25% 14.25%
CALCULATING PORTFOLIO RETURNS AND THEIR STATISTICS FROM THE FORMULAS
General Motors GM
MicrosoftMSFT
Proportion of GMin portfolio
PortfolioVariance
Var(rp)
Portfoliostandarddeviation
sp
PortfoliomeanE(rp)
10% 15% 20% 25% 30% 35% 40%0%
10%
20%
30%
40%
50%
60%
70%
Portfolio Mean and Standard Deviation
Portfolio return standard deviation, sp
Po
rtfo
lio
me
an
re
turn
, E
(rp
)
=A19*$B$3+(1-A19)*$C$3
=A19^2*$B$4+(1-A19)^2*$C$4+2*A19*(1-A19)*$C$6
=SQRT(B19)
10% 15% 20% 25% 30% 35% 40%0%
10%
20%
30%
40%
50%
60%
70%
Portfolio Mean and Standard Deviation
Portfolio return standard deviation, sp
Po
rtfo
lio r
etu
rn m
ea
n, E
(rp
)
A B C D E F
1
2
34567
8
91011121314151617181920212223242526272829303132333435363738394041

10% 15% 20% 25% 30% 35% 40%0%
10%
20%
30%
40%
50%
60%
70%
Portfolio Mean and Standard Deviation
Portfolio return standard deviation, sp
Po
rtfo
lio
me
an
re
turn
, E
(rp
)
A B C D E F4243
CALCULATING PORTFOLIO RETURNS AND THEIR STATISTICS FROM THE FORMULAS
10% 15% 20% 25% 30% 35% 40%0%
10%
20%
30%
40%
50%
60%
70%
Portfolio Mean and Standard Deviation
Portfolio return standard deviation, sp
Po
rtfo
lio r
etu
rn m
ea
n, E
(rp
)
G H I J
1
2
34567
8
91011121314151617181920212223242526272829303132333435363738394041

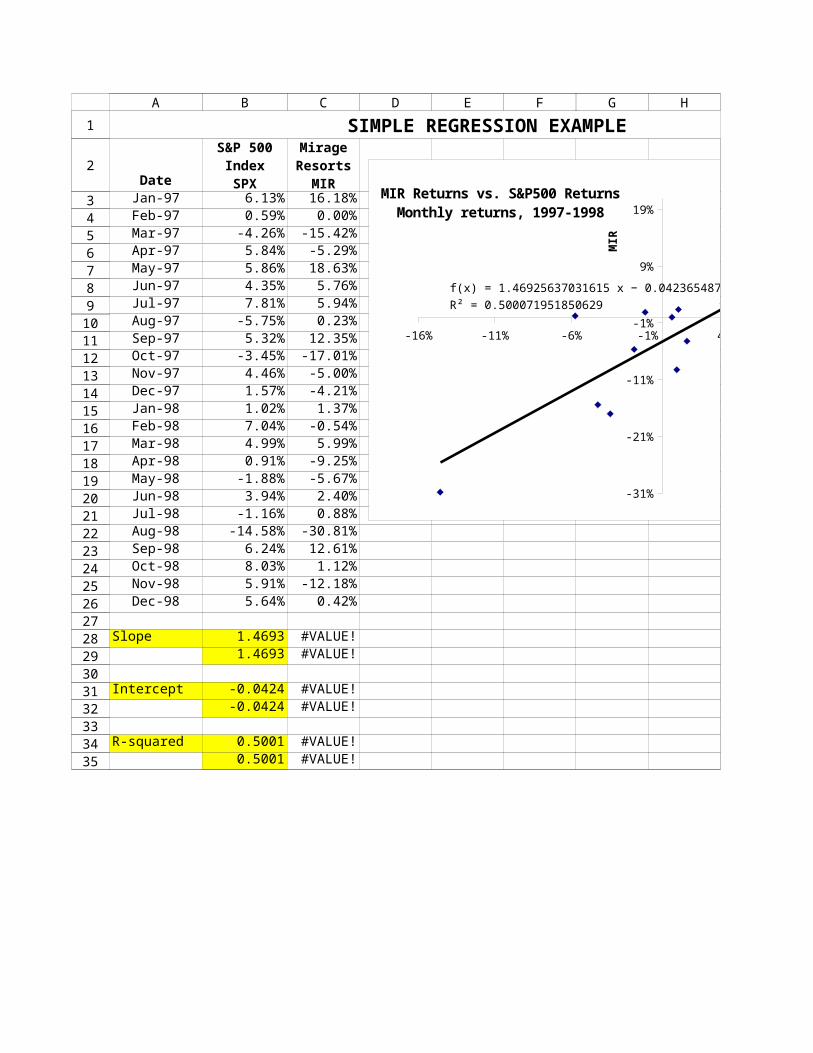
SIMPLE REGRESSION EXAMPLE
DateJan-97 6.13% 16.18%Feb-97 0.59% 0.00%Mar-97 -4.26% -15.42%Apr-97 5.84% -5.29%May-97 5.86% 18.63%Jun-97 4.35% 5.76%Jul-97 7.81% 5.94%Aug-97 -5.75% 0.23%Sep-97 5.32% 12.35%Oct-97 -3.45% -17.01%Nov-97 4.46% -5.00%Dec-97 1.57% -4.21%Jan-98 1.02% 1.37%Feb-98 7.04% -0.54%Mar-98 4.99% 5.99%Apr-98 0.91% -9.25%May-98 -1.88% -5.67%Jun-98 3.94% 2.40%Jul-98 -1.16% 0.88%Aug-98 -14.58% -30.81%Sep-98 6.24% 12.61%Oct-98 8.03% 1.12%Nov-98 5.91% -12.18%Dec-98 5.64% 0.42%
Slope 1.4693 #VALUE!1.4693 #VALUE!
Intercept -0.0424 #VALUE!-0.0424 #VALUE!
R-squared 0.5001 #VALUE!0.5001 #VALUE!
S&P 500IndexSPX
MirageResorts
MIR
-16% -11% -6% -1% 4% 9%
-31%
-21%
-11%
-1%
9%
19%
MIR Returns vs. S&P500 ReturnsMonthly returns, 1997-1998
S&P500
MIR
A B C D E F G H I
1
2
3456789
1011121314151617181920212223242526272829303132333435
SIMPLE REGRESSION EXAMPLE
-16% -11% -6% -1% 4% 9%
-31%
-21%
-11%
-1%
9%
19%
MIR Returns vs. S&P500 ReturnsMonthly returns, 1997-1998
S&P500
MIR
J
1
2
3456789
1011121314151617181920212223242526272829303132333435

SIMPLE REGRESSION EXAMPLE
DateJan-97 6.13% 16.18%Feb-97 0.59% 0.00%Mar-97 -4.26% -15.42%Apr-97 5.84% -5.29%May-97 5.86% 18.63%Jun-97 4.35% 5.76%Jul-97 7.81% 5.94%Aug-97 -5.75% 0.23%Sep-97 5.32% 12.35%Oct-97 -3.45% -17.01%Nov-97 4.46% -5.00%Dec-97 1.57% -4.21%Jan-98 1.02% 1.37%Feb-98 7.04% -0.54%Mar-98 4.99% 5.99%Apr-98 0.91% -9.25%May-98 -1.88% -5.67%Jun-98 3.94% 2.40%Jul-98 -1.16% 0.88%Aug-98 -14.58% -30.81%Sep-98 6.24% 12.61%Oct-98 8.03% 1.12%Nov-98 5.91% -12.18%Dec-98 5.64% 0.42%
Slope 1.4693 #VALUE!1.4693 #VALUE!
Intercept -0.0424 #VALUE!-0.0424 #VALUE!
R-squared 0.5001 #VALUE!0.5001 #VALUE!
S&P 500IndexSPX
MirageResorts
MIR
-16% -11% -6% -1% 4% 9%
-31%
-21%
-11%
-1%
9%
19%
f(x) = 1.46925637031615 x − 0.0423654876484542R² = 0.50007195185063
MIR Returns vs. S&P500 ReturnsMonthly returns, 1997-1998
S&P500
MIR
A B C D E F G H I
1
2
3456789
1011121314151617181920212223242526272829303132333435

SIMPLE REGRESSION EXAMPLE
-16% -11% -6% -1% 4% 9%
-31%
-21%
-11%
-1%
9%
19%
f(x) = 1.46925637031615 x − 0.0423654876484542R² = 0.50007195185063
MIR Returns vs. S&P500 ReturnsMonthly returns, 1997-1998
S&P500
MIR
J
1
2
3456789
1011121314151617181920212223242526272829303132333435
Dec-90 -11.54% 72.99% 2.46% 34.92%Dec-91 -11.35% 121.76% 14.54% 62.97%Dec-92 16.54% 15.11% 16.89% 15.93%Dec-93 72.64% -5.56% -15.95% 6.96%Dec-94 -21.78% 51.63% 6.55% 23.42%Dec-95 28.13% 43.56% 39.81% 39.35%Dec-96 8.46% 88.32% 11.56% 49.32%Dec-97 19.00% 56.43% 45.89% 45.78%Dec-98 21.09% 114.60% 14.11% 65.75%Dec-99 21.34% 68.36% -27.44% 30.22%
Average 14.25% 62.72% 10.84% #VALUE! Average 37.46%Variance 0.0638 0.1443 0.0440 #VALUE! Variance 0.0331Sigma 25.25% 37.99% 20.98% #VALUE! Sigma 18.21%
Covariances Alternative calculation of portfolio statistics
-0.0552 #VALUE! Average 37.46%
-0.0096 #VALUE! Variance 0.0331
0.0092 #VALUE! Sigma 18.21%
PORTFOLIO RETURNS FOR A THREE-STOCK PORTFOLIO
Yearending
GeneralMotors
GMMicrosoft
MSFTHeinzHNZ
Portfolioreturn
Cov(rGM,rMSFT)
Cov(rGM,rHNZ)
Cov(rMSFT,rHNZ)
A B C D E F G
1
2
3456789
101112131415161718
19
20
21

#VALUE!#VALUE!
#VALUE!#VALUE!#VALUE!
Alternative calculation of portfolio statistics
#VALUE!
#VALUE!
<-- =0.2^2*B15+0.5^2*C15+0.3^2*D15+2*0.2*0.5*B19+2*0.2*0.3*B20+2*0.5*0.3*B21
H
1
2
3456789
101112131415161718
19
20
21

WHY VARP INSTEAD OF VAR?
DateJan-97 6.13% 16.18%Feb-97 0.59% 0.00%Mar-97 -4.26% -15.42%Apr-97 5.84% -5.29%May-97 5.86% 18.63%Jun-97 4.35% 5.76%Jul-97 7.81% 5.94%Aug-97 -5.75% 0.23%Sep-97 5.32% 12.35%Oct-97 -3.45% -17.01%Nov-97 4.46% -5.00%Dec-97 1.57% -4.21%Jan-98 1.02% 1.37%Feb-98 7.04% -0.54%Mar-98 4.99% 5.99%Apr-98 0.91% -9.25%May-98 -1.88% -5.67%Jun-98 3.94% 2.40%Jul-98 -1.16% 0.88%Aug-98 -14.58% -30.81%Sep-98 6.24% 12.61%Oct-98 8.03% 1.12%Nov-98 5.91% -12.18%Dec-98 5.64% 0.42%
1.4693 #VALUE!1.4693 #VALUE!
1.4693 #VALUE!1.4080 #VALUE!
1.0000 #VALUE!1.0000 #VALUE!0.9583 #VALUE!
S&P 500IndexSPX
MirageResorts
MIR
Mirage b usingVarP
Mirage b usingVar
Market b usingVar
The S&P index represents the market returns
The beta of the market should = 1. But using Covar(rM,rMirage)/Var(rM) produces a beta < 1.
A B C D
1
2
3456789
101112131415161718192021222324252627
28
2930
31
3233
34
3536373839

The beta of the market should = 1. But using Covar(rM,rMirage)/Var(rM) produces a beta < 1.
A B C D4041

The S&P index represents the market returnsB2:
The beta of the market should = 1. But using Covar(rM,rMirage)/Var(rM) produces a beta < 1.B36: