pew research center for the people & the...
TRANSCRIPT

51
PEW RESEARCH CENTER FOR THE PEOPLE & THE PRESS& PEW HISPANIC CENTER
2006 IMMIGRATION SURVEYFINAL TOPLINE
February 8 - March 7, 2006National Sample: N=2000 / Chicago Sample: N=801 / Las Vegas Sample: N=801
Phoenix Sample: N=800 / Raleigh-Durham Sample: N=801 / Washington, DC Sample: N=800
Q.1 Do you approve or disapprove of the way George W. Bush is handling his job as president? [IF DKENTER AS DK. IF DEPENDS PROBE ONCE WITH: Overall do you approve or disapprove of theway George W. Bush is handling his job as president? [IF STILL DEPENDS ENTER AS DK]
Don’tApprove Disapprove know
National 37 54 9=100
Chicago 31 59 10=100Las Vegas 37 54 9=100Phoenix 43 48 9=100Raleigh-Durham 35 56 9=100Washington, DC 27 62 11=100
National TrendFebruary, 2006 40 52 8=100January, 2006 38 54 8=1002005December, 2005 38 54 8=100Early November, 2005 36 55 9=100Late October, 2005 40 52 8=100Early October, 2005 38 56 6=100September 8-11, 2005 40 52 8=100September 6-7, 2005 40 52 8=100July, 2005 44 48 8=100June, 2005 42 49 9=100Late May, 2005 42 48 10=100Mid-May, 2005 43 50 7=100Late March, 2005 49 46 5=100Mid-March, 2005 45 46 9=100February, 2005 46 47 7=100January, 2005 50 43 7=1002004December, 2004 48 44 8=100Mid-October, 2004 44 48 8=100August, 2004 46 45 9=100July, 2004 46 46 8=100June, 2004 48 43 9=100May, 2004 44 48 8=100Late April, 2004 48 43 9=100Early April, 2004 43 47 10=100Late March, 2004 47 44 9=100Mid-March, 2004 46 47 7=100February, 2004 48 44 8=100Mid-January, 2004 56 34 10=100Early January, 2004 58 35 7=100

52
Q.1 CONTINUED... Don’tApprove Disapprove know
2003December, 2003 57 34 9=100November, 2003 50 40 10=100October, 2003 50 42 8=100September, 2003 55 36 9=100Mid-August, 2003 56 32 12=100Early August, 2003 53 37 10=100Mid-July, 2003 58 32 10=100Early July, 2003 60 29 11=100June, 2003 62 27 11=100May, 2003 65 27 8=100April 10-16, 2003 72 22 6=100April 9, 2003 74 20 6=100April 2-7, 2003 69 25 6=100March 28-April 1, 2003 71 23 6=100March 25-27, 2003 70 24 6=100March 20-24, 2003 67 26 7=100March 13-16, 2003 55 34 11=100February, 2003 54 36 10=100January, 2003 58 32 10=1002002December, 2002 61 28 11=100Late October, 2002 59 29 12=100Early October, 2002 61 30 9=100Mid-September, 2002 67 22 11=100Early September, 2002 63 26 11=100Late August, 2002 60 27 13=100August, 2002 67 21 12=100Late July, 2002 65 25 10=100July, 2002 67 21 12=100June, 2002 70 20 10=100April, 2002 69 18 13=100Early April, 2002 74 16 10=100February, 2002 78 13 9=100January, 2002 80 11 9=1002001Mid-November, 2001 84 9 7=100Early October, 2001 84 8 8=100Late September, 2001 86 7 7=100Mid-September, 2001 80 9 11=100Early September, 2001 51 34 15=100August, 2001 50 32 18=100July, 2001 51 32 17=100June, 2001 50 33 17=100May, 2001 53 32 15=100April, 2001 56 27 17=100March, 2001 55 25 20=100February, 2001 53 21 26=100

1 Asked April 8, 2003 only; N=395.
2 The September 2002 trend is from a Pew Global Attitudes Project survey, fielded August 19 to September 8, 2002 andreleased December 4, 2002.
53
ROTATE Q.2 AND Q.3Q.2 All in all, are you satisfied or dissatisfied with the way things are going in this country today?
NoSatisfied Dissatisfied Opinion
National 32 63 5=100
Chicago 30 65 5=100Las Vegas 36 60 4=100Phoenix 42 53 5=100Raleigh-Durham 30 64 6=100Washington, DC 31 64 5=100
National TrendJanuary, 2006 34 61 5=100Late November, 2005 34 59 7=100Early October, 2005 29 65 6=100July, 2005 35 58 7=100Late May, 2005 39 57 4=100February, 2005 38 56 6=100January, 2005 40 54 6=100December, 2004 39 54 7=100Mid-October, 2004 36 58 6=100July, 2004 38 55 7=100May, 2004 33 61 6=100Late February, 2004 39 55 6=100Early January, 2004 45 48 7=100December, 2003 44 47 9=100October, 2003 38 56 6=100August, 2003 40 53 7=100April, 20031 50 41 9=100January, 2003 44 50 6=100November, 2002 41 48 11=100September, 20022 41 55 4=100Late August, 2002 47 44 9=100May, 2002 44 44 12=100March, 2002 50 40 10=100Late September, 2001 57 34 9=100Early September, 2001 41 53 6=100June, 2001 43 52 5=100March, 2001 47 45 8=100February, 2001 46 43 11=100January, 2001 55 41 4=100October, 2000 (RVs) 54 39 7=100September, 2000 51 41 8=100June, 2000 47 45 8=100April, 2000 48 43 9=100August, 1999 56 39 5=100January, 1999 53 41 6=100

54
Q.2 CONTINUED... NoSatisfied Dissatisfied Opinion
November, 1998 46 44 10=100Early September, 1998 54 42 4=100Late August, 1998 55 41 4=100Early August, 1998 50 44 6=100February, 1998 59 37 4=100January, 1998 46 50 4=100September, 1997 45 49 6=100August, 1997 49 46 5=100January, 1997 38 58 4=100July, 1996 29 67 4=100March, 1996 28 70 2=100October, 1995 23 73 4=100June, 1995 25 73 2=100April, 1995 23 74 3=100July, 1994 24 73 3=100March, 1994 24 71 5=100October, 1993 22 73 5=100September, 1993 20 75 5=100May, 1993 22 71 7=100January, 1993 39 50 11=100January, 1992 28 68 4=100November, 1991 34 61 5=100Late February, 1991 (Gallup) 66 31 3=100August, 1990 47 48 5=100May, 1990 41 54 5=100January, 1989 45 50 5=100September, 1988 (RVs) 50 45 5=100May, 1988 41 54 5=100January, 1988 39 55 6=100
Q.3 All in all, are you satisfied or dissatisfied with the way things are going in your local community today? No
Satisfied Dissatisfied OpinionNational 66 31 3=100
Chicago 67 28 5=100Las Vegas 70 26 4=100Phoenix 72 26 2=100Raleigh-Durham 70 27 3=100Washington, DC 68 27 5=100
National TrendFebruary, 2001 73 22 5=100March, 1994 68 27 5=100

55
ASK FORM 1 ONLY NATIONAL SAMPLE ONLY [N=1000]:Q.4F1 What do you think is the most important problem facing the country today? [RECORD VERBATIM
RESPONSE. PROBE FOR CLARITY – DO NOT PROBE FOR ADDITIONAL MENTIONS. IFMORE THAN ONE MENTION, RECORD ALL IN ORDER OF MENTION]
Early Mid- Mid- Jan Nov May Jan July Jan Apr Feb Mar May Feb
2006 2005 2005 2005 2004 2004 2003 2003 2002 2001 200120 War/War in Iraq 23 29 24 32 25 16 14 34 10• -- --10 Dissatisfaction with govt/politics 5 7 6 5 7 5 3 5 4 2 5 8 Terrorism 6 6 8 10 8 14 9 16 24 1 * 7 Economy (general) 11 11 15 12 14 20 28 21 8 7 7 6 Health care/costs 6 5 7 5 5 5 3 2 2 6 7 6 Unemployment/Lack of jobs 7 4 7 7 8 13 10 6 4 5 6 6 Morality/Ethics/Family values 4 3 3 5 4 3 4 5 8 6 12 5 Energy crisis/Rising gas/heating prices 5 4 6 -- 2 -- -- 1 1 22 4 4 Education 3 1 2 3 4 3 4 1 4 8 11
Defense issues/Military spending/ 4 National & homeland security 3 2 2 3 3 3 2 2 5 1 1 4 Immigration 3 2 4 1 1 3 1 -- 1 1 2 3 Poverty/Hunger/Starvation 7 4 2 3 2 3 3 1 2 3 3 3 Crime/Gangs/Justice system 2 -- 2 2 1 1 1 1 4 4 8 3 Inflation/Difference between wages/costs 2 1 2 1 1 1 1 1 1 1 3 3 Drugs/Alcohol 1 1 1 1 1 1 1 2 4 4 6 2 Deficit/National debt/Balanced budget 2 3 2 3 1 2 2 -- 1 1 1 1 Hurricanes/disaster relief 2 2 -- -- -- -- -- -- -- -- -- 1 Taxes 1 1 1 1 1 1 1 -- 1 3 3 1 U.S. foreign policy/Intl affairs 3 3 1 1 4 2 -- -- -- 2 2 1 Trade/Jobs moving overseas 2 2 1 1 2 1 -- -- -- -- --
16 Other 4 None 0 0 1 1 1 1 1 1 1 * 2 6 Don't know/No answer 7 6 5 5 6 4 9 4 8 8 7
(NET) FOREIGN ISSUES/34 INTERNATIONAL 37 42 36 49 41 37 29 54 39 3 5
22 (NET) ECONOMIC 26 24 31 24 26 35 41 29 16 40 26
• War in Afghanistan in March 2002
56
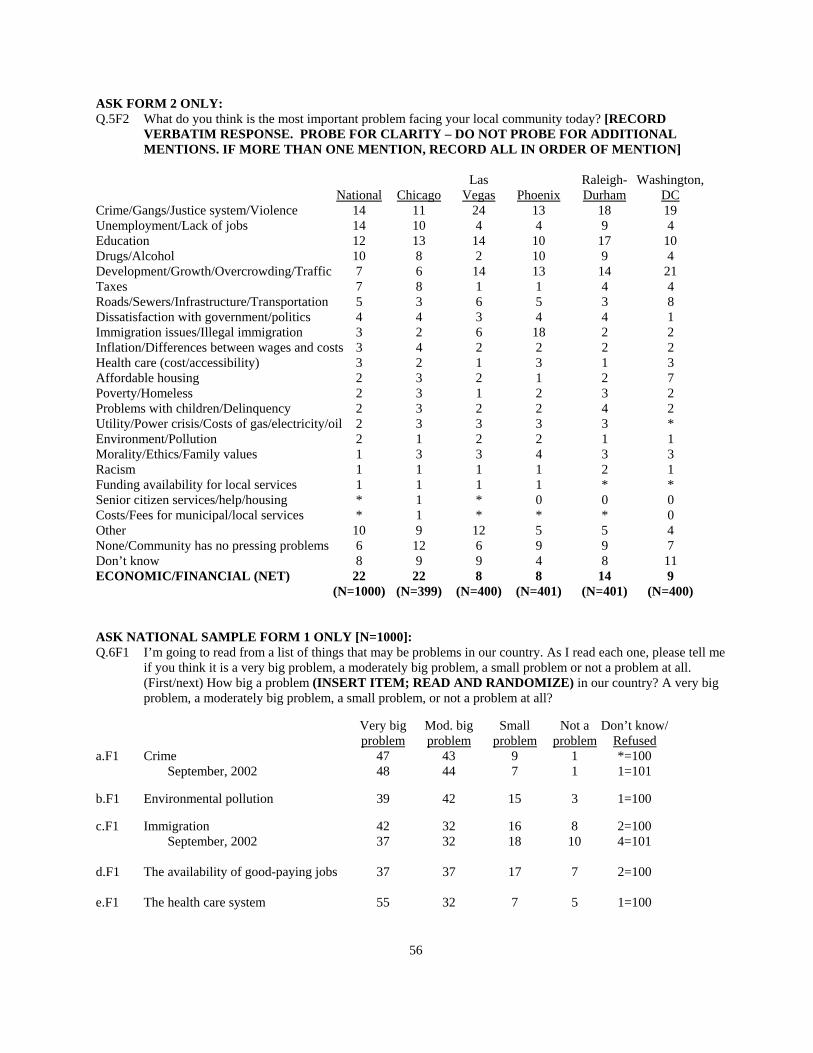
ASK FORM 2 ONLY:Q.5F2 What do you think is the most important problem facing your local community today? [RECORD
VERBATIM RESPONSE. PROBE FOR CLARITY – DO NOT PROBE FOR ADDITIONALMENTIONS. IF MORE THAN ONE MENTION, RECORD ALL IN ORDER OF MENTION]
Las Raleigh- Washington,National Chicago Vegas Phoenix Durham DC
Crime/Gangs/Justice system/Violence 14 11 24 13 18 19Unemployment/Lack of jobs 14 10 4 4 9 4Education 12 13 14 10 17 10Drugs/Alcohol 10 8 2 10 9 4Development/Growth/Overcrowding/Traffic 7 6 14 13 14 21Taxes 7 8 1 1 4 4Roads/Sewers/Infrastructure/Transportation 5 3 6 5 3 8Dissatisfaction with government/politics 4 4 3 4 4 1Immigration issues/Illegal immigration 3 2 6 18 2 2Inflation/Differences between wages and costs 3 4 2 2 2 2Health care (cost/accessibility) 3 2 1 3 1 3Affordable housing 2 3 2 1 2 7Poverty/Homeless 2 3 1 2 3 2Problems with children/Delinquency 2 3 2 2 4 2Utility/Power crisis/Costs of gas/electricity/oil 2 3 3 3 3 *Environment/Pollution 2 1 2 2 1 1Morality/Ethics/Family values 1 3 3 4 3 3Racism 1 1 1 1 2 1Funding availability for local services 1 1 1 1 * *Senior citizen services/help/housing * 1 * 0 0 0Costs/Fees for municipal/local services * 1 * * * 0Other 10 9 12 5 5 4None/Community has no pressing problems 6 12 6 9 9 7Don’t know 8 9 9 4 8 11ECONOMIC/FINANCIAL (NET) 22 22 8 8 14 9
(N=1000) (N=399) (N=400) (N=401) (N=401) (N=400)
ASK NATIONAL SAMPLE FORM 1 ONLY [N=1000]:Q.6F1 I’m going to read from a list of things that may be problems in our country. As I read each one, please tell me
if you think it is a very big problem, a moderately big problem, a small problem or not a problem at all.(First/next) How big a problem (INSERT ITEM; READ AND RANDOMIZE) in our country? A very bigproblem, a moderately big problem, a small problem, or not a problem at all?
Very big Mod. big Small Not a Don’t know/problem problem problem problem Refused
a.F1 Crime 47 43 9 1 *=100September, 2002 48 44 7 1 1=101
b.F1 Environmental pollution 39 42 15 3 1=100
c.F1 Immigration 42 32 16 8 2=100September, 2002 37 32 18 10 4=101
d.F1 The availability of good-paying jobs 37 37 17 7 2=100
e.F1 The health care system 55 32 7 5 1=100

57
Q.6F1 CONTINUED...Very big Mod. big Small Not a Don’t know/problem problem problem problem Refused
f.F1 Corrupt political leaders 46 34 14 3 3=100September, 2002 46 37 13 2 2=100
g.F1 Terrorism 50 36 10 2 2=100September, 2002 50 37 11 1 1=100
ASK NATIONAL SAMPLE FORM 2 ONLY [N=1000]:ASK ALL ON LOCAL SAMPLES:Q.7F2 I’m going to read from a list of things that may be problems in your LOCAL community. As I read each one,
please tell me if you think it is a very big problem, a moderately big problem, a small problem or not a problemat all. (First/next) How big a problem (INSERT ITEM; READ AND RANDOMIZE) in your LOCALcommunity? A very big problem, a moderately big problem, a small problem, or not a problem at all?
Very big Mod. big Small Not a Don’t know/problem problem problem problem Refused
a.F2 CrimeNational 20 33 30 16 1=100
Chicago 20 27 32 20 1=100Las Vegas 33 45 13 8 1=100Phoenix 27 36 24 13 *=100Raleigh-Durham 18 33 34 14 1=100Washington, DC 20 34 27 18 1=100
b.F2 Environmental pollutionNational 15 27 32 25 1=100
Chicago 18 27 26 26 3=100Las Vegas 23 38 24 13 2=100Phoenix 42 34 15 8 1=100Raleigh-Durham 11 33 36 19 1=100Washington, DC 15 32 28 22 3=100
c.F2 ImmigrationNational 21 20 22 33 4=100
Chicago 19 16 19 42 4=100Las Vegas 36 28 15 17 4=100Phoenix 55 23 8 12 2=100Raleigh-Durham 26 30 21 20 3=100Washington, DC 21 23 20 32 4=100
d.F2 The quality of public educationNational 20 29 18 28 5=100
Chicago 19 24 16 36 5=100Las Vegas 34 29 14 14 9=100Phoenix 25 29 18 21 7=100Raleigh-Durham 17 30 23 26 4=100Washington, DC 18 25 18 32 7=100
58
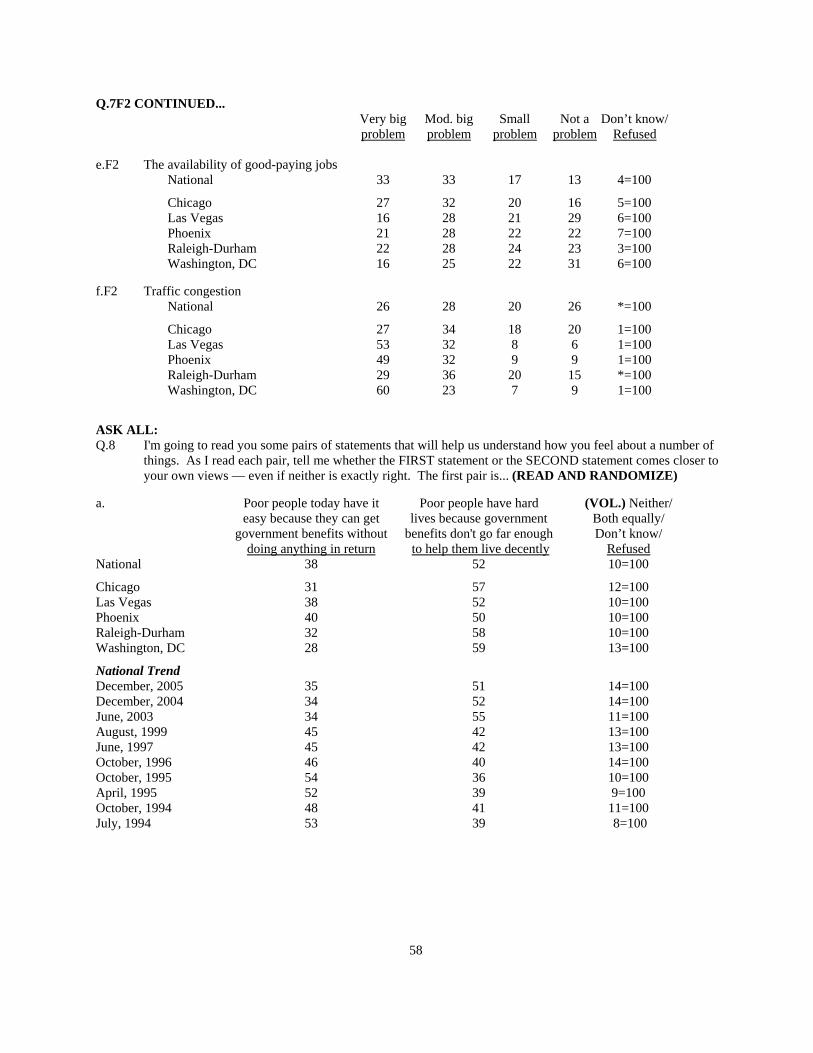
Q.7F2 CONTINUED...Very big Mod. big Small Not a Don’t know/problem problem problem problem Refused
e.F2 The availability of good-paying jobsNational 33 33 17 13 4=100
Chicago 27 32 20 16 5=100Las Vegas 16 28 21 29 6=100Phoenix 21 28 22 22 7=100Raleigh-Durham 22 28 24 23 3=100Washington, DC 16 25 22 31 6=100
f.F2 Traffic congestionNational 26 28 20 26 *=100
Chicago 27 34 18 20 1=100Las Vegas 53 32 8 6 1=100Phoenix 49 32 9 9 1=100Raleigh-Durham 29 36 20 15 *=100Washington, DC 60 23 7 9 1=100
ASK ALL:Q.8 I'm going to read you some pairs of statements that will help us understand how you feel about a number of
things. As I read each pair, tell me whether the FIRST statement or the SECOND statement comes closer toyour own views — even if neither is exactly right. The first pair is... (READ AND RANDOMIZE)
a. Poor people today have it Poor people have hard (VOL.) Neither/easy because they can get lives because government Both equally/
government benefits without benefits don't go far enough Don’t know/doing anything in return to help them live decently Refused
National 38 52 10=100
Chicago 31 57 12=100Las Vegas 38 52 10=100Phoenix 40 50 10=100Raleigh-Durham 32 58 10=100Washington, DC 28 59 13=100
National TrendDecember, 2005 35 51 14=100December, 2004 34 52 14=100June, 2003 34 55 11=100August, 1999 45 42 13=100June, 1997 45 42 13=100October, 1996 46 40 14=100October, 1995 54 36 10=100April, 1995 52 39 9=100October, 1994 48 41 11=100July, 1994 53 39 8=100

59
Q.8 CONTINUED...b. Hard work and (VOL.) Neither/
Most people who want to determination are no Both equally/get ahead can make it if guarantee of success Don’t know/
they’re willing to work hard for most people RefusedNational 64 33 3=100Chicago 64 31 5=100Las Vegas 69 28 3=100Phoenix 69 28 3=100Raleigh-Durham 67 30 3=100Washington, DC 66 31 3=100National TrendDecember, 2005 64 33 3=100December, 2004 68 28 4=100September, 2000 73 24 3=100August, 1999 74 23 3=100July, 1994 68 30 2=100
c. (VOL.) Neither/Stricter environmental laws Stricter environmental Both equally/
and regulations cost too many laws and regulations Don’t know/jobs and hurt the economy are worth the cost Refused
National 29 65 6=100Chicago 25 69 6=100Las Vegas 30 64 6=100Phoenix 29 65 6=100Raleigh-Durham 24 70 6=100Washington, DC 25 69 6=100National TrendDecember, 2005 37 56 7=100December, 2004 31 60 9=100September, 2000 31 61 8=100August, 1999 28 65 7=100October, 1996 30 63 7=100October, 1995 35 61 4=100April, 1995 39 57 4=100October, 1994 32 62 6=100July, 1994 33 62 5=100
d. The growing number of The growing number of (VOL.) Neither/newcomers from other newcomers from Both equally/
countries threaten traditional other countries strengthens Don’t know/American customs and values American society Refused
National 48 45 7=100Chicago 46 47 7=100Las Vegas 45 48 7=100Phoenix 38 53 9=100Raleigh-Durham 45 48 7=100Washington, DC 37 54 9=100National TrendDecember, 2004 40 50 10=100

60
Q.8 CONTINUED...e. Immigrants today are (VOL.) Neither/
Immigrants today strengthen a burden on our country Both equally/our country because of because they take our jobs, Don’t know/
their hard work and talents housing and health care RefusedNational 41 52 7=100
Chicago 46 44 10=100Las Vegas 47 43 10=100Phoenix 45 46 9=100Raleigh-Durham 47 44 9=100Washington, DC 56 32 12=100
National TrendDecember, 2005 45 44 11=100December, 2004 45 44 11=100June, 2003 46 44 10=100September, 2000 50 38 12=100August, 1999 46 44 10=100October, 1997 41 48 11=100June, 1997 41 48 11=100April, 1997 38 52 10=100June, 1996 37 54 9=100July, 1994 31 63 6=100
ASK FORM 1 ONLY:Q.9F1 I'd like your opinion of some groups. As I read from a list, please tell me which category best describes your
overall opinion of the group I name. (First,) would you say your overall opinion of (INSERT ITEM,RANDOMIZE) is very favorable, mostly favorable, mostly UNfavorable, or very unfavorable?
(VOL) (VOL)-------Favorable------ -----Unfavorable----- Never Can’tTotal Very Mostly Total Very Mostly Heard of Rate/Ref
a.F1 JewsNational 84 27 57 6 2 4 * 10=100 (N=1000)
Chicago 86 31 55 6 2 4 0 8=100 (N=402)Las Vegas 76 26 50 11 4 7 1 12=100 (N=401)Phoenix 83 33 50 8 2 6 * 9=100 (N=399)Raleigh-Durham 81 27 54 8 4 4 * 11=100 (N=400)Washington, DC 86 34 52 4 2 2 * 10=100 (N=400)
National TrendJuly, 2005 77 23 54 7 2 5 * 16=100Late May, 2005 77 37 40 7 2 5 -- 16=100Mid-July, 2003 72 20 52 9 3 6 1 18=100March, 2002 74 18 56 9 2 7 * 17=100Mid-November, 2001 75 24 51 7 2 5 * 18=100March, 2001 72 16 56 10 2 8 * 18=100September, 2000 (RVs) 77 27 50 8 3 5 * 15=100June, 1997 82 26 56 9 2 7 1 8=100

61
Q.9F1 CONTINUED... (VOL) (VOL)-------Favorable------ -----Unfavorable----- Never Can’tTotal Very Mostly Total Very Mostly Heard of Rate/Ref
b.F1 BlacksNational 83 24 59 10 2 8 0 7=100 (N=1000)
Chicago 84 23 61 11 4 7 0 5=100 (N=402)Las Vegas 75 23 52 17 7 10 * 8=100 (N=401)Phoenix 85 32 53 10 2 8 0 5=100 (N=399)Raleigh-Durham 85 24 61 9 2 7 * 6=100 (N=400)Washington, DC 87 34 53 7 2 5 0 6=100 (N=400)
National TrendJune, 2003 85 27 58 8 2 6 0 7=100June, 1997 87 25 62 7 2 5 0 6=100
c.F1 HispanicsNational 75 22 53 18 5 13 0 7=100 (N=1000)
Chicago 83 23 60 11 4 7 0 6=100 (N=402)Las Vegas 77 28 49 16 4 12 0 7=100 (N=401)Phoenix 81 31 50 15 5 10 0 4=100 (N=399)Raleigh-Durham 74 20 54 20 6 14 0 6=100 (N=400)Washington, DC 79 24 55 15 6 9 0 6=100 (N=400)
National TrendJune, 2003 77 25 52 13 3 10 * 10=100June, 1997 78 19 59 13 4 9 * 9=100
d.F1 AsiansNational 80 25 55 12 4 8 0 8=100 (N=1000)
Chicago 83 24 59 11 4 7 0 6=100 (N=402)Las Vegas 78 26 52 10 4 6 2 10=100 (N=401)Phoenix 80 36 44 13 4 9 0 7=100 (N=399)Raleigh-Durham 79 24 55 11 4 7 1 9=100 (N=400)Washington, DC 85 28 57 6 2 4 * 9=100 (N=400)
National TrendJune, 2003 76 24 52 11 3 8 * 13=100June, 1997 76 20 56 13 4 9 * 11=100
e.F1 Evangelical ChristiansNational 68 22 46 18 5 13 2 12=100 (N=1000)
Chicago 69 18 51 17 5 12 2 12=100 (N=402)Las Vegas 63 21 42 19 8 11 2 16=100 (N=401)Phoenix 65 27 38 23 7 16 1 11=100 (N=399)Raleigh-Durham 66 22 44 23 7 16 2 9=100 (N=400)Washington, DC 63 23 40 22 4 18 3 12=100 (N=400)
National TrendJuly, 2005 57 17 40 19 5 14 5 19=100Mid-July, 2003 58 18 40 18 6 12 3 21=100March, 2002 55 13 42 18 5 13 7 20=100March, 2001 55 13 42 16 4 12 8 21=100September, 2000 (RVs) 63 21 42 16 3 13 3 18=100February, 1996 39 13 26 38 15 23 11 12=100July, 1994 43 10 33 32 10 22 11 14=100May, 1990 43 12 31 38 19 19 7 12=100

62
NO QUESTION 10
ASK ALL:ROTATE Q.11 AND Q.12Thinking about the nation’s economy…Q.11 How would you rate economic conditions in this country today… as excellent, good, only fair, or poor?
Only Don’t KnowExcellent Good Fair Poor Refused
National 4 29 44 22 1=100
Chicago 4 27 41 28 *=100Las Vegas 6 33 41 19 1=100Phoenix 7 35 43 14 1=100Raleigh-Durham 4 30 45 20 1=100Washington, DC 7 34 38 20 1=100
National TrendJanuary, 2006 4 30 45 19 2=100Early October, 2005 2 23 45 29 1=100Mid-September, 2005 3 28 44 24 1=100Mid-May, 2005 3 29 47 20 1=100January, 2005 3 36 45 15 1=100December, 2004 3 33 43 20 1=100Early November, 2004 (RVs) 5 31 37 26 1=100Mid-September, 2004 4 34 40 20 2=100August, 2004 3 30 45 21 1=100Late April, 2004 4 34 38 22 2=100Late February, 2004 2 29 42 26 1=100February 9-12, 2004 (Gallup) 2 31 46 21 0=100January 12-15, 2004 (Gallup) 3 34 42 21 0=100January 2-5, 2004 (Gallup) 3 40 41 16 *=100December 11-14, 2003 (Gallup) 3 34 44 19 *=100November 3-5, 2003 (Gallup) 2 28 49 21 *=100October 24-26, 2003 (Gallup) 2 24 44 30 *=100October 6-8, 2003 (Gallup) 2 20 50 27 1=100September 8-10, 2003 (Gallup) 1 20 49 30 *=100August 4-6, 2003 (Gallup) 1 24 52 23 *=100February 17-19, 2003 (Gallup) 1 17 48 34 *=100February 4-6, 2002 (Gallup) 2 26 55 16 1=100March 5-7, 2001 (Gallup) 3 43 43 10 1=100January 7-10, 2000 (Gallup) 19 52 23 5 1=100January 15-17, 1999 (Gallup) 14 55 27 4 *=100March 20-22, 1998 (Gallup) 20 46 27 7 *=100Jan 31 - Feb 2, 1997 (Gallup) 4 38 43 15 *=100March 15-17, 1996 (Gallup) 2 31 48 18 1=100May 11-14, 1995 (Gallup) 2 27 50 20 1=100January 15-17, 1994 (Gallup) * 22 54 24 *=100February 12-14, 1993 (Gallup) * 14 46 39 1=100January 3-6, 1992 (Gallup) * 12 46 41 1=100

63
Thinking about your own personal finances...Q.12 How would you rate your own personal financial situation? Would you say you are in excellent shape, good
shape, only fair shape or poor shape financially?
Only Don’t Know/Excellent Good Fair Poor Refused
National 9 39 36 15 1=100
Chicago 7 41 39 11 2=100Las Vegas 10 45 34 10 1=100Phoenix 13 41 34 11 1=100Raleigh-Durham 11 44 31 13 1=100Washington, DC 12 46 29 12 1=100
National TrendJanuary, 2006 7 39 37 15 2=100Mid- May, 2005 7 37 39 16 1=100January, 2005 10 41 34 14 1=100August, 2004 9 42 34 14 1=100September, 2003 10 38 36 15 1=100Late March, 2003 10 43 31 12 4=100January, 2003 7 38 39 15 1=100Early October, 2002 7 39 37 16 1=100June, 2002 5 40 37 16 2=100Late September, 2001 7 40 37 14 2=100June, 2001 6 38 39 16 1=100June, 2000 9 43 35 11 2=100August, 1999 6 43 41 9 1=100May, 1997 7 43 38 11 1=100September, 1996 (RVs) 8 47 34 10 1=100February, 1995 8 39 38 14 1=100March, 1994 5 41 40 13 1=100December, 1993 5 34 45 15 1=100January, 1993 U.S. News & World Report 4 33 46 16 1=100October, 1992 U.S. News & World Report 6 34 40 19 1=100August, 1992 U.S. News & World Report 5 30 47 17 1=100May, 1992 U.S. News & World Report 4 35 45 15 1=100January, 1992 U.S. News & World Report 4 32 45 18 1=100
Q.13 Thinking now about job opportunities where you live, would you say there are plenty of jobs available in yourcommunity or are jobs difficult to find?
(VOL)Plenty of Jobs are Lots of some jobs, DK/
jobs available difficult to find few of others RefusedNational 37 56 3 4=100
Chicago 30 59 3 8=100Las Vegas 73 21 3 3=100Phoenix 59 32 3 6=100Raleigh-Durham 51 43 2 4=100Washington, DC 60 32 4 4=100
National TrendJanuary, 2006 33 56 6 5=100Early October, 2005 36 56 4 4=100May, 2005 30 60 6 4=100

64
Q.13 CONTINUED...(VOL)
Plenty of Jobs are Lots of some jobs, DK/jobs available difficult to find few of others Refused
January, 2005 32 58 5 5=100Mid-September, 2004 31 52 6 11=100August, 2004 34 55 4 7=100Late April, 2004 30 57 4 9=100Late February, 2004 31 59 5 6=100Mid-January, 2004 27 60 6 7=100October, 2003 24 66 5 5=100June, 2002 31 59 4 6=100June, 2001 42 44 8 6 =100August, 1992 U.S. News & W. Report 15 76 6 3 =100May, 1992 U.S. News & W. Report 16 77 4 3 =100January, 1992 U.S. News & W. Report 12 79 6 3 =100
EMPLOY Are you now employed full-time, part-time or not employed?
Full- Part- Not DK/time time employed Refused
National 53 13 34 *=100
Chicago 50 15 35 *=100Las Vegas 57 9 34 *=100Phoenix 54 10 36 *=100Raleigh-Durham 53 15 32 *=100Washington, DC 60 12 28 *=100
IF “NOT EMPLOYED” (3 IN EMPLOY) ASK:EMPLOY2 Is that because you are a student, because you are retired, because you choose not to work, or because
you’ve lost or quit a job? Other
Choose not Lost or reason DK/Student Retired to work quit a job (VOL) Refused
National 3 19 3 3 6 *=34%
Chicago 5 16 5 4 5 *=35%Las Vegas 2 18 5 2 7 *=34%Phoenix 2 18 6 3 7 0=36%Raleigh-Durham 5 14 5 3 5 *=32%Washington, DC 4 14 4 2 4 *=28%
National TrendJanuary, 2006 4 19 4 4 7 *=38%Mid-May, 2005 3 19 5 3 7 0=37%February, 2005 3 17 6 2 7 0=35%June, 2002 2 19 4 4 6 *=35%June, 2001 n/a 17 4 4 10 *=35%
NO QUESTION 14 OR 15

65
ASK ALL:Now I would like to ask you some questions about immigrants – people who come from other countries to live here inthe United States.Q.16 Compared to the immigrants of the early 1900s, are TODAY'S immigrants more willing to adapt to the
American way of life, less willing to adapt to the American way of life, or are they about as willing to adapt tothe American way of life?
More Less About as DK/willing willing willing Refused
National 19 44 30 7=100Chicago 20 42 31 7=100Las Vegas 18 50 26 6=100Phoenix 18 52 26 4=100Raleigh-Durham 20 40 35 5=100Washington, DC 23 37 32 8=100
ASK FORM 1 ONLY:Q.17F1 Please tell me whether each of the following characteristics do or do not apply to immigrants from Latin
American countries (READ AND RANDOMIZE) DK/
Applies Doesn’t apply Refuseda.F1 Work very hard
National 80 10 10=100 (N=1000)Chicago 85 9 6=100 (N=402)Las Vegas 82 10 8=100 (N=401)Phoenix 82 11 7=100 (N=399)Raleigh-Durham 87 6 7=100 (N=400)Washington, DC 85 9 6=100 (N=400)National TrendApril, 1997 63 23 14=100July, 1993 (Gallup) 65 27 8=100
b.F1 Often end up on welfareNational 37 44 19=100 (N=1000)Chicago 32 49 19=100 (N=402)Las Vegas 41 42 17=100 (N=401)Phoenix 42 42 16=100 (N=399)Raleigh-Durham 34 49 17=100 (N=400)Washington, DC 28 46 26=100 (N=400)National TrendApril, 1997 55 26 19=100July, 1993 (Gallup) 60 27 13=100
c.F1 Do very well in schoolNational 41 33 26=100 (N=1000)Chicago 42 35 23=100 (N=402)Las Vegas 36 46 18=100 (N=401)Phoenix 37 47 16=100 (N=399)Raleigh-Durham 37 35 28=100 (N=400)Washington, DC 36 38 26=100 (N=400)National TrendApril, 1997 29 39 32=100July, 1993 (Gallup) 42 42 16=100

66
Q.17F1 CONTINUED... DK/Applies Doesn’t apply Refused
d.F1 Significantly increase crimeNational 33 55 12=100 (N=1000)
Chicago 30 55 15=100 (N=402)Las Vegas 45 46 9=100 (N=401)Phoenix 46 46 8=100 (N=399)Raleigh-Durham 37 51 12=100 (N=400)Washington, DC 31 54 15=100 (N=400)
National TrendApril, 1997 43 39 17=100July, 1993 (Gallup) 62 28 10=100
e.F1 Have strong family valuesNational 80 8 12=100 (N=1000)
Chicago 86 8 6=100 (N=402)Las Vegas 85 7 8=100 (N=401)Phoenix 86 7 7=100 (N=399)Raleigh-Durham 85 7 8=100 (N=400)Washington, DC 85 6 9=100 (N=400)
National TrendApril, 1997 75 11 14=100July, 1993 (Gallup) 72 19 9=100
f.F1 Keep to themselves and don’t try to fit in National 45 43 12=100 (N=1000)
Chicago 42 47 11=100 (N=402)Las Vegas 54 38 8=100 (N=401)Phoenix 47 45 8=100 (N=399)Raleigh-Durham 45 47 8=100 (N=400)Washington, DC 44 42 14=100 (N=400)
ASK FORM 2 ONLY:Q.18F2 Please tell me whether each of the following characteristics do or do not apply to immigrants from Asian
countries (READ AND RANDOMIZE)
DK/Applies Doesn’t apply Refused
a.F2 Work very hardNational 82 8 10=100 (N=1000)Chicago 87 4 9=100 (N=399)Las Vegas 86 7 7=100 (N=400)Phoenix 91 4 5=100 (N=401)Raleigh-Durham 86 8 6=100 (N=401)Washington, DC 87 6 7=100 (N=400)National TrendApril, 1997 77 10 13=100July, 1993 (Gallup) 74 20 6=100
67
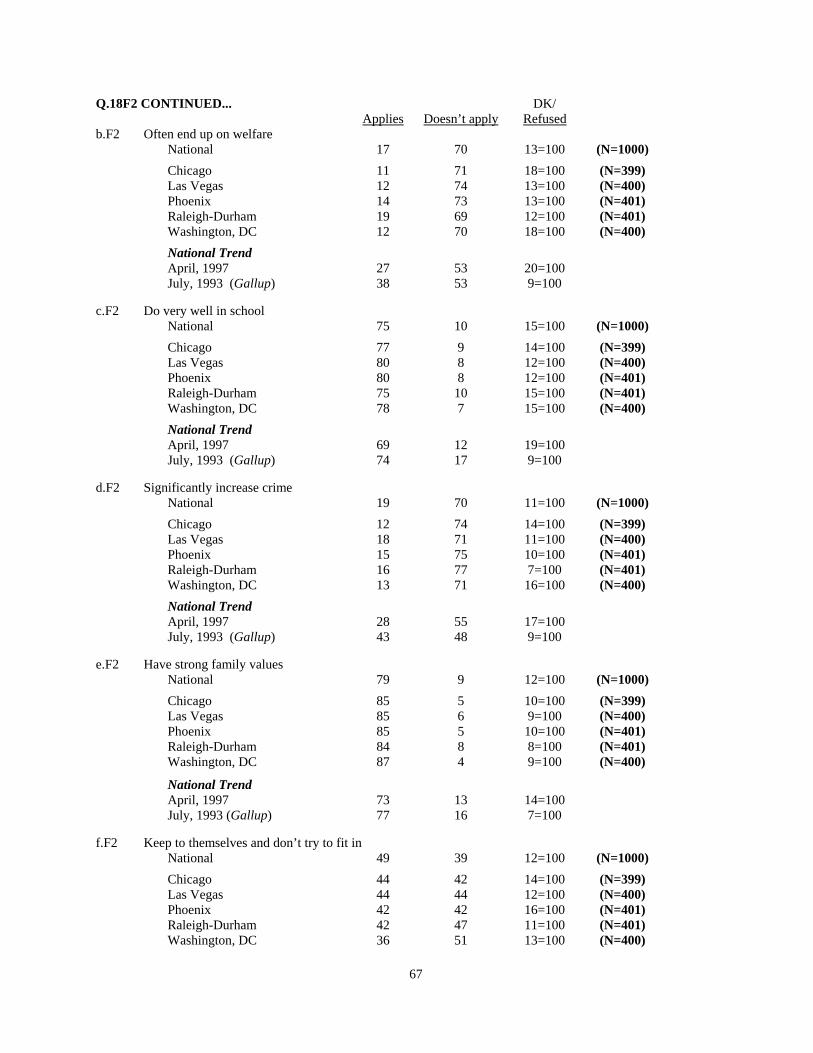
Q.18F2 CONTINUED... DK/Applies Doesn’t apply Refused
b.F2 Often end up on welfareNational 17 70 13=100 (N=1000)Chicago 11 71 18=100 (N=399)Las Vegas 12 74 13=100 (N=400)Phoenix 14 73 13=100 (N=401)Raleigh-Durham 19 69 12=100 (N=401)Washington, DC 12 70 18=100 (N=400)National TrendApril, 1997 27 53 20=100July, 1993 (Gallup) 38 53 9=100
c.F2 Do very well in schoolNational 75 10 15=100 (N=1000)Chicago 77 9 14=100 (N=399)Las Vegas 80 8 12=100 (N=400)Phoenix 80 8 12=100 (N=401)Raleigh-Durham 75 10 15=100 (N=401)Washington, DC 78 7 15=100 (N=400)National TrendApril, 1997 69 12 19=100July, 1993 (Gallup) 74 17 9=100
d.F2 Significantly increase crimeNational 19 70 11=100 (N=1000)Chicago 12 74 14=100 (N=399)Las Vegas 18 71 11=100 (N=400)Phoenix 15 75 10=100 (N=401)Raleigh-Durham 16 77 7=100 (N=401)Washington, DC 13 71 16=100 (N=400)National TrendApril, 1997 28 55 17=100July, 1993 (Gallup) 43 48 9=100
e.F2 Have strong family valuesNational 79 9 12=100 (N=1000)Chicago 85 5 10=100 (N=399)Las Vegas 85 6 9=100 (N=400)Phoenix 85 5 10=100 (N=401)Raleigh-Durham 84 8 8=100 (N=401)Washington, DC 87 4 9=100 (N=400)
National TrendApril, 1997 73 13 14=100July, 1993 (Gallup) 77 16 7=100
f.F2 Keep to themselves and don’t try to fit in National 49 39 12=100 (N=1000)Chicago 44 42 14=100 (N=399)Las Vegas 44 44 12=100 (N=400)Phoenix 42 42 16=100 (N=401)Raleigh-Durham 42 47 11=100 (N=401)Washington, DC 36 51 13=100 (N=400)

3 In 1997 and 1993 the question was worded “How often do you personally have to deal with immigrants who speak little orno English?”
68
NO QUESTION 19
ASK ALL:Q.20 About what percentage of the American public was born outside of the U.S … is it (READ IN ORDER)…
(Correct)Closer to Closer to Closer to Higher than DK/1 percent 10 percent 25 percent 25 percent Refused
National 5 34 25 28 8=100
Chicago 6 31 28 28 7=100Las Vegas 7 29 25 30 9=100Phoenix 6 31 25 32 6=100Raleigh-Durham 6 36 28 23 7=100Washington, DC 7 32 23 27 11=100
Q.21 How often do you personally come in contact with immigrants who speak little or no English… (READ INORDER)?
DK/Often Sometimes Rarely Never Refused
National 49 25 19 6 1=100
Chicago 50 27 17 5 1=100Las Vegas 68 19 11 2 *=100Phoenix 66 20 11 3 *=100Raleigh-Durham 59 24 14 3 *=100Washington, DC 56 29 12 2 1=100
National TrendApril, 19973 28 23 32 17 *=100July, 1993 (Gallup) 29 26 30 15 *=100
IF OFTEN '1' OR SOMETIMES '2' IN Q.21, ASK:Q.22 When that happens, does it bother you, or not bother you?
Not DK/Bother bother Refused
National 38 61 1=100 (N=1476)
Chicago 38 61 1=100 (N=630)Las Vegas 43 56 1=100 (N=710)Phoenix 40 58 2=100 (N=687)Raleigh-Durham 34 65 1=100 (N=659)Washington, DC 36 61 3=100 (N=671)
National TrendApril, 1997 39 60 1=100July, 1993 (Gallup) 45 54 1=100

69
ASK ALL:Q.23 Do you have any friends or relatives who are recent immigrants?
DK/Yes No Refused
National 26 74 *=100
Chicago 29 71 *=100Las Vegas 29 70 1=100Phoenix 35 65 *=100Raleigh-Durham 27 73 *=100Washington, DC 37 63 *=100
National TrendApril, 1997 19 81 *=100July, 1993 (Gallup) 15 85 *=100
Q.24 How many recent immigrants would you say live in your area... (READ IN ORDER)?
Only DK/Many Some a few None Refused
National 35 27 27 8 3=100
Chicago 32 32 26 7 3=100Las Vegas 47 24 20 6 3=100Phoenix 47 26 17 7 3=100Raleigh-Durham 47 26 21 4 2=100Washington, DC 46 27 18 4 5=100
National TrendApril, 1997 17 22 37 18 6=100July, 1993 (Gallup) 27 25 34 12 2=100
NO QUESTION 25
ASK ALL:Q.26 Now thinking about our country, which of these is a bigger problem for the United States right now... LEGAL
immigration, ILLEGAL immigration, both equally, OR neither? [RANDOMIZE 1 AND 2 AND READ]?
Legal Illegal Both DK/immigration immigration equally Neither Refused
National 4 60 22 11 3=100
Chicago 3 55 24 15 3=100Las Vegas 3 60 23 12 2=100Phoenix 3 63 21 11 2=100Raleigh-Durham 3 64 20 11 2=100Washington, DC 3 59 21 14 3=100

70
IF BOTH LEGAL AND ILLEGAL IMMIGRATION ARE PROBLEMS [3 IN Q.26] ASK BOTH Q.27 ANDQ.28 IN ROTATION – OTHERWISE FOLLOW INSTRUCTIONS ON Q.27 AND Q.28IF “LEGAL IMMIGRATION” [1 IN Q.26] ASK:Q.27 What is your biggest concern about LEGAL immigration? Is it that it hurts American jobs, it hurts American
customs and its way of life, it increases the danger of terrorism, OR it contributes to crime [READ ANDRANDOMIZE]?
It hurts American It increases (VOL.)It hurts customs and its the danger It contributes (VOL.) Don’t know/
American jobs way of life of terrorism to crime Other RefusedNational 41 17 17 7 10 8=100 (N=465)
Chicago 36 14 20 6 10 14=100 (N=202)Las Vegas 29 19 19 9 9 15=100 (N=120)Phoenix 17 20 18 14 16 15=100 (N=169)Raleigh-Durham 43 13 19 6 13 6=100 (N=177)Washington, DC 33 17 14 8 15 13=100 (N=161)
IF “ILLEGAL IMMIGRATION” [2 IN Q.26] ASK:Q.28 What is your biggest concern about ILLEGAL immigration? Is it that it hurts American jobs, it hurts American
customs and its way of life, it increases the danger of terrorism, OR it contributes to crime [READ ANDRANDOMIZE]?
It hurts American It increases (VOL.)It hurts customs and its the danger It contributes (VOL.) Don’t know/
American jobs way of life of terrorism to crime Other RefusedNational 31 11 27 16 11 4=100 (N=1671)
Chicago 39 11 24 12 9 5=100 (N=636)Las Vegas 27 16 19 23 10 5=100 (N=682)Phoenix 24 12 20 25 11 8=100 (N=679)Raleigh-Durham 29 11 27 18 10 5=100 (N=677)Washington, DC 27 12 23 21 12 5=100 (N=626)
NO QUESTION 29 OR 30
ASK ALL:Q.31 Thinking about all of the immigrants who have moved into your community in recent years: What effect, if
any, do you think these recent immigrants are having on the quality of your local government services? Arethey making things better, making things worse or not making much difference either way?
No recentNot much immigrants Don’t know/
Better Worse difference (VOL.) RefusedNational 7 26 60 2 5=100
Chicago 7 22 64 1 6=100Las Vegas 8 34 52 * 6=100Phoenix 10 41 43 0 6=100Raleigh-Durham 7 36 52 * 5=100Washington, DC 11 25 55 * 9=100

71
Q.32 Do you believe that you or a family member has ever lost a job or not gotten a job because an employer hiredimmigrant workers instead, or don’t you think so?
Don’t know/Yes No Refused
National 16 81 3=100
Chicago 19 78 3=100Las Vegas 20 77 3=100Phoenix 14 84 2=100Raleigh-Durham 20 78 2=100Washington, DC 13 83 4=100
NO QUESTION 33
ASK FORM 1 ONLY:Q.34F1 Do you think most of the people who have moved to the United States in the last few years are here legally, or
are most of them here illegally?
Half and half Don’t know/Legally Illegally (VOL.) Refused
National 35 49 6 10=100 (N=1000)
Chicago 38 45 8 9=100 (N=402)Las Vegas 24 64 6 6=100 (N=401)Phoenix 20 64 7 9=100 (N=399)Raleigh-Durham 32 56 4 8=100 (N=400)Washington, DC 33 48 7 12=100 (N=400)
National TrendsDecember, 2001 (CBS/NY Times) 29 53 3 15=100June, 1993 (CBS/NY Times) 17 68 5 10=100June, 1986 (CBS/NY Times) 32 49 6 13=100
ASK FORM 2 ONLY:Q.35F2 Do you think most of the immigrants who are now living in the United States are here legally, or are most of
them here illegally?Half and half Don’t know/
Legally Illegally (VOL.) RefusedNational 39 44 8 9=100 (N=1000)
Chicago 39 42 9 10=100 (N=399)Las Vegas 27 54 7 12=100 (N=400)Phoenix 26 60 8 6=100 (N=401)Raleigh-Durham 34 51 6 9=100 (N=401)Washington, DC 43 40 6 11=100 (N=400)

4 In October 2005 “mostly” was omitted from the question wording. In July 2005, 2004, 2003 and February 1996 “mostly”was included only in the second half of the question. In 1993 “most likely” was used in place of “mostly”
72
ASK ALL:Q.36 Should LEGAL immigration into the United States be kept at its present level, increased or decreased?
Kept at DK/present level Increased Decreased Refused
National 37 17 40 6=100
Chicago 36 22 35 7=100Las Vegas 38 21 35 6=100Phoenix 37 26 30 7=100Raleigh-Durham 34 22 37 7=100Washington, DC 39 20 33 8=100
Q.37 Do you think the immigrants coming to this country today mostly take jobs away from American citizens, ordo they mostly take jobs Americans don't want? (IF BOTH, ASK:) Well, which do most of them do?
Take Take Both DK/jobs away unwanted jobs (VOL.) Refused
National 24 65 5 6=100
Chicago 23 66 7 4=100Las Vegas 24 66 5 5=100Phoenix 19 72 5 4=100Raleigh-Durham 23 68 5 4=100Washington, DC 15 74 6 5=100
National TrendsOctober, 2005 (CBS)4 31 58 7 4=100July, 2005 (CBS) 33 52 10 5=100January, 2004 (CBS/NY Times) 39 53 4 4=100July, 2003 (CBS/NY Times) 30 59 6 5=100October, 1996 (CBS) 22 67 6 6=100February, 1996 (CBS/NY Times) 39 51 7 4=100December, 1995 (CBS/NY Times) 36 55 n/a 10=100January, 1994 (CBS) 31 52 10 9=100June, 1993 (CBS/NY Times) 36 55 n/a 9=100June, 1986 (CBS/NY Times) 34 52 9 5=100June, 1983 (NY Times) 42 47 n/a 10=100
NO QUESTION 38

5 In 2002, this question was a part of a list of statements.
73
Q.39 Do you think most recent immigrants pay their fair share of taxes, or not?
DK/Yes No Refused
National 33 56 11=100
Chicago 36 56 8=100Las Vegas 38 51 11=100Phoenix 33 57 10=100Raleigh-Durham 29 62 9=100Washington, DC 41 46 13=100
National TrendsMay, 2004 (NPR/Kaiser/Harvard) 33 58 10=101
Q.40 Do you think most recent immigrants do or do not learn English within a reasonable amount of time?
Yes, No, DK/they do they don’t Refused
National 35 58 7=100
Chicago 33 60 7=100Las Vegas 29 66 5=100Phoenix 29 66 5=100Raleigh-Durham 35 58 7=100Washington, DC 39 51 10=100
National TrendsMay, 2004 (NPR/Kaiser/Harvard) 39 55 5=99
NO QUESTION 41
Q.42 Some people say that our American way of life needs to be protected against foreign influence. Would you sayyou completely agree, mostly agree, mostly disagree, or completely disagree with this?
Completely Mostly Mostly Completely DK/agree agree disagree disagree Refused
National 18 36 29 13 4=100
Chicago 15 33 28 21 4=100Las Vegas 17 30 32 19 2=100Phoenix 16 35 27 19 3=100Raleigh-Durham 15 33 32 17 3=100Washington, DC 12 28 34 22 4=100
National TrendsSeptember, 20025 30 34 24 8 4=100

74
ASK NATIONAL SAMPLE FORM 2 ONLY [N=1000]:ASK ALL ON LOCAL SAMPLES:Q.43F2 Thinking now about our political leaders, please tell me how much confidence you have in [RANDOMIZE
AND INSERT] to do the right thing regarding the issue of immigration... do you have a lot of confidence,some confidence, not too much confidence, or no confidence at all?
Not NoA lot of Some too much confidence DK/
confidence confidence confidence at all Refuseda.F2 President Bush
National 12 30 24 32 2=100
Chicago 8 25 22 41 4=100Las Vegas 13 27 21 36 3=100Phoenix 16 31 24 27 2=100Raleigh-Durham 12 27 25 35 1=100Washington, DC 10 27 25 35 3=100
b.F2 The governor of your stateNational 14 40 21 19 6=100
Chicago 11 42 22 19 6=100Las Vegas 16 42 20 15 7=100Phoenix 27 37 18 15 3=100Raleigh-Durham 13 45 24 13 5=100Washington, DC 13 42 18 14 13=100
c.F2 Local government officialsNational 13 43 22 18 4=100
Chicago 12 45 22 14 7=100Las Vegas 13 39 27 16 5=100Phoenix 12 48 23 14 3=100Raleigh-Durham 11 43 29 13 4=100Washington, DC 11 46 25 13 5=100
d.F2 The Democratic Party National 11 42 22 18 7=100
Chicago 14 47 18 15 6=100Las Vegas 12 35 22 23 8=100Phoenix 11 34 25 24 6=100Raleigh-Durham 13 40 26 18 3=100Washington, DC 13 42 21 18 6=100
e.F2 The Republican PartyNational 10 35 25 25 5=100
Chicago 7 32 26 30 5=100Las Vegas 11 32 23 28 6=100Phoenix 12 36 27 20 5=100Raleigh-Durham 9 35 28 25 3=100Washington, DC 10 30 26 29 5=100

75
ASK ALL:I’d like to get your reaction to proposals for dealing with the issue of immigration in the United States.Q.44 First, thinking about immigrants who are now living in the U.S. ILLEGALLY. Should illegal immigrants be
required to go home, or should they be granted some kind of legal status that allows them to stay here?
Required Allowed DK/to go home to stay Refused
National 53 40 7=100
Chicago 45 49 6=100Las Vegas 47 46 7=100Phoenix 44 46 10=100Raleigh-Durham 49 45 6=100Washington, DC 41 49 10=100
ASK IF R FAVORS REQUIRING IMMIGRANTS TO GO HOME [1 IN Q.44]:Q.45 Should it be possible for some illegal immigrants to remain in the U.S. under a temporary worker program
under the condition that they would eventually go home, or don’t you think so?
Some Don’t DK/could stay think so Refused
National 47 51 2=100 (N=1052)
Chicago 43 52 5=100 (N=352)Las Vegas 40 57 3=100 (N=377)Phoenix 50 49 1=100 (N=347)Raleigh-Durham 52 47 1=100 (N=391)Washington, DC 44 52 4=100 (N=330)
ASK IF R FAVORS ALLOWING IMMIGRANTS TO STAY [2 IN Q.44]:Q.46 Should they be allowed to stay only as temporary workers who must eventually return to their home countries,
or should it be possible for them to stay in the U.S. permanently?
All must Possible foreventually them to stay DK/
return home permanently RefusedNational 17 79 4=100 (N=797)
Chicago 13 80 7=100 (N=387)Las Vegas 16 81 3=100 (N=362)Phoenix 13 83 4=100 (N=377)Raleigh-Durham 19 77 4=100 (N=355)Washington, DC 20 75 5=100 (N=387)

76
ASK ALL:Q.47 Would you favor or oppose creating a new government database of everyone eligible to work – both American
citizens and legal immigrants, and requiring employers to check that database before hiring someone for ANYkind of work?
Don’t know/Favor Oppose Refused
National 66 29 5=100
Chicago 65 30 5=100Las Vegas 65 32 3=100Phoenix 63 32 5=100Raleigh-Durham 63 31 6=100Washington, DC 55 40 5=100
Q.48 Would you favor or oppose requiring everyone seeking a new job to have a new kind of driver’s license orSocial Security card that proves they are U.S. citizens or are in the country legally?
Don’t know/Favor Oppose Refused
National 76 21 3=100
Chicago 73 24 3=100Las Vegas 73 24 3=100Phoenix 71 26 3=100Raleigh-Durham 76 22 2=100Washington, DC 67 30 3=100
ASK FORM 1 ONLY:Q.49F1 Should illegal immigrants who are in the U.S. be eligible for social services provided by state and local
governments, or should they not be eligible?
Eligible for Not Don’t know/social services eligible Refused
National 29 67 4=100 (N=1000)
Chicago 35 60 5=100 (N=402)Las Vegas 31 64 5=100 (N=401)Phoenix 33 62 5=100 (N=399)Raleigh-Durham 28 67 5=100 (N=400)Washington, DC 32 62 6=100 (N=400)
ASK FORM 2 ONLY:Q.50F2 Should the children of illegal immigrants who are in the U.S. be permitted to attend public schools, or don’t
you think so?Permitted to attend Don’t Don’t know/
public schools think so RefusedNational 71 26 3=100 (N=1000)
Chicago 75 22 3=100 (N=399)Las Vegas 68 29 3=100 (N=400)Phoenix 70 28 2=100 (N=401)Raleigh-Durham 77 19 4=100 (N=401)Washington, DC 73 23 4=100 (N=400)

77
ASK ALL:Q.51 Which of the following actions do you think would be MOST effective in reducing the number of illegal
immigrants who come to the U.S. across the Mexican border [READ AND RANDOMIZE]
Increasing the Increasing the Building penalties for
number of border more fences employers who hire Don’t know/patrol agents on the border illegal immigrants Refused
National 33 9 49 9=100
Chicago 36 9 43 12=100Las Vegas 31 10 46 13=100Phoenix 32 10 45 13=100Raleigh-Durham 31 7 52 10=100Washington, DC 30 7 50 13=100
Q.52 There are now some groups of people called “Minutemen” who are looking for illegal immigrants along theMexican border in order to report them to the authorities. Do you approve or disapprove of what these groupsare doing, or haven’t you heard anything about them?
Haven’t heard Don’t know/Approve Disapprove about them Refused
National 33 22 42 3=100
Chicago 28 28 41 3=100Las Vegas 39 28 29 4=100Phoenix 50 33 14 3=100Raleigh-Durham 27 24 46 3=100Washington, DC 27 36 32 5=100
Q.53 Were you aware that a child born to illegal immigrants in the U.S. is automatically a U.S. citizen, or weren’tyou aware of that?
Don’t know/Yes, aware No, not aware Refused
National 80 19 1=100
Chicago 82 17 1=100Las Vegas 89 11 *=100Phoenix 90 10 *=100Raleigh-Durham 81 19 *=100Washington, DC 84 15 1=100
Q.54 Would you favor changing the Constitution so that the parents must be legal residents of the U.S. in order fortheir newborn child to be a citizen, or should the Constitution be left as it is?
Favor changing Leave Don’t know/Constitution Constitution as is Refused
National 42 54 4=100
Chicago 36 62 2=100Las Vegas 43 53 4=100Phoenix 43 54 3=100Raleigh-Durham 42 55 3=100Washington, DC 33 63 4=100

78
ASK CHICAGO SAMPLE ONLY [N=801]:CH Should illegal immigrants who graduate from high schools in Illinois be allowed to attend public colleges at in-
state tuition rates, or don’t you think so? Don’t know/
Allowed Don’t think so RefusedChicago 54 41 5=100
ASK LAS VEGAS SAMPLE ONLY [N=801]:LV Do you favor or oppose the creation of government-sponsored hiring centers for day laborers?
Don’t know/Favor Oppose Refused
Las Vegas 49 38 13=100
ASK RALEIGH-DURHAM SAMPLE ONLY [N=801]:NC Do you favor or oppose requiring that local police check the immigration status of people they encounter
during routine activities such as traffic stops?
Don’t know/Favor Oppose Refused
Raleigh-Durham 68 29 3=100
ASK WASHINGTON METRO SAMPLE ONLY [N=800]:DC Do you favor or oppose the creation of government-sponsored hiring centers for day laborers?
Don’t know/Favor Oppose Refused
Washington, DC 54 35 11=100

79
ASK ALL:PARTY In politics TODAY, do you consider yourself a Republican, Democrat, or Independent?
(VOL) (VOL)No Other Don’t
Republican Democrat Independent Preference Party knowNational 27 32 31 6 * 4=100
Chicago 19 41 28 7 * 5=100Las Vegas 31 31 28 6 * 4=100Phoenix 33 24 32 8 * 3=100Raleigh-Durham 26 38 28 4 * 4=100Washington, DC 22 38 29 6 * 5=100
National TrendFebruary, 2006 30 33 31 3 * 3=100January, 2006 28 32 32 5 * 3=100December, 2005 29 34 31 4 * 2=100Late November, 2005 27 34 29 5 1 4=100Early November, 2005 28 34 31 5 * 2=100Late October, 2005 29 33 31 5 * 2=100Early October, 2005 26 34 34 4 * 2=100September 8-11, 2005 31 32 33 3 * 1=100September 6-7, 2005 27 33 33 4 * 3=100July, 2005 31 34 29 4 * 2=100June, 2005 30 32 32 4 * 2=100Mid-May, 2005 30 34 29 4 * 3=100Late March, 2005 29 32 36 2 * 1=100Mid-March, 2005 30 34 29 4 * 3=100February, 2005 31 32 30 4 1 2=100January, 2005 32 33 30 4 * 1=100December, 2004 31 34 30 3 * 2=100
Yearly Totals2005 30 33 31 4 * 2=1002004 30 33 30 4 * 3=1002003 30 31 31 5 * 3=1002002 30 31 30 5 1 3=1002001 29 34 29 5 * 3=100 2001 Post-Sept 11 31 32 28 5 1 3=100 2001 Pre-Sept 11 28 35 30 5 * 2=1002000 28 33 29 6 * 4=1001999 27 33 34 4 * 2=1001998 28 33 32 5 * 2=1001997 28 33 32 4 1 2=100
No Preference/Republican Democrat Independent Other/DK
1996 29 33 33 5=1001995 32 30 34 4=1001994 30 32 34 4=1001993 27 34 34 5=1001992 28 33 35 4=1001991 31 32 33 4=1001990 31 33 30 6=100

80
PARTY CONTINUED... Independent/Rep Dem No Pref/Oth/DK
1989 33 33 34=1001987 26 35 39=100
IF ANSWERED 3, 4, 5 OR 9 IN PARTY ASK:PARTYLN As of today do you lean more to the Republican Party or more to the Democratic Party?
RefusedRepublican Democrat to lean
National 11 15 15=41%
Chicago 10 16 14=40%Las Vegas 8 14 16=38%Phoenix 12 13 18=43%Raleigh-Durham 9 15 12=36%Washington, DC 7 17 16=40%
National TrendFebruary, 2006 11 16 10=37%January, 2006 10 16 14=40%December, 2005 10 16 11=37%Late November, 2005 9 13 17=39%Early November, 2005 11 14 13=38%Late October, 2005 11 15 12=38%Early October, 2005 11 18 11=40%September 8-11, 2005 10 18 9=37%September 6-7, 2005 10 15 15=40%July, 2005 9 15 11=35%June, 2005 10 16 12=38%Mid-May, 2005 9 13 14=36%Late March, 2005 13 17 9=39%December, 2004 14 12 9=35%August, 2003 12 16 14=42%August, 2002 12 13 13=38%September, 2000 11 13 15=39%Late September, 1999 14 15 16=45%August, 1999 15 15 12=42%