numbers, facts and trends shaping the...
TRANSCRIPT

FOR RELEASE FEBRUARY 22, 2016
Smartphone Ownership and Internet Usage Continues to Climb in Emerging Economies But advanced economies still have higher rates of technology use BY Jacob Poushter
FOR MEDIA OR OTHER INQUIRIES:
Jacob Poushter, Senior Researcher
Rhonda Stewart, Senior Communications Manager
202.419.4372
www.pewresearch.org
RECOMMENDED CITATION: Pew Research Center, February, 2016, “Smartphone Ownership and Internet Usage Continues to Climb in Emerging Economies”
NUMBERS, FACTS AND TRENDS SHAPING THE WORLD
1
PEW RESEARCH CENTER
www.pewresearch.org
About Pew Research Center
Pew Research Center is a nonpartisan fact tank that informs the public about the issues, attitudes
and trends shaping America and the world. It does not take policy positions. The Center conducts
public opinion polling, demographic research, content analysis and other data-driven social
science research. It studies U.S. politics and policy; journalism and media; internet, science and
technology; religion and public life; Hispanic trends; global attitudes and trends; and U.S. social
and demographic trends. All of the center’s reports are available at www.pewresearch.org. Pew
Research Center is a subsidiary of The Pew Charitable Trusts, its primary funder.
© Pew Research Center 2016
2
PEW RESEARCH CENTER
www.pewresearch.org
Table of Contents
Overview: Smartphone Ownership and Internet Usage Continues to Climb in Emerging
Economies 4
1. Internet access growing worldwide but remains higher in advanced economies 7
2. Smartphone ownership rates skyrocket in many emerging economies, but digital divide remains 16
3. Social networking very popular among adult internet users in emerging and developing nations 21
Acknowledgments 24
Methodology 25
Appendix A 26
Appendix B 28
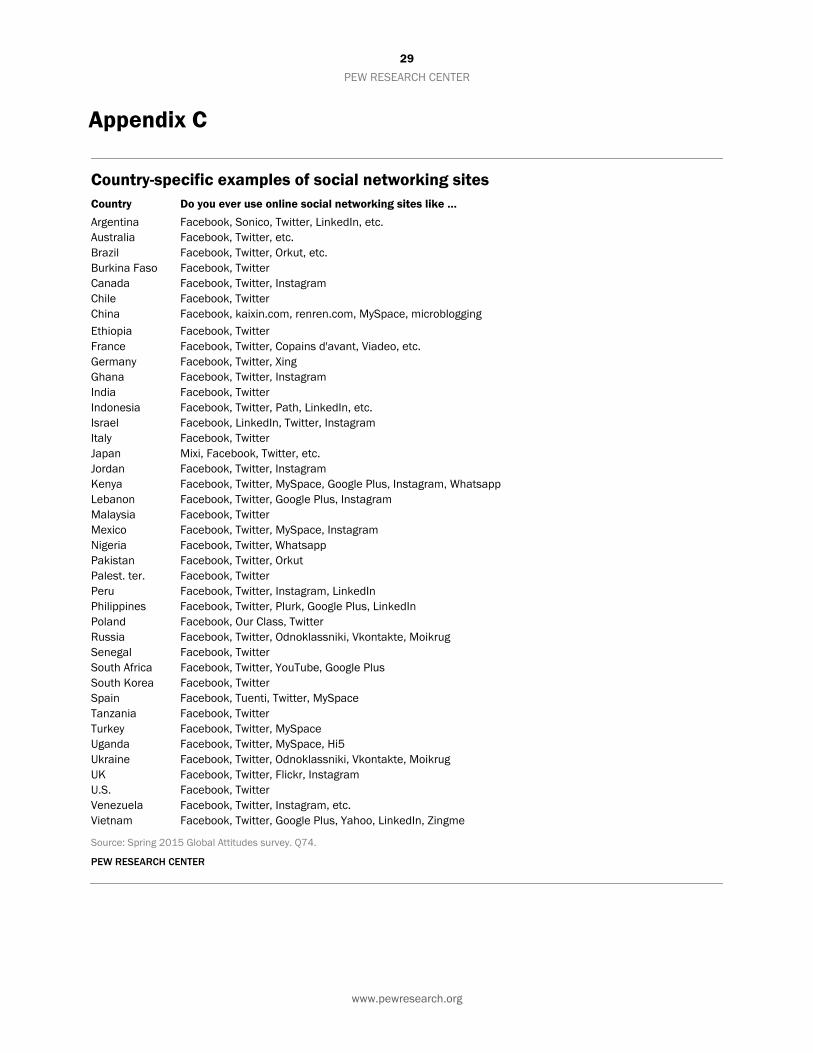
Appendix C 29
Topline Questionnaire 30
3
PEW RESEARCH CENTER
www.pewresearch.org
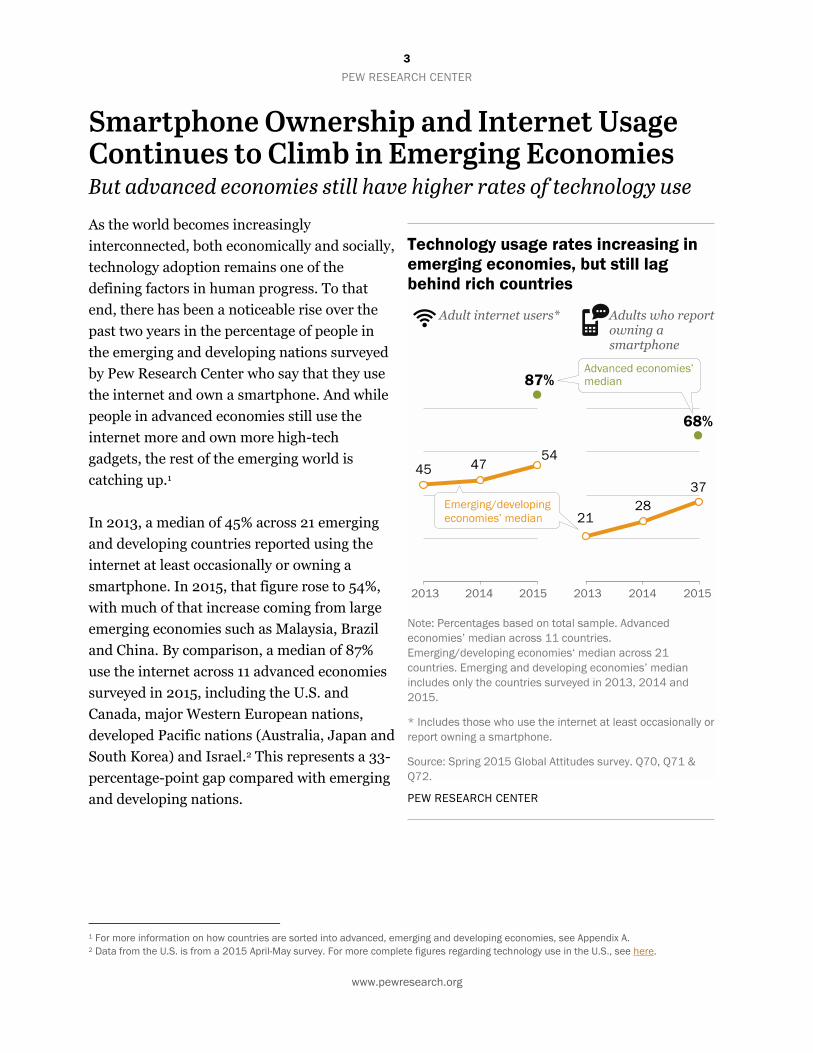
Smartphone Ownership and Internet Usage Continues to Climb in Emerging Economies But advanced economies still have higher rates of technology use As the world becomes increasingly
interconnected, both economically and socially,
technology adoption remains one of the
defining factors in human progress. To that
end, there has been a noticeable rise over the
past two years in the percentage of people in
the emerging and developing nations surveyed
by Pew Research Center who say that they use
the internet and own a smartphone. And while
people in advanced economies still use the
internet more and own more high-tech
gadgets, the rest of the emerging world is
catching up.1
In 2013, a median of 45% across 21 emerging
and developing countries reported using the
internet at least occasionally or owning a
smartphone. In 2015, that figure rose to 54%,
with much of that increase coming from large
emerging economies such as Malaysia, Brazil
and China. By comparison, a median of 87%
use the internet across 11 advanced economies
surveyed in 2015, including the U.S. and
Canada, major Western European nations,
developed Pacific nations (Australia, Japan and
South Korea) and Israel.2 This represents a 33-
percentage-point gap compared with emerging
and developing nations.
1 For more information on how countries are sorted into advanced, emerging and developing economies, see Appendix A. 2 Data from the U.S. is from a 2015 April-May survey. For more complete figures regarding technology use in the U.S., see here.
4
PEW RESEARCH CENTER
www.pewresearch.org
5
PEW RESEARCH CENTER
www.pewresearch.org
86%
82
76
71
66
65
76
Middle East
Latin America
Africa
U.S.
Asia/Pacific
Europe
GLOBAL MEDIAN
For smartphone ownership, the digital divide between less advanced economies and developed
economies is 31 points in 2015. But smartphone ownership rates in emerging and developing
nations are rising at an extraordinary rate, climbing from a median of 21% in 2013 to 37% in 2015.
And overwhelming majorities in almost every nation surveyed report owning some form of mobile
device, even if they are not considered “smartphones.”
While internet access has been rising in emerging and developing nations, those worldwide who
have internet access are voracious users. Roughly three-quarters of adult internet users across the
40 countries surveyed in 2015 say that they use the internet at least once a day, with majorities in
many countries saying that they access the web “several times a day.”
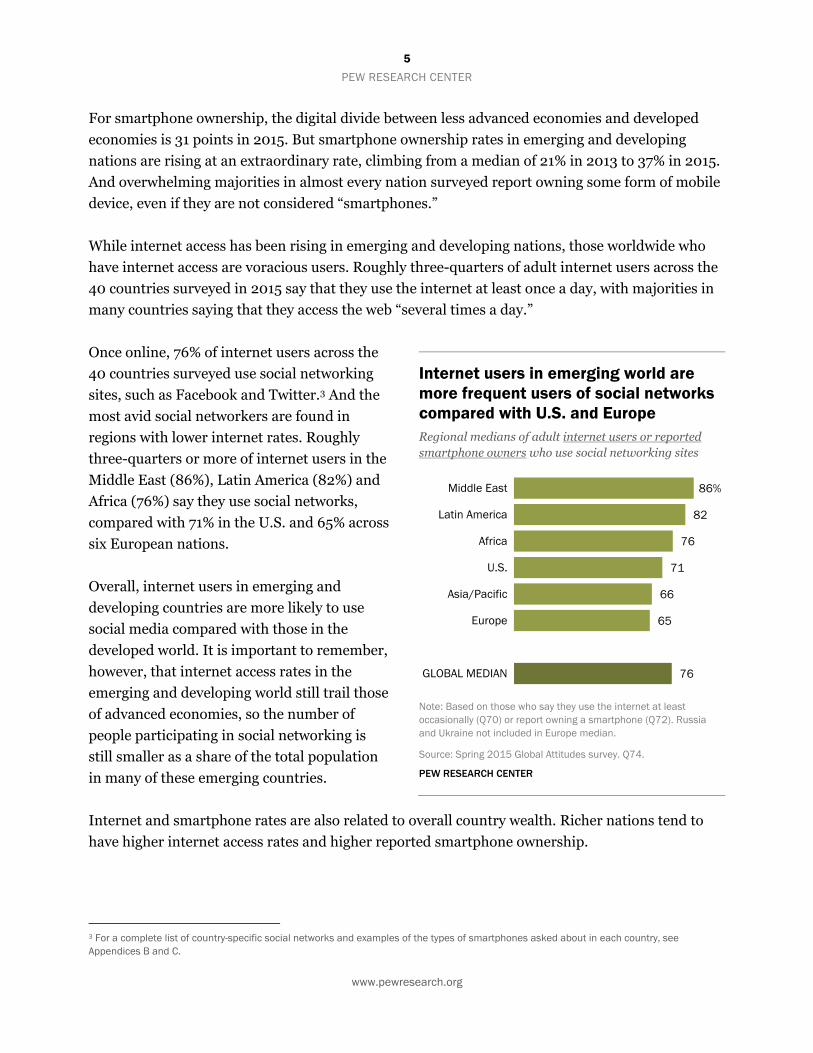
Once online, 76% of internet users across the
40 countries surveyed use social networking
sites, such as Facebook and Twitter.3 And the
most avid social networkers are found in
regions with lower internet rates. Roughly
three-quarters or more of internet users in the
Middle East (86%), Latin America (82%) and
Africa (76%) say they use social networks,
compared with 71% in the U.S. and 65% across
six European nations.
Overall, internet users in emerging and
developing countries are more likely to use
social media compared with those in the
developed world. It is important to remember,
however, that internet access rates in the
emerging and developing world still trail those
of advanced economies, so the number of
people participating in social networking is
still smaller as a share of the total population
in many of these emerging countries.
Internet and smartphone rates are also related to overall country wealth. Richer nations tend to
have higher internet access rates and higher reported smartphone ownership.
3 For a complete list of country-specific social networks and examples of the types of smartphones asked about in each country, see Appendices B and C.
Internet users in emerging world are more frequent users of social networks compared with U.S. and Europe Regional medians of adult internet users or reported smartphone owners who use social networking sites
Note: Based on those who say they use the internet at least occasionally (Q70) or report owning a smartphone (Q72). Russia and Ukraine not included in Europe median.
Source: Spring 2015 Global Attitudes survey. Q74.
PEW RESEARCH CENTER
6
PEW RESEARCH CENTER
www.pewresearch.org
But as people in emerging and developing economies grow richer and become better educated,
technology use is likely to grow. As in previous years, within every country surveyed with sufficient
sample size to analyze, people with more education and higher incomes are more likely to use the
internet or own a smartphone than those with lower incomes and less education. This is true in
both the developing and developed world.
Additionally, within nearly every country, Millennials (those ages 18 to 34) are much more likely to
be internet and smartphone users compared with those ages 35 and older. This significant age gap
appears in both advanced economies and among emerging and developing nations. Younger
internet users also tend to access the internet at least daily and participate in social networking at
higher rates than their older counterparts.
These are among the main findings of a newly released Pew Research Center survey conducted in
40 nations among 45,435 respondents from March 25 to May 27, 2015.
Other key findings from our survey include:
Smartphone ownership rates have skyrocketed in many countries since 2013. This includes
increases of over 25 percentage points among the total population in large emerging
economies such as Turkey (+42 points), Malaysia (+34), Chile (+26) and Brazil (+26).
South Korea stands out as the country with the highest smartphone ownership rate, with
88% of respondents saying they own one. The countries with the least smartphone
ownership rates are also among the poorest: Tanzania (11%), Uganda (4%) and Ethiopia
(4%).
In a number of emerging and developing countries, more people have access to the internet
and are also using it more frequently. In 12 emerging nations surveyed in 2014 and 2015,
there were significant increases in the share of adult internet users who say they access the
internet several times a day, including in Nigeria (+20 points), Ghana (+19) and China
(+13).
There are gender gaps on many aspects of technology use. For example, in 20 nations, men
are more likely than women to use the internet. These differences are especially stark in
African nations. Elsewhere, equal shares of men and women use the internet. But large
gender gaps also appear on reported smartphone ownership (men are more likely to own a
smartphone) in many countries, including Mexico (+16), Nigeria (+13), Kenya (+12) and
Ghana (+12).
7
PEW RESEARCH CENTER
www.pewresearch.org
94%93
908988878685
7875
7272727271
69696867676665
6060
5452
5042
404039
3130
252221
1815118
67
South KoreaAustraliaCanada
U.S.UK
SpainIsrael
GermanyChile
FrancePalest. ter.
ItalyRussiaTurkey
ArgentinaJapan
PolandMalaysia
JordanVenezuela
LebanonChinaBrazil
UkraineMexico
PeruVietnam
South AfricaKenya
PhilippinesNigeria
SenegalIndonesia
GhanaIndia
TanzaniaBurkina Faso
PakistanUgandaEthiopia
GLOBAL MEDIAN
1. Internet access growing worldwide but remains higher in advanced economies
In many advanced economies, the ubiquity of
the internet is now a given. It permeates
commerce, social interactions, politics, culture
and daily life. But this is not the case in all
parts of the world. And while internet access
continues to grow in poorer nations, there is
still a long way to go before the world is
completely wired.
Internet access rates vary by country and region
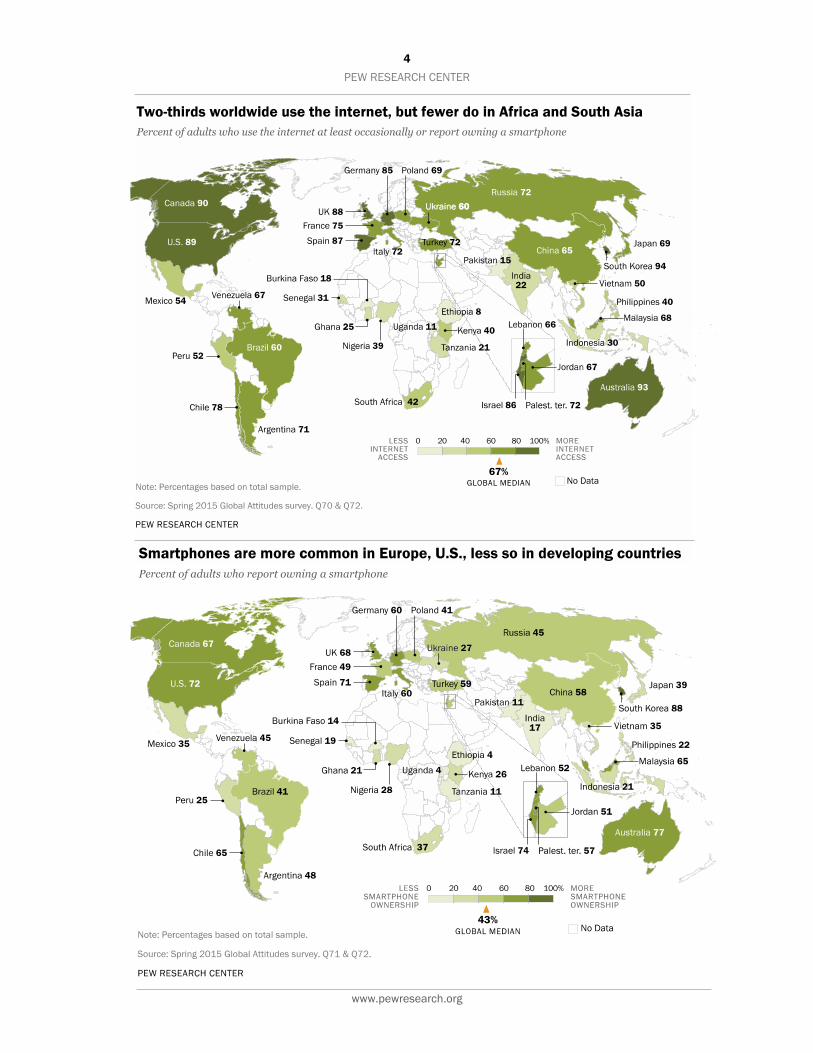
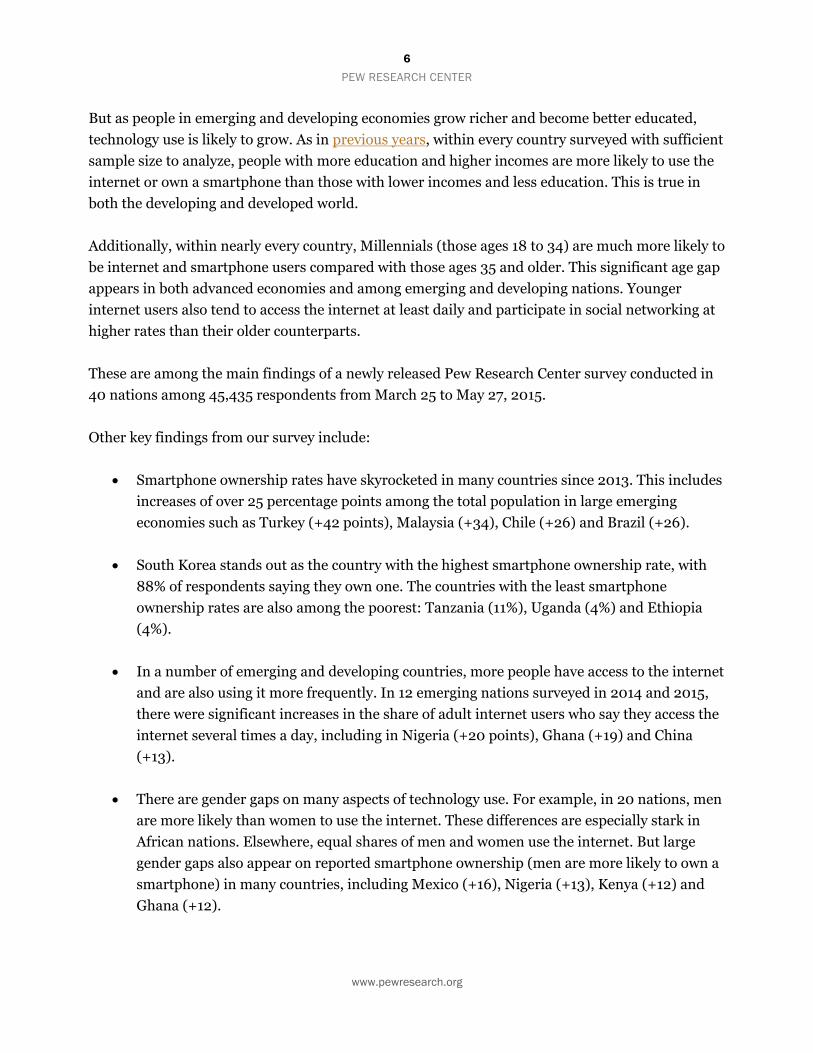
Across the 40 diverse countries surveyed in
2015, a median of 67% say that they either use
the internet occasionally or own a smartphone
(these respondents are automatically classified
as internet users). The highest rates of access
are in South Korea (94%), Australia (93%) and
Canada (90%), but rates of over 80% also
occur in the U.S., UK, Spain, Israel and
Germany.
Many large emerging economies have at least
60% of their population using the internet,
including 72% in Russia and Turkey, 68% in
Malaysia, 65% in China and 60% in Brazil.
Overall, internet rates are lower in poorer
countries, concentrated mostly in sub-Saharan
Africa and parts of Asia, including 39% in
Nigeria, 30% in Indonesia and 22% in India.
The lowest access rates are found in some of
the poorest countries surveyed, such as
Burkina Faso (18%), Pakistan (15%), Uganda
(11%) and Ethiopia (8%).
Most adults in advanced economies use internet, developing countries less so Adults who use the internet at least occasionally or report owning a smartphone
Note: Percentages based on total sample.
Source: Spring 2015 Global Attitudes survey. Q70 & Q72.
PEW RESEARCH CENTER
8
PEW RESEARCH CENTER
www.pewresearch.org
89%
80
72
64
58
25
U.S.
Europe
Middle East
Latin America
Asia/Pacific
Africa
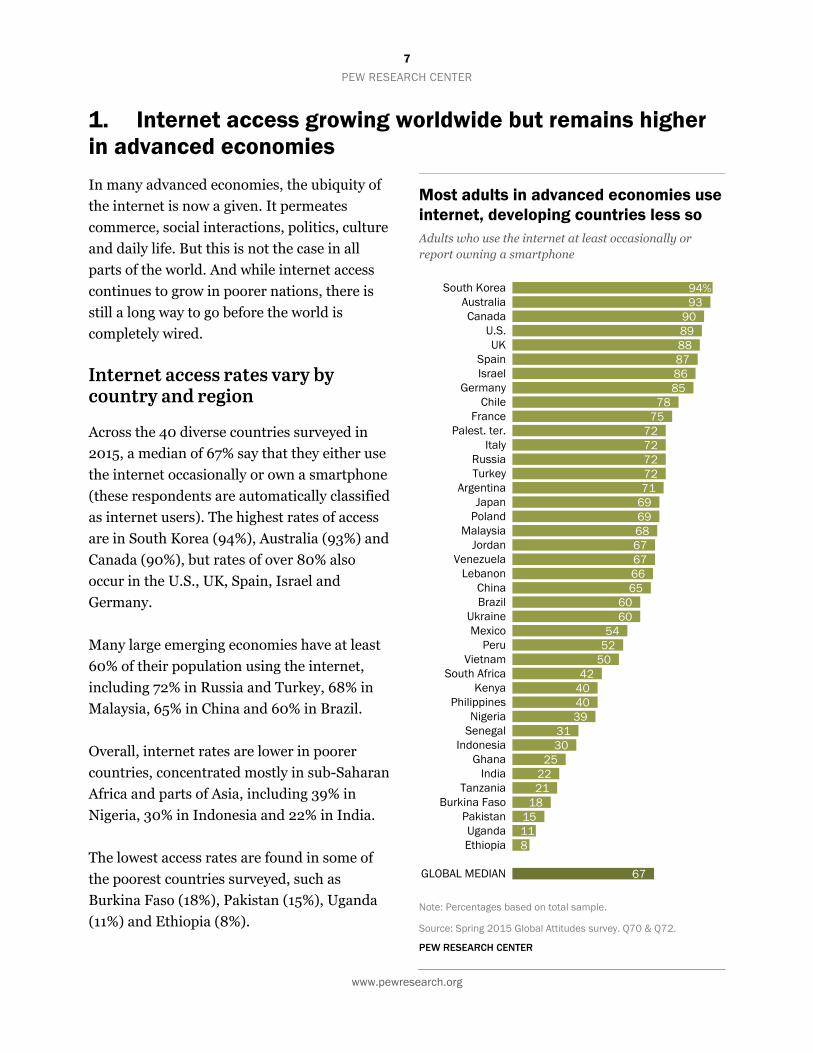
Regionally, more people have access to the
internet in North America and Europe
compared with other parts of the world. Still,
many people in the Middle East have internet
access, including 86% in Israel, 72% in the
Palestinian territories and 67% in Jordan.
In Latin America, a median of 64% have access
to the internet, with the highest rates in Chile
(78%) and Argentina (71%) and the lowest
rates in Mexico (54%) and Peru (52%).
Asian-Pacific nations are quite varied in their
internet access rates. As a result of the wide
range of national incomes, the region includes
the most wired nations in the survey (South
Korea and Australia) along with some of the
least wired (India and Pakistan).
Many of the least economically developed
nations surveyed are in sub-Saharan Africa, and consequently, only a quarter of the adult
population across the nine African nations surveyed has internet access.
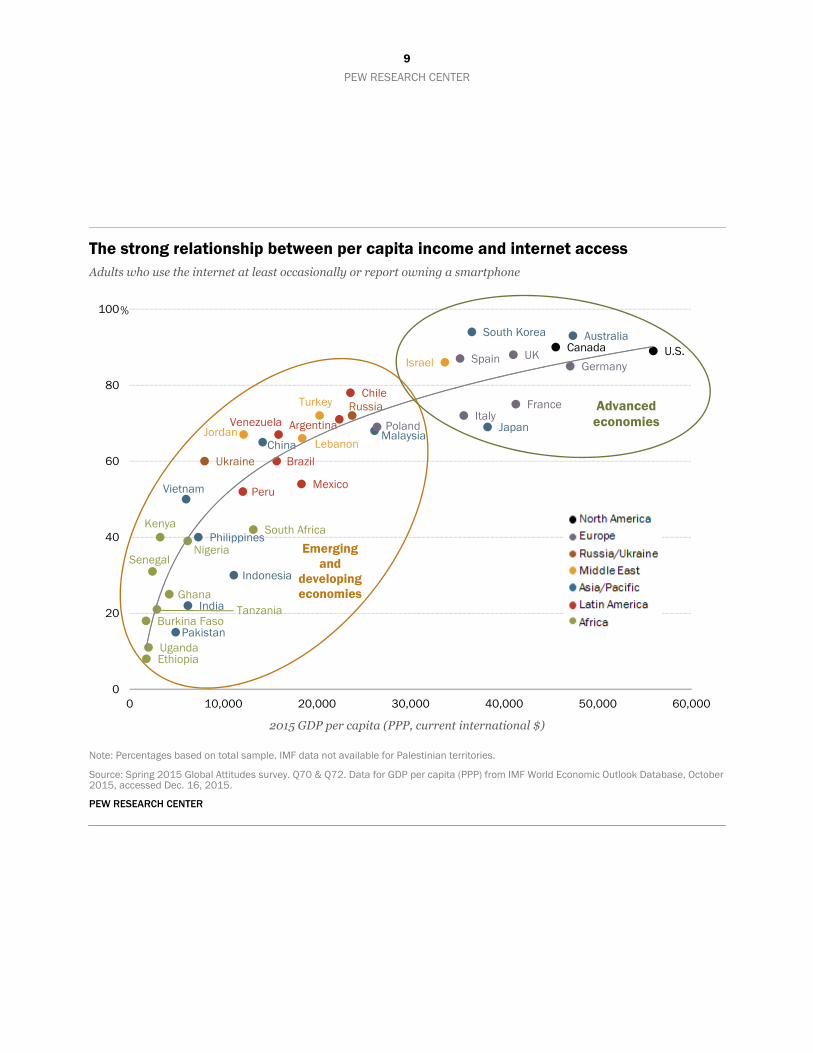
There is a strong correlation (0.87) between country wealth (as measured by per-capita gross
domestic product on a purchasing power-adjusted basis) and internet access. Poorer nations, such
as those in South and Southeast Asia and sub-Saharan Africa, have much lower internet rates
compared with richer developing countries in Latin America and the Middle East, as well as rich
nations in Europe, North America and East Asia and the Pacific.
It should be noted that since most advanced economies in the survey have internet access rates of
three-quarters or more, there does seem to be a base level of economic development at which
national wealth no longer affects internet rates. For example, GDP per capita in South Korea is
about $20,000 less, in adjusted terms, than GDP per capita in the U.S.; yet more South Koreans
have access to the internet compared with Americans. In other words, as the internet becomes
more ubiquitous worldwide, national wealth may no longer be the major driving force behind
access.
Internet users predominate across regions, except in Africa Regional medians of adults who use the internet at least occasionally or report owning a smartphone
Note: Percentages based on total sample. Russia and Ukraine not included in Europe median.
Source: Spring 2015 Global Attitudes survey. Q70 & Q72.
PEW RESEARCH CENTER
9
PEW RESEARCH CENTER
Argentina
Australia
Brazil
Burkina Faso
Canada
Chile
China
Ethiopia
France
Germany
GhanaIndia
Indonesia
Israel
ItalyJapanJordan
Kenya
LebanonMalaysia
Mexico
Nigeria
Pakistan
Peru
Philippines
Poland
Russia
Senegal
South Africa
South Korea
Spain
Tanzania
Turkey
U.S.
Uganda
UK
Ukraine
Venezuela
Vietnam
0
20
40
60
80
100
0 10,000 20,000 30,000 40,000 50,000 60,000
2015 GDP per capita (PPP, current international $)
%
Emerging and
developing economies
Advanced economies
The strong relationship between per capita income and internet access Adults who use the internet at least occasionally or report owning a smartphone
Note: Percentages based on total sample. IMF data not available for Palestinian territories.
Source: Spring 2015 Global Attitudes survey. Q70 & Q72. Data for GDP per capita (PPP) from IMF World Economic Outlook Database, October 2015, accessed Dec. 16, 2015.
PEW RESEARCH CENTER
10
PEW RESEARCH CENTER
www.pewresearch.org
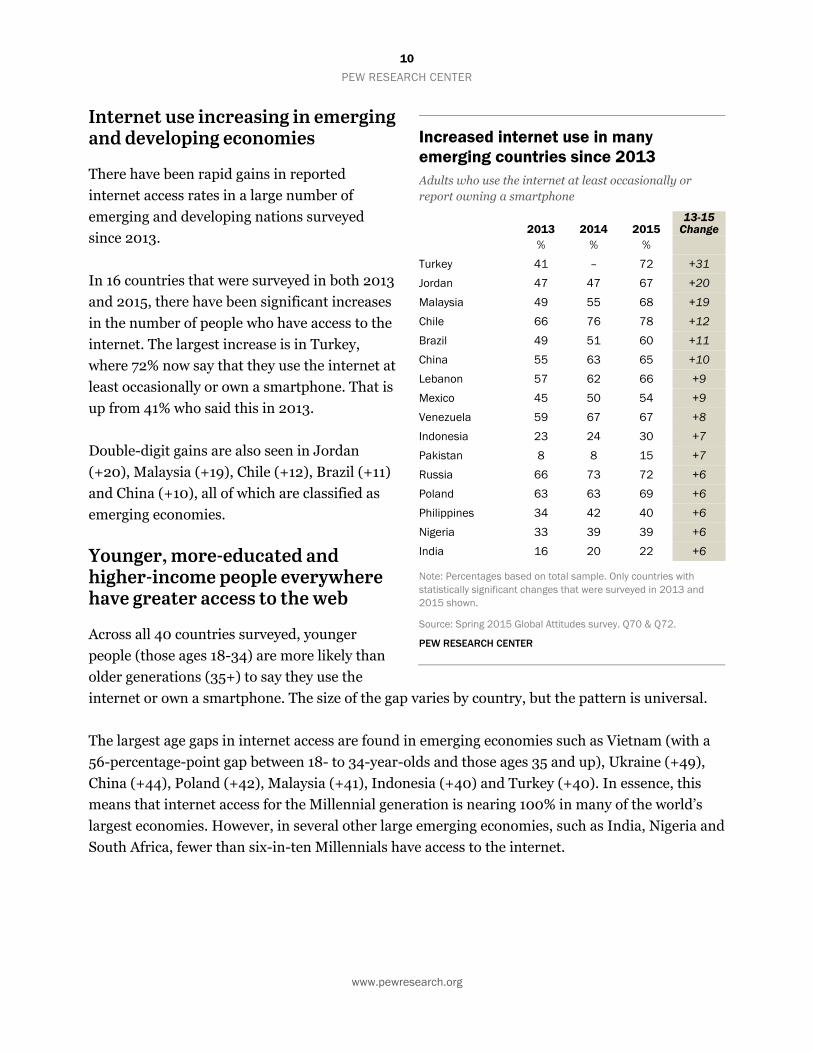
Internet use increasing in emerging and developing economies
There have been rapid gains in reported
internet access rates in a large number of
emerging and developing nations surveyed
since 2013.
In 16 countries that were surveyed in both 2013
and 2015, there have been significant increases
in the number of people who have access to the
internet. The largest increase is in Turkey,
where 72% now say that they use the internet at
least occasionally or own a smartphone. That is
up from 41% who said this in 2013.
Double-digit gains are also seen in Jordan
(+20), Malaysia (+19), Chile (+12), Brazil (+11)
and China (+10), all of which are classified as
emerging economies.
Younger, more-educated and higher-income people everywhere have greater access to the web
Across all 40 countries surveyed, younger
people (those ages 18-34) are more likely than
older generations (35+) to say they use the
internet or own a smartphone. The size of the gap varies by country, but the pattern is universal.
The largest age gaps in internet access are found in emerging economies such as Vietnam (with a
56-percentage-point gap between 18- to 34-year-olds and those ages 35 and up), Ukraine (+49),
China (+44), Poland (+42), Malaysia (+41), Indonesia (+40) and Turkey (+40). In essence, this
means that internet access for the Millennial generation is nearing 100% in many of the world’s
largest economies. However, in several other large emerging economies, such as India, Nigeria and
South Africa, fewer than six-in-ten Millennials have access to the internet.
Increased internet use in many emerging countries since 2013 Adults who use the internet at least occasionally or report owning a smartphone
2013 2014 2015 13-15
Change % % %
Turkey 41 – 72 +31
Jordan 47 47 67 +20
Malaysia 49 55 68 +19
Chile 66 76 78 +12
Brazil 49 51 60 +11
China 55 63 65 +10
Lebanon 57 62 66 +9
Mexico 45 50 54 +9
Venezuela 59 67 67 +8
Indonesia 23 24 30 +7
Pakistan 8 8 15 +7
Russia 66 73 72 +6
Poland 63 63 69 +6
Philippines 34 42 40 +6
Nigeria 33 39 39 +6
India 16 20 22 +6
Note: Percentages based on total sample. Only countries with statistically significant changes that were surveyed in 2013 and 2015 shown.
Source: Spring 2015 Global Attitudes survey. Q70 & Q72.
PEW RESEARCH CENTER
11
PEW RESEARCH CENTER
www.pewresearch.org
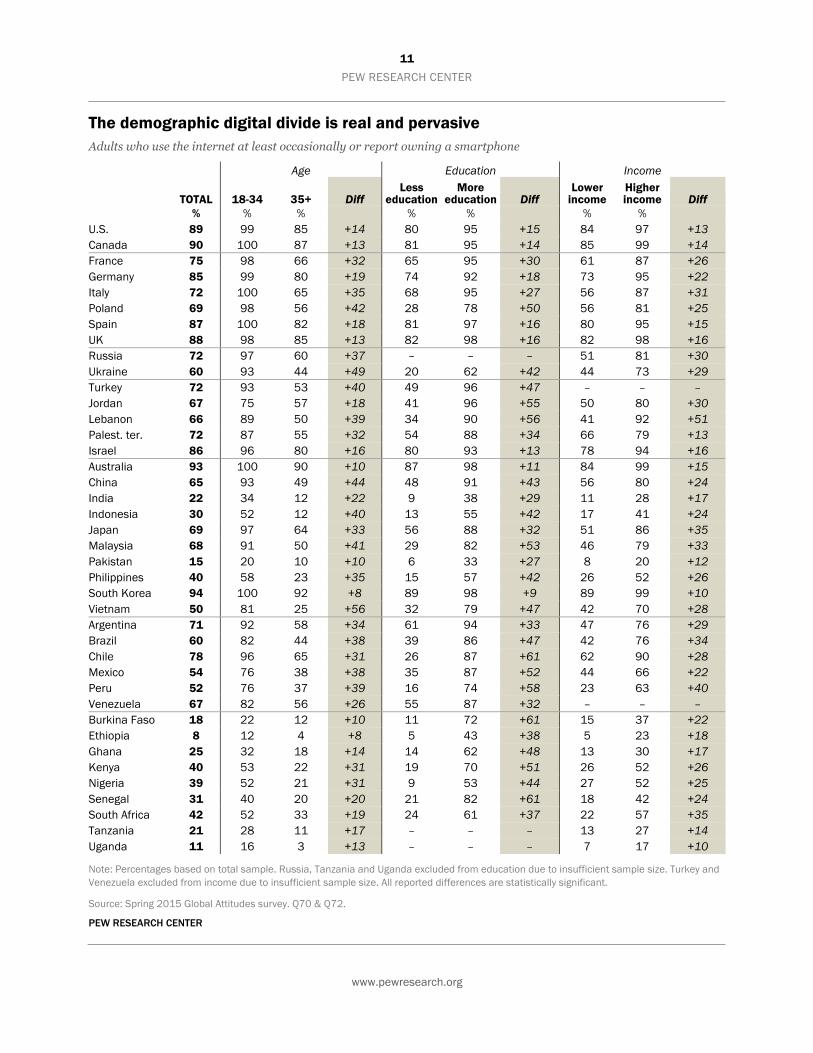
The demographic digital divide is real and pervasive Adults who use the internet at least occasionally or report owning a smartphone
Age Education Income
TOTAL 18-34 35+ Diff Less
education More
education Diff Lower
income Higher income Diff
% % % % % % % U.S. 89 99 85 +14 80 95 +15 84 97 +13 Canada 90 100 87 +13 81 95 +14 85 99 +14 France 75 98 66 +32 65 95 +30 61 87 +26 Germany 85 99 80 +19 74 92 +18 73 95 +22 Italy 72 100 65 +35 68 95 +27 56 87 +31 Poland 69 98 56 +42 28 78 +50 56 81 +25 Spain 87 100 82 +18 81 97 +16 80 95 +15 UK 88 98 85 +13 82 98 +16 82 98 +16 Russia 72 97 60 +37 – – – 51 81 +30 Ukraine 60 93 44 +49 20 62 +42 44 73 +29 Turkey 72 93 53 +40 49 96 +47 – – – Jordan 67 75 57 +18 41 96 +55 50 80 +30 Lebanon 66 89 50 +39 34 90 +56 41 92 +51 Palest. ter. 72 87 55 +32 54 88 +34 66 79 +13 Israel 86 96 80 +16 80 93 +13 78 94 +16 Australia 93 100 90 +10 87 98 +11 84 99 +15 China 65 93 49 +44 48 91 +43 56 80 +24 India 22 34 12 +22 9 38 +29 11 28 +17 Indonesia 30 52 12 +40 13 55 +42 17 41 +24 Japan 69 97 64 +33 56 88 +32 51 86 +35 Malaysia 68 91 50 +41 29 82 +53 46 79 +33 Pakistan 15 20 10 +10 6 33 +27 8 20 +12 Philippines 40 58 23 +35 15 57 +42 26 52 +26 South Korea 94 100 92 +8 89 98 +9 89 99 +10 Vietnam 50 81 25 +56 32 79 +47 42 70 +28 Argentina 71 92 58 +34 61 94 +33 47 76 +29 Brazil 60 82 44 +38 39 86 +47 42 76 +34 Chile 78 96 65 +31 26 87 +61 62 90 +28 Mexico 54 76 38 +38 35 87 +52 44 66 +22 Peru 52 76 37 +39 16 74 +58 23 63 +40 Venezuela 67 82 56 +26 55 87 +32 – – – Burkina Faso 18 22 12 +10 11 72 +61 15 37 +22 Ethiopia 8 12 4 +8 5 43 +38 5 23 +18 Ghana 25 32 18 +14 14 62 +48 13 30 +17 Kenya 40 53 22 +31 19 70 +51 26 52 +26 Nigeria 39 52 21 +31 9 53 +44 27 52 +25 Senegal 31 40 20 +20 21 82 +61 18 42 +24 South Africa 42 52 33 +19 24 61 +37 22 57 +35 Tanzania 21 28 11 +17 – – – 13 27 +14 Uganda 11 16 3 +13 – – – 7 17 +10
Note: Percentages based on total sample. Russia, Tanzania and Uganda excluded from education due to insufficient sample size. Turkey and Venezuela excluded from income due to insufficient sample size. All reported differences are statistically significant.
Source: Spring 2015 Global Attitudes survey. Q70 & Q72.
PEW RESEARCH CENTER
12
PEW RESEARCH CENTER
www.pewresearch.org
While differences by age are not as stark in a number of rich countries, such as the U.S., the UK
and Canada, there are still statistically significant age gaps on internet usage in all the advanced
economies surveyed. In many of these countries, such as Italy, Spain, Germany, Australia and
South Korea, virtually the entire Millennial generation is already online.
A similar and also nearly universal pattern holds for differences in internet usage between more-
educated and less-educated people. In all 37 countries where there are subsamples large enough to
analyze, people with more education are more likely to have internet access than those with less
education.4 This includes education gaps of 50 percentage points or more in Chile, Burkina Faso,
Senegal, Peru, Lebanon, Jordan, Malaysia, Mexico, Kenya and Poland. As with age, these gaps are
much smaller in the advanced economies surveyed, but are still significant.
Additionally, in all 38 countries surveyed with sufficient sample sizes for analysis, people with
higher incomes are more likely to say that they use the internet occasionally or own a
smartphone.5 These in-country gaps by income are less uniformly distributed across richer or
poorer nations. For example, the largest income gaps occur in a diverse set of countries including
Lebanon (51-point gap between higher and lower income), Peru (+40), Japan (+35), South Africa
(+35), Brazil (+34), Malaysia (+33), Italy (+30), Russia (+30) and Jordan (+30).
4 For the purpose of comparing educational groups across countries, we standardize education levels based on the UN’s International Standard Classification of Education (ISCED). The lower education category is below secondary education and the higher category is secondary or above in Argentina, Brazil, Burkina Faso, Chile, China, Ethiopia, Ghana, India, Indonesia, Jordan, Kenya, Lebanon, Malaysia, Mexico, Nigeria, Pakistan, Palestinian territories, Peru, Philippines, Poland, Senegal, South Africa, Turkey, Ukraine, Venezuela and Vietnam. The lower education category is secondary education or below and the higher category is post-secondary or above in Australia, Canada, France, Germany, Israel, Italy, Japan, South Korea, Spain, UK and U.S. 5 Respondents with a household income below the approximate country median are considered lower income. Those with an income at or above the approximate country median are considered higher income.

13
PEW RESEARCH CENTER
www.pewresearch.org
Men have greater access to the internet than women in many nations
While gender is less determinative than youth,
education and income in whether someone has
internet access, there are significant gender
gaps in half of the countries surveyed. The
gender divide appears in all of the sub-Saharan
African nations surveyed.
The largest gap among all countries surveyed
occurs in Nigeria, where 48% of men say they
use the internet versus only 29% of women.
Double-digit gender gaps also appear in Kenya,
Ghana, Vietnam, Tanzania, Pakistan, the
Palestinian territories, Japan, Burkina Faso,
India and Uganda. But there are also
statistically significant gender differences on
internet access in prominent European nations,
such as France, Germany and the UK.
In many countries, men are more likely than women to use the internet Adults who use the internet at least occasionally or report owning a smartphone
Women Men Diff % %
Nigeria 29 48 +19
Kenya 31 49 +18
Ghana 18 33 +15
Vietnam 44 57 +13
Tanzania 15 28 +13
Pakistan 9 22 +13
Palest. ter. 67 78 +11
Japan 64 75 +11
Burkina Faso 12 23 +11
India 17 27 +10
Uganda 6 16 +10
France 71 80 +9
Mexico 50 59 +9
Peru 48 57 +9
Germany 81 89 +8
Ukraine 56 64 +8
Ethiopia 4 12 +8
South Africa 39 46 +7
Senegal 27 34 +7
UK 85 91 +6
Note: Percentages based on total sample. Only statistically significant differences shown.
Source: Spring 2015 Global Attitudes survey. Q70 & Q72.
PEW RESEARCH CENTER

14
PEW RESEARCH CENTER
www.pewresearch.org
77%7070706969686767
656463
5858585858575757
5554
5150
4847474746
444342
3932
292827
2524
16
56
14%2220
17191718
17151821
1626
22181817
25222025
152428
1437
2118
2821
142029
2312141723
1725
20
9%9
1012111515
15181814
1815
19201921
16162318
302321
3517
3029
2534
4027
2845
59595346
4145
21
AustraliaLebanonCanada
ItalyIsrael
U.S.UK
ChileJapan
FranceSpain
MalaysiaSouth Korea
ArgentinaBrazil
NigeriaChina
TurkeyPalest. ter.
GermanyRussiaGhanaMexicoPoland
TanzaniaJordan
VietnamSouth Africa
UkraineKenya
IndonesiaIndia
VenezuelaPeru
SenegalBurkina Faso
UgandaPhilippines
PakistanEthiopia
GLOBAL MEDIAN
Several times a dayOnce a dayAt least once a week or less
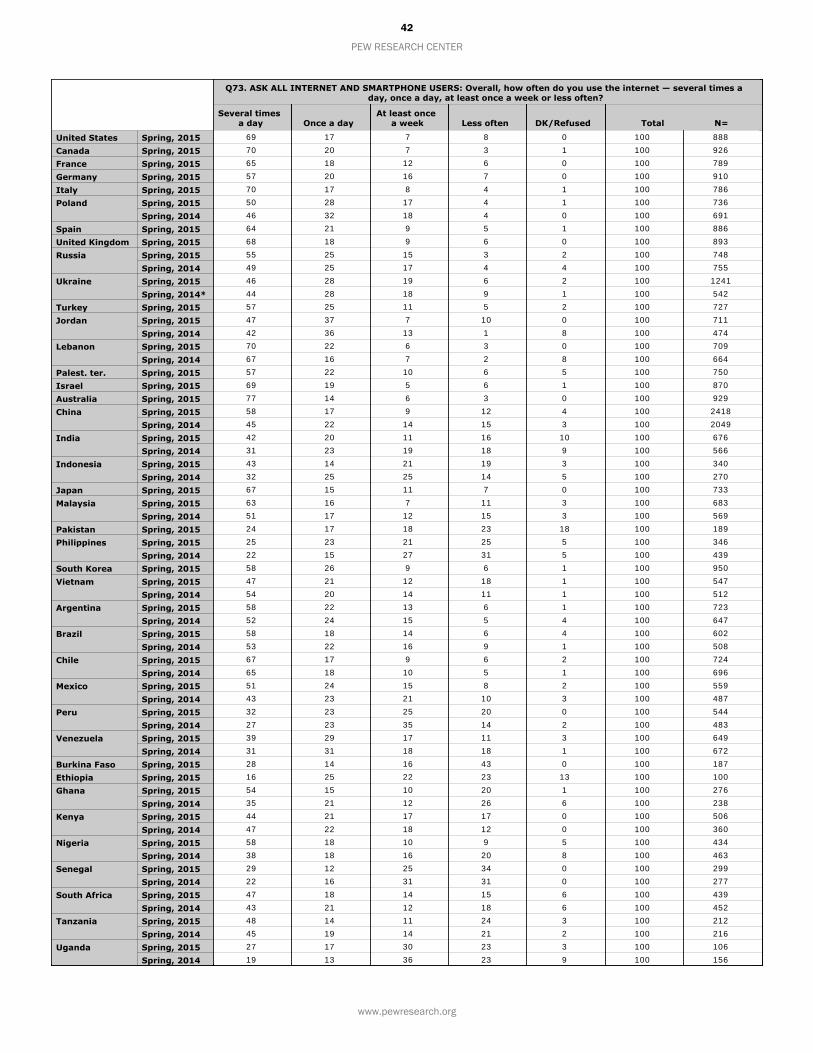
Daily internet use is fairly common globally
Once online, people around the world are
frequent internet users. And while daily use is
more common within advanced economies, a
majority of internet users in 34 of the 40
countries surveyed say they use the internet at
least once a day.
The most frequent users – those who say that
they access the internet “several times a day” –
are mainly concentrated in advanced
economies, with a few notable exceptions.
Seven-in-ten or more of internet users in
Australia (77%), Lebanon (70%), Canada
(70%) and Italy (70%) say they use the
internet several times a day. Similar
percentages of internet users also say this in
Israel, the U.S., UK, Chile and Japan.
Despite South Korea being the country with
the highest levels of internet access in the
survey, only 58% say they utilize the internet
more than once a day. This is more similar to
the behavior of online Argentines, Nigerians,
Brazilians and Chinese – all of whose
countries see access rates far lower than that
of South Korea.
At the lower end of daily internet usage are
some of the countries with lower overall levels
of internet access, including many sub-
Saharan African and South and Southeast
Asian nations. Still, even among internet users
in these countries, at least four-in-ten choose
to access it daily.
As with overall internet rates, there has been
an increase in the share of internet users who
report use several times a day in many of these
Majority of internet users in most countries are daily users Adult internet users or reported smartphone owners who access the internet …
Note: Based on those who say they use the internet at least occasionally (Q70) or report owning a smartphone (Q72).
Source: Spring 2015 Global Attitudes survey. Q73.
PEW RESEARCH CENTER
15
PEW RESEARCH CENTER
www.pewresearch.org
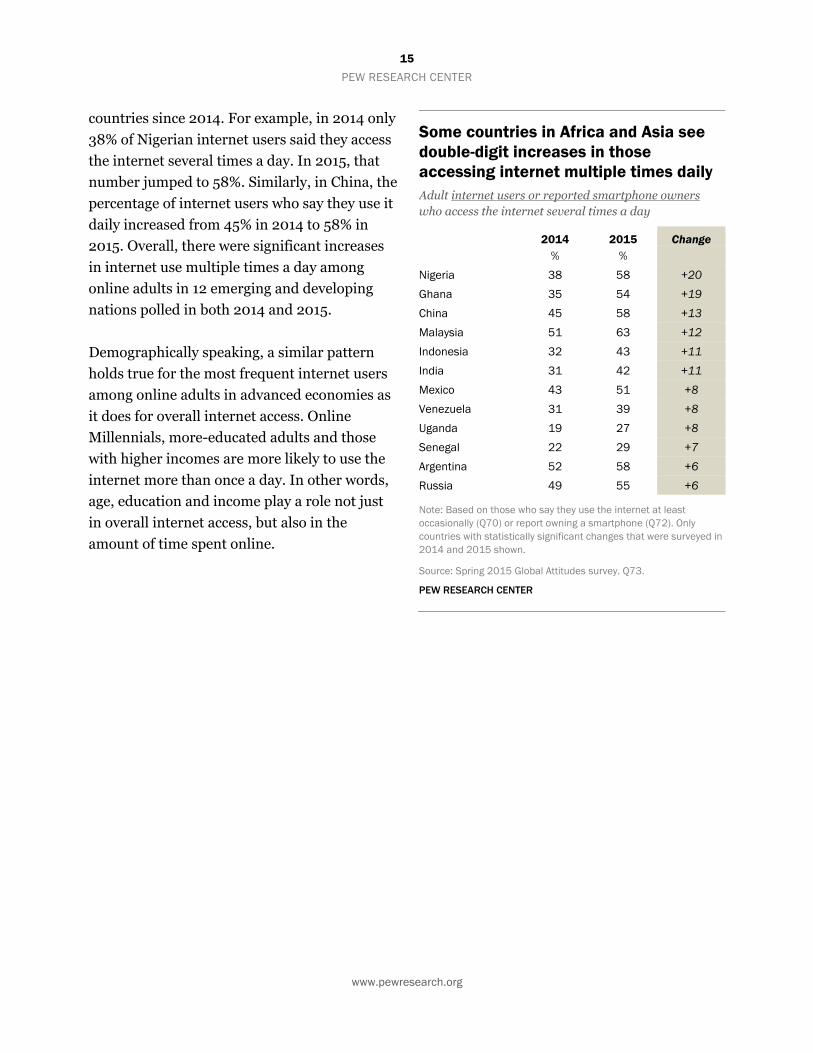
countries since 2014. For example, in 2014 only
38% of Nigerian internet users said they access
the internet several times a day. In 2015, that
number jumped to 58%. Similarly, in China, the
percentage of internet users who say they use it
daily increased from 45% in 2014 to 58% in
2015. Overall, there were significant increases
in internet use multiple times a day among
online adults in 12 emerging and developing
nations polled in both 2014 and 2015.
Demographically speaking, a similar pattern
holds true for the most frequent internet users
among online adults in advanced economies as
it does for overall internet access. Online
Millennials, more-educated adults and those
with higher incomes are more likely to use the
internet more than once a day. In other words,
age, education and income play a role not just
in overall internet access, but also in the
amount of time spent online.
Some countries in Africa and Asia see double-digit increases in those accessing internet multiple times daily Adult internet users or reported smartphone owners who access the internet several times a day
2014 2015 Change % %
Nigeria 38 58 +20
Ghana 35 54 +19
China 45 58 +13
Malaysia 51 63 +12
Indonesia 32 43 +11
India 31 42 +11
Mexico 43 51 +8
Venezuela 31 39 +8
Uganda 19 27 +8
Senegal 22 29 +7
Argentina 52 58 +6
Russia 49 55 +6
Note: Based on those who say they use the internet at least occasionally (Q70) or report owning a smartphone (Q72). Only countries with statistically significant changes that were surveyed in 2014 and 2015 shown.
Source: Spring 2015 Global Attitudes survey. Q73.
PEW RESEARCH CENTER
16
PEW RESEARCH CENTER
www.pewresearch.org
88%77
747271
6867
6565
6060595857
5251
4948
4545
4141
3937
3535
28272625
222121
1917
14111144
12%1623
1925
2316
2828
34343638
3536
4736
3451
3847455052
5236
6264
5653
48565463
6165
6246
5344
63
94
817
776553
812
215
184
161215111014
281110
1822
302325
172221
274443
52
South KoreaAustralia
IsraelU.S.
SpainUK
CanadaChile
MalaysiaGermany
ItalyTurkeyChina
Palest. ter.Lebanon
JordanFrance
ArgentinaRussia
VenezuelaPoland
BrazilJapan
South AfricaVietnam
MexicoNigeria
UkraineKenya
PeruPhilippinesIndonesia
GhanaSenegal
IndiaBurkina Faso
TanzaniaPakistanUgandaEthiopia
SmartphoneCellphone but NOT smartphoneNo cellphone
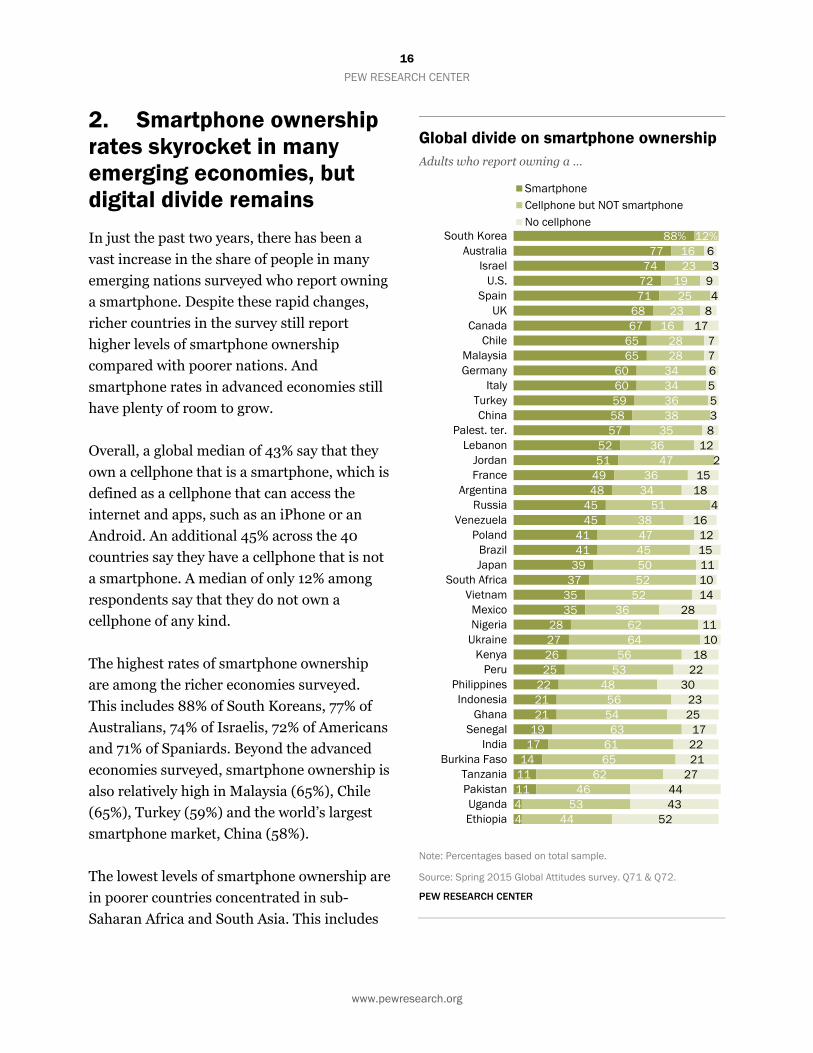
2. Smartphone ownership rates skyrocket in many emerging economies, but digital divide remains
In just the past two years, there has been a
vast increase in the share of people in many
emerging nations surveyed who report owning
a smartphone. Despite these rapid changes,
richer countries in the survey still report
higher levels of smartphone ownership
compared with poorer nations. And
smartphone rates in advanced economies still
have plenty of room to grow.
Overall, a global median of 43% say that they
own a cellphone that is a smartphone, which is
defined as a cellphone that can access the
internet and apps, such as an iPhone or an
Android. An additional 45% across the 40
countries say they have a cellphone that is not
a smartphone. A median of only 12% among
respondents say that they do not own a
cellphone of any kind.
The highest rates of smartphone ownership
are among the richer economies surveyed.
This includes 88% of South Koreans, 77% of
Australians, 74% of Israelis, 72% of Americans
and 71% of Spaniards. Beyond the advanced
economies surveyed, smartphone ownership is
also relatively high in Malaysia (65%), Chile
(65%), Turkey (59%) and the world’s largest
smartphone market, China (58%).
The lowest levels of smartphone ownership are
in poorer countries concentrated in sub-
Saharan Africa and South Asia. This includes
Global divide on smartphone ownership Adults who report owning a …
Note: Percentages based on total sample.
Source: Spring 2015 Global Attitudes survey. Q71 & Q72.
PEW RESEARCH CENTER
17
PEW RESEARCH CENTER
www.pewresearch.org
Argentina
Australia
Brazil
Burkina Faso
CanadaChile
China
Ethiopia
France
Germany
GhanaIndia
Indonesia
Israel
Italy
Japan
Jordan
Kenya
Lebanon
Malaysia
MexicoNigeria
Pakistan
PeruPhilippines
PolandRussia
Senegal
South Africa
South Korea
Spain
Tanzania
Turkey
U.S.
Uganda
UK
Ukraine
Venezuela
Vietnam
0
20
40
60
80
100
0 10,000 20,000 30,000 40,000 50,000 60,000
2015 GDP per capita (PPP, current international $)
%
Correlation = 0.84
Emerging and developing economies
Advanced economies
smartphone ownership rates of two-in-ten or less in Senegal (19%), India (17%), Burkina Faso
(14%), Tanzania (11%), Pakistan (11%), Uganda (4%) and Ethiopia (4%).
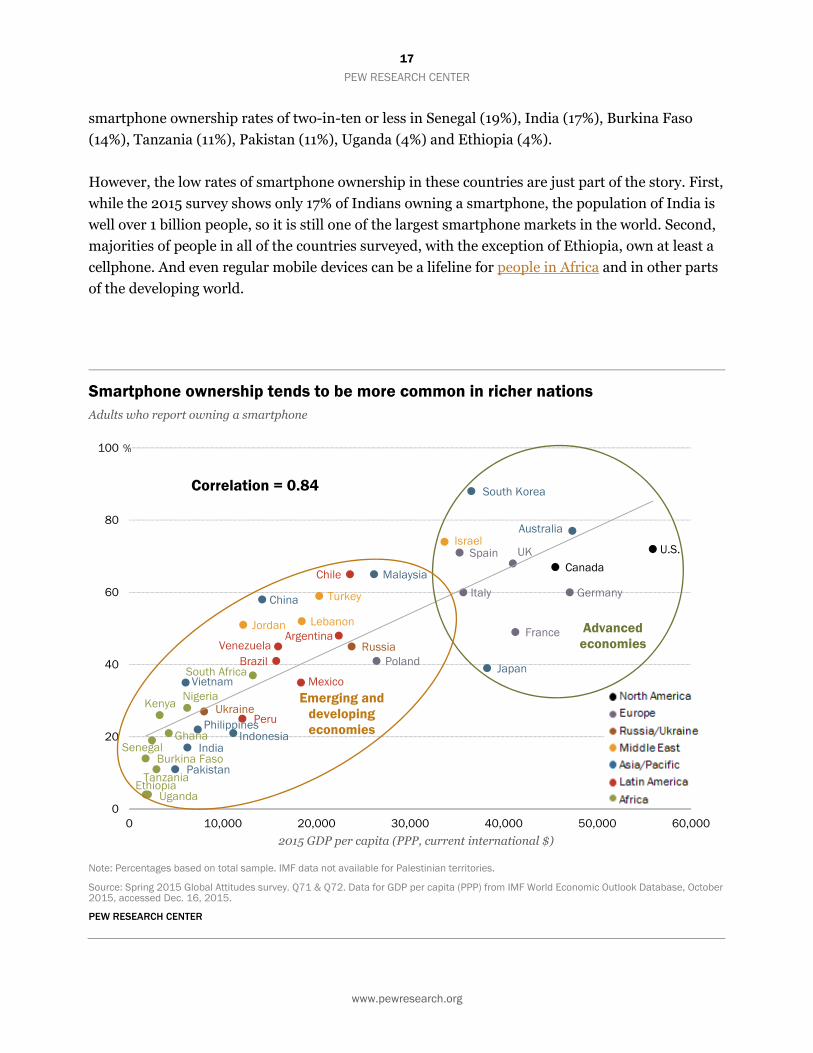
However, the low rates of smartphone ownership in these countries are just part of the story. First,
while the 2015 survey shows only 17% of Indians owning a smartphone, the population of India is
well over 1 billion people, so it is still one of the largest smartphone markets in the world. Second,
majorities of people in all of the countries surveyed, with the exception of Ethiopia, own at least a
cellphone. And even regular mobile devices can be a lifeline for people in Africa and in other parts
of the developing world.
Smartphone ownership tends to be more common in richer nations Adults who report owning a smartphone
Note: Percentages based on total sample. IMF data not available for Palestinian territories.
Source: Spring 2015 Global Attitudes survey. Q71 & Q72. Data for GDP per capita (PPP) from IMF World Economic Outlook Database, October 2015, accessed Dec. 16, 2015.
PEW RESEARCH CENTER
18
PEW RESEARCH CENTER
www.pewresearch.org
72%
60
57
43
37
19
43
19%
34
36
37
47
56
45
9%
7
5
17
13
21
U.S.
Europe
Middle East
Latin America
Asia/Pacific
Africa
GLOBAL MEDIAN
SmartphoneCellphone but NOT smartphoneNo cellphone
As with internet usage, there is a strong
correlation between country wealth and
smartphone ownership (0.84). As countries
get richer, and smartphones go down in price,
it is likely that this relationship between
country wealth and smartphone ownership
will begin to diminish as it has for overall
cellphone ownership.
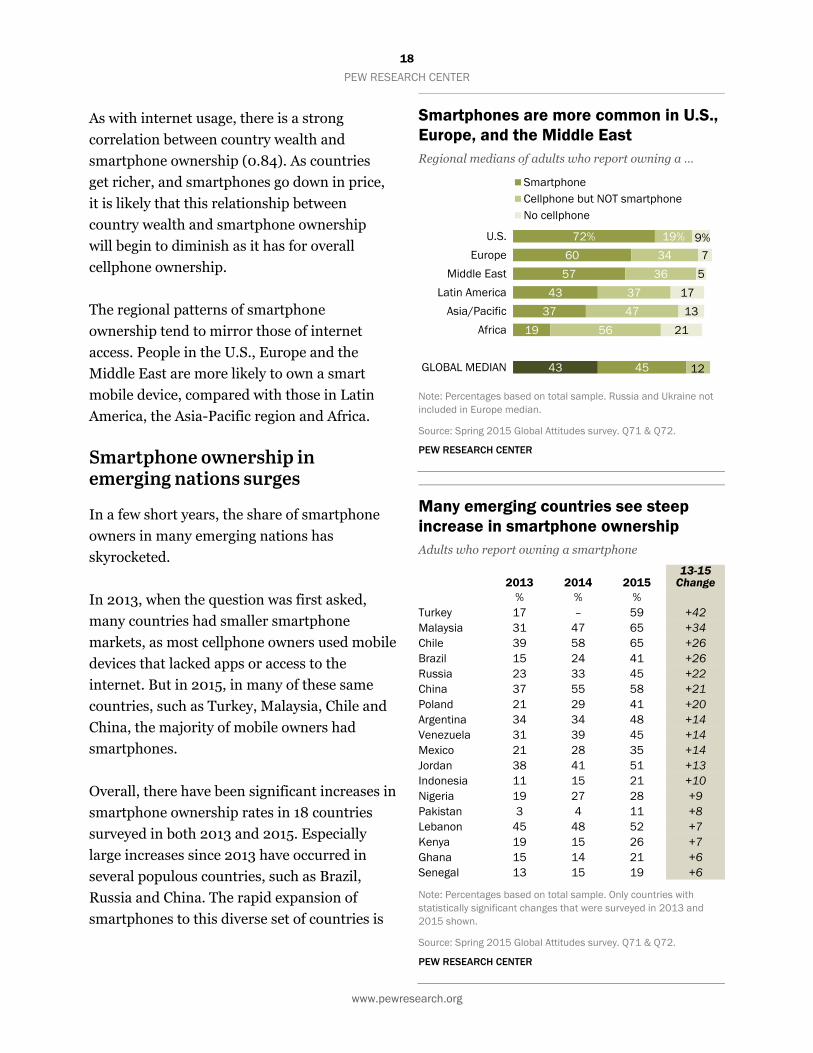
The regional patterns of smartphone
ownership tend to mirror those of internet
access. People in the U.S., Europe and the
Middle East are more likely to own a smart
mobile device, compared with those in Latin
America, the Asia-Pacific region and Africa.
Smartphone ownership in emerging nations surges
In a few short years, the share of smartphone
owners in many emerging nations has
skyrocketed.
In 2013, when the question was first asked,
many countries had smaller smartphone
markets, as most cellphone owners used mobile
devices that lacked apps or access to the
internet. But in 2015, in many of these same
countries, such as Turkey, Malaysia, Chile and
China, the majority of mobile owners had
smartphones.
Overall, there have been significant increases in
smartphone ownership rates in 18 countries
surveyed in both 2013 and 2015. Especially
large increases since 2013 have occurred in
several populous countries, such as Brazil,
Russia and China. The rapid expansion of
smartphones to this diverse set of countries is
Smartphones are more common in U.S., Europe, and the Middle East Regional medians of adults who report owning a …
Note: Percentages based on total sample. Russia and Ukraine not included in Europe median.
Source: Spring 2015 Global Attitudes survey. Q71 & Q72.
PEW RESEARCH CENTER
Many emerging countries see steep increase in smartphone ownership Adults who report owning a smartphone
2013 2014 2015 13-15
Change % % % Turkey 17 – 59 +42 Malaysia 31 47 65 +34 Chile 39 58 65 +26 Brazil 15 24 41 +26 Russia 23 33 45 +22 China 37 55 58 +21 Poland 21 29 41 +20 Argentina 34 34 48 +14 Venezuela 31 39 45 +14 Mexico 21 28 35 +14 Jordan 38 41 51 +13 Indonesia 11 15 21 +10 Nigeria 19 27 28 +9 Pakistan 3 4 11 +8 Lebanon 45 48 52 +7 Kenya 19 15 26 +7 Ghana 15 14 21 +6 Senegal 13 15 19 +6
Note: Percentages based on total sample. Only countries with statistically significant changes that were surveyed in 2013 and 2015 shown.
Source: Spring 2015 Global Attitudes survey. Q71 & Q72.
PEW RESEARCH CENTER
12
19
PEW RESEARCH CENTER
www.pewresearch.org
notable, but ownership rates still trail that of many wealthy countries in the survey.
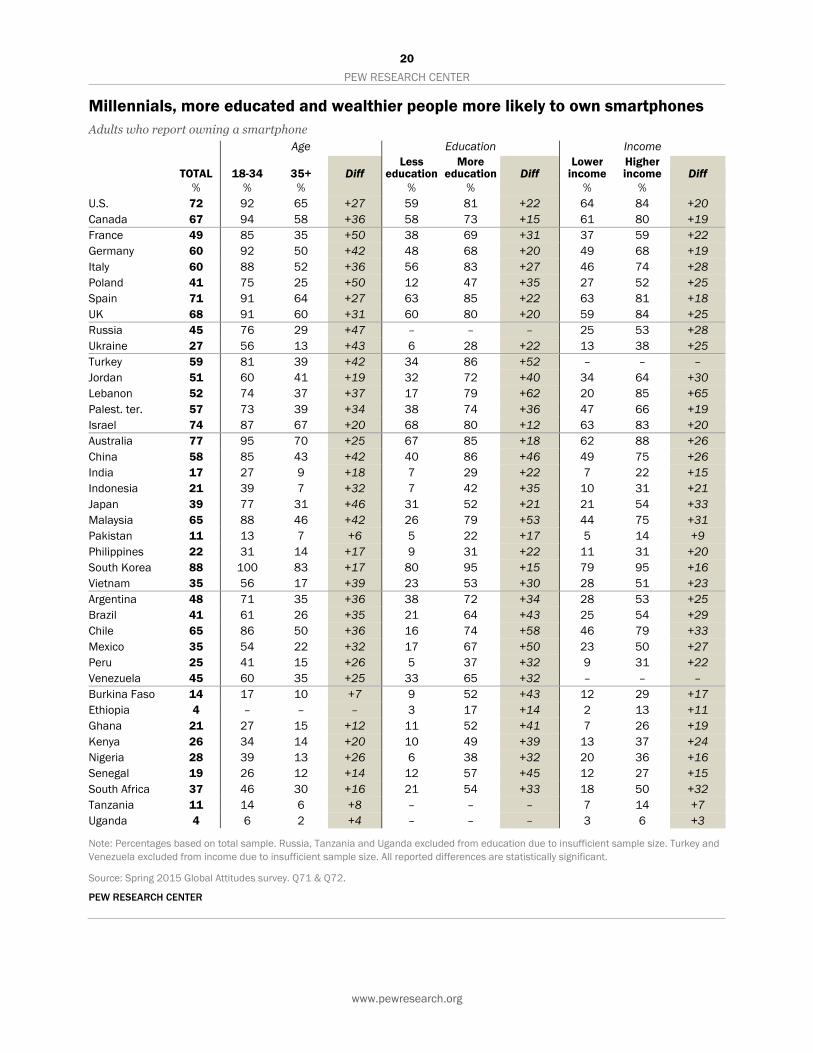
As with internet access, Millennials (ages 18-34) are more likely than older generations to own a
smartphone in virtually every country surveyed (the lone exception being Ethiopia). And unlike
internet rates, the largest generational divides on smartphone ownership are found among
European nations. For example, 85% of French Millennials own a smartphone compared with 35%
of French people who are 35 or older, a 50 percentage point difference. Similarly large gaps are
found in Poland (+50) and Germany (+42).
Those with more education are more likely to
own a smartphone than those with less
education in every country surveyed with a
sufficient sample to analyze. The education gap
on smartphone ownership ranges from 62
points in Lebanon to 12 points in Israel.
The income gap within countries is also
consistent across regions and differing levels of
economic development. In all of the countries
surveyed with sufficient sample sizes, people
with a higher income are more likely to own a
smartphone than people in the lower income
bracket.
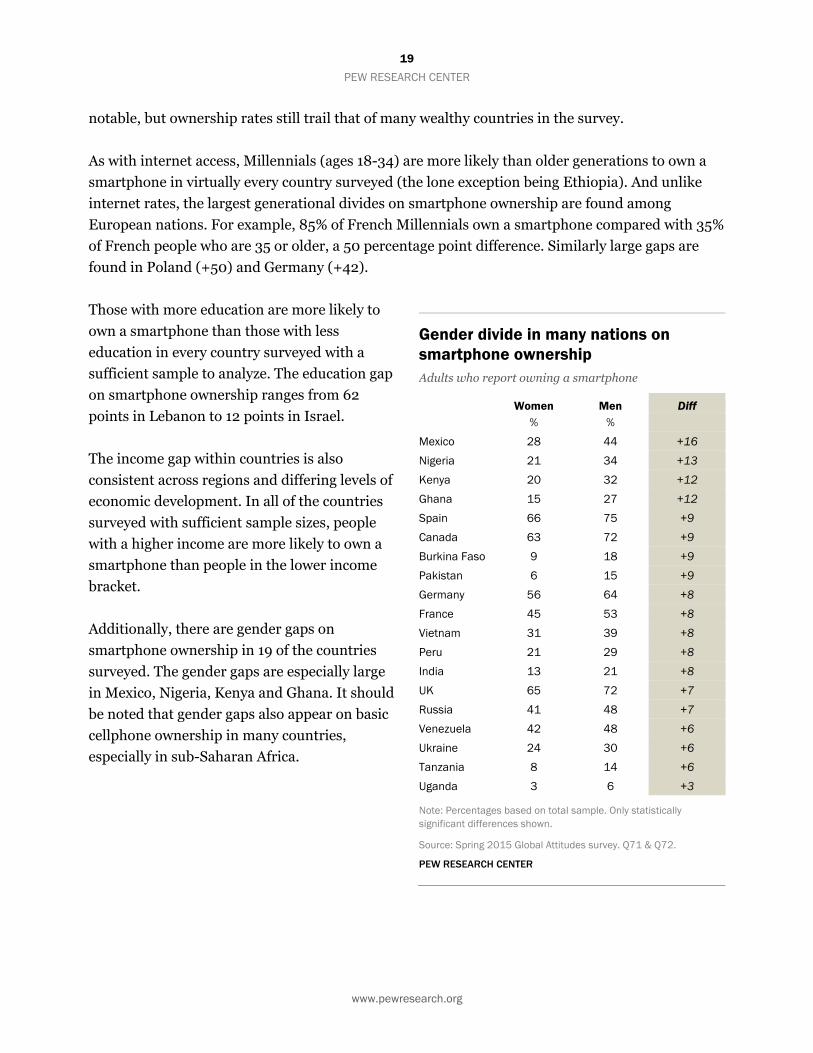
Additionally, there are gender gaps on
smartphone ownership in 19 of the countries
surveyed. The gender gaps are especially large
in Mexico, Nigeria, Kenya and Ghana. It should
be noted that gender gaps also appear on basic
cellphone ownership in many countries,
especially in sub-Saharan Africa.
Gender divide in many nations on smartphone ownership Adults who report owning a smartphone
Women Men Diff % %
Mexico 28 44 +16
Nigeria 21 34 +13
Kenya 20 32 +12
Ghana 15 27 +12
Spain 66 75 +9
Canada 63 72 +9
Burkina Faso 9 18 +9
Pakistan 6 15 +9
Germany 56 64 +8
France 45 53 +8
Vietnam 31 39 +8
Peru 21 29 +8
India 13 21 +8
UK 65 72 +7
Russia 41 48 +7
Venezuela 42 48 +6
Ukraine 24 30 +6
Tanzania 8 14 +6
Uganda 3 6 +3
Note: Percentages based on total sample. Only statistically significant differences shown.
Source: Spring 2015 Global Attitudes survey. Q71 & Q72.
PEW RESEARCH CENTER
20
PEW RESEARCH CENTER
www.pewresearch.org
Millennials, more educated and wealthier people more likely to own smartphones Adults who report owning a smartphone
Age Education Income
TOTAL 18-34 35+ Diff Less
education More
education Diff Lower
income Higher income Diff
% % % % % % % U.S. 72 92 65 +27 59 81 +22 64 84 +20 Canada 67 94 58 +36 58 73 +15 61 80 +19 France 49 85 35 +50 38 69 +31 37 59 +22 Germany 60 92 50 +42 48 68 +20 49 68 +19 Italy 60 88 52 +36 56 83 +27 46 74 +28 Poland 41 75 25 +50 12 47 +35 27 52 +25 Spain 71 91 64 +27 63 85 +22 63 81 +18 UK 68 91 60 +31 60 80 +20 59 84 +25 Russia 45 76 29 +47 – – – 25 53 +28 Ukraine 27 56 13 +43 6 28 +22 13 38 +25 Turkey 59 81 39 +42 34 86 +52 – – – Jordan 51 60 41 +19 32 72 +40 34 64 +30 Lebanon 52 74 37 +37 17 79 +62 20 85 +65 Palest. ter. 57 73 39 +34 38 74 +36 47 66 +19 Israel 74 87 67 +20 68 80 +12 63 83 +20 Australia 77 95 70 +25 67 85 +18 62 88 +26 China 58 85 43 +42 40 86 +46 49 75 +26 India 17 27 9 +18 7 29 +22 7 22 +15 Indonesia 21 39 7 +32 7 42 +35 10 31 +21 Japan 39 77 31 +46 31 52 +21 21 54 +33 Malaysia 65 88 46 +42 26 79 +53 44 75 +31 Pakistan 11 13 7 +6 5 22 +17 5 14 +9 Philippines 22 31 14 +17 9 31 +22 11 31 +20 South Korea 88 100 83 +17 80 95 +15 79 95 +16 Vietnam 35 56 17 +39 23 53 +30 28 51 +23 Argentina 48 71 35 +36 38 72 +34 28 53 +25 Brazil 41 61 26 +35 21 64 +43 25 54 +29 Chile 65 86 50 +36 16 74 +58 46 79 +33 Mexico 35 54 22 +32 17 67 +50 23 50 +27 Peru 25 41 15 +26 5 37 +32 9 31 +22 Venezuela 45 60 35 +25 33 65 +32 – – – Burkina Faso 14 17 10 +7 9 52 +43 12 29 +17 Ethiopia 4 – – – 3 17 +14 2 13 +11 Ghana 21 27 15 +12 11 52 +41 7 26 +19 Kenya 26 34 14 +20 10 49 +39 13 37 +24 Nigeria 28 39 13 +26 6 38 +32 20 36 +16 Senegal 19 26 12 +14 12 57 +45 12 27 +15 South Africa 37 46 30 +16 21 54 +33 18 50 +32 Tanzania 11 14 6 +8 – – – 7 14 +7 Uganda 4 6 2 +4 – – – 3 6 +3
Note: Percentages based on total sample. Russia, Tanzania and Uganda excluded from education due to insufficient sample size. Turkey and Venezuela excluded from income due to insufficient sample size. All reported differences are statistically significant.
Source: Spring 2015 Global Attitudes survey. Q71 & Q72.
PEW RESEARCH CENTER
21
PEW RESEARCH CENTER
www.pewresearch.org
90%898888878685858585
83828281807978777676757575
73737271
696666656565
6362
5754
515050
JordanIndonesia
PhilippinesVenezuela
TurkeyPalest. ter.
ChileMalaysia
NigeriaRussia
ArgentinaKenya
UkraineMexico
PeruBrazil
TanzaniaGhanaIsrael
UgandaLebanonSenegalVietnamCanada
South AfricaEthiopia
U.S.Australia
PolandUK
Burkina FasoItaly
SpainChinaIndia
FranceSouth Korea
JapanGermanyPakistan
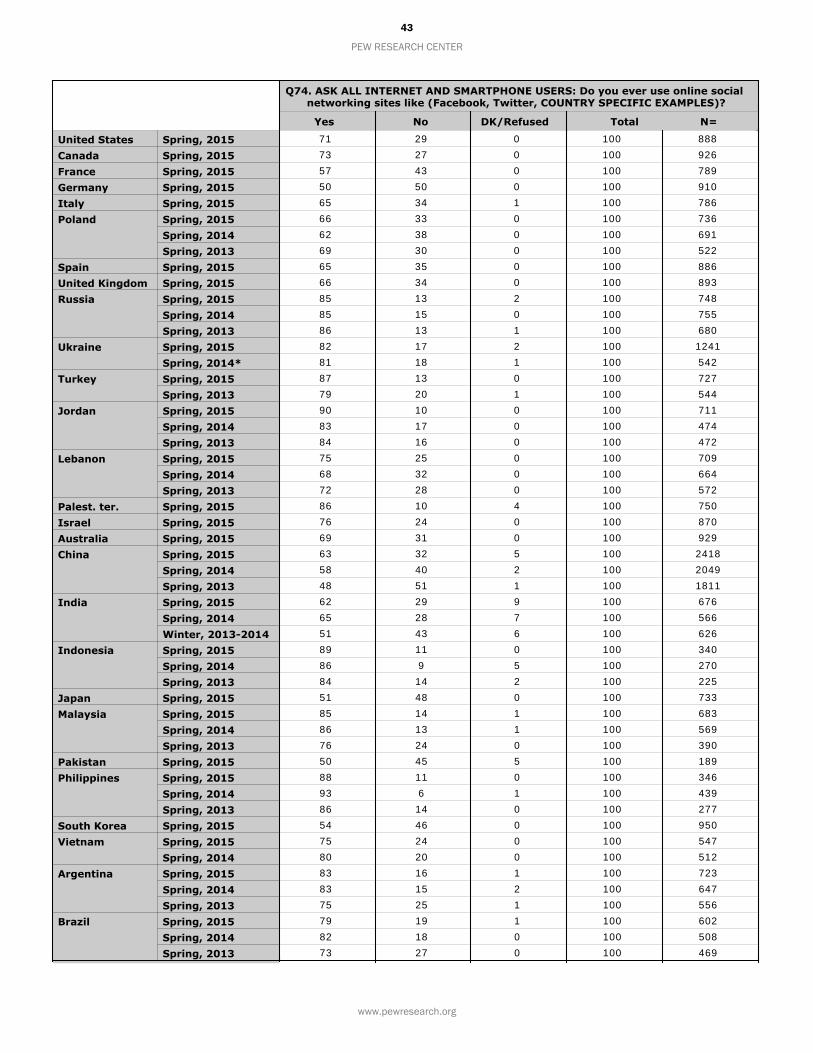
3. Social networking very popular among adult internet users in emerging and developing nations
Once online, people in emerging and
developing nations are hungry for social
interaction. Majorities of adult internet users
in almost every emerging and developing
nation surveyed say that they use social
networking sites, such as Facebook and
Twitter. Comparatively fewer online adults in
advanced economies say they use social
networks, though half or more still report
using social media in these countries. It is
important to note that while internet users in
emerging and developing economies are more
likely to use social networks, access rates are
lower in many of these nations; as a result,
many people are still left out of the social
networking experience. But in most of the
countries surveyed, Millennials are more likely
to use social media.
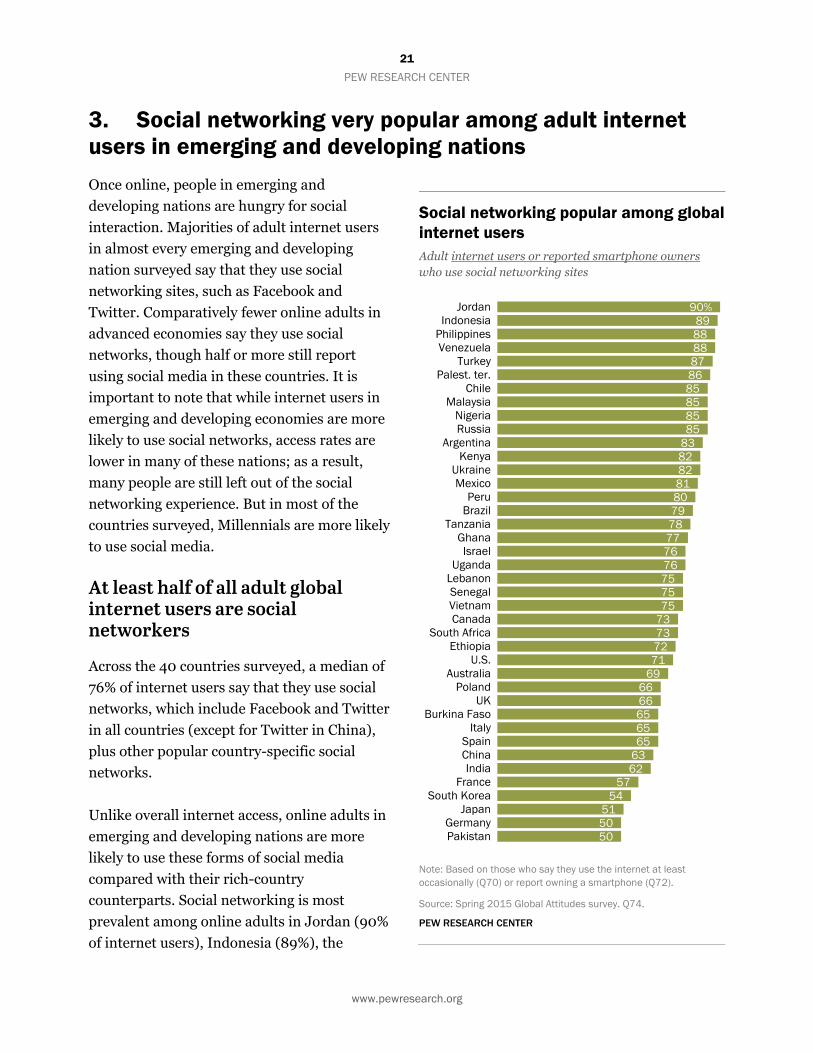
At least half of all adult global internet users are social networkers
Across the 40 countries surveyed, a median of
76% of internet users say that they use social
networks, which include Facebook and Twitter
in all countries (except for Twitter in China),
plus other popular country-specific social
networks.
Unlike overall internet access, online adults in
emerging and developing nations are more
likely to use these forms of social media
compared with their rich-country
counterparts. Social networking is most
prevalent among online adults in Jordan (90%
of internet users), Indonesia (89%), the
Social networking popular among global internet users Adult internet users or reported smartphone owners who use social networking sites
Note: Based on those who say they use the internet at least occasionally (Q70) or report owning a smartphone (Q72).
Source: Spring 2015 Global Attitudes survey. Q74.
PEW RESEARCH CENTER
22
PEW RESEARCH CENTER
www.pewresearch.org
Philippines (88%), Venezuela (88%) and Turkey
(87%). But majorities of internet users in every
emerging and developing nation surveyed,
Pakistan excepted, say they use social networks.
Comparatively fewer online adults in rich
economies say they use social networks, but
because internet access is greater in many of these
countries, overall social media usage based on
total adult population is more mixed. Still, 76% of
online Israelis, 73% of online Canadians and 71%
of online Americans say they use social networking
sites. But only around half of online adults in
Japan (51%) and Germany (50%) say the same.
Between 2013 and 2015, there has been some
upward movement in the percentage of people
who access social networks across many emerging
countries. This is especially the case in China,
where 63% of internet users report using social
networking in 2015, up from 48% in 2013.
Elsewhere the change has been less dramatic or no
change has occurred. But because internet access
and reported smartphone ownership rates have
increased in most of these nations, more people
are using social networks even as the proportion of
internet users who say they do so has not changed
dramatically, if at all.
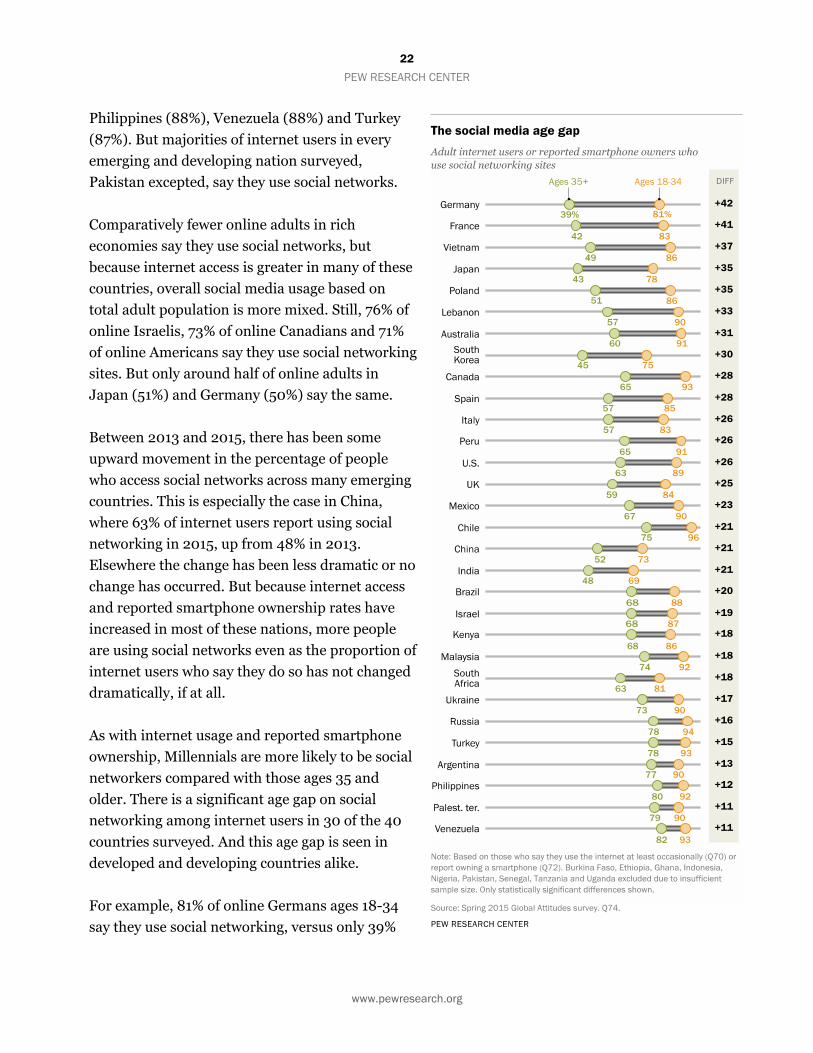
As with internet usage and reported smartphone
ownership, Millennials are more likely to be social
networkers compared with those ages 35 and
older. There is a significant age gap on social
networking among internet users in 30 of the 40
countries surveyed. And this age gap is seen in
developed and developing countries alike.
For example, 81% of online Germans ages 18-34
say they use social networking, versus only 39%
23
PEW RESEARCH CENTER
www.pewresearch.org
of older online Germans. And 83% of young French internet users are social networkers, versus
42% among older internet users. Large age gaps also appear in Vietnam (+37), Poland (+35) and
Japan (+35). It should be noted that, based on total population, the gap in social media use
between older and younger generations is even larger because more young people in all of the
countries surveyed are online to begin with. But even among active internet users, social
networking is more common among global youths.
In addition to age, there are also differences on social networking use among online adults by
education. However, significant gaps on education are not as common for social networking as
they are for overall internet access and smartphone ownership. In 18 countries with large enough
sample sizes for analysis, internet users with more education are significantly more likely to use
social networking sites compared with less educated online adults. The education gaps are
particularly large in Lebanon (+30) and China (+26).
24
PEW RESEARCH CENTER
www.pewresearch.org
Acknowledgments
This report is a collaborative effort based on the input and analysis of the following individuals.
Jacob Poushter, Senior Researcher Richard Wike, Director, Global Attitudes Research
James Bell, Vice President, Global Strategy Danielle Cuddington, Research Assistant Claudia Deane, Vice President, Research Margaret Havemann, Senior Researcher Gijs van Houten, International Survey Methodologist
Michael Keegan, Information Graphics Designer
David Kent, Copy Editor Dorothy Manevich, Research Assistant
Travis Mitchell, Digital Producer
Bridget Parker, Research Assistant Audrey Powers, Administrative Coordinator
Steve Schwarzer, Research Methodologist Katie Simmons, Associate Director, Research Bruce Stokes, Director, Global Economic Attitudes Ben Wormald, Associate Web Developer
Hani Zainulbhai, Research Analyst

25
PEW RESEARCH CENTER
www.pewresearch.org
Methodology
About the Pew Research Center’s Spring 2015 Global Attitudes Survey
Results for the survey are based on telephone and face-to-face interviews conducted under the
direction of Princeton Survey Research Associates International. The results are based on national
samples, unless otherwise noted. More details about our international survey methodology and
country-specific sample designs are available on our website.
For more detailed information on survey methods for this report, see here:
http://www.pewglobal.org/international-survey-methodology/?year_select=2015
For more general information on international survey research, see here:
http://www.pewresearch.org/methodology/international-survey-research/
26
PEW RESEARCH CENTER
www.pewresearch.org
Appendix A
Economic categorization
For this report we grouped countries into three economic categories: “advanced,” “emerging” and
“developing.” These categories are fairly common in specialized and popular discussions and are
helpful for analyzing how public attitudes vary with economic circumstances. However, no single,
agreed upon scheme exists for placing countries into these three categories. For example, even the
World Bank and International Monetary Fund do not always agree on how to categorize
economies.
In creating our economic classification of the 40 countries in our survey, we relied on multiple
sources and criteria. Specifically, we were guided by World Bank income classifications;
classifications of emerging markets by other multinational organizations, such as the International
Monetary Fund; per-capita Gross Domestic Product (GDP); total size of the country’s economy, as
measured by GDP; and average GDP growth rate over the past 10 years.
Below is a table that outlines the countries that fall into each of the three categories. The table
includes for each country the World Bank income classification, the GDP per capita based on
purchasing power parity (PPP), the GDP in current prices and average GDP growth rate over the
past 10 years.

27
PEW RESEARCH CENTER
www.pewresearch.org
Economic categorization
World Bank
Income Group GDP Per Capita
(PPP) GDP
(US$ Billions) Average GDP Growth
(2005-2014)
Adv
ance
d ec
onom
ies
United States High income 55,904 17,968 1.5 Australia High income 47,318 1,241 2.8 Germany High income 47,033 3,371 1.4 Canada High income 45,489 1,573 1.9 France High income 41,221 2,423 0.9 United Kingdom High income 40,958 2,865 1.3 Japan High income 38,211 4,116 0.6 South Korea High income 36,528 1,393 3.7 Italy High income 35,665 1,819 -0.5 Spain High income 35,270 1,221 0.7 Israel High income 33,658 299 4.0
Emer
ging
eco
nom
ies
Poland High income 26,403 481 3.9 Malaysia Upper middle 26,141 313 4.9 Russia High income 23,744 1,236 3.5 Chile High income 23,564 240 4.3 Argentina High income 22,375 579 5.1 Turkey Upper middle 20,277 722 4.3 Lebanon Upper middle 18,417 54 4.9 Mexico Upper middle 18,335 1,161 2.5 Venezuela High income 15,892 132 3.7 Brazil Upper middle 15,690 1,800 3.4 China Upper middle 14,190 11,385 10.0 South Africa Upper middle 13,197 317 3.0 Jordan Upper middle 12,162 38 5.1 Peru Upper middle 12,077 180 6.1 Indonesia Lower middle 11,112 873 5.9 Ukraine Lower middle 7,990 90 0.5 Philippines Lower middle 7,318 299 5.3 India Lower middle 6,209 2,183 7.7 Nigeria Lower middle 6,185 493 7.4 Vietnam Lower middle 6,020 199 6.2 Pakistan Lower middle 4,902 271 4.3
Dev
elop
ing
econ
omie
s
Ghana Lower middle 4,216 38 7.3 Kenya Lower middle 3,246 63 5.2 Tanzania Low 2,901 46 6.4 Senegal Lower middle 2,425 14 3.8 Uganda Low 1,999 25 6.9 Burkina Faso Low 1,774 63 10.8 Ethiopia Low 1,739 11 6.0 Palest. ter. Lower middle * * *
* Recent economic data are not available.
Source: World Bank; IMF World Economic Outlook Database October 2015, accessed Feb. 17, 2016.
PEW RESEARCH CENTER
28
PEW RESEARCH CENTER
www.pewresearch.org
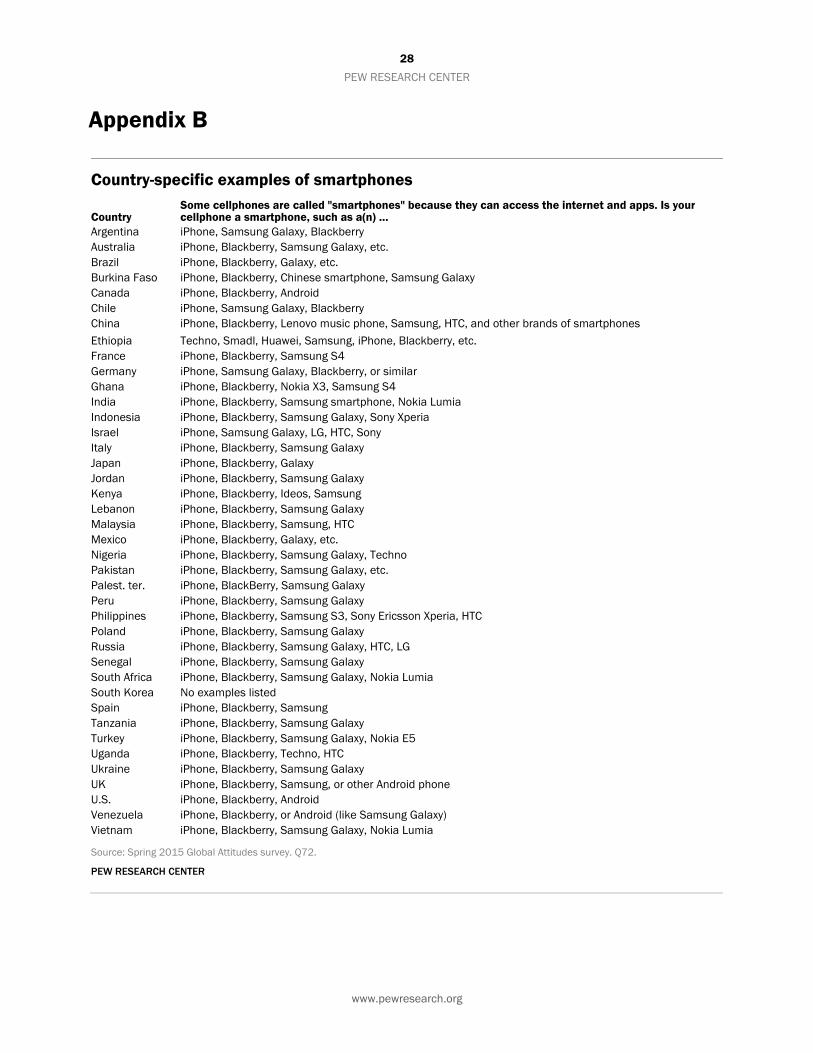
Appendix B
Country-specific examples of smartphones
Country Some cellphones are called "smartphones" because they can access the internet and apps. Is your cellphone a smartphone, such as a(n) …
Argentina iPhone, Samsung Galaxy, Blackberry Australia iPhone, Blackberry, Samsung Galaxy, etc. Brazil iPhone, Blackberry, Galaxy, etc. Burkina Faso iPhone, Blackberry, Chinese smartphone, Samsung Galaxy Canada iPhone, Blackberry, Android Chile iPhone, Samsung Galaxy, Blackberry China iPhone, Blackberry, Lenovo music phone, Samsung, HTC, and other brands of smartphones Ethiopia Techno, Smadl, Huawei, Samsung, iPhone, Blackberry, etc. France iPhone, Blackberry, Samsung S4 Germany iPhone, Samsung Galaxy, Blackberry, or similar Ghana iPhone, Blackberry, Nokia X3, Samsung S4 India iPhone, Blackberry, Samsung smartphone, Nokia Lumia Indonesia iPhone, Blackberry, Samsung Galaxy, Sony Xperia Israel iPhone, Samsung Galaxy, LG, HTC, Sony Italy iPhone, Blackberry, Samsung Galaxy Japan iPhone, Blackberry, Galaxy Jordan iPhone, Blackberry, Samsung Galaxy Kenya iPhone, Blackberry, Ideos, Samsung Lebanon iPhone, Blackberry, Samsung Galaxy Malaysia iPhone, Blackberry, Samsung, HTC Mexico iPhone, Blackberry, Galaxy, etc. Nigeria iPhone, Blackberry, Samsung Galaxy, Techno Pakistan iPhone, Blackberry, Samsung Galaxy, etc. Palest. ter. iPhone, BlackBerry, Samsung Galaxy Peru iPhone, Blackberry, Samsung Galaxy Philippines iPhone, Blackberry, Samsung S3, Sony Ericsson Xperia, HTC Poland iPhone, Blackberry, Samsung Galaxy Russia iPhone, Blackberry, Samsung Galaxy, HTC, LG Senegal iPhone, Blackberry, Samsung Galaxy South Africa iPhone, Blackberry, Samsung Galaxy, Nokia Lumia South Korea No examples listed Spain iPhone, Blackberry, Samsung Tanzania iPhone, Blackberry, Samsung Galaxy Turkey iPhone, Blackberry, Samsung Galaxy, Nokia E5 Uganda iPhone, Blackberry, Techno, HTC Ukraine iPhone, Blackberry, Samsung Galaxy UK iPhone, Blackberry, Samsung, or other Android phone U.S. iPhone, Blackberry, Android Venezuela iPhone, Blackberry, or Android (like Samsung Galaxy) Vietnam iPhone, Blackberry, Samsung Galaxy, Nokia Lumia
Source: Spring 2015 Global Attitudes survey. Q72.
PEW RESEARCH CENTER
29
PEW RESEARCH CENTER
www.pewresearch.org
Appendix C
Country-specific examples of social networking sites Country Do you ever use online social networking sites like …
Argentina Facebook, Sonico, Twitter, LinkedIn, etc. Australia Facebook, Twitter, etc. Brazil Facebook, Twitter, Orkut, etc. Burkina Faso Facebook, Twitter Canada Facebook, Twitter, Instagram Chile Facebook, Twitter China Facebook, kaixin.com, renren.com, MySpace, microblogging Ethiopia Facebook, Twitter France Facebook, Twitter, Copains d'avant, Viadeo, etc. Germany Facebook, Twitter, Xing Ghana Facebook, Twitter, Instagram India Facebook, Twitter Indonesia Facebook, Twitter, Path, LinkedIn, etc. Israel Facebook, LinkedIn, Twitter, Instagram Italy Facebook, Twitter Japan Mixi, Facebook, Twitter, etc. Jordan Facebook, Twitter, Instagram Kenya Facebook, Twitter, MySpace, Google Plus, Instagram, Whatsapp Lebanon Facebook, Twitter, Google Plus, Instagram Malaysia Facebook, Twitter Mexico Facebook, Twitter, MySpace, Instagram Nigeria Facebook, Twitter, Whatsapp Pakistan Facebook, Twitter, Orkut Palest. ter. Facebook, Twitter Peru Facebook, Twitter, Instagram, LinkedIn Philippines Facebook, Twitter, Plurk, Google Plus, LinkedIn Poland Facebook, Our Class, Twitter Russia Facebook, Twitter, Odnoklassniki, Vkontakte, Moikrug Senegal Facebook, Twitter South Africa Facebook, Twitter, YouTube, Google Plus South Korea Facebook, Twitter Spain Facebook, Tuenti, Twitter, MySpace Tanzania Facebook, Twitter Turkey Facebook, Twitter, MySpace Uganda Facebook, Twitter, MySpace, Hi5 Ukraine Facebook, Twitter, Odnoklassniki, Vkontakte, Moikrug UK Facebook, Twitter, Flickr, Instagram U.S. Facebook, Twitter Venezuela Facebook, Twitter, Instagram, etc. Vietnam Facebook, Twitter, Google Plus, Yahoo, LinkedIn, Zingme
Source: Spring 2015 Global Attitudes survey. Q74.
PEW RESEARCH CENTER
30
PEW RESEARCH CENTER
www.pewresearch.org
Topline Questionnaire
Pew Research Center Spring 2015 survey
February 22, 2016 Release
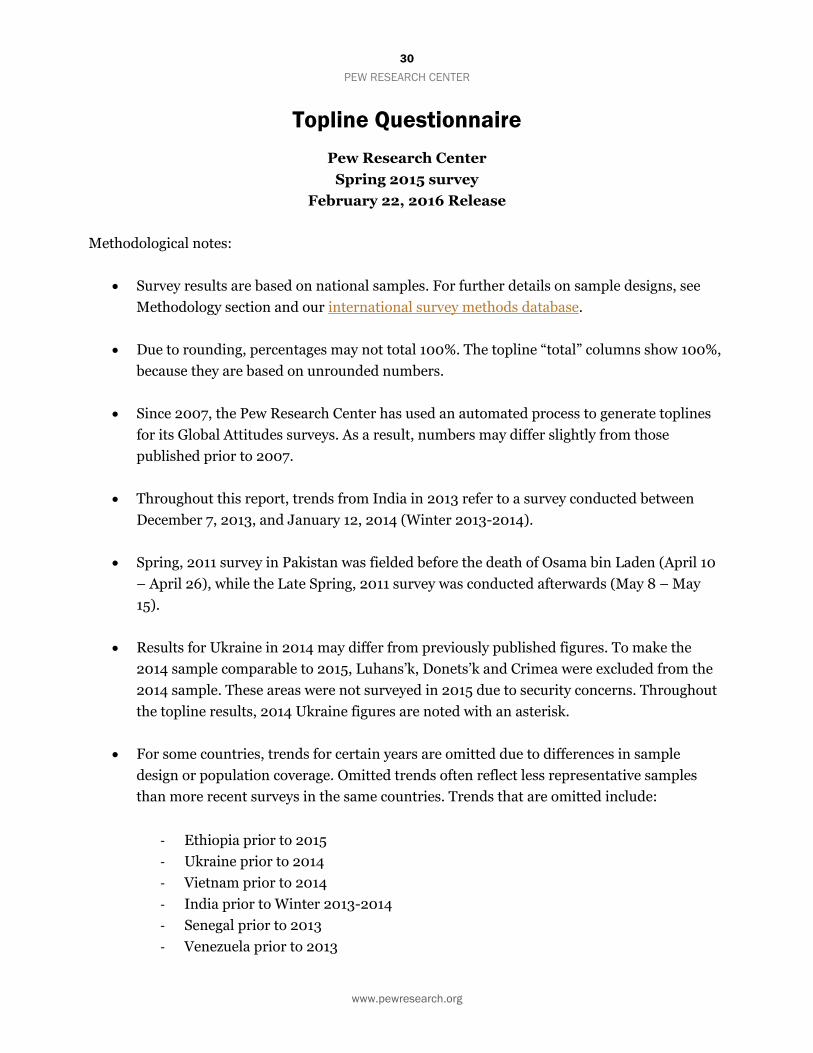
Methodological notes:
Survey results are based on national samples. For further details on sample designs, see
Methodology section and our international survey methods database.
Due to rounding, percentages may not total 100%. The topline “total” columns show 100%,
because they are based on unrounded numbers.
Since 2007, the Pew Research Center has used an automated process to generate toplines
for its Global Attitudes surveys. As a result, numbers may differ slightly from those
published prior to 2007.
Throughout this report, trends from India in 2013 refer to a survey conducted between
December 7, 2013, and January 12, 2014 (Winter 2013-2014).
Spring, 2011 survey in Pakistan was fielded before the death of Osama bin Laden (April 10
– April 26), while the Late Spring, 2011 survey was conducted afterwards (May 8 – May
15).
Results for Ukraine in 2014 may differ from previously published figures. To make the
2014 sample comparable to 2015, Luhans’k, Donets’k and Crimea were excluded from the
2014 sample. These areas were not surveyed in 2015 due to security concerns. Throughout
the topline results, 2014 Ukraine figures are noted with an asterisk.
For some countries, trends for certain years are omitted due to differences in sample
design or population coverage. Omitted trends often reflect less representative samples
than more recent surveys in the same countries. Trends that are omitted include:
‐ Ethiopia prior to 2015
‐ Ukraine prior to 2014
‐ Vietnam prior to 2014
‐ India prior to Winter 2013-2014
‐ Senegal prior to 2013
‐ Venezuela prior to 2013
31
PEW RESEARCH CENTER
www.pewresearch.org
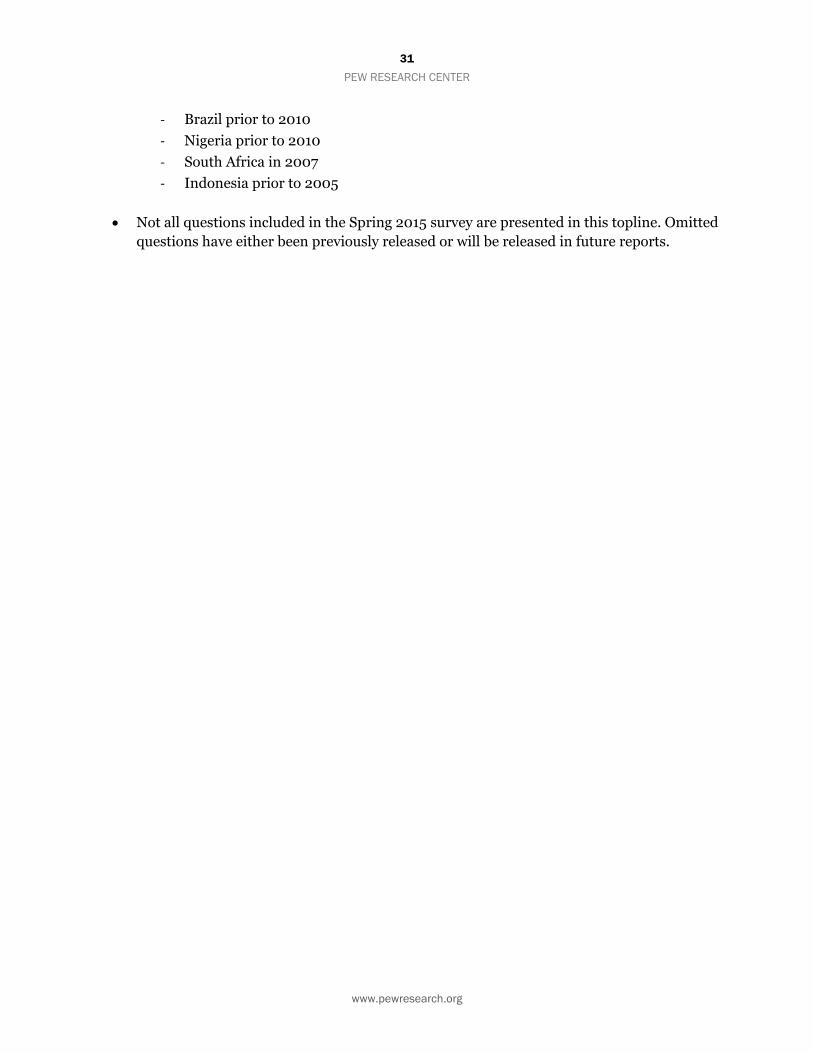
‐ Brazil prior to 2010
‐ Nigeria prior to 2010
‐ South Africa in 2007
‐ Indonesia prior to 2005
Not all questions included in the Spring 2015 survey are presented in this topline. Omitted
questions have either been previously released or will be released in future reports.
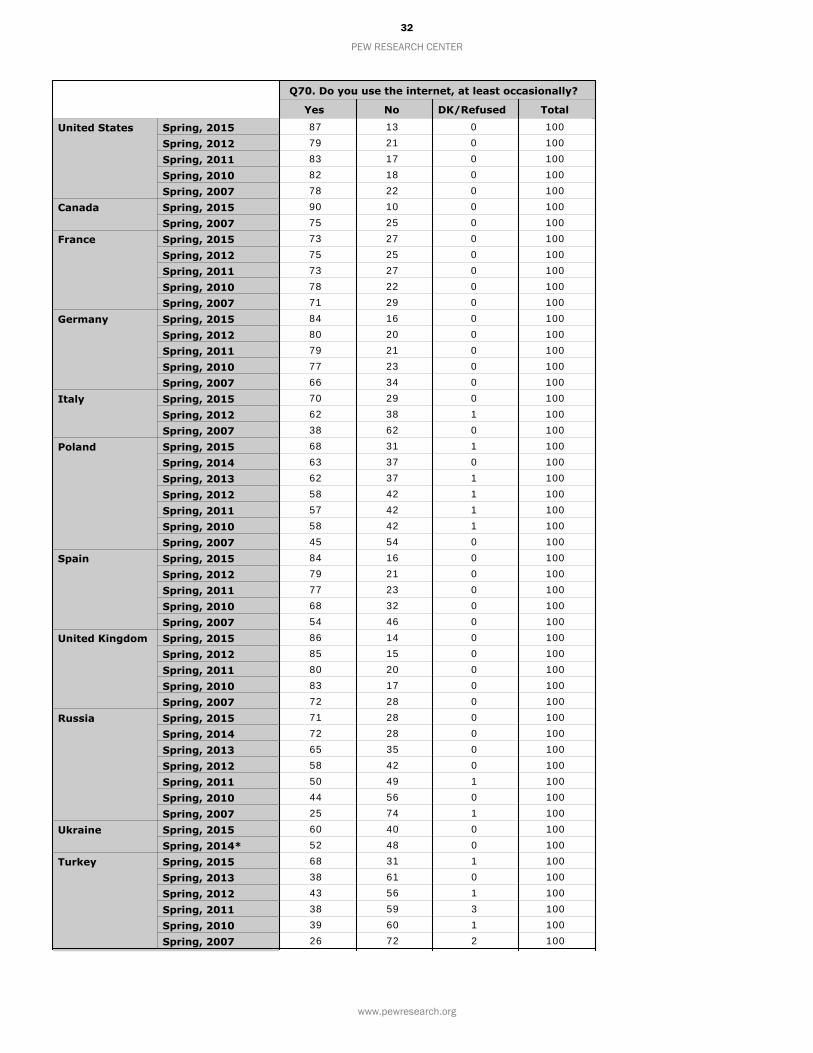
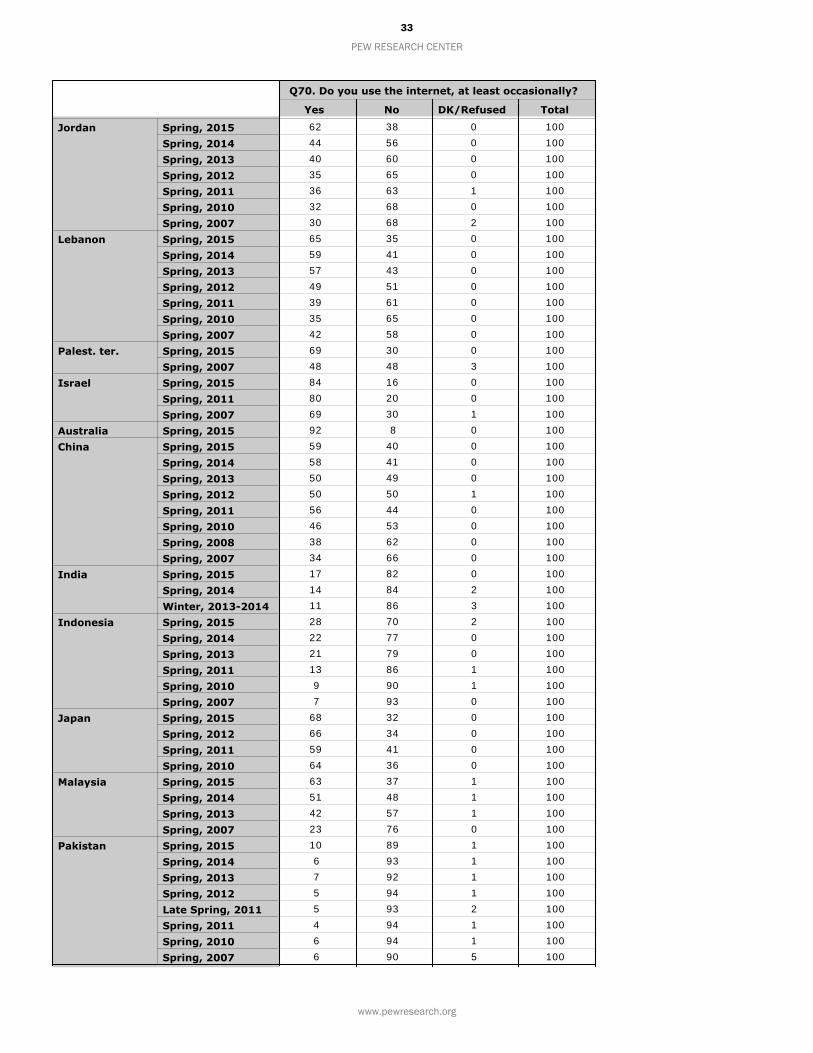
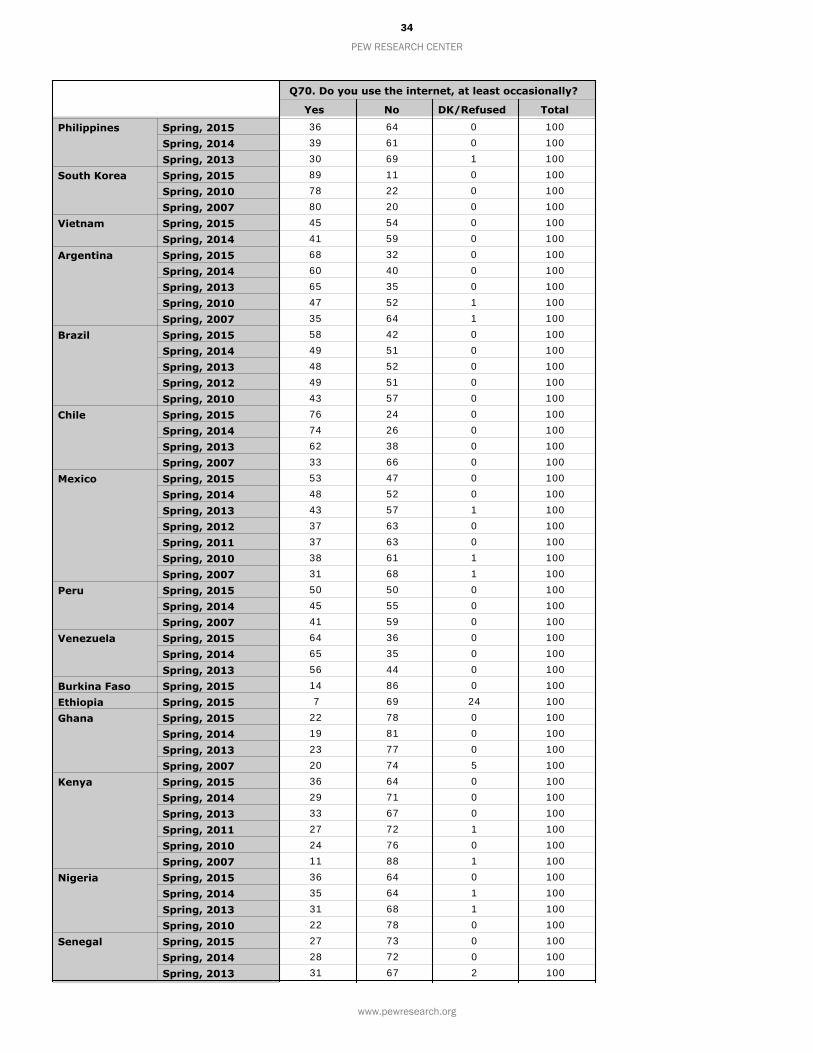
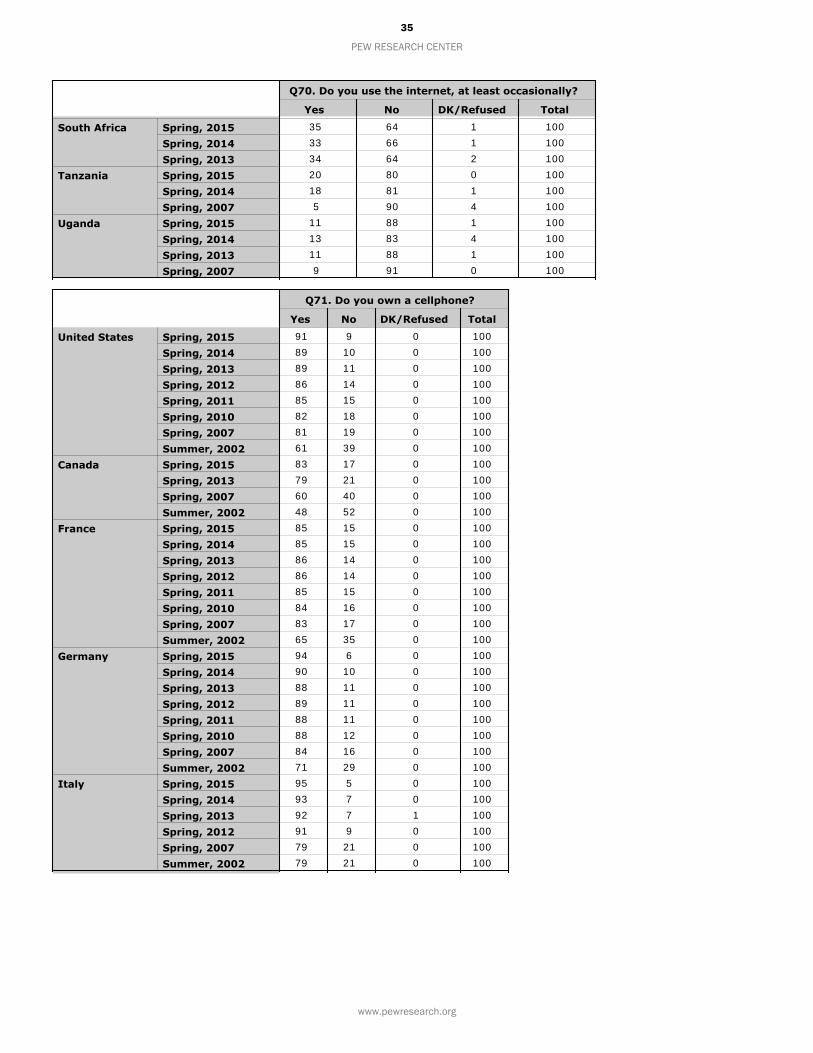
Q70. Do you use the internet, at least occasionally?
Yes No DK/Refused Total
United States Spring, 2015Spring, 2012Spring, 2011Spring, 2010Spring, 2007
Canada Spring, 2015Spring, 2007
France Spring, 2015Spring, 2012Spring, 2011Spring, 2010Spring, 2007
Germany Spring, 2015Spring, 2012Spring, 2011Spring, 2010Spring, 2007
Italy Spring, 2015Spring, 2012Spring, 2007
Poland Spring, 2015Spring, 2014Spring, 2013Spring, 2012Spring, 2011Spring, 2010Spring, 2007
Spain Spring, 2015Spring, 2012Spring, 2011Spring, 2010Spring, 2007
United Kingdom Spring, 2015Spring, 2012Spring, 2011Spring, 2010Spring, 2007
Russia Spring, 2015Spring, 2014Spring, 2013Spring, 2012Spring, 2011Spring, 2010Spring, 2007
Ukraine Spring, 2015Spring, 2014*
Turkey Spring, 2015Spring, 2013Spring, 2012Spring, 2011Spring, 2010Spring, 2007
87 13 0 10079 21 0 10083 17 0 10082 18 0 10078 22 0 10090 10 0 10075 25 0 10073 27 0 10075 25 0 10073 27 0 10078 22 0 10071 29 0 10084 16 0 10080 20 0 10079 21 0 10077 23 0 10066 34 0 10070 29 0 10062 38 1 10038 62 0 10068 31 1 10063 37 0 10062 37 1 10058 42 1 10057 42 1 10058 42 1 10045 54 0 10084 16 0 10079 21 0 10077 23 0 10068 32 0 10054 46 0 10086 14 0 10085 15 0 10080 20 0 10083 17 0 10072 28 0 10071 28 0 10072 28 0 10065 35 0 10058 42 0 10050 49 1 10044 56 0 10025 74 1 10060 40 0 10052 48 0 10068 31 1 10038 61 0 10043 56 1 10038 59 3 10039 60 1 10026 72 2 100
PEW RESEARCH CENTER
www.pewresearch.org
32
Q70. Do you use the internet, at least occasionally?
Yes No DK/Refused Total
Jordan Spring, 2015Spring, 2014Spring, 2013Spring, 2012Spring, 2011Spring, 2010Spring, 2007
Lebanon Spring, 2015Spring, 2014Spring, 2013Spring, 2012Spring, 2011Spring, 2010Spring, 2007
Palest. ter. Spring, 2015Spring, 2007
Israel Spring, 2015Spring, 2011Spring, 2007
Australia Spring, 2015China Spring, 2015
Spring, 2014Spring, 2013Spring, 2012Spring, 2011Spring, 2010Spring, 2008Spring, 2007
India Spring, 2015Spring, 2014Winter, 2013-2014
Indonesia Spring, 2015Spring, 2014Spring, 2013Spring, 2011Spring, 2010Spring, 2007
Japan Spring, 2015Spring, 2012Spring, 2011Spring, 2010
Malaysia Spring, 2015Spring, 2014Spring, 2013Spring, 2007
Pakistan Spring, 2015Spring, 2014Spring, 2013Spring, 2012Late Spring, 2011Spring, 2011Spring, 2010Spring, 2007
62 38 0 10044 56 0 10040 60 0 10035 65 0 10036 63 1 10032 68 0 10030 68 2 10065 35 0 10059 41 0 10057 43 0 10049 51 0 10039 61 0 10035 65 0 10042 58 0 10069 30 0 10048 48 3 10084 16 0 10080 20 0 10069 30 1 10092 8 0 10059 40 0 10058 41 0 10050 49 0 10050 50 1 10056 44 0 10046 53 0 10038 62 0 10034 66 0 10017 82 0 10014 84 2 10011 86 3 10028 70 2 10022 77 0 10021 79 0 10013 86 1 1009 90 1 1007 93 0 100
68 32 0 10066 34 0 10059 41 0 10064 36 0 10063 37 1 10051 48 1 10042 57 1 10023 76 0 10010 89 1 1006 93 1 1007 92 1 1005 94 1 1005 93 2 1004 94 1 1006 94 1 1006 90 5 100
PEW RESEARCH CENTER
www.pewresearch.org
33
Q70. Do you use the internet, at least occasionally?
Yes No DK/Refused Total
Philippines Spring, 2015Spring, 2014Spring, 2013
South Korea Spring, 2015Spring, 2010Spring, 2007
Vietnam Spring, 2015Spring, 2014
Argentina Spring, 2015Spring, 2014Spring, 2013Spring, 2010Spring, 2007
Brazil Spring, 2015Spring, 2014Spring, 2013Spring, 2012Spring, 2010
Chile Spring, 2015Spring, 2014Spring, 2013Spring, 2007
Mexico Spring, 2015Spring, 2014Spring, 2013Spring, 2012Spring, 2011Spring, 2010Spring, 2007
Peru Spring, 2015Spring, 2014Spring, 2007
Venezuela Spring, 2015Spring, 2014Spring, 2013
Burkina Faso Spring, 2015Ethiopia Spring, 2015Ghana Spring, 2015
Spring, 2014Spring, 2013Spring, 2007
Kenya Spring, 2015Spring, 2014Spring, 2013Spring, 2011Spring, 2010Spring, 2007
Nigeria Spring, 2015Spring, 2014Spring, 2013Spring, 2010
Senegal Spring, 2015Spring, 2014Spring, 2013
36 64 0 10039 61 0 10030 69 1 10089 11 0 10078 22 0 10080 20 0 10045 54 0 10041 59 0 10068 32 0 10060 40 0 10065 35 0 10047 52 1 10035 64 1 10058 42 0 10049 51 0 10048 52 0 10049 51 0 10043 57 0 10076 24 0 10074 26 0 10062 38 0 10033 66 0 10053 47 0 10048 52 0 10043 57 1 10037 63 0 10037 63 0 10038 61 1 10031 68 1 10050 50 0 10045 55 0 10041 59 0 10064 36 0 10065 35 0 10056 44 0 10014 86 0 1007 69 24 100
22 78 0 10019 81 0 10023 77 0 10020 74 5 10036 64 0 10029 71 0 10033 67 0 10027 72 1 10024 76 0 10011 88 1 10036 64 0 10035 64 1 10031 68 1 10022 78 0 10027 73 0 10028 72 0 10031 67 2 100
PEW RESEARCH CENTER
www.pewresearch.org
34
Q70. Do you use the internet, at least occasionally?
Yes No DK/Refused Total
South Africa Spring, 2015Spring, 2014Spring, 2013
Tanzania Spring, 2015Spring, 2014Spring, 2007
Uganda Spring, 2015Spring, 2014Spring, 2013Spring, 2007
35 64 1 10033 66 1 10034 64 2 10020 80 0 10018 81 1 1005 90 4 100
11 88 1 10013 83 4 10011 88 1 1009 91 0 100
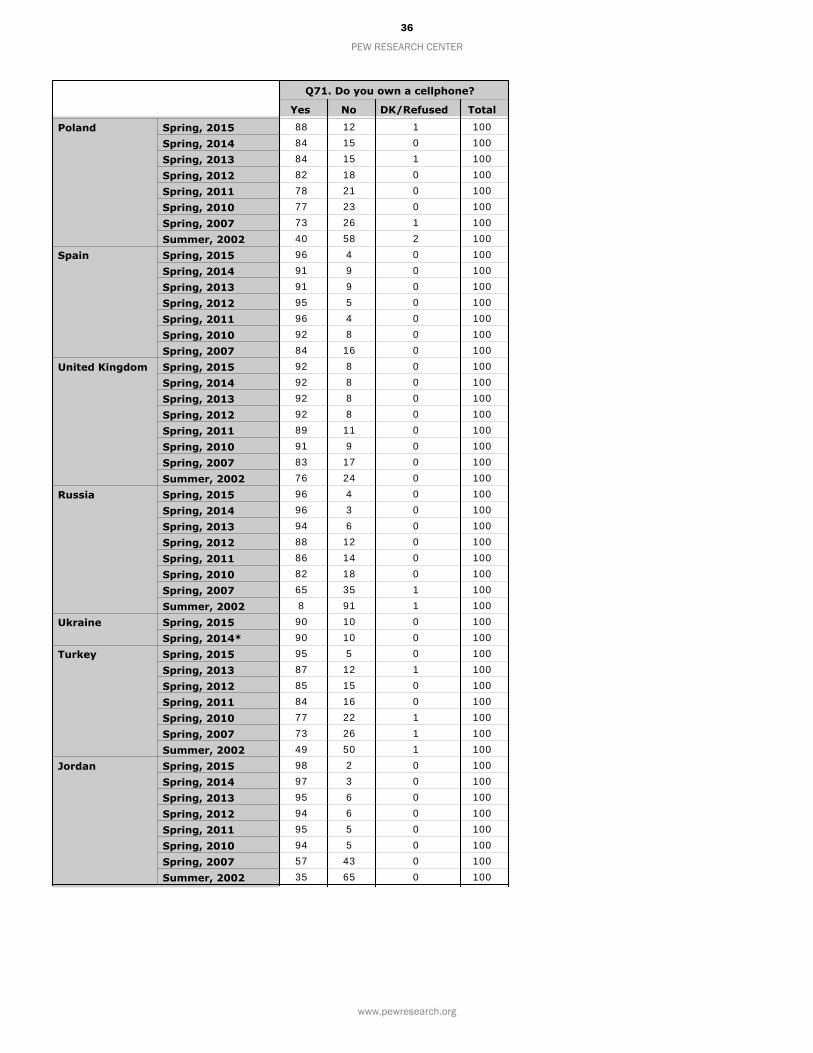
Q71. Do you own a cellphone?
Yes No DK/Refused Total
United States Spring, 2015Spring, 2014Spring, 2013Spring, 2012Spring, 2011Spring, 2010Spring, 2007Summer, 2002
Canada Spring, 2015Spring, 2013Spring, 2007Summer, 2002
France Spring, 2015Spring, 2014Spring, 2013Spring, 2012Spring, 2011Spring, 2010Spring, 2007Summer, 2002
Germany Spring, 2015Spring, 2014Spring, 2013Spring, 2012Spring, 2011Spring, 2010Spring, 2007Summer, 2002
Italy Spring, 2015Spring, 2014Spring, 2013Spring, 2012Spring, 2007Summer, 2002
91 9 0 10089 10 0 10089 11 0 10086 14 0 10085 15 0 10082 18 0 10081 19 0 10061 39 0 10083 17 0 10079 21 0 10060 40 0 10048 52 0 10085 15 0 10085 15 0 10086 14 0 10086 14 0 10085 15 0 10084 16 0 10083 17 0 10065 35 0 10094 6 0 10090 10 0 10088 11 0 10089 11 0 10088 11 0 10088 12 0 10084 16 0 10071 29 0 10095 5 0 10093 7 0 10092 7 1 10091 9 0 10079 21 0 10079 21 0 100
PEW RESEARCH CENTER
www.pewresearch.org
35
Q71. Do you own a cellphone?
Yes No DK/Refused Total
Poland Spring, 2015Spring, 2014Spring, 2013Spring, 2012Spring, 2011Spring, 2010Spring, 2007Summer, 2002
Spain Spring, 2015Spring, 2014Spring, 2013Spring, 2012Spring, 2011Spring, 2010Spring, 2007
United Kingdom Spring, 2015Spring, 2014Spring, 2013Spring, 2012Spring, 2011Spring, 2010Spring, 2007Summer, 2002
Russia Spring, 2015Spring, 2014Spring, 2013Spring, 2012Spring, 2011Spring, 2010Spring, 2007Summer, 2002
Ukraine Spring, 2015Spring, 2014*
Turkey Spring, 2015Spring, 2013Spring, 2012Spring, 2011Spring, 2010Spring, 2007Summer, 2002
Jordan Spring, 2015Spring, 2014Spring, 2013Spring, 2012Spring, 2011Spring, 2010Spring, 2007Summer, 2002
88 12 1 10084 15 0 10084 15 1 10082 18 0 10078 21 0 10077 23 0 10073 26 1 10040 58 2 10096 4 0 10091 9 0 10091 9 0 10095 5 0 10096 4 0 10092 8 0 10084 16 0 10092 8 0 10092 8 0 10092 8 0 10092 8 0 10089 11 0 10091 9 0 10083 17 0 10076 24 0 10096 4 0 10096 3 0 10094 6 0 10088 12 0 10086 14 0 10082 18 0 10065 35 1 1008 91 1 100
90 10 0 10090 10 0 10095 5 0 10087 12 1 10085 15 0 10084 16 0 10077 22 1 10073 26 1 10049 50 1 10098 2 0 10097 3 0 10095 6 0 10094 6 0 10095 5 0 10094 5 0 10057 43 0 10035 65 0 100
PEW RESEARCH CENTER
www.pewresearch.org
36
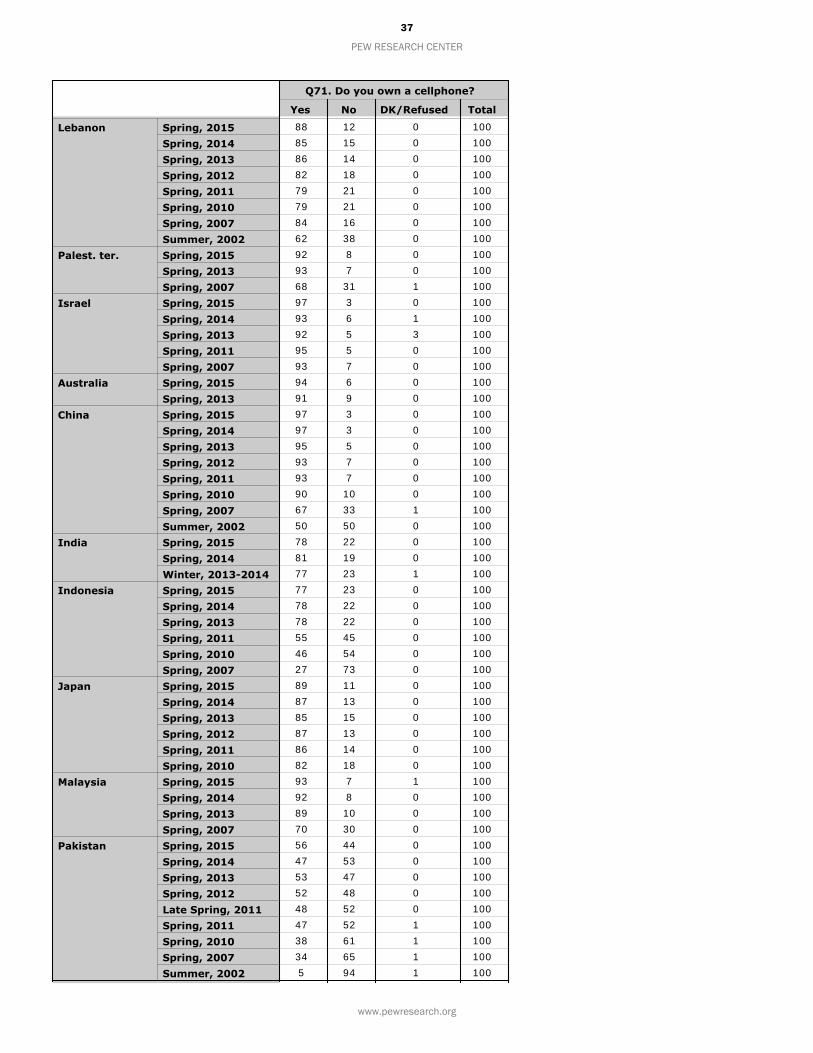
Q71. Do you own a cellphone?
Yes No DK/Refused Total
Lebanon Spring, 2015Spring, 2014Spring, 2013Spring, 2012Spring, 2011Spring, 2010Spring, 2007Summer, 2002
Palest. ter. Spring, 2015Spring, 2013Spring, 2007
Israel Spring, 2015Spring, 2014Spring, 2013Spring, 2011Spring, 2007
Australia Spring, 2015Spring, 2013
China Spring, 2015Spring, 2014Spring, 2013Spring, 2012Spring, 2011Spring, 2010Spring, 2007Summer, 2002
India Spring, 2015Spring, 2014Winter, 2013-2014
Indonesia Spring, 2015Spring, 2014Spring, 2013Spring, 2011Spring, 2010Spring, 2007
Japan Spring, 2015Spring, 2014Spring, 2013Spring, 2012Spring, 2011Spring, 2010
Malaysia Spring, 2015Spring, 2014Spring, 2013Spring, 2007
Pakistan Spring, 2015Spring, 2014Spring, 2013Spring, 2012Late Spring, 2011Spring, 2011Spring, 2010Spring, 2007Summer, 2002
88 12 0 10085 15 0 10086 14 0 10082 18 0 10079 21 0 10079 21 0 10084 16 0 10062 38 0 10092 8 0 10093 7 0 10068 31 1 10097 3 0 10093 6 1 10092 5 3 10095 5 0 10093 7 0 10094 6 0 10091 9 0 10097 3 0 10097 3 0 10095 5 0 10093 7 0 10093 7 0 10090 10 0 10067 33 1 10050 50 0 10078 22 0 10081 19 0 10077 23 1 10077 23 0 10078 22 0 10078 22 0 10055 45 0 10046 54 0 10027 73 0 10089 11 0 10087 13 0 10085 15 0 10087 13 0 10086 14 0 10082 18 0 10093 7 1 10092 8 0 10089 10 0 10070 30 0 10056 44 0 10047 53 0 10053 47 0 10052 48 0 10048 52 0 10047 52 1 10038 61 1 10034 65 1 1005 94 1 100
PEW RESEARCH CENTER
www.pewresearch.org
37

Q71. Do you own a cellphone?
Yes No DK/Refused Total
Philippines Spring, 2015Spring, 2014Spring, 2013Summer, 2002
South Korea Spring, 2015Spring, 2014Spring, 2013Spring, 2010Spring, 2007Summer, 2002
Vietnam Spring, 2015Spring, 2014
Argentina Spring, 2015Spring, 2014Spring, 2013Spring, 2010Spring, 2007Summer, 2002
Brazil Spring, 2015Spring, 2014Spring, 2013Spring, 2012Spring, 2010
Chile Spring, 2015Spring, 2014Spring, 2013Spring, 2007
Mexico Spring, 2015Spring, 2014Spring, 2013Spring, 2012Spring, 2011Spring, 2010Spring, 2007Summer, 2002
Peru Spring, 2015Spring, 2014Spring, 2007Summer, 2002
Venezuela Spring, 2015Spring, 2014Spring, 2013
Burkina Faso Spring, 2015Ethiopia Spring, 2015Ghana Spring, 2015
Spring, 2014Spring, 2013Spring, 2007Summer, 2002
70 30 0 10074 26 0 10071 29 0 10028 72 0 100
100 0 0 100100 0 0 100100 0 0 10097 3 0 10097 3 0 10093 7 0 10086 14 0 10082 18 0 10082 18 0 10082 18 0 10083 17 0 10077 23 0 10063 36 1 10028 72 0 10086 15 0 10087 13 0 10080 20 0 10084 16 0 10073 27 0 10093 7 0 10093 7 0 10091 9 0 10071 29 0 10072 28 0 10074 26 0 10063 37 0 10063 37 0 10057 42 1 10051 48 1 10044 56 0 10037 63 0 10078 22 0 10077 23 0 10042 58 0 10018 81 0 10083 16 0 10088 12 0 10086 14 0 10079 21 0 10048 52 1 10075 25 0 10083 17 0 10079 21 1 10034 66 0 1008 91 1 100
PEW RESEARCH CENTER
www.pewresearch.org
38
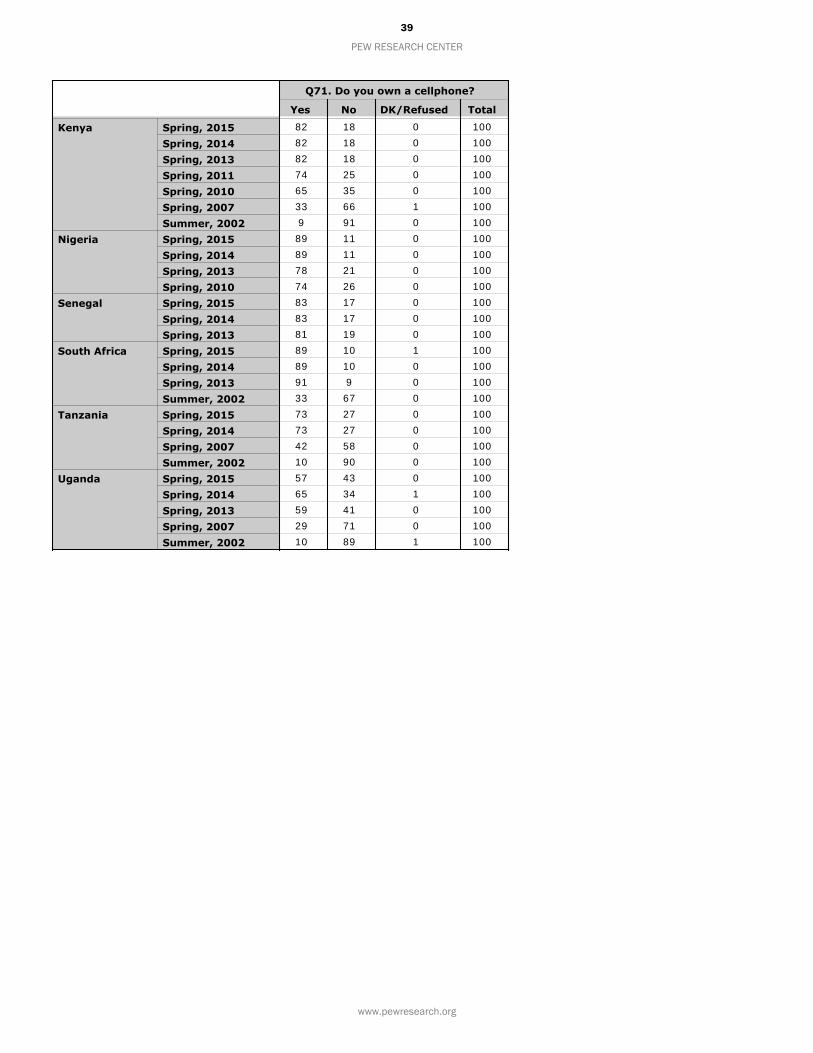
Q71. Do you own a cellphone?
Yes No DK/Refused Total
Kenya Spring, 2015Spring, 2014Spring, 2013Spring, 2011Spring, 2010Spring, 2007Summer, 2002
Nigeria Spring, 2015Spring, 2014Spring, 2013Spring, 2010
Senegal Spring, 2015Spring, 2014Spring, 2013
South Africa Spring, 2015Spring, 2014Spring, 2013Summer, 2002
Tanzania Spring, 2015Spring, 2014Spring, 2007Summer, 2002
Uganda Spring, 2015Spring, 2014Spring, 2013Spring, 2007Summer, 2002
82 18 0 10082 18 0 10082 18 0 10074 25 0 10065 35 0 10033 66 1 1009 91 0 100
89 11 0 10089 11 0 10078 21 0 10074 26 0 10083 17 0 10083 17 0 10081 19 0 10089 10 1 10089 10 0 10091 9 0 10033 67 0 10073 27 0 10073 27 0 10042 58 0 10010 90 0 10057 43 0 10065 34 1 10059 41 0 10029 71 0 10010 89 1 100
PEW RESEARCH CENTER
www.pewresearch.org
39
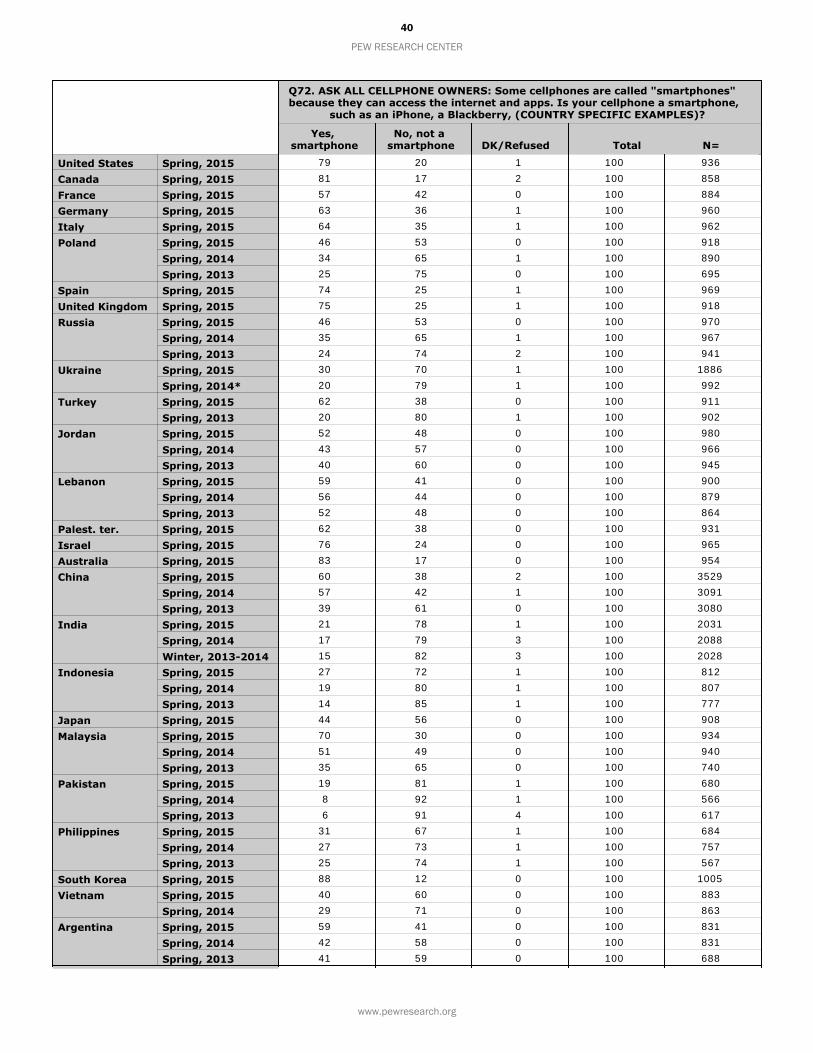
Q72. ASK ALL CELLPHONE OWNERS: Some cellphones are called "smartphones" because they can access the internet and apps. Is your cellphone a smartphone,
such as an iPhone, a Blackberry, (COUNTRY SPECIFIC EXAMPLES)?
Yes, smartphone
No, not a smartphone DK/Refused Total N=
United States Spring, 2015Canada Spring, 2015France Spring, 2015Germany Spring, 2015Italy Spring, 2015Poland Spring, 2015
Spring, 2014Spring, 2013
Spain Spring, 2015United Kingdom Spring, 2015Russia Spring, 2015
Spring, 2014Spring, 2013
Ukraine Spring, 2015Spring, 2014*
Turkey Spring, 2015Spring, 2013
Jordan Spring, 2015Spring, 2014Spring, 2013
Lebanon Spring, 2015Spring, 2014Spring, 2013
Palest. ter. Spring, 2015Israel Spring, 2015Australia Spring, 2015China Spring, 2015
Spring, 2014Spring, 2013
India Spring, 2015Spring, 2014Winter, 2013-2014
Indonesia Spring, 2015Spring, 2014Spring, 2013
Japan Spring, 2015Malaysia Spring, 2015
Spring, 2014Spring, 2013
Pakistan Spring, 2015Spring, 2014Spring, 2013
Philippines Spring, 2015Spring, 2014Spring, 2013
South Korea Spring, 2015Vietnam Spring, 2015
Spring, 2014Argentina Spring, 2015
Spring, 2014Spring, 2013
79 20 1 100 93681 17 2 100 85857 42 0 100 88463 36 1 100 96064 35 1 100 96246 53 0 100 91834 65 1 100 89025 75 0 100 69574 25 1 100 96975 25 1 100 91846 53 0 100 97035 65 1 100 96724 74 2 100 94130 70 1 100 188620 79 1 100 99262 38 0 100 91120 80 1 100 90252 48 0 100 98043 57 0 100 96640 60 0 100 94559 41 0 100 90056 44 0 100 87952 48 0 100 86462 38 0 100 93176 24 0 100 96583 17 0 100 95460 38 2 100 352957 42 1 100 309139 61 0 100 308021 78 1 100 203117 79 3 100 208815 82 3 100 202827 72 1 100 81219 80 1 100 80714 85 1 100 77744 56 0 100 90870 30 0 100 93451 49 0 100 94035 65 0 100 74019 81 1 100 6808 92 1 100 5666 91 4 100 617
31 67 1 100 68427 73 1 100 75725 74 1 100 56788 12 0 100 100540 60 0 100 88329 71 0 100 86359 41 0 100 83142 58 0 100 83141 59 0 100 688
PEW RESEARCH CENTER
www.pewresearch.org
40
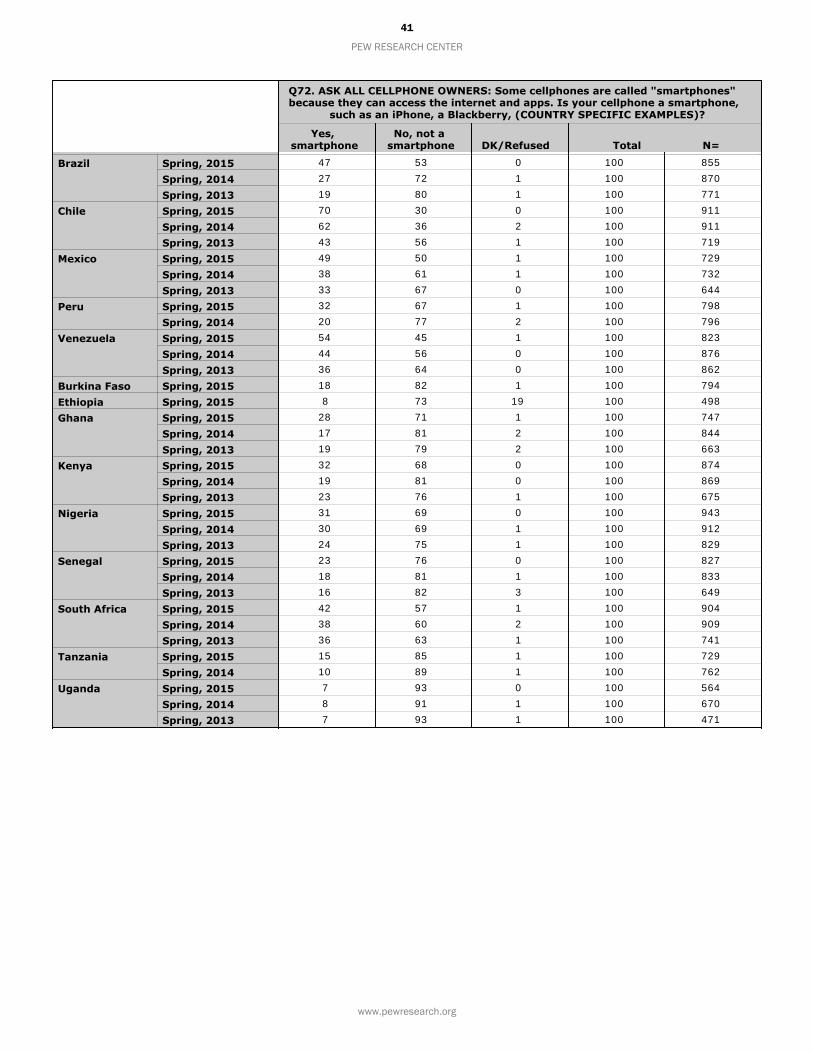
Q72. ASK ALL CELLPHONE OWNERS: Some cellphones are called "smartphones" because they can access the internet and apps. Is your cellphone a smartphone,
such as an iPhone, a Blackberry, (COUNTRY SPECIFIC EXAMPLES)?
Yes, smartphone
No, not a smartphone DK/Refused Total N=
Brazil Spring, 2015Spring, 2014Spring, 2013
Chile Spring, 2015Spring, 2014Spring, 2013
Mexico Spring, 2015Spring, 2014Spring, 2013
Peru Spring, 2015Spring, 2014
Venezuela Spring, 2015Spring, 2014Spring, 2013
Burkina Faso Spring, 2015Ethiopia Spring, 2015Ghana Spring, 2015
Spring, 2014Spring, 2013
Kenya Spring, 2015Spring, 2014Spring, 2013
Nigeria Spring, 2015Spring, 2014Spring, 2013
Senegal Spring, 2015Spring, 2014Spring, 2013
South Africa Spring, 2015Spring, 2014Spring, 2013
Tanzania Spring, 2015Spring, 2014
Uganda Spring, 2015Spring, 2014Spring, 2013
47 53 0 100 85527 72 1 100 87019 80 1 100 77170 30 0 100 91162 36 2 100 91143 56 1 100 71949 50 1 100 72938 61 1 100 73233 67 0 100 64432 67 1 100 79820 77 2 100 79654 45 1 100 82344 56 0 100 87636 64 0 100 86218 82 1 100 7948 73 19 100 498
28 71 1 100 74717 81 2 100 84419 79 2 100 66332 68 0 100 87419 81 0 100 86923 76 1 100 67531 69 0 100 94330 69 1 100 91224 75 1 100 82923 76 0 100 82718 81 1 100 83316 82 3 100 64942 57 1 100 90438 60 2 100 90936 63 1 100 74115 85 1 100 72910 89 1 100 7627 93 0 100 5648 91 1 100 6707 93 1 100 471
PEW RESEARCH CENTER
www.pewresearch.org
41
Q73. ASK ALL INTERNET AND SMARTPHONE USERS: Overall, how often do you use the internet — several times a day, once a day, at least once a week or less often?
Several times a day Once a day
At least once a week Less often DK/Refused Total N=
United States Spring, 2015Canada Spring, 2015France Spring, 2015Germany Spring, 2015Italy Spring, 2015Poland Spring, 2015
Spring, 2014Spain Spring, 2015United Kingdom Spring, 2015Russia Spring, 2015
Spring, 2014Ukraine Spring, 2015
Spring, 2014*Turkey Spring, 2015Jordan Spring, 2015
Spring, 2014Lebanon Spring, 2015
Spring, 2014Palest. ter. Spring, 2015Israel Spring, 2015Australia Spring, 2015China Spring, 2015
Spring, 2014India Spring, 2015
Spring, 2014Indonesia Spring, 2015
Spring, 2014Japan Spring, 2015Malaysia Spring, 2015
Spring, 2014Pakistan Spring, 2015Philippines Spring, 2015
Spring, 2014South Korea Spring, 2015Vietnam Spring, 2015
Spring, 2014Argentina Spring, 2015
Spring, 2014Brazil Spring, 2015
Spring, 2014Chile Spring, 2015
Spring, 2014Mexico Spring, 2015
Spring, 2014Peru Spring, 2015
Spring, 2014Venezuela Spring, 2015
Spring, 2014Burkina Faso Spring, 2015Ethiopia Spring, 2015Ghana Spring, 2015
Spring, 2014Kenya Spring, 2015
Spring, 2014Nigeria Spring, 2015
Spring, 2014Senegal Spring, 2015
Spring, 2014South Africa Spring, 2015
Spring, 2014Tanzania Spring, 2015
Spring, 2014Uganda Spring, 2015
Spring, 2014
69 17 7 8 0 100 88870 20 7 3 1 100 92665 18 12 6 0 100 78957 20 16 7 0 100 91070 17 8 4 1 100 78650 28 17 4 1 100 73646 32 18 4 0 100 69164 21 9 5 1 100 88668 18 9 6 0 100 89355 25 15 3 2 100 74849 25 17 4 4 100 75546 28 19 6 2 100 124144 28 18 9 1 100 54257 25 11 5 2 100 72747 37 7 10 0 100 71142 36 13 1 8 100 47470 22 6 3 0 100 70967 16 7 2 8 100 66457 22 10 6 5 100 75069 19 5 6 1 100 87077 14 6 3 0 100 92958 17 9 12 4 100 241845 22 14 15 3 100 204942 20 11 16 10 100 67631 23 19 18 9 100 56643 14 21 19 3 100 34032 25 25 14 5 100 27067 15 11 7 0 100 73363 16 7 11 3 100 68351 17 12 15 3 100 56924 17 18 23 18 100 18925 23 21 25 5 100 34622 15 27 31 5 100 43958 26 9 6 1 100 95047 21 12 18 1 100 54754 20 14 11 1 100 51258 22 13 6 1 100 72352 24 15 5 4 100 64758 18 14 6 4 100 60253 22 16 9 1 100 50867 17 9 6 2 100 72465 18 10 5 1 100 69651 24 15 8 2 100 55943 23 21 10 3 100 48732 23 25 20 0 100 54427 23 35 14 2 100 48339 29 17 11 3 100 64931 31 18 18 1 100 67228 14 16 43 0 100 18716 25 22 23 13 100 10054 15 10 20 1 100 27635 21 12 26 6 100 23844 21 17 17 0 100 50647 22 18 12 0 100 36058 18 10 9 5 100 43438 18 16 20 8 100 46329 12 25 34 0 100 29922 16 31 31 0 100 27747 18 14 15 6 100 43943 21 12 18 6 100 45248 14 11 24 3 100 21245 19 14 21 2 100 21627 17 30 23 3 100 10619 13 36 23 9 100 156
PEW RESEARCH CENTER
www.pewresearch.org
42
Q74. ASK ALL INTERNET AND SMARTPHONE USERS: Do you ever use online social networking sites like (Facebook, Twitter, COUNTRY SPECIFIC EXAMPLES)?
Yes No DK/Refused Total N=
United States Spring, 2015Canada Spring, 2015France Spring, 2015Germany Spring, 2015Italy Spring, 2015Poland Spring, 2015
Spring, 2014Spring, 2013
Spain Spring, 2015United Kingdom Spring, 2015Russia Spring, 2015
Spring, 2014Spring, 2013
Ukraine Spring, 2015Spring, 2014*
Turkey Spring, 2015Spring, 2013
Jordan Spring, 2015Spring, 2014Spring, 2013
Lebanon Spring, 2015Spring, 2014Spring, 2013
Palest. ter. Spring, 2015Israel Spring, 2015Australia Spring, 2015China Spring, 2015
Spring, 2014Spring, 2013
India Spring, 2015Spring, 2014Winter, 2013-2014
Indonesia Spring, 2015Spring, 2014Spring, 2013
Japan Spring, 2015Malaysia Spring, 2015
Spring, 2014Spring, 2013
Pakistan Spring, 2015Philippines Spring, 2015
Spring, 2014Spring, 2013
South Korea Spring, 2015Vietnam Spring, 2015
Spring, 2014Argentina Spring, 2015
Spring, 2014Spring, 2013
Brazil Spring, 2015Spring, 2014Spring, 2013
71 29 0 100 88873 27 0 100 92657 43 0 100 78950 50 0 100 91065 34 1 100 78666 33 0 100 73662 38 0 100 69169 30 0 100 52265 35 0 100 88666 34 0 100 89385 13 2 100 74885 15 0 100 75586 13 1 100 68082 17 2 100 124181 18 1 100 54287 13 0 100 72779 20 1 100 54490 10 0 100 71183 17 0 100 47484 16 0 100 47275 25 0 100 70968 32 0 100 66472 28 0 100 57286 10 4 100 75076 24 0 100 87069 31 0 100 92963 32 5 100 241858 40 2 100 204948 51 1 100 181162 29 9 100 67665 28 7 100 56651 43 6 100 62689 11 0 100 34086 9 5 100 27084 14 2 100 22551 48 0 100 73385 14 1 100 68386 13 1 100 56976 24 0 100 39050 45 5 100 18988 11 0 100 34693 6 1 100 43986 14 0 100 27754 46 0 100 95075 24 0 100 54780 20 0 100 51283 16 1 100 72383 15 2 100 64775 25 1 100 55679 19 1 100 60282 18 0 100 50873 27 0 100 469
PEW RESEARCH CENTER
www.pewresearch.org
43
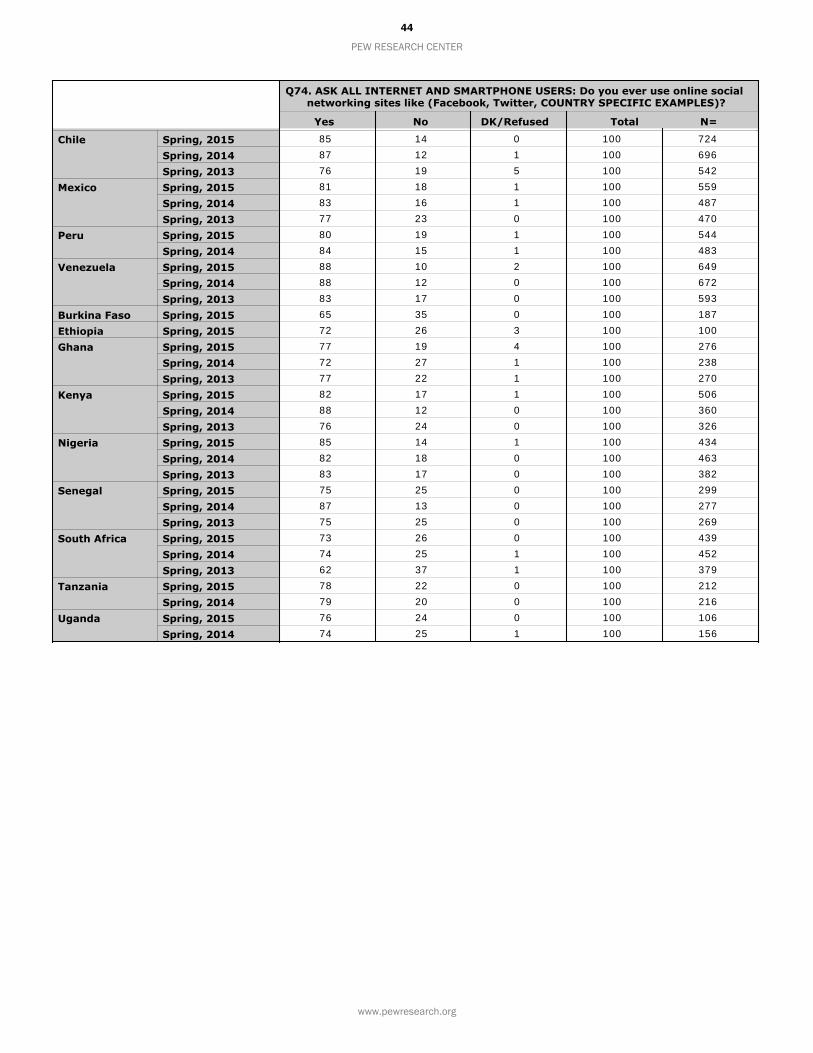
Q74. ASK ALL INTERNET AND SMARTPHONE USERS: Do you ever use online social networking sites like (Facebook, Twitter, COUNTRY SPECIFIC EXAMPLES)?
Yes No DK/Refused Total N=
Chile Spring, 2015Spring, 2014Spring, 2013
Mexico Spring, 2015Spring, 2014Spring, 2013
Peru Spring, 2015Spring, 2014
Venezuela Spring, 2015Spring, 2014Spring, 2013
Burkina Faso Spring, 2015Ethiopia Spring, 2015Ghana Spring, 2015
Spring, 2014Spring, 2013
Kenya Spring, 2015Spring, 2014Spring, 2013
Nigeria Spring, 2015Spring, 2014Spring, 2013
Senegal Spring, 2015Spring, 2014Spring, 2013
South Africa Spring, 2015Spring, 2014Spring, 2013
Tanzania Spring, 2015Spring, 2014
Uganda Spring, 2015Spring, 2014
85 14 0 100 72487 12 1 100 69676 19 5 100 54281 18 1 100 55983 16 1 100 48777 23 0 100 47080 19 1 100 54484 15 1 100 48388 10 2 100 64988 12 0 100 67283 17 0 100 59365 35 0 100 18772 26 3 100 10077 19 4 100 27672 27 1 100 23877 22 1 100 27082 17 1 100 50688 12 0 100 36076 24 0 100 32685 14 1 100 43482 18 0 100 46383 17 0 100 38275 25 0 100 29987 13 0 100 27775 25 0 100 26973 26 0 100 43974 25 1 100 45262 37 1 100 37978 22 0 100 21279 20 0 100 21676 24 0 100 10674 25 1 100 156
PEW RESEARCH CENTER
www.pewresearch.org
44