petrophysical evaluation of uzek well using well log and core data
TRANSCRIPT

Available online at www.pelagiaresearchlibrary.com
Pelagia Research Library
Advances in Applied Science Research, 2012, 3 (5):2966-2991
ISSN: 0976-8610 CODEN (USA): AASRFC
2966 Pelagia Research Library
Petrophysical evaluation of uzek well using well log and core data, Offshore Depobelt, Niger Delta, Nigeria
Adaeze, I. Ulasi; Samuel, O. Onyekuru; and Chukwuma Julian Iwuagwu
Department of Geosciences, Federal University of Technology Owerri, Nigeria
_____________________________________________________________________________________________
ABSTRACT Petrophysical well log and core data were integrated in an analysis of the reservoir characteristics of Uzek Well, Offshore Depobelt, Niger Delta Basin, Nigeria. The study essentially determined reservoir properties such as lithology, depositional environments, shale volume porosity (Φ), permeability (K), fluid saturation, net pay thickness, among others from well logs and cores, which are variables that determine reservoir quality. The original hydrocarbon-in-place of each reservoir was also evaluated based on mean weighted averages of porosity, water saturation, gross rock volumes and net-to-gross ratios. The analysis identified four (4) hydrocarbon-bearing reservoirs (I, P, Q, and R). The Uzek Well sandstone reservoirs were generally coarsening upward sequences with gradational/transitional basal and sharp upper contacts reflecting sedimentation in high energy environments, possibly, the shoreface depositional environment. Average permeability values of the reservoirs is above 1000md, while porosity values ranged between 20-30%, reflecting well sorted coarse grained sandstone reservoirs with minimal cementation, indicating very excellent reservoir quality. Fluid types defined in the reservoirs on the basis of neutron/density log signatures were basically water, oil and gas. Low water saturation (12-54) in the reservoirs of the Uzek Well indicated that the proportion of void spaces occupied by water is low, thus, indicating high hydrocarbon saturation. Quantitative porosity verification using Pearson Correlation Coefficient and Regression Equations revealed significant similarity in the porosity values obtained from petrophysical well log and core data. Plots on scatter diagrams using porosity values derived from petrophysical log and that from core analysis for the four reservoirs obtained correlation coefficient (r) values of 0.7165, 0.8094, 0.5835, and 0.5025, respectively for reservoirs I, P, Q, and R, indicating strong linear relationships. Plots of values of water saturation derived from core analysis and that from petrophysical log for the reservoirs also showed linear trends. Plots of porosity values against permeability values showed fairly strong linear relationships between the two variables in all the reservoirs indicating that Uzek Well reservoirs are permeable and have pores that are in strong communication. The petrophysical properties of the reservoirs in Uzek Well are enough to permit hydrocarbon production. Key words: Niger Delta, Reservoirs, Characterization, Hydrocarbon and Saturation. _____________________________________________________________________________________________
INTRODUCTION
1.1 Background Statement A reservoir is a subsurface rock that has effective porosity and permeability which usually contains commercially exploitable quantity of hydrocarbon. Reservoir characterization is undertaken to determine its capability to both store and transmit fluid. Hence, characterization deals with the determination of reservoir properties/parameters such as porosity (Φ), permeability (K), fluid saturation, and Net Pay thickness. Porosity which is a measure of reservoir storage capacity is defined as the proportion of the total rock volume that is void and filled with fluids. Porosity is a relative measurement and commonly expressed in decimal/fractional units or else as a percentage. Permeability is the capacity of a reservoir rock to permit fluid flow. It is a function of interconnectivity of the pore
Adaeze, I. Ulasi et al Adv. Appl. Sci. Res., 2012, 3(5):2966-2991 _____________________________________________________________________________
2967 Pelagia Research Library
volume; therefore, a rock is permeable if it has an effective porosity. The fluid saturation is the proportion of the pore space that is occupied by the particular fluid. A reservoir can either be water saturated (Sw) or hydrocarbon saturated (1-Sw) depending on the type of fluid it contains. Saturation is a relative measurement and commonly expressed in decimal/fractional units or else as a percentage. A good reservoir is one that is commercially productive; it produces enough oil or gas to pay back its investors for the cost of drilling and leaves a profit. The improvement of reservoir characterization techniques is one of the most important existing and emerging challenges to geoscientists and engineers. Logging tool responses and core data are often used to draw inferences about lithology, depositional environments and fluid content. These inferences are based on empirical models utilizing correlations among tool responses, rock and fluid properties. In many instances, unfortunately, the correlation models cannot be used globally because of the influences of factors not fully considered by the models. These factors include: i. The presence of potassium-feldspar, zircon, etc causes erroneously high calculated volume porosity in kaolinite of shale from the gamma ray log. ii. Micro porosity in kaolinite, chert, etc. leads to high apparent water saturation calculations, and iii. Siderite, pyrite, barite, and smectite influences resistivity, density, and neutron logs calculations. It is well recognized that improvements in reservoir characterization will reduce the amount of unexploitable hydrocarbon. It is worthy to note that the understanding of the depositional setting of a field is fundamentally important in the determination of reserves and in the design of optimum reservoir management procedures. Sands deposited in different depositional environments are characterized by different sand body trend, shape, size, and heterogeneity. This tends to show that the physical characteristics of clastic reservoir rocks reflect the response of a complex interplay of processes operating in depositional environments. Hence, the reconstruction of depositional environments in clastic successions provides optimum framework for describing and predicting reservoir quality distribution. Also, knowledge of depositional environment of reservoirs through accurate description/interpretation of wire line logs and core data allows for a better understanding of reservoir characteristics and hence its quality for optimal utilization of the embedded resources. 1.2 Aim and Objectives of the Study The aim of this study is to integrate petrophysical log data with core data to qualify and quantify reservoirs in order to assess the production potential of Uzek Well, in the Niger Delta. The objectives include: • Determination of reservoir depth and thicknesses in the well. • Knowing the lithology through the identification of sand units from chosen top sand to the last hydrocarbon-bearing sand, using Gamma Ray Log. • Facies analysis by classifying reservoir sands and their depositional environment from the log motifs. • Identification of gas-bearing sands and gas/oil contact from density log in combination with the neutron porosity log. • Interpretation of porosity logs, porosity data, and permeability data. • Comparison of the petrophysical log data with the core data. • Integration of all the available data to evaluate the production potential of the well. 1.3 Scope of Study The ambit of this independent study is limited to the inference of reservoir properties, depositional environment(s) and trend of data of the Uzek Well reservoirs. Microsoft Excel will be used in this work for the computation of average net/gross, porosity, and water saturation. For optimum result, core analysis data will be used to compare the obtained petrophysical log data by using Pearson Correlation Coefficient and Regression Equation to ascertain their level of relationships. This work will preclude many aspects of full petroleum engineering study; however, it will tend to accomplish those aspects that can be managed within the scope of undergraduate study. 1.4 Location of Study Area Uzek Well is located in the offshore depobelt of the Niger Delta Basin, where thick Late Cenozoic Clastic sequence of Agbada Formation were deposited in a deltaic fluvio-marine environment.
Adaeze, I. Ulasi et al Adv. Appl. Sci. Res., 2012, 3(5):2966-2991 _____________________________________________________________________________
2968 Pelagia Research Library
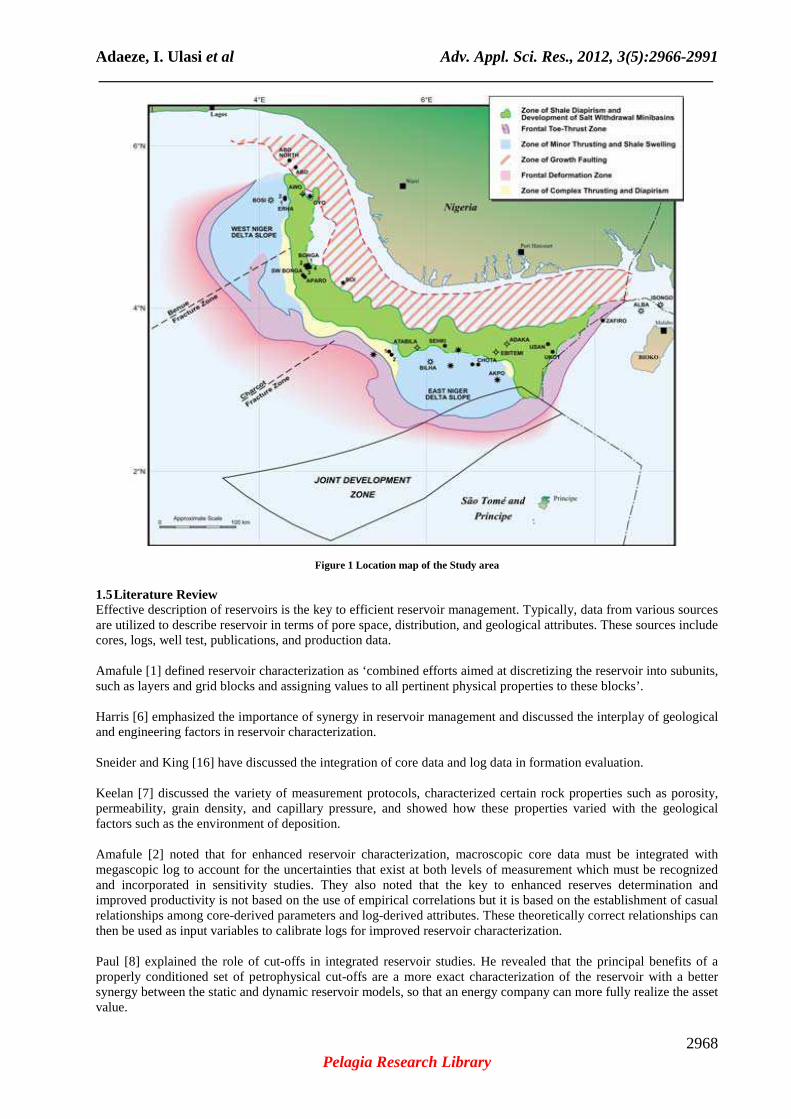
Figure 1 Location map of the Study area 1.5 Literature Review Effective description of reservoirs is the key to efficient reservoir management. Typically, data from various sources are utilized to describe reservoir in terms of pore space, distribution, and geological attributes. These sources include cores, logs, well test, publications, and production data. Amafule [1] defined reservoir characterization as ‘combined efforts aimed at discretizing the reservoir into subunits, such as layers and grid blocks and assigning values to all pertinent physical properties to these blocks’. Harris [6] emphasized the importance of synergy in reservoir management and discussed the interplay of geological and engineering factors in reservoir characterization. Sneider and King [16] have discussed the integration of core data and log data in formation evaluation. Keelan [7] discussed the variety of measurement protocols, characterized certain rock properties such as porosity, permeability, grain density, and capillary pressure, and showed how these properties varied with the geological factors such as the environment of deposition. Amafule [2] noted that for enhanced reservoir characterization, macroscopic core data must be integrated with megascopic log to account for the uncertainties that exist at both levels of measurement which must be recognized and incorporated in sensitivity studies. They also noted that the key to enhanced reserves determination and improved productivity is not based on the use of empirical correlations but it is based on the establishment of casual relationships among core-derived parameters and log-derived attributes. These theoretically correct relationships can then be used as input variables to calibrate logs for improved reservoir characterization. Paul [8] explained the role of cut-offs in integrated reservoir studies. He revealed that the principal benefits of a properly conditioned set of petrophysical cut-offs are a more exact characterization of the reservoir with a better synergy between the static and dynamic reservoir models, so that an energy company can more fully realize the asset value.
Adaeze, I. Ulasi et al Adv. Appl. Sci. Res., 2012, 3(5):2966-2991 _____________________________________________________________________________
2969 Pelagia Research Library
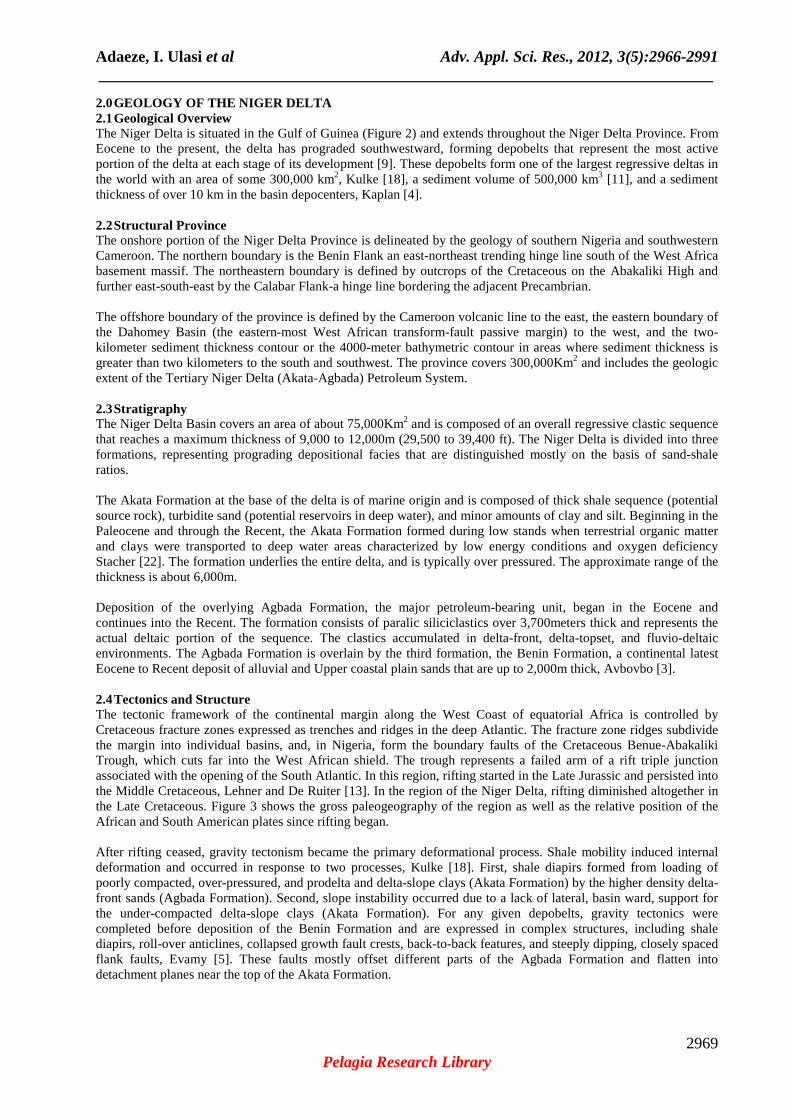
2.0 GEOLOGY OF THE NIGER DELTA 2.1 Geological Overview The Niger Delta is situated in the Gulf of Guinea (Figure 2) and extends throughout the Niger Delta Province. From Eocene to the present, the delta has prograded southwestward, forming depobelts that represent the most active portion of the delta at each stage of its development [9]. These depobelts form one of the largest regressive deltas in the world with an area of some 300,000 km2, Kulke [18], a sediment volume of 500,000 km3 [11], and a sediment thickness of over 10 km in the basin depocenters, Kaplan [4]. 2.2 Structural Province The onshore portion of the Niger Delta Province is delineated by the geology of southern Nigeria and southwestern Cameroon. The northern boundary is the Benin Flank an east-northeast trending hinge line south of the West Africa basement massif. The northeastern boundary is defined by outcrops of the Cretaceous on the Abakaliki High and further east-south-east by the Calabar Flank-a hinge line bordering the adjacent Precambrian. The offshore boundary of the province is defined by the Cameroon volcanic line to the east, the eastern boundary of the Dahomey Basin (the eastern-most West African transform-fault passive margin) to the west, and the two-kilometer sediment thickness contour or the 4000-meter bathymetric contour in areas where sediment thickness is greater than two kilometers to the south and southwest. The province covers 300,000Km2 and includes the geologic extent of the Tertiary Niger Delta (Akata-Agbada) Petroleum System. 2.3 Stratigraphy The Niger Delta Basin covers an area of about 75,000Km2 and is composed of an overall regressive clastic sequence that reaches a maximum thickness of 9,000 to 12,000m (29,500 to 39,400 ft). The Niger Delta is divided into three formations, representing prograding depositional facies that are distinguished mostly on the basis of sand-shale ratios. The Akata Formation at the base of the delta is of marine origin and is composed of thick shale sequence (potential source rock), turbidite sand (potential reservoirs in deep water), and minor amounts of clay and silt. Beginning in the Paleocene and through the Recent, the Akata Formation formed during low stands when terrestrial organic matter and clays were transported to deep water areas characterized by low energy conditions and oxygen deficiency Stacher [22]. The formation underlies the entire delta, and is typically over pressured. The approximate range of the thickness is about 6,000m. Deposition of the overlying Agbada Formation, the major petroleum-bearing unit, began in the Eocene and continues into the Recent. The formation consists of paralic siliciclastics over 3,700meters thick and represents the actual deltaic portion of the sequence. The clastics accumulated in delta-front, delta-topset, and fluvio-deltaic environments. The Agbada Formation is overlain by the third formation, the Benin Formation, a continental latest Eocene to Recent deposit of alluvial and Upper coastal plain sands that are up to 2,000m thick, Avbovbo [3]. 2.4 Tectonics and Structure The tectonic framework of the continental margin along the West Coast of equatorial Africa is controlled by Cretaceous fracture zones expressed as trenches and ridges in the deep Atlantic. The fracture zone ridges subdivide the margin into individual basins, and, in Nigeria, form the boundary faults of the Cretaceous Benue-Abakaliki Trough, which cuts far into the West African shield. The trough represents a failed arm of a rift triple junction associated with the opening of the South Atlantic. In this region, rifting started in the Late Jurassic and persisted into the Middle Cretaceous, Lehner and De Ruiter [13]. In the region of the Niger Delta, rifting diminished altogether in the Late Cretaceous. Figure 3 shows the gross paleogeography of the region as well as the relative position of the African and South American plates since rifting began. After rifting ceased, gravity tectonism became the primary deformational process. Shale mobility induced internal deformation and occurred in response to two processes, Kulke [18]. First, shale diapirs formed from loading of poorly compacted, over-pressured, and prodelta and delta-slope clays (Akata Formation) by the higher density delta-front sands (Agbada Formation). Second, slope instability occurred due to a lack of lateral, basin ward, support for the under-compacted delta-slope clays (Akata Formation). For any given depobelts, gravity tectonics were completed before deposition of the Benin Formation and are expressed in complex structures, including shale diapirs, roll-over anticlines, collapsed growth fault crests, back-to-back features, and steeply dipping, closely spaced flank faults, Evamy [5]. These faults mostly offset different parts of the Agbada Formation and flatten into detachment planes near the top of the Akata Formation.

Adaeze, I. Ulasi et al Adv. Appl. Sci. Res., 2012, 3(5):2966-2991 _____________________________________________________________________________
2970 Pelagia Research Library
Figure 2 Index map of the Niger Delta showing province outline.
Figure 3 Paleogeography showing the opening of the south Atlantic, and development of the region around Niger Delta.
2.5 Lithology Lithologies of Cretaceous rocks deposited in what is now the Niger Delta basin can only be extrapolated from the exposed Cretaceous section in the next basin to the northeast--the Anambra Basin (Figures 4 & 5). From the Campanian through the Paleocene, the shoreline was concave into the Anambra Basin, Hospers [11] resulting in convergent longshore drift cells that produced tide-dominated deltaic sedimentation during transgressions and river-dominated sedimentation during regressions, Reijers [19]. Shallow marine clastics were deposited farther offshore and, in the Anambra Basin, are represented by the Albian-Cenomanian Asu River Group, Cenomanian-Santonian Eze-Aku and Awgu Shale, and Campanian/Maastrichtian Nkporo Shale, among others, Nwachukwu, [15], Reijers [19]. The distribution of Late Cretaceous shale beneath the Niger Delta is unknown (Figure 4).
Adaeze, I. Ulasi et al Adv. Appl. Sci. Res., 2012, 3(5):2966-2991 _____________________________________________________________________________
2971 Pelagia Research Library
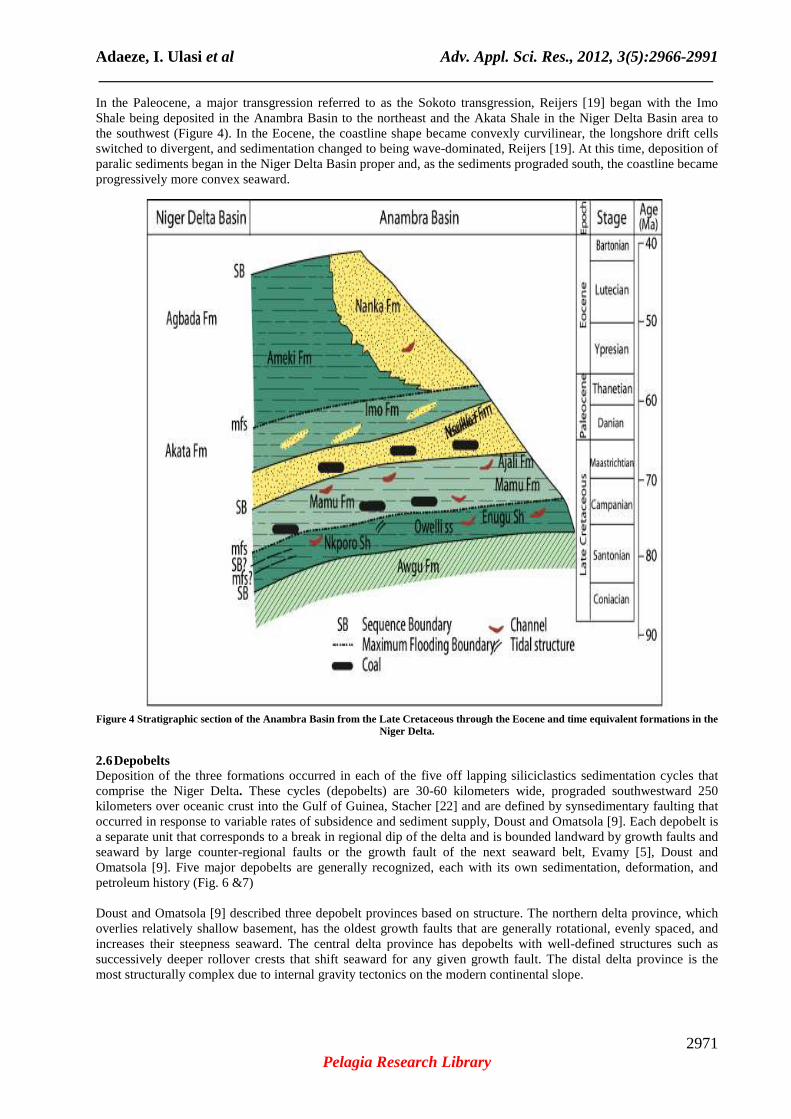
In the Paleocene, a major transgression referred to as the Sokoto transgression, Reijers [19] began with the Imo Shale being deposited in the Anambra Basin to the northeast and the Akata Shale in the Niger Delta Basin area to the southwest (Figure 4). In the Eocene, the coastline shape became convexly curvilinear, the longshore drift cells switched to divergent, and sedimentation changed to being wave-dominated, Reijers [19]. At this time, deposition of paralic sediments began in the Niger Delta Basin proper and, as the sediments prograded south, the coastline became progressively more convex seaward.
Figure 4 Stratigraphic section of the Anambra Basin from the Late Cretaceous through the Eocene and time equivalent formations in the Niger Delta.
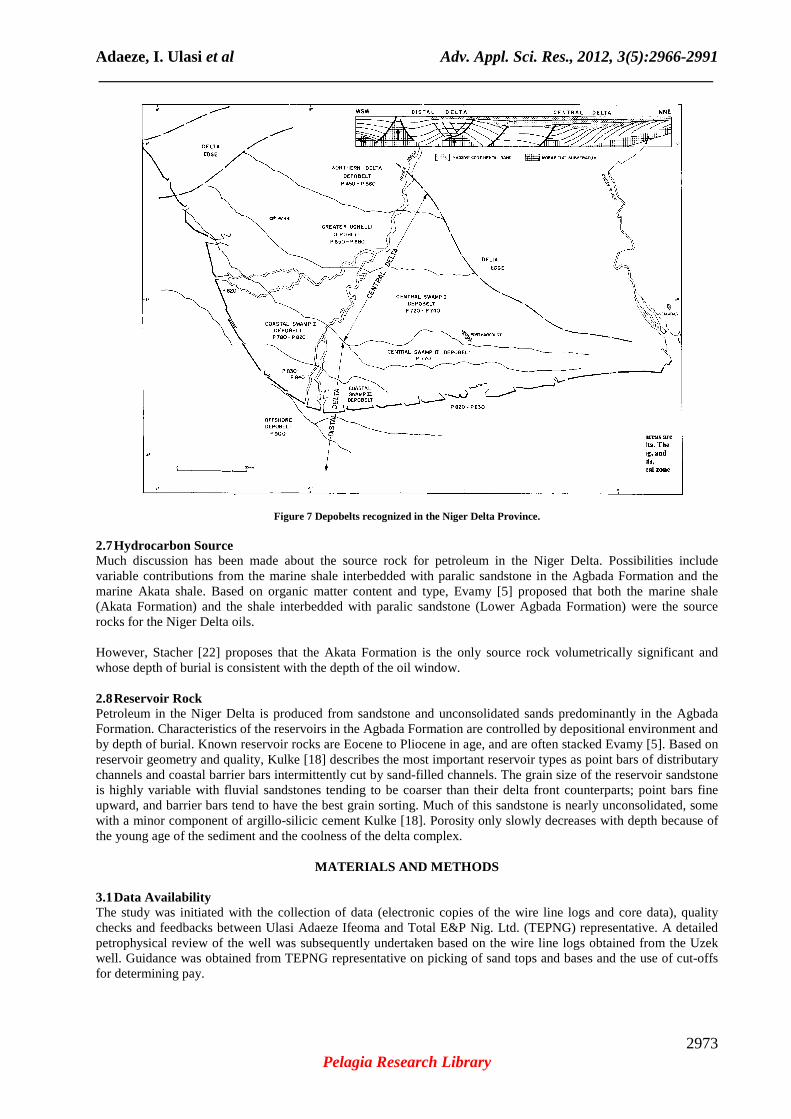
2.6 Depobelts Deposition of the three formations occurred in each of the five off lapping siliciclastics sedimentation cycles that comprise the Niger Delta. These cycles (depobelts) are 30-60 kilometers wide, prograded southwestward 250 kilometers over oceanic crust into the Gulf of Guinea, Stacher [22] and are defined by synsedimentary faulting that occurred in response to variable rates of subsidence and sediment supply, Doust and Omatsola [9]. Each depobelt is a separate unit that corresponds to a break in regional dip of the delta and is bounded landward by growth faults and seaward by large counter-regional faults or the growth fault of the next seaward belt, Evamy [5], Doust and Omatsola [9]. Five major depobelts are generally recognized, each with its own sedimentation, deformation, and petroleum history (Fig. 6 &7) Doust and Omatsola [9] described three depobelt provinces based on structure. The northern delta province, which overlies relatively shallow basement, has the oldest growth faults that are generally rotational, evenly spaced, and increases their steepness seaward. The central delta province has depobelts with well-defined structures such as successively deeper rollover crests that shift seaward for any given growth fault. The distal delta province is the most structurally complex due to internal gravity tectonics on the modern continental slope.

Adaeze, I. Ulasi et al Adv. Appl. Sci. Res., 2012, 3(5):2966-2991 _____________________________________________________________________________
2972 Pelagia Research Library
Figure 5 Stratigraphic columns showing the three formations of the Niger Delta.
Figure 6 Progradation of the Niger Delta coastline since 35Ma.
Adaeze, I. Ulasi et al Adv. Appl. Sci. Res., 2012, 3(5):2966-2991 _____________________________________________________________________________
2973 Pelagia Research Library
Figure 7 Depobelts recognized in the Niger Delta Province.
2.7 Hydrocarbon Source Much discussion has been made about the source rock for petroleum in the Niger Delta. Possibilities include variable contributions from the marine shale interbedded with paralic sandstone in the Agbada Formation and the marine Akata shale. Based on organic matter content and type, Evamy [5] proposed that both the marine shale (Akata Formation) and the shale interbedded with paralic sandstone (Lower Agbada Formation) were the source rocks for the Niger Delta oils. However, Stacher [22] proposes that the Akata Formation is the only source rock volumetrically significant and whose depth of burial is consistent with the depth of the oil window. 2.8 Reservoir Rock Petroleum in the Niger Delta is produced from sandstone and unconsolidated sands predominantly in the Agbada Formation. Characteristics of the reservoirs in the Agbada Formation are controlled by depositional environment and by depth of burial. Known reservoir rocks are Eocene to Pliocene in age, and are often stacked Evamy [5]. Based on reservoir geometry and quality, Kulke [18] describes the most important reservoir types as point bars of distributary channels and coastal barrier bars intermittently cut by sand-filled channels. The grain size of the reservoir sandstone is highly variable with fluvial sandstones tending to be coarser than their delta front counterparts; point bars fine upward, and barrier bars tend to have the best grain sorting. Much of this sandstone is nearly unconsolidated, some with a minor component of argillo-silicic cement Kulke [18]. Porosity only slowly decreases with depth because of the young age of the sediment and the coolness of the delta complex.
MATERIALS AND METHODS 3.1 Data Availability The study was initiated with the collection of data (electronic copies of the wire line logs and core data), quality checks and feedbacks between Ulasi Adaeze Ifeoma and Total E&P Nig. Ltd. (TEPNG) representative. A detailed petrophysical review of the well was subsequently undertaken based on the wire line logs obtained from the Uzek well. Guidance was obtained from TEPNG representative on picking of sand tops and bases and the use of cut-offs for determining pay.

Adaeze, I. Ulasi et al Adv. Appl. Sci. Res., 2012, 3(5):2966-2991 _____________________________________________________________________________
2974 Pelagia Research Library
3.2 Determination of Lithology from Wire Line Logs A manual interpretation of lithology of the Uzek well was undertaken using all the logs registered through a systematic approach. The gross lithology was corroborated and compared at the same depth, horizontally, to the gamma ray log. The interpretation then continued, again horizontally, through the other logs- resistivity, sonic, and density-neutron. At depths where all the logs corroborated the same interpretation, the lithology was noted and then compared to cores. At depths where the lithology did not corroborate, a ‘feedback’ from one log to the next was done by way of log quality checking to correct the mismatch. 3.3 Estimation of Petrophysical Parameters Listings of the various reservoir parameters by depth were also generated during the course of the study. 3.3.1 Net/Gross The gross reservoir thickness H, of the Uzek Well was determined by looking at tops and bases of the reservoir sands across the well. The net thickness which is the thickness of the reservoir was determined by defining basis for non reservoir and reservoir sands using the gamma ray log. This was carried out by drawing a shale baseline and sand baseline on the gamma ray log. The thicknesses of the shale, hshale, within the reservoir sands were obtained and therefore, subtracted from the gross reservoir thickness. Hence, Net reservoir thickness, h = H - hshale, and Net/Gross = h/H, was obtained for all the reservoirs in the Uzek Well. 3.3.2 Shale and Clay Volume The minimum of gamma ray was used to compute shale volume as shown in equation 1. VCL= (GRlog-GRmin)/ (GRmax-GRmin)……………………………...1 Where, VCL = Volume of Clay GRlog = Gamma Ray Log reading of formation GRmin = Gamma Ray Matrix (Clay free zone) GRmax = Gamma Ray Shale (100% Clay zone) 3.3.3 Porosity Total porosity was calculated from density-neutron log as shown in the following relationship: Ф= (ðma - ðb)/ (ðma - ðfl)……………………………............2 Where, Ф=porosity derived from density log ðma =matrix (or grain) density ðb = bulk density (as measured by the tool and hence includes porosity and grain density) ðfl = fluid density. Effective porosity was estimated according to equation 3 Фe = {(ðma – ðb)/ (ðma – ðfl)} - {V CL * (ðma – ðsh)/ (ðma – ðfl)}……3 Where, Фe = Effective porosity ðsh = Density of shale VCL * (ðma – ðsh)/ (ðma – ðfl) = Clay Bound Water (ðma = 2.65g/cc, ðfl = 1.0g/cc, ðsh = 2.6g/cc) 3.3.4 Water Saturation Archie Equation was used to calculate the water saturation as shown in equation 4, and the Indonesian Equation was used to calculate the effective water saturation as shown in equation 5, due to its wide-scale applicability in the Niger Delta. Sw = n√(a.Rw/ Фm.Rt)…………………………….....4 Swe = n√1/ {(VCL 2/ Rtcl) + (Фem/a.Rw)}*Rt……….5 ( a = 1.0, m = 1.6, n = 2, Rtcl = 2.5)

Adaeze, I. Ulasi et al Adv. Appl. Sci. Res., 2012, 3(5):2966-2991 _____________________________________________________________________________
2975 Pelagia Research Library
Where, Rtcl = Deep resistivity in clay (read from log) Rt = Deep Resistivity Rw = Down hole water resistivity Ф = Effective porosity Sw = water saturation Swe = Effective water saturation a = Archie’s exponent m = cementation factor n = Saturation exponent, it is the gradient of the line defined on the plot. 3.3.5 Net Pay A porosity cut-off of 10% was used along with a shale volume cut-off of 51% to define the quality of the reservoir rock. Water saturation, Sw, cut-off value of 60% was used to define pay. The reservoirs were defined by the porosity greater than 10% and shale volume less than 51%. For the net pay, if the water saturation within the reservoir is less than 60%, it is considered to contain hydrocarbon. 3.4 Hydrocarbons-in-place Volumes The original hydrocarbon-in-place of each reservoir was evaluated using deterministic approach. This was based on mean weighted averages of porosity, water saturation, gross rock volumes and net-to-gross ratios. 3.5 Cores Cores were used as a reference to compare with the lithology interpreted from the wire line logs. Cores essentially gave proper understanding of wire line logs and provided an interpreter that recorded real subsurface lithologies. 3.6 Cross-Plots In this study, three types of well log cross-plots between two variables were done and the resulting series of points were used to define the relationships between the variables. The cross-plots include: i. Cross-plots of compatible logs measuring the same parameter such as the porosity logs, that is, neutron-density cross-plot. ii. Cross-plots of incompatible logs that do not measure the same parameter, such as a plot of gamma ray against neutron values. iii. Cross-plots of core sample values against log values, such as porosity core values against petrophysical porosity values.
RESULTS AND INTERPRETATION
4.1 Log Characteristics of the Uzek Well Reservoirs All available electrical logs (gamma, resistivity, neutron, density, and sonic) for the Uzek well in the area of study were examined. They show that the reservoirs were easily identified on the logs. The gamma ray log shows the Uzek reservoir sandstone as a low gamma ray reading unit. Intercalated siltstones, mudstones, and shaly partings show as minor deflections within the sandstone unit. The resistivity log is generally characterized by relatively higher resistivities opposite the sandstone than the subjacent and superjacent shales. This may be in part a reflection of the sandstone’s contained fluid-hydrocarbons. But even in these cases of relatively high resistivities, it may be that the readings are lower than they would be if it were not for the resistivity reduction due to the presence of clays. In cases where there are tight, cemented sandstone streaks within the porous sandstone, the resistivity readings are abnormally high, while the heterolithic sandstones and shaly partings are shown as low resistivity readings. On the neutron-density curve, the gross Uzek well sandstone ideally shows increasing density porosity values, and decreasing neutron porosity values. This depicts gas bearing effect superimposed on the lithology effect as evidenced by the divergence of the two curves. Also minor influence on the separation of the two curves indicates oil-bearing reservoir. The following figure shows an example of the electrical log responses to the Uzek well sandstone lithology.

Adaeze, I. Ulasi et al Adv. Appl. Sci. Res., 2012, 3(5):2966-2991 _____________________________________________________________________________
2976 Pelagia Research Library
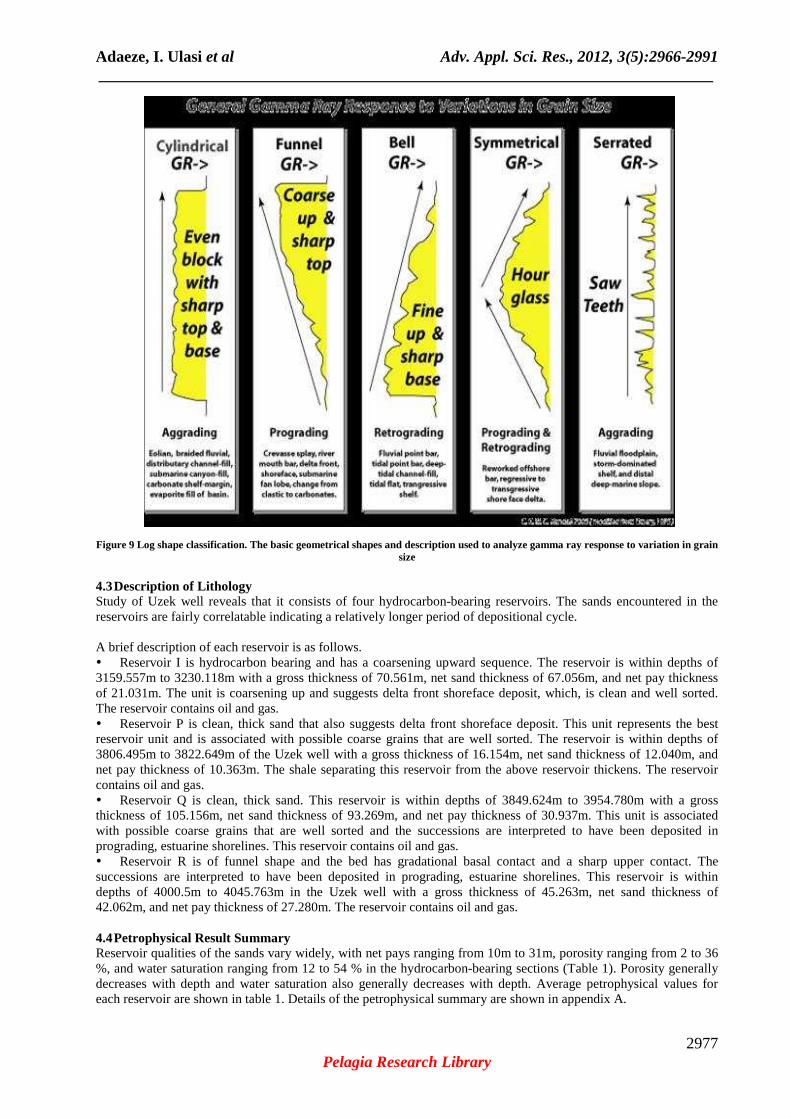
Figure 8 Electrical log responses to the Uzek sandstone lithology 4.2 Definition of Reservoir Boundaries, Hydrocarbon Types, and Trend of Data The reservoir zones were qualitatively identified using the log signatures by way of eliminating the shale beds and compact beds. Beds with high gamma ray, low resistivity, low density, and high neutron readings indicated shale and were thus eliminated. The reservoir zones were also quantitatively identified by clay volume, porosity, and fluid content determinations through the use of some empirical equations already mentioned. Based on the qualitative and quantitative interpretations, twenty (20) reservoirs were identified and labeled A to T. After carefully applying water saturation cut-off value of 60% to define net pay, four (4) hydrocarbon-bearing reservoirs were easily identified and located within depths 3159.557m to 3230.118m, 3806.495m to 3822.649m, 3849.624m to 3954.780m, and 4000.5m to 4045.763m of the Uzek Well. These reservoirs were labeled reservoir I, P, Q, and R respectively. The hydrocarbon types were defined in these reservoirs based on the evidence drawn from the neutron density log signatures at their corresponding depths. A separation of the neutron and density log with the neutron log deflecting to the right and density log to the left indicated gas. A balloon shape also typified gas while the tracking together of the two curves indicated oil in the reservoirs. The trend of data of Uzek Well sandstones were inferred as coarsening upward sequence based on the log shape in its sandstone bodies. Uzek sandstone beds are of funnel shape with gradational/transitional basal contact and sharp upper contact. Also, since grain size variations are used in sedimentology as an indicator of depositional environment, Uzek well sandstones which are coarse-grained are associated with high energy environment. Figure 9 shows gamma ray log shape characteristics associated with different environments.
Adaeze, I. Ulasi et al Adv. Appl. Sci. Res., 2012, 3(5):2966-2991 _____________________________________________________________________________
2977 Pelagia Research Library
Figure 9 Log shape classification. The basic geometrical shapes and description used to analyze gamma ray response to variation in grain
size 4.3 Description of Lithology Study of Uzek well reveals that it consists of four hydrocarbon-bearing reservoirs. The sands encountered in the reservoirs are fairly correlatable indicating a relatively longer period of depositional cycle. A brief description of each reservoir is as follows. � Reservoir I is hydrocarbon bearing and has a coarsening upward sequence. The reservoir is within depths of 3159.557m to 3230.118m with a gross thickness of 70.561m, net sand thickness of 67.056m, and net pay thickness of 21.031m. The unit is coarsening up and suggests delta front shoreface deposit, which, is clean and well sorted. The reservoir contains oil and gas. � Reservoir P is clean, thick sand that also suggests delta front shoreface deposit. This unit represents the best reservoir unit and is associated with possible coarse grains that are well sorted. The reservoir is within depths of 3806.495m to 3822.649m of the Uzek well with a gross thickness of 16.154m, net sand thickness of 12.040m, and net pay thickness of 10.363m. The shale separating this reservoir from the above reservoir thickens. The reservoir contains oil and gas. � Reservoir Q is clean, thick sand. This reservoir is within depths of 3849.624m to 3954.780m with a gross thickness of 105.156m, net sand thickness of 93.269m, and net pay thickness of 30.937m. This unit is associated with possible coarse grains that are well sorted and the successions are interpreted to have been deposited in prograding, estuarine shorelines. This reservoir contains oil and gas. � Reservoir R is of funnel shape and the bed has gradational basal contact and a sharp upper contact. The successions are interpreted to have been deposited in prograding, estuarine shorelines. This reservoir is within depths of 4000.5m to 4045.763m in the Uzek well with a gross thickness of 45.263m, net sand thickness of 42.062m, and net pay thickness of 27.280m. The reservoir contains oil and gas. 4.4 Petrophysical Result Summary Reservoir qualities of the sands vary widely, with net pays ranging from 10m to 31m, porosity ranging from 2 to 36 %, and water saturation ranging from 12 to 54 % in the hydrocarbon-bearing sections (Table 1). Porosity generally decreases with depth and water saturation also generally decreases with depth. Average petrophysical values for each reservoir are shown in table 1. Details of the petrophysical summary are shown in appendix A.
Adaeze, I. Ulasi et al Adv. Appl. Sci. Res., 2012, 3(5):2966-2991 _____________________________________________________________________________
2978 Pelagia Research Library
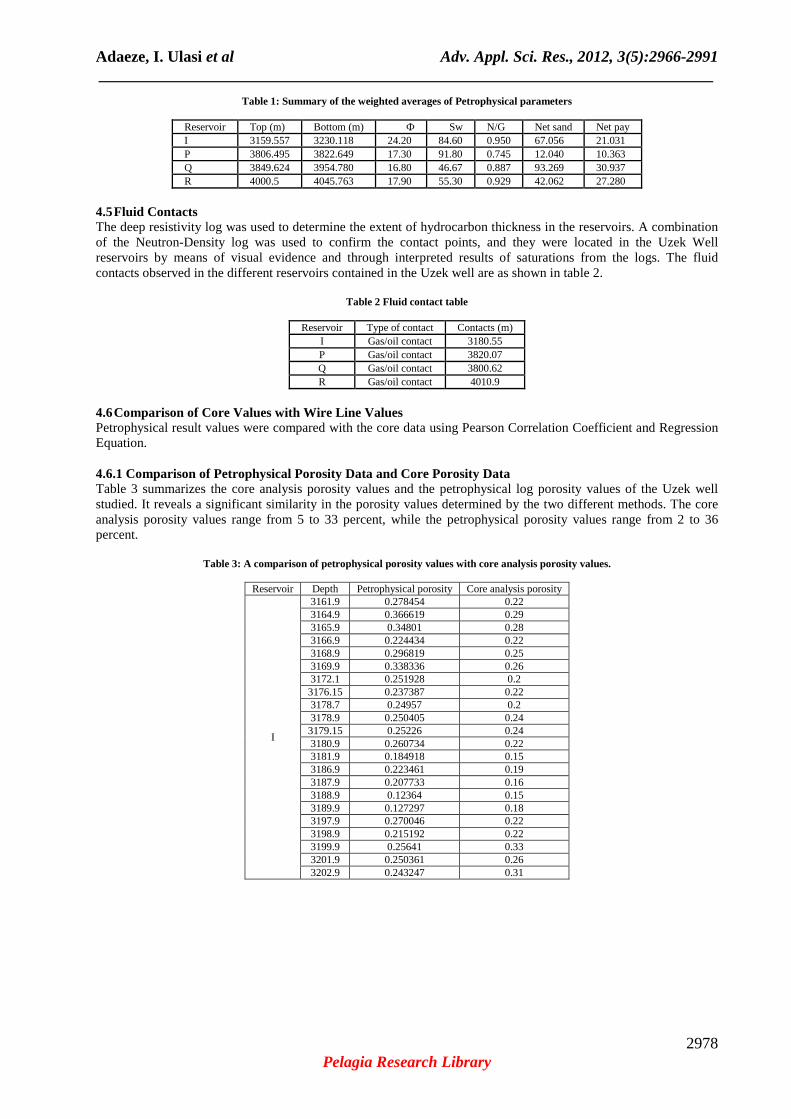
Table 1: Summary of the weighted averages of Petrophysical parameters
Reservoir Top (m) Bottom (m) Ф Sw N/G Net sand Net pay I 3159.557 3230.118 24.20 84.60 0.950 67.056 21.031 P 3806.495 3822.649 17.30 91.80 0.745 12.040 10.363 Q 3849.624 3954.780 16.80 46.67 0.887 93.269 30.937 R 4000.5 4045.763 17.90 55.30 0.929 42.062 27.280
4.5 Fluid Contacts The deep resistivity log was used to determine the extent of hydrocarbon thickness in the reservoirs. A combination of the Neutron-Density log was used to confirm the contact points, and they were located in the Uzek Well reservoirs by means of visual evidence and through interpreted results of saturations from the logs. The fluid contacts observed in the different reservoirs contained in the Uzek well are as shown in table 2.
Table 2 Fluid contact table
Reservoir Type of contact Contacts (m) I Gas/oil contact 3180.55 P Gas/oil contact 3820.07 Q Gas/oil contact 3800.62 R Gas/oil contact 4010.9
4.6 Comparison of Core Values with Wire Line Values Petrophysical result values were compared with the core data using Pearson Correlation Coefficient and Regression Equation. 4.6.1 Comparison of Petrophysical Porosity Data and Core Porosity Data Table 3 summarizes the core analysis porosity values and the petrophysical log porosity values of the Uzek well studied. It reveals a significant similarity in the porosity values determined by the two different methods. The core analysis porosity values range from 5 to 33 percent, while the petrophysical porosity values range from 2 to 36 percent.
Table 3: A comparison of petrophysical porosity values with core analysis porosity values.
Reservoir Depth Petrophysical porosity Core analysis porosity
I
3161.9 0.278454 0.22 3164.9 0.366619 0.29 3165.9 0.34801 0.28 3166.9 0.224434 0.22 3168.9 0.296819 0.25 3169.9 0.338336 0.26 3172.1 0.251928 0.2 3176.15 0.237387 0.22 3178.7 0.24957 0.2 3178.9 0.250405 0.24 3179.15 0.25226 0.24 3180.9 0.260734 0.22 3181.9 0.184918 0.15 3186.9 0.223461 0.19 3187.9 0.207733 0.16 3188.9 0.12364 0.15 3189.9 0.127297 0.18 3197.9 0.270046 0.22 3198.9 0.215192 0.22 3199.9 0.25641 0.33 3201.9 0.250361 0.26 3202.9 0.243247 0.31

Adaeze, I. Ulasi et al Adv. Appl. Sci. Res., 2012, 3(5):2966-2991 _____________________________________________________________________________
2979 Pelagia Research Library
Reservoir Depth Petrophysical porosity Core analysis porosity
P
3816.5 0.290043 0.21 3819.8 0.134752 0.17 3820.8 0.258257 0.16 3821.61 0.251327 0.17 3821.8 0.207481 0.15 3823.35 0.12349 0.21 3824.8 0.055933 0.13 3825.8 0.04115 0.09 3827.8 0.046145 0.1 3828.8 0.043291 0.07 3830.8 0.015301 0.06 3842.8 0.008712 0.05
Q
3848.8 0.038729 0.07 3850.55 0.222859 0.17 3850.8 0.216836 0.16 3852.8 0.199278 0.15 3854.8 0.228355 0.16 3855.35 0.189234 0.21 3855.8 0.202317 0.14 3856.8 0.247433 0.21 3856.81 0.237402 0.19 3859.2 0.1744674 0.17 3860.2 0.061964 0.18 3861.42 0.280783 0.19 3862.2 0.253223 0.2 3867.2 0.20817 0.19 3869.2 0.187631 0.15 3869.6 0.21441 0.19 3871.2 0.203875 0.14 3872.2 0.187451 0.15 3875.2 0.202543 0.15 3878.2 0.156436 0.13 3880.85 0.175746 0.14 3881.2 0.157692 0.14 3885.2 0.146087 0.15 3886.2 0.175688 0.19 3887.05 0.158489 0.13 3887.2 0.149927 0.13 3888.2 0.189737 0.19 3891.2 0.20411 0.2 3893.2 0.137736 0.14 3894.85 0.160019 0.16 3897.2 0.148028 0.13
R
4005.9 0.221819 0.16 4009.9 0.197328 0.18 4010.9 0.208662 0.18 4014.9 0.164914 0.17 4018.9 0.187741 0.15 4019.9 0.174955 0.16 4020.9 0.157955 0.13 4023.9 0.197869 0.16 4025.9 0.139167 0.18 4029.9 0.226077 0.2 4030.9 0.209023 0.19 4032.9 0.173894 0.15 4033.9 0.215237 0.2 4037.9 0.105774 0.19 4038.9 0.209876 0.2 4042.9 0.133685 0.16 4043.9 0.193654 0.2 4044.9 0.191351 0.19
The petrophysical log porosity values and the core analysis porosity values of the four reservoirs of the Uzek well were plotted as a scatter diagram (fig. 10, 11, 12, 13). They show approximate linear relationship between the two variables. The correlation coefficient r values of 0.7165, 0.8094, 0.5835, and 0.5025 were obtained for reservoirs I, P, Q, and R respectively, indicating a strong linear relationship. A linear regression equation of y = 0.9343x + 0.0366, y = 1.4931x – 0.0724, y = 0.9154x + 0.0326, and y = 0.4804x + 0.1057 were also computed for the petrophysical log porosity values and core analysis porosity data in reservoirs I, P, Q, and R respectively, and were used to fit a regression line to the set of points (fig. 10, 11, 12, and 13 ).

Adaeze, I. Ulasi et al Adv. Appl. Sci. Res., 2012, 3(5):2966-2991 _____________________________________________________________________________
2980 Pelagia Research Library
y = 0.9343x + 0.0366
0
0.05
0.1
0.15
0.2
0.25
0.3
0.35
0.4
0 0.05 0.1 0.15 0.2 0.25 0.3 0.35
Petrophysical Log Porosity (fraction)
Core
poro
sity
(frac
tion)
Figure 10 Core porosity data vs. petrophysical log porosity plot for reservoir I
y = 1.4931x - 0.0724
0
0.05
0.1
0.15
0.2
0.25
0.3
0.35
0 0.05 0.1 0.15 0.2 0.25
Petrophysical Log Porosity (fraction)
Core
Poro
sity
(frac
tion)
Figure 11 Core porosity data vs. petrophysical log porosity plot for reservoir P

Adaeze, I. Ulasi et al Adv. Appl. Sci. Res., 2012, 3(5):2966-2991 _____________________________________________________________________________
2981 Pelagia Research Library
y = 0.9154x + 0.0326
0
0.05
0.1
0.15
0.2
0.25
0.3
0 0.05 0.1 0.15 0.2 0.25
Petrophysical Log Porosity (fraction)
Core
Poro
sity
(frac
tion)
Figure 12 Core porosity data vs. petrophysical log porosity plot for reservoir Q
y = 0.4804x + 0.1057
0
0.05
0.1
0.15
0.2
0.25
0 0.05 0.1 0.15 0.2 0.25
Petrophysical Log Porosity (fraction)
Core
Poro
sity
(frac
tion)
Figure 13 Core porosity data vs. petrophysical log porosity plot for reservoir R
Adaeze, I. Ulasi et al Adv. Appl. Sci. Res., 2012, 3(5):2966-2991 _____________________________________________________________________________
2982 Pelagia Research Library
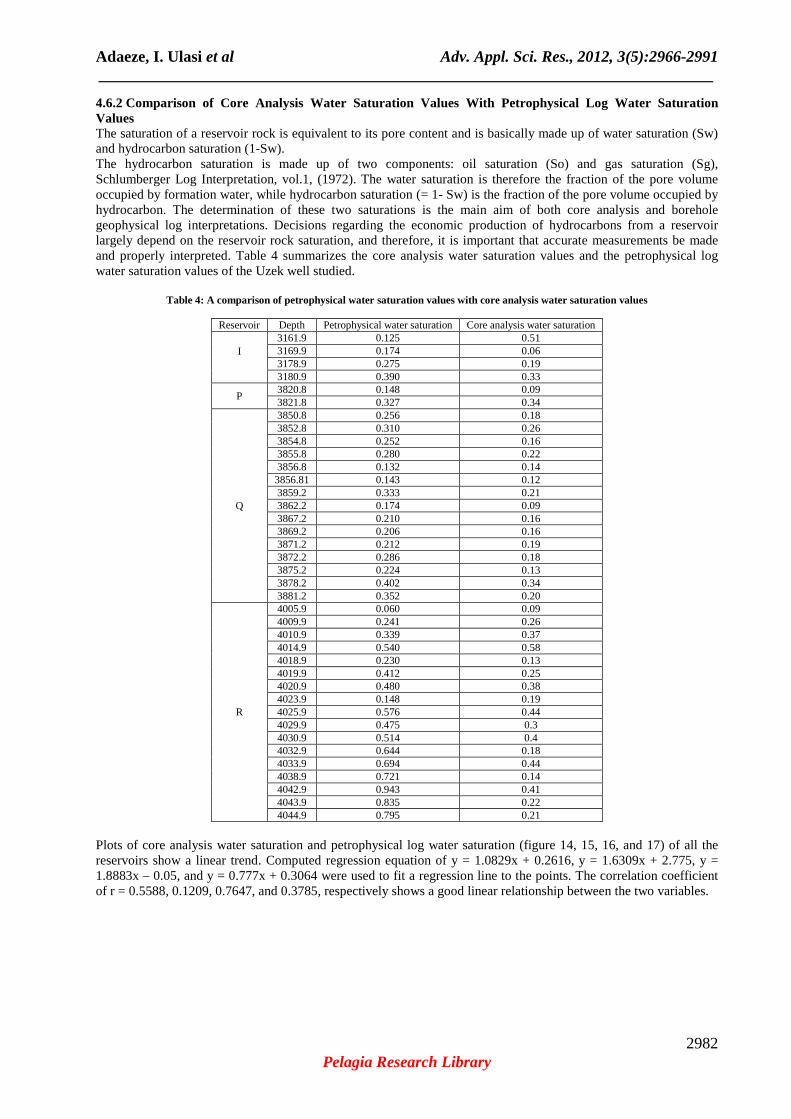
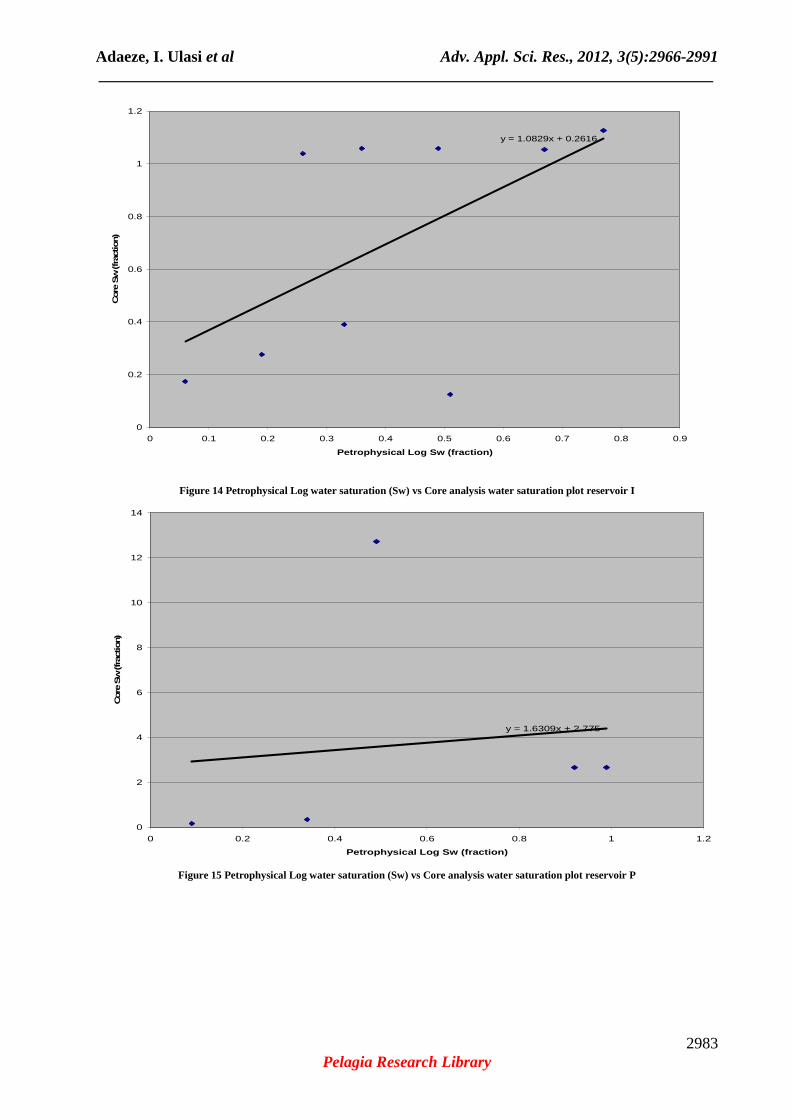
4.6.2 Comparison of Core Analysis Water Saturation Values With Petrophysical Log Water Saturation Values The saturation of a reservoir rock is equivalent to its pore content and is basically made up of water saturation (Sw) and hydrocarbon saturation (1-Sw). The hydrocarbon saturation is made up of two components: oil saturation (So) and gas saturation (Sg), Schlumberger Log Interpretation, vol.1, (1972). The water saturation is therefore the fraction of the pore volume occupied by formation water, while hydrocarbon saturation (= 1- Sw) is the fraction of the pore volume occupied by hydrocarbon. The determination of these two saturations is the main aim of both core analysis and borehole geophysical log interpretations. Decisions regarding the economic production of hydrocarbons from a reservoir largely depend on the reservoir rock saturation, and therefore, it is important that accurate measurements be made and properly interpreted. Table 4 summarizes the core analysis water saturation values and the petrophysical log water saturation values of the Uzek well studied.
Table 4: A comparison of petrophysical water saturation values with core analysis water saturation values
Reservoir Depth Petrophysical water saturation Core analysis water saturation
I
3161.9 0.125 0.51 3169.9 0.174 0.06 3178.9 0.275 0.19 3180.9 0.390 0.33
P 3820.8 0.148 0.09 3821.8 0.327 0.34
Q
3850.8 0.256 0.18 3852.8 0.310 0.26 3854.8 0.252 0.16 3855.8 0.280 0.22 3856.8 0.132 0.14 3856.81 0.143 0.12 3859.2 0.333 0.21 3862.2 0.174 0.09 3867.2 0.210 0.16 3869.2 0.206 0.16 3871.2 0.212 0.19 3872.2 0.286 0.18 3875.2 0.224 0.13 3878.2 0.402 0.34 3881.2 0.352 0.20
R
4005.9 0.060 0.09 4009.9 0.241 0.26 4010.9 0.339 0.37 4014.9 0.540 0.58 4018.9 0.230 0.13 4019.9 0.412 0.25 4020.9 0.480 0.38 4023.9 0.148 0.19 4025.9 0.576 0.44 4029.9 0.475 0.3 4030.9 0.514 0.4 4032.9 0.644 0.18 4033.9 0.694 0.44 4038.9 0.721 0.14 4042.9 0.943 0.41 4043.9 0.835 0.22 4044.9 0.795 0.21
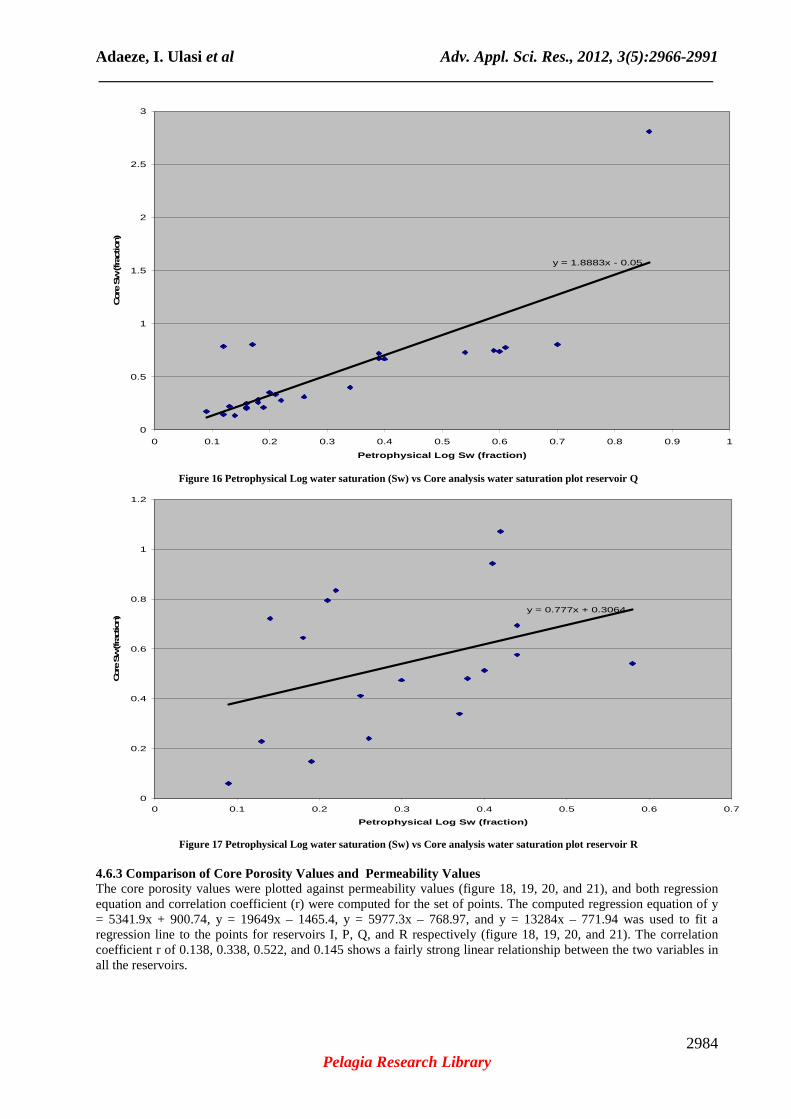
Plots of core analysis water saturation and petrophysical log water saturation (figure 14, 15, 16, and 17) of all the reservoirs show a linear trend. Computed regression equation of y = 1.0829x + 0.2616, y = 1.6309x + 2.775, y = 1.8883x – 0.05, and y = 0.777x + 0.3064 were used to fit a regression line to the points. The correlation coefficient of r = 0.5588, 0.1209, 0.7647, and 0.3785, respectively shows a good linear relationship between the two variables.
Adaeze, I. Ulasi et al Adv. Appl. Sci. Res., 2012, 3(5):2966-2991 _____________________________________________________________________________
2983 Pelagia Research Library
y = 1.0829x + 0.2616
0
0.2
0.4
0.6
0.8
1
1.2
0 0.1 0.2 0.3 0.4 0.5 0.6 0.7 0.8 0.9
Petrophysical Log Sw (fraction)
Core
Sw
(frac
tion)
Figure 14 Petrophysical Log water saturation (Sw) vs Core analysis water saturation plot reservoir I
y = 1.6309x + 2.775
0
2
4
6
8
10
12
14
0 0.2 0.4 0.6 0.8 1 1.2
Petrophysical Log Sw (fraction)
Core
Sw
(frac
tion)
Figure 15 Petrophysical Log water saturation (Sw) vs Core analysis water saturation plot reservoir P
Adaeze, I. Ulasi et al Adv. Appl. Sci. Res., 2012, 3(5):2966-2991 _____________________________________________________________________________
2984 Pelagia Research Library
y = 1.8883x - 0.05
0
0.5
1
1.5
2
2.5
3
0 0.1 0.2 0.3 0.4 0.5 0.6 0.7 0.8 0.9 1
Petrophysical Log Sw (fraction)
Core
Sw
(frac
tion)
Figure 16 Petrophysical Log water saturation (Sw) vs Core analysis water saturation plot reservoir Q
y = 0.777x + 0.3064
0
0.2
0.4
0.6
0.8
1
1.2
0 0.1 0.2 0.3 0.4 0.5 0.6 0.7
Petrophysical Log Sw (fraction)
Core
Sw (frac
tion)
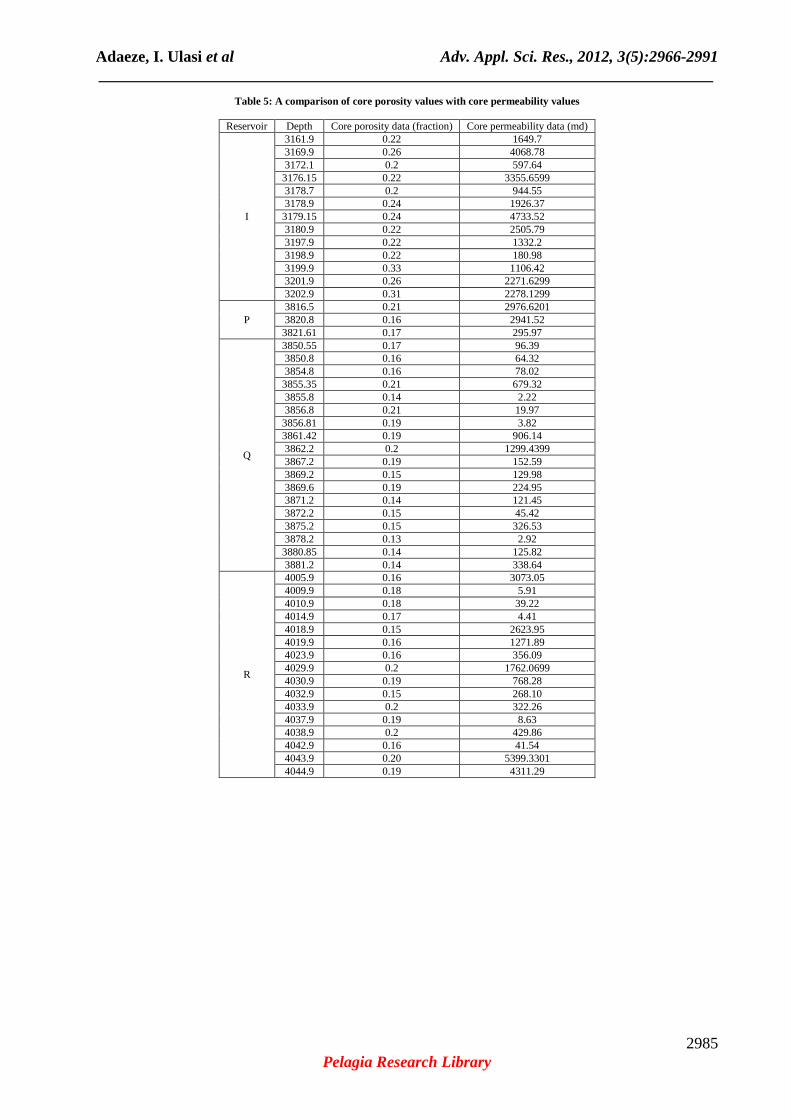
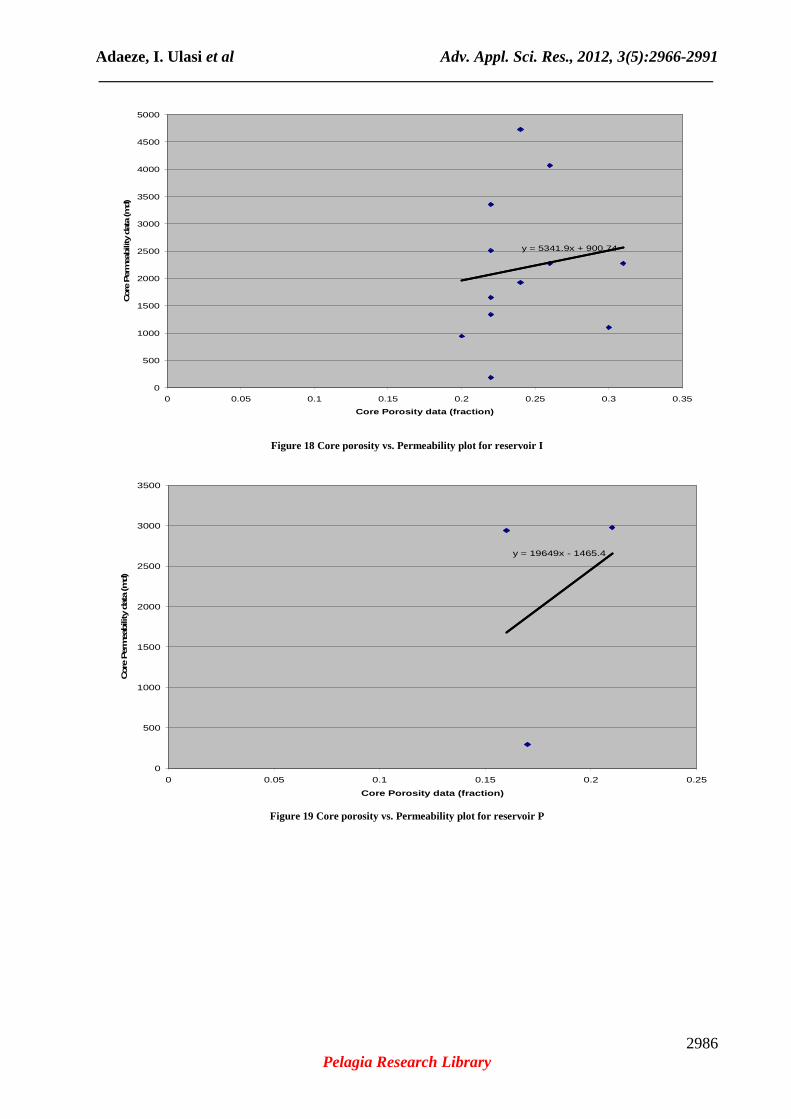
Figure 17 Petrophysical Log water saturation (Sw) vs Core analysis water saturation plot reservoir R 4.6.3 Comparison of Core Porosity Values and Permeability Values The core porosity values were plotted against permeability values (figure 18, 19, 20, and 21), and both regression equation and correlation coefficient (r) were computed for the set of points. The computed regression equation of y = 5341.9x + 900.74, y = 19649x – 1465.4, y = 5977.3x – 768.97, and y = 13284x – 771.94 was used to fit a regression line to the points for reservoirs I, P, Q, and R respectively (figure 18, 19, 20, and 21). The correlation coefficient r of 0.138, 0.338, 0.522, and 0.145 shows a fairly strong linear relationship between the two variables in all the reservoirs.
Adaeze, I. Ulasi et al Adv. Appl. Sci. Res., 2012, 3(5):2966-2991 _____________________________________________________________________________
2985 Pelagia Research Library
Table 5: A comparison of core porosity values with core permeability values
Reservoir Depth Core porosity data (fraction) Core permeability data (md)
I
3161.9 0.22 1649.7 3169.9 0.26 4068.78 3172.1 0.2 597.64 3176.15 0.22 3355.6599 3178.7 0.2 944.55 3178.9 0.24 1926.37 3179.15 0.24 4733.52 3180.9 0.22 2505.79 3197.9 0.22 1332.2 3198.9 0.22 180.98 3199.9 0.33 1106.42 3201.9 0.26 2271.6299 3202.9 0.31 2278.1299
P 3816.5 0.21 2976.6201 3820.8 0.16 2941.52 3821.61 0.17 295.97
Q
3850.55 0.17 96.39 3850.8 0.16 64.32 3854.8 0.16 78.02 3855.35 0.21 679.32 3855.8 0.14 2.22 3856.8 0.21 19.97 3856.81 0.19 3.82 3861.42 0.19 906.14 3862.2 0.2 1299.4399 3867.2 0.19 152.59 3869.2 0.15 129.98 3869.6 0.19 224.95 3871.2 0.14 121.45 3872.2 0.15 45.42 3875.2 0.15 326.53 3878.2 0.13 2.92 3880.85 0.14 125.82 3881.2 0.14 338.64
R
4005.9 0.16 3073.05 4009.9 0.18 5.91 4010.9 0.18 39.22 4014.9 0.17 4.41 4018.9 0.15 2623.95 4019.9 0.16 1271.89 4023.9 0.16 356.09 4029.9 0.2 1762.0699 4030.9 0.19 768.28 4032.9 0.15 268.10 4033.9 0.2 322.26 4037.9 0.19 8.63 4038.9 0.2 429.86 4042.9 0.16 41.54 4043.9 0.20 5399.3301 4044.9 0.19 4311.29
Adaeze, I. Ulasi et al Adv. Appl. Sci. Res., 2012, 3(5):2966-2991 _____________________________________________________________________________
2986 Pelagia Research Library
y = 5341.9x + 900.74
0
500
1000
1500
2000
2500
3000
3500
4000
4500
5000
0 0.05 0.1 0.15 0.2 0.25 0.3 0.35
Core Porosity data (fraction)
Core
Per
mea
bili
ty d
ata
(md)
Figure 18 Core porosity vs. Permeability plot for reservoir I
y = 19649x - 1465.4
0
500
1000
1500
2000
2500
3000
3500
0 0.05 0.1 0.15 0.2 0.25
Core Porosity data (fraction)
Core
Per
mea
bili
ty d
ata
(md)
Figure 19 Core porosity vs. Permeability plot for reservoir P

Adaeze, I. Ulasi et al Adv. Appl. Sci. Res., 2012, 3(5):2966-2991 _____________________________________________________________________________
2987 Pelagia Research Library
y = 5977.3x - 768.97
0
200
400
600
800
1000
1200
1400
0 0.05 0.1 0.15 0.2 0.25
Core Porosity data (fraction)
Core
Per
mea
bili
ty d
ata
(md)
Figure 20 Core porosity vs. Permeability plot for reservoir Q
y = 13284x - 771.94
0
1000
2000
3000
4000
5000
6000
0 0.05 0.1 0.15 0.2 0.25
Core Porosity data (fraction)
Core
Per
mea
bili
ty d
ata
(md)
Figure 21 Core porosity vs. Permeability plot for reservoir R

Adaeze, I. Ulasi et al Adv. Appl. Sci. Res., 2012, 3(5):2966-2991 _____________________________________________________________________________
2988 Pelagia Research Library
DISCUSSION
5.1 Reservoir Quality and Grain Size Petroleum reservoirs are dominantly clastic or carbonate rocks. Shale or clay beds are not good reservoir rocks because they lack both effective porosity and permeability and can act as barriers to the lateral and vertical flow of fluids, thus, the inclusion of shale particles and clay minerals within a sandstone or carbonate matrix will tend to reduce the quality of the formation as a reservoir. Therefore, the grain size of Uzek Well was inferred from the gamma ray log by its response to clay minerals/contents. Uzek Well log revealed that gamma ray values increased to the right of the track with high clay contents and fine-grain size, and decreased to the left indicating coarse-grained sands and low clay gamma ray values. The decrease in clay content was linked to an increase in the grain size and this relationship led to a direct correlation between facies and log shape, and the close relationship between the gamma ray log and sandstone grain size. 5.2 Analysis of Petrophysical Parameter Estimation Net/gross ratio was used to define the proportion of the intervals that were considered to be reservoirs and it aided in the understanding of the formation. This ratio is unitless and reflects the overall quality of a zone not minding its thickness. These intervals indicated areas/units where sand deposition is concentrated, and where better reservoir quality is to be found with variations in the quality of sand. In attempting to distinguish net reservoirs and net pay intervals in the Uzek Well, cut-offs were used and zones which are porous and permeable were easily identified. Gamma ray, neutron, and density logs were used as indirect indicators of permeability of the Uzek Well reservoirs because core is generally of limited extent and could not be relied on to define all net reservoir zones, hence, reliance was placed on the wire line log data due to the fact that it indicated the presence of fluid invasion by mud filtrate. Low gamma ray reading indicated low clay content and higher permeability, while high neutron density porosity indicated high permeability. The applied cut-offs were used to define the limits of the porous, permeable, and hydrocarbon producing zones in the Uzek Well and these zones were selected based on statistical analysis. According to Rider [20], the following tables give better explanation of porosity and permeability description of reservoirs.
Table 6 Qualitative Evaluation of Porosity
Percentage Porosity (%) Qualitative Description 0 - 5 Negligible 5 - 10 Poor 15 - 20 Good 20 – 30 Very Good
> 30 Excellent
Table 7 Qualitative Evaluation of Permeability
Average K_Value (md) Qualitative Description <10.5 Poor to fair
15 – 50 Moderate 50 – 250 Good
250 – 1000 Very Good > 1000 Excellent
The average water saturation revealed the proportion of void space occupied by water in the Uzek Well reservoirs based on the calculations made, and it showed that water saturation of the reservoirs are low, thus, high hydrocarbon saturation and high hydrocarbon production. 5.3 Porosity and Permeability Relationship in Uzek Well Porosity is often related to permeability, this is particularly evident in clastics but often less predictable in carbonates. Cross plots of core porosity against permeability of the Uzek Well reservoirs show that low gamma ray value indicated low clay content and higher permeability, and high neutron density porosity indicated high permeability. Also, the correlation coefficient values obtained show a fairly strong linear relationship between the two variables in all the reservoirs. This reveals that Uzek Well reservoirs are permeable and have porosities of some form that are in communication. 5.4 Analysis of Cross Plots Cross plots were done to verify log calculated values against those derived from core analysis data. The persistent

Adaeze, I. Ulasi et al Adv. Appl. Sci. Res., 2012, 3(5):2966-2991 _____________________________________________________________________________
2989 Pelagia Research Library
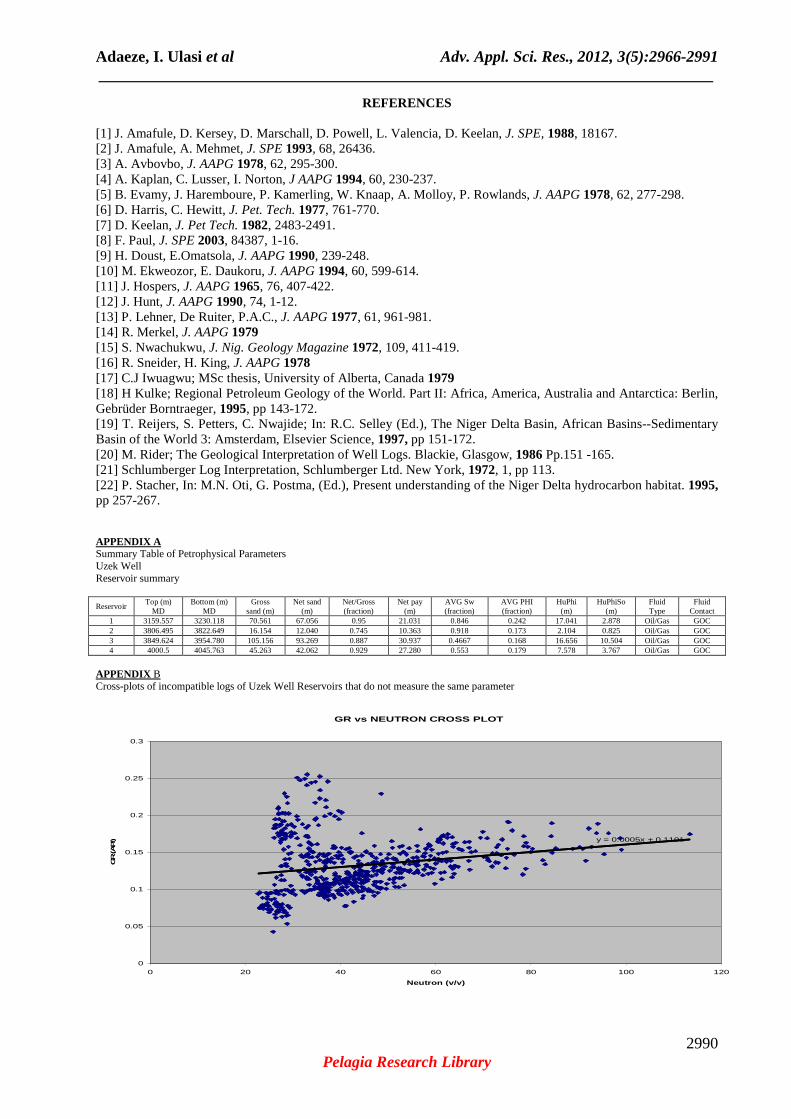
difference between log and core porosities is an indication of the difference in their physical conditions which explains the fact that core porosities are measured under atmospheric conditions, while log porosities are measured under reservoir conditions, notably of pressure and temperature. Cross plotting neutron and density porosity values was done to identify pure matrix and their related porosity. The cross plotting of incompatible logs was done to quantify lithology. The gamma ray log values were plotted against the neutron log values to bring out the relationships between the two. This plot shows that there is a consistent, straight line relationship between the two where both the gamma ray and the neutron logs are reacting to a shale-sandstone mixture. Each log shows the volume of shale in its own way. Through the straight line region, changes in porosity typically involve changes in shale content. However, in the very clean sandstones there are variations in porosity which do not involve shale and the relationship between the two logs changes. The sands in the Uzek Well reservoirs are gas and oil filled and the changes in porosity affect the neutron log considerably, diminishing it as porosity increases. On the gamma ray alone, these changes are not seen but when the logs were plotted together, the relationship became evident. On the same plot, at higher gamma ray and neutron values, there is also a relationship break due to organic matter. Since the neutron tool reacts to all hydrogen present, it reacts to the hydrogen combined with carbon in organic matter. Thus, while the gamma ray values diminish as the organic matter replaces the shale; the neutron values increased or remained high. The neutron-gamma ray plot is very useful particularly in analyzing shale changes in general.
CONCLUSION
The characterization of the Uzek Well reservoir sand bodies was made possible by the careful integration of well log responses and core information. The study examined the vertical sequence of lithologies of the sand bodies, trend of data, and log interpretation. A detailed petrophysical parameter estimation of the Uzek Well showed that: 1. Reservoir quality was found to be strongly influenced by grain size. 2. In reservoirs where porosities are high permeabilities are equally high and vice versa. 3. These high values of porosities and permeabilities are attributed to the well sorted nature of the sands. 4. Porosity and permeability increased with increasing reservoir quality. 5. Average water saturation values range from 12 to 54, while the average hydrocarbon saturation values range from 35 to 94. 6. The formation is medium - coarse grained, well to well sorted sand that occur in upper shoreface environment. 7. Quantitative porosity verification shows good correlation between log and core porosities. The discrepancies existing in cross plots are due to the heterogeneities of the formation and to the fact that the core data are from spot sample measurements, while log represent an average and continuous measurement. Based on geologic interpretations, the Uzek Well reservoir sands are inferred to be deposited or formed in a tidally influenced progradational shoreline environment. The sands are interlaminated with clays towards the base and become progressively clay free sand upward. They show funnel shaped log signatures that are serrated at the bottom which can be attributed to sedimentation rate exceeding rate of subsidence. The quality of the reservoirs as determined by the permeability is excellent with permeability values above 1000md, and by porosity is very good with porosity values between 20 to 30 percent. Thus, the grain size of the reservoir could be inferred to as being coarse and uniformly arranged with low cementation. A petrophysical log porosity value of 20 to 36 percent or core analysis porosity value of 25 to 40 percent is necessary to generate any measurable permeability and permit hydrocarbon production from these reservoirs. Decisions on economic production of hydrocarbons from the Uzek Well should not be based solely on electrical log responses and core laboratory analysis data, but should also consider evidence obtained from other techniques used in reservoir characterization. Acknowledgement Authors acknowledge the assistance of the Department of Petroleum Resources (DPR) Port Harcourt for making it possible for me to get academic data without hitches, and the Geosciences and Reservoir (GSR) Department of Total E & P Nig. Ltd. (TEPNG) Port Harcourt, for granting access to the well logs and core data used for the project also thank all members of staff of the department of Geosciences of the Federal University of Technology (FUTO) who in one way or the other made my study period worthwhile.
Adaeze, I. Ulasi et al Adv. Appl. Sci. Res., 2012, 3(5):2966-2991 _____________________________________________________________________________
2990 Pelagia Research Library
REFERENCES
[1] J. Amafule, D. Kersey, D. Marschall, D. Powell, L. Valencia, D. Keelan, J. SPE, 1988, 18167. [2] J. Amafule, A. Mehmet, J. SPE 1993, 68, 26436. [3] A. Avbovbo, J. AAPG 1978, 62, 295-300. [4] A. Kaplan, C. Lusser, I. Norton, J AAPG 1994, 60, 230-237. [5] B. Evamy, J. Haremboure, P. Kamerling, W. Knaap, A. Molloy, P. Rowlands, J. AAPG 1978, 62, 277-298. [6] D. Harris, C. Hewitt, J. Pet. Tech. 1977, 761-770. [7] D. Keelan, J. Pet Tech. 1982, 2483-2491. [8] F. Paul, J. SPE 2003, 84387, 1-16. [9] H. Doust, E.Omatsola, J. AAPG 1990, 239-248. [10] M. Ekweozor, E. Daukoru, J. AAPG 1994, 60, 599-614. [11] J. Hospers, J. AAPG 1965, 76, 407-422. [12] J. Hunt, J. AAPG 1990, 74, 1-12. [13] P. Lehner, De Ruiter, P.A.C., J. AAPG 1977, 61, 961-981. [14] R. Merkel, J. AAPG 1979 [15] S. Nwachukwu, J. Nig. Geology Magazine 1972, 109, 411-419. [16] R. Sneider, H. King, J. AAPG 1978 [17] C.J Iwuagwu; MSc thesis, University of Alberta, Canada 1979 [18] H Kulke; Regional Petroleum Geology of the World. Part II: Africa, America, Australia and Antarctica: Berlin, Gebrüder Borntraeger, 1995, pp 143-172. [19] T. Reijers, S. Petters, C. Nwajide; In: R.C. Selley (Ed.), The Niger Delta Basin, African Basins--Sedimentary Basin of the World 3: Amsterdam, Elsevier Science, 1997, pp 151-172. [20] M. Rider; The Geological Interpretation of Well Logs. Blackie, Glasgow, 1986 Pp.151 -165. [21] Schlumberger Log Interpretation, Schlumberger Ltd. New York, 1972, 1, pp 113. [22] P. Stacher, In: M.N. Oti, G. Postma, (Ed.), Present understanding of the Niger Delta hydrocarbon habitat. 1995, pp 257-267. APPENDIX A Summary Table of Petrophysical Parameters Uzek Well Reservoir summary
Reservoir Top (m)
MD Bottom (m)
MD Gross
sand (m) Net sand
(m) Net/Gross (fraction)
Net pay (m)
AVG Sw (fraction)
AVG PHI (fraction)
HuPhi (m)
HuPhiSo (m)
Fluid Type
Fluid Contact
1 3159.557 3230.118 70.561 67.056 0.95 21.031 0.846 0.242 17.041 2.878 Oil/Gas GOC 2 3806.495 3822.649 16.154 12.040 0.745 10.363 0.918 0.173 2.104 0.825 Oil/Gas GOC 3 3849.624 3954.780 105.156 93.269 0.887 30.937 0.4667 0.168 16.656 10.504 Oil/Gas GOC 4 4000.5 4045.763 45.263 42.062 0.929 27.280 0.553 0.179 7.578 3.767 Oil/Gas GOC
APPENDIX B Cross-plots of incompatible logs of Uzek Well Reservoirs that do not measure the same parameter
GR vs NEUTRON CROSS PLOT
y = 0.0005x + 0.1101
0
0.05
0.1
0.15
0.2
0.25
0.3
0 20 40 60 80 100 120
Neutron (v/v)
GR (API)

Adaeze, I. Ulasi et al Adv. Appl. Sci. Res., 2012, 3(5):2966-2991 _____________________________________________________________________________
2991 Pelagia Research Library
APPENDIX C Cross-plots of compatible logs of Uzek Well Reservoirs measuring the same parameter
NEUTRON vs DENSITY CROSS PLOT
y = 0.1643x + 2.2653
0
0.5
1
1.5
2
2.5
3
0 0.05 0.1 0.15 0.2 0.25 0.3
NEUTRON (V/V)
DENSITY (g/cc)