peterborough victoria northumberland and …
TRANSCRIPT

PETERBOROUGH VICTORIA NORTHUMBERLAND AND
CLARINGTON CATHOLIC DISTRICT SCHOOL BOARD
NOTRE DAME CATHOLIC ELEMENTARY SCHOOL
SCHOOL INFORMATION PROFILE
APRIL 30, 2017

Notre Dame CES
P a g e | 2
Peterborough Victoria Northumberland and Clarington
Catholic District School Board
School Information Profile
All of the information contained within the School Information Profile (SIP) relates to the
requirements as outlined within the Ministry of Education’s Revised Pupil Accommodation
Guideline issued March 26, 2015. The following table of contents outlines the areas to be
addressed and the relevant page number within the SIP document.
Table of Contents
Section Item Pages
1 FACILITY INFORMATION 3–10 1.1 General Information 3 1.2 Site Plan 4 1.2 Site Plan - Assessment of Parking 5 1.3 Aerial Photo 5 1.4 Room Summary from SFIS 6 1.5 Floor Plan 7 1.6 Boundary Map 8 1.7 Official Plan 9 1.8 Zoning Map 10
2 FACILITY CONDITION 11-13 2.1 Facility Index Value 11 2.2 10 Year Renewal History 11 2.3 5 Year Renewal Requirements 12 2.4 School Utility Costs 12
2.5 School Accessibility Measures 13
3 STUDENT DATA 13-15
3.1 Enrolment History (10 year) 13
3.2 Enrolment Projections (10 Year) 14
3.3 Student Proximity Measure 14
3.4 Out of Area Students 15
3.5 Student Transportation Data 15
4 INSTRUCTIONAL DATA 16-18 4.1 Staff Allocation to School 16 4.2 Specialized Courses and Programs Offered 16 4.3 Grade Organization (Elementary) 16-17 4.4 Extra-Curricular Activities 17-18
5 OTHER DATA 18-19 5.1 Non-School Programs and Services 18 5.2 Facility Partnerships at School 18 5.3 Community Use of Schools Data 19 5.4 Child Care 19
6 FAITH FORMATION/PARISH INFORMATION 20

Notre Dame CES
P a g e | 3
SECTION 1 - FACILITY INFORMATION
1.1 General Information
The following table provides general information from the School Information Profile for the
particular school. Data contained in this table will be replaced with the actual data for each
school.
School Name Notre Dame Catholic Elementary School
Address 760 Burnham Street, Cobourg ON
Panel Elementary
Grades Served JK-8 with Gr7&8 French Immersion. By Sept.2018, JK-8 English only. French Immersion will have transitioned back to St. Michael.
Ministry on-the-Ground Capacity (OTG) 230
Current Enrolment as of October 31 281
Current Utilization Rate 122%
Building Area (sq. ft.) (from Integrated Facility Assessment Report)
20,700 sq. ft.
Site Area (Acres) 6.2 acres
Date(s) of Construction 1962 original school (36%), 1967 addition (64%)
Hard Surface Play Area (sq. ft.) 15,526 sq. ft.
Number of Parking Spaces 35 (includes 1 handicap space)
Number of Portable Classrooms 6-pack (one classroom converted to washrooms)
Child Care on Site No
Name of Child Care Provider N/A
Type of Child Care N/A
Child Care Capacity N/A
Child Care Enrolment and Ages served N/A

Notre Dame CES
P a g e | 4
1.2 Site Plan
The following provides a map showing the school site, the location of the building, the
parking areas, driveways, pick-up and drop-off areas for buses and cars, existing portables,
outdoor play areas, kindergarten play areas, building entrances, child care entrances, child
care centres or licensed discrete space uses.

Notre Dame CES
P a g e | 5
1.2 Site Plan (Cont’d)
Assessment of Parking
Provide a written assessment of the parking, pick-up and drop-off areas as outlined on the
site plan above, and any required improvements or studies that should be undertaken to
improve the site.
1.3 Aerial Photo
The following provides an aerial photo showing the school site, the property outline of the
school and adjacent land uses.
Parking lot does not separate buses from cars. Buses stay on the street.
The number of parking spaces is adequate.

Notre Dame CES
P a g e | 6
1.4 Room Summary from SFIS
The following is a sample room loading template which is provided for the purposes of
illustration. The actual template will be submitted for each affected school.
Date: July 18, 2016
SFIS ID and Name: 9263
Room Number
Space Type Current Use Loading Loading FC Comments
1 Classroom Classroom 23.0000 23.0000
2 Classroom Classroom 23.0000 23.0000
3 Classroom Classroom 23.0000 23.0000
4 Classroom Classroom 23.0000 23.0000
5 Classroom Classroom 23.0000 23.0000
6 Classroom Classroom 23.0000 23.0000
7 Classroom Classroom 23.0000 23.0000
8 Classroom Classroom 23.0000 23.0000
9 Classroom Kindergarten 23.0000 23.0000
10 Classroom Classroom 23.0000 23.0000
11 General Purpose Room
General Purpose Room
0.0000 0.0000
12 Library Res. Centre Library Resource 0.0000 0.0000
211 Staff Work Room/Lounge
Staff Work Room/Lounge
0.0000 0.0000
OTG 230.0
Notre Dame CES
P a g e | 7
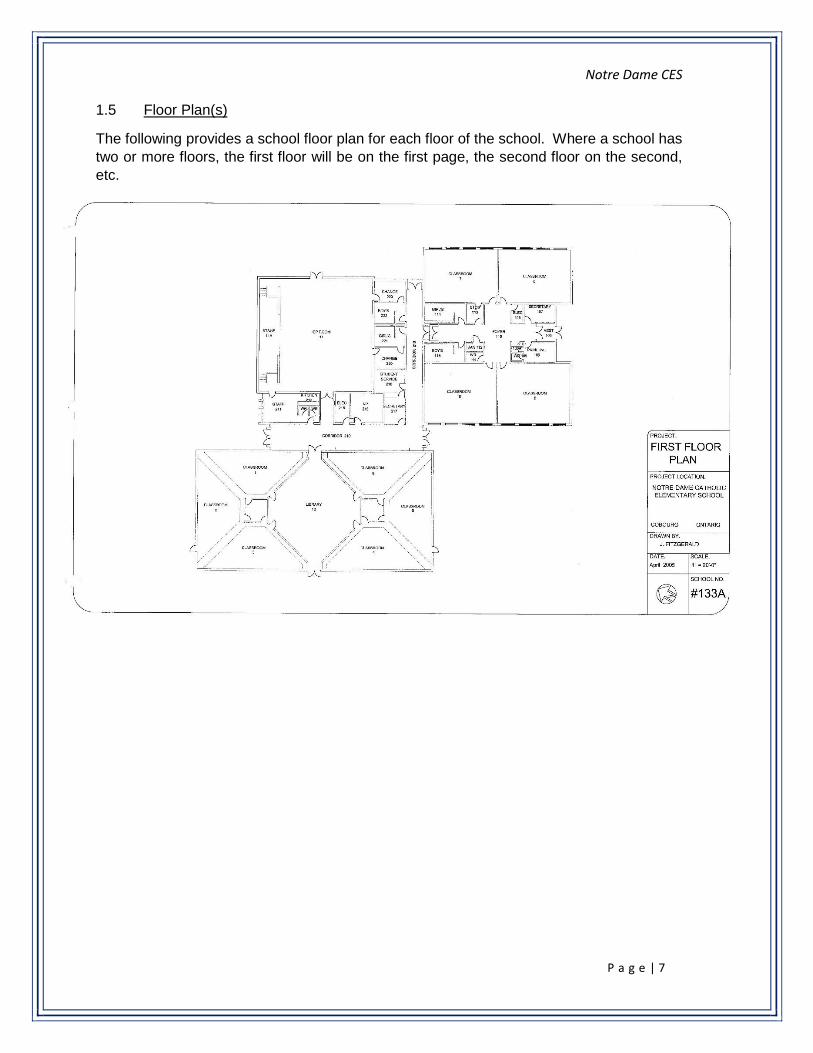
1.5 Floor Plan(s)
The following provides a school floor plan for each floor of the school. Where a school has
two or more floors, the first floor will be on the first page, the second floor on the second,
etc.

Notre Dame CES
P a g e | 8
1.6 Boundary Map
The following provides a map showing the school location and the boundary for the school
for each program. Where a school serves both a regular tract and French program, the
regular tract boundary will be on the first page and the French program boundary(s) will be
shown on subsequent pages.

Notre Dame CES
P a g e | 9
1.7 Official Plan
The following provides a map showing the school site, the current official plan or secondary
plan designation from the municipality for the school site and adjacent lands. The official
plan description is added below the map or on an adjacent page.
Notre Dame CES
P a g e | 10
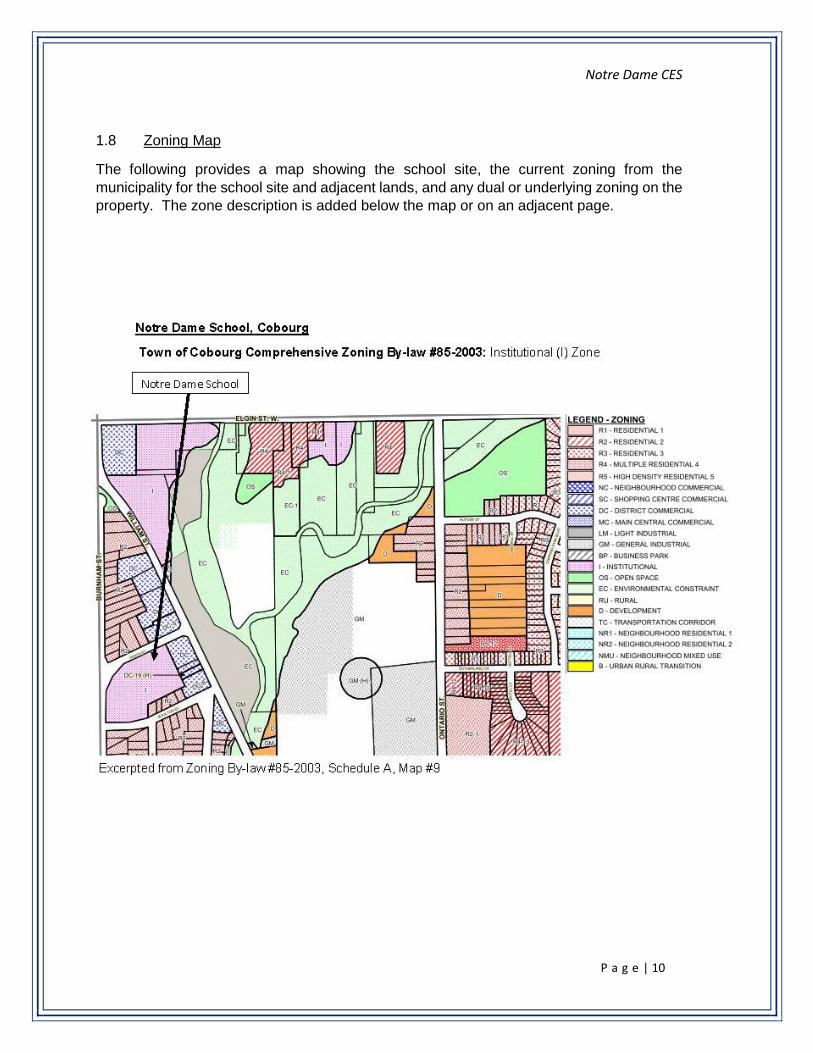
1.8 Zoning Map
The following provides a map showing the school site, the current zoning from the
municipality for the school site and adjacent lands, and any dual or underlying zoning on the
property. The zone description is added below the map or on an adjacent page.

Notre Dame CES
P a g e | 11
SECTION 2 - FACILITY CONDITION
2.1 Facility Index Value
The Facility Condition Index (FCI) is the building condition as determined by the Ministry of
Education by calculating the five-year renewal needs and the replacement value for each
facility. These values were determined by a report completed in 2013.
School Name Notre Dame Catholic Elementary School
Replacement Value (A) $5,739,995
5 Year Renewal Needs (B) per Ministry 2013 inspection and limited scope
$637,422
10 Year Renewal Needs based on expanded assessment and program scope (C)
$9,353,041
Facility Condition Index (B) / (A) per Ministry 11%
Integrated Facility Assessment (C) / (A) 163%
2.2 10 Year Renewal History The 10 year renewal history lists those major repairs at the school which are captured by the TCPS data base. The summary includes the year undertaken, the specific renewal item (e.g., Roof Replacement), the value of that repair and a cumulative value of all repairs undertaken within the 10 year time frame. The table excludes routine maintenance and other items not considered as renewal under the Tangible Capital Assets guide.
Year Renewal Item Cost Cumulative Cost
2010-11 Roofing $8,811 $8,811
2011-12 Gym wall padding and painting $19,476 $28,287
2012-13 Full-day kindergarten minor retrofit $7,884 $36,171
2012-13 Lighting $10,459 $46,630
2012-13 Lighting $5,420 $52,050
2012-13 Whisper AC units $62,049 $114,099
2012-13 Plumbing/painting/drapes $21,302 $135,401
2013-14 Summit Mechanical AC $18,638 $154,039
2013-14 Full-day kindergarten retrofit $48,037 $202,076
2014-15 Roofing repair and insulation $48,873 $250,949
2015-16 Access points $4,168 $255,117
2015-16 Painting $6,206 $261,323
Total $261,323

Notre Dame CES
P a g e | 12
2.3 5 Year Renewal Requirements The 5 year renewal requirements lists those major repairs which are captured by the TCPS data base and the Facilities Services department, and listed by priority. The summary includes the year to be undertaken, the specific renewal item (e.g., Roof Replacement), the value of that repair and a cumulative value of all proposed renewal projects.
Year Renewal Item Priority Cost Cumulative
Cost
2016 Roof, windows, etc. $624,000 $624,000
2017 Wall and floor finishes $24,200 $648,200
2018 Doors, plumbing fixtures $647,000 1,295,200
2022 Stairs $1,000 $1,296,200
Total $1,296,200
2.4 School Utility Costs The utility cost data will be reported for the last complete year available and includes the costs for Natural Gas, Water, and Electricity as billed by the local utility. The total cost represents the cost for the year including the costs for portables or other licensed or leased facilities within the school (i.e., child care centre).
Utility Costs for Year
Natural Gas n/a – school is electrically heated
Water $9,978
Hydro $53,264
Total $63,242
Building Area – Permanent (A) 19794.83 sq. ft.
Building Area – Non Permanent (B) 4606.95 sq. ft.
Total Building Area (A+B) 24401.78 sq. ft.
Cost per square foot $2.59 sq. ft
Notes on Utility Costs
Notre Dame is electrically heated, as is the port-a-pack. The square footage figures used differ slightly from the Building Area reported in the Initial Staff Report. The figures used are those reported in the Ministry School Facility Inventory System (SFIS).

Notre Dame CES
P a g e | 13
2.5 School Accessibility Measures The school accessibility measure represents the current accessibility inventory for the school as calculated by the Facilities Services Department.
School Name Notre Dame Catholic Elementary School
Number of Storeys 1
Accessible Entrance Yes
Door Operator
Front Yes
Other
Lift Device
Elevator No
Stage Lift No
Other Lift
Barrier Free Washroom Yes both girls and boys
Accessibility to Instructional Area Yes
SECTION 3 – STUDENT DATA
3.1 Enrolment History (10 Year)
The historical enrolment is provided on a grade by grade basis for the last 10 years including
the current year as of October 31 of the year. Any changes to grade configuration or
programming will be noted below the table along with an explanation of the phasing in of
the decision(s).
Year JK SK 1 2 3 4 5 6 7 8 Total Utilization
2007 7 11 27 18 23 23 23 26 48 57 263 114.3%
2008 14 11 13 25 21 24 28 24 43 50 257 111.7%
2009 25 13 10 13 29 22 26 29 39 43 249 108.2%
2010 9 27 12 12 15 25 20 25 37 38 224 97.3%
2011 22 11 28 15 12 15 30 21 41 48 243 105.6%
2012 14 21 12 33 16 13 15 31 37 39 231 100.4%
2013 14 17 25 13 36 19 15 19 45 38 241 104.7%
2014 12 15 17 25 15 39 26 16 33 45 243 105.6%
2015 13 13 19 20 28 20 41 28 29 33 244 106.0%
2016 13 16 18 23 26 29 22 43 56 33 279 121.3%

Notre Dame CES
P a g e | 14
3.2 Enrolment Projections (10 Year)
The projected enrolment is provided on a grade by grade basis for the next 10 years
(excluding the current year) for the school. This projected enrolment was prepared prior to
the changes that were approved in 2016-17 regarding French Immersion and movement of
Regular Track Students to St. Joseph CES, and differ from those used in the Initial Staff
Report for the analysis of options and future utilization.
Year JK SK 1 2 3 4 5 6 7 8 Total Utilization
2017-18 14 14 17 21 24 28 32 23 61 58 292 127.0%
2018-19 17 15 15 19 23 25 31 34 41 63 283 123.0%
2019-20 14 19 17 17 21 24 28 33 54 42 269 117.0%
2020-21 14 15 20 18 18 22 26 29 60 55 277 120.0%
2021-22 14 15 17 22 20 19 24 28 51 61 271 118.0%
2022-23 14 15 17 19 24 21 21 25 48 52 256 112.0%
2023-24 18 15 17 19 20 25 23 22 58 50 267 116.0%
2024-25 14 19 17 18 20 21 28 24 40 60 261 113.0%
2025-26 14 15 21 18 20 21 24 29 47 41 250 109.0%
2026-27 14 15 17 23 20 21 24 25 53 49 261 113.0%
3.3 Student Proximity Measure Student proximity measures the distance from the student’s home address to the school using straight line distance. The data is aggregated by grade division and expressed as both a total number of students and as a percentage of the current year enrolment based on March 27, 2017.
Division ˂1000 meters 1000-1600
meters 1600-3200
meters ˃3200 meters
Primary JK-3 41 12 5 38
Junior 4-6 26 17 19 32
Intermediate 7-8 18 13 14 44
Total Students 85 42 38 114
% of Total 30.5% 15% 13.6% 41%
Average Distance to School in Kilometers - Not Available kms

Notre Dame CES
P a g e | 15
3.4 Out of Area Students Out of Area students are calculated using the home address of the student as compared to the current school boundary.
Division In Area Students Out of Area
Students % Out of Area
Primary JK-3 68 1 1.47%
Junior 4-6 65 8 12.3%
Intermediate 7-8 69 2 2.89%
Total Students 202 11 5.4%
Out of Area Students based on data from March 27, 2017
3.5 Student Transportation Data Student transportation data is calculated for the current year as of March 27, 2017. The students entitled to transportation are those identified by DSTS by virtue of distance to school, by identified impediments to safe access to school (i.e., road conditions) or by identification from student services.
Division Entitled to
Transportation Not Entitled to Transportation
% Not Entitled to Transportation
Primary JK-3 44 25 36.2%
Junior 4-6 38 35 47.9%
Intermediate 7-8 42 29 40.8%
Total Students 124 89 41.4%
For Transported Students
Shortest Bus Ride (in minutes) 3 minutes
Longest Bus Ride (in minutes) 63 minutes
Average Bus Ride (in minutes) 15 minutes
Student Transportation Data based on data from March 27, 2017

Notre Dame CES
P a g e | 16
SECTION 4 – INSTRUCTIONAL DATA
4.1 Staff Allocation to School
The staff allocation to school includes the current year teaching and non-teaching staff
allocation to the school. The staff values are expressed to two decimal places.
Teaching Staff Allocation Number
Classroom Teachers 11
Program Support .84
Prep Time (JK-3) .5
FSL (4-8) 1.0
Extra Prep Time
SERT 1.0
Library
Principal 1.0
Vice-Principal
Total 15.34
Non-Teaching Staff Allocation Number
Secretary 1.0
EA’s 2.0
Custodians 1.44
ECE 1.0
Library Support .46
Total 5.9
Total Staff 21.24
4.2 Specialized Courses and Programs Offered Please indicate if the school has any of the following programs and the grades served by these programs. If the program is not listed here, please insert a line and add the program.
Programs Yes/No Grades
French Immersion Yes until Sept.2018 Gr 7 and 8
Extended French No
Early Intervention Program No
4.3 Grade Organization (Elementary)
For the elementary school please indicate the number of students by grade and the organization for each class using the data from the Staffing Plus system. The teacher’s

Notre Dame CES
P a g e | 17
names should not appear. Where schools have a French program, please indicate the staffing and class composition for this as well.
Teacher Staff RTE
Program JK
ELKP SK
ELKP 1 2 3 4 5 6 7 8 Total
A 1.0 13 16 29
B 1.0 18 3 21
C 1.0 20 20
D 1.0 20 20
E 1.0 6 17 23
F 1.0 12 13 25
G 1.0 9 17 26
H 1.0 26 26
I 1.0 30 30
J 1.0 6 21 27
K 1.0 FI 20 12 32
Total 11.0 13 16 18 23 26 29 22 43 56 33 279
Number of Classes 11
Number of Combined Classes 7
% of Combined Classes 64%
4.4 Extra-Curricular Activities Provide a list of all extra-curricular activities including athletic teams, clubs, performing arts, community outreach and other school sponsored events that have been run within the last year. For each activity indicate the number of participants or teams.
Extra-Curricular Activity Participants
Inter-school athletics…soccer, cross country, volleyball, basketball, softball
Intermediate Students (80 students)
Bi-Annual Theatre Arts Production Intermediate Students (50 students)
Library Club Junior Students (10 students)
Intramurals Intermediate Students (40 students
Trent Enrichment Opportunities Intermediate Students (30 students)
Environmental Club Whole school
Talent Show Whole School (50 students)
Christmas Concert Whole school

Notre Dame CES
P a g e | 18
Extra-Curricular Activity (Cont’d) Participants
Lenten Clothing Drive, to support St. Vincent de Paul Whole school
Lenten Food Drive- support Northumberland Food 4 All Whole school
Terry Fox Run/walk Whole school
Fresh from the Farm Whole school
Refugee Family Support Whole school
Jump Rope for Heart Whole school
United Way Whole school
Anti-Bullying Pink Shirt Day Whole school
World Vision Whole school
SECTION 5 – OTHER DATA
5.1 Non-School Programs and Services
This section describes the current non-school programs or services at the school as well as
any revenue from these non-school programs or services.
Program or user Group
Room(s) Used Revenue From Current Year
Cost Recovery
Not applicable
5.2 Facility Partnerships at School
This section describes the current facility partnerships located at the school as defined by
the Community Planning and Partnership Guidelines as well as the revenue received from
these partners.
Facility Partner Room(s) Used Revenue From Current Year
Cost Recovery
Not applicable

Notre Dame CES
P a g e | 19
5.3 Community Use of Schools Data
Provide the details for the Community Use of Schools for the current year including all
permits up to the end of June that are in the current system. Indicate the category from the
Community Use of Schools procedure, the number of hours used annually by the group and
the days of the week that the permit user operates on.
Community Use Group
Category Hours Used
Annually Days Used
See Notes.
Notes
Very minimal use of school and/or field for community use.
5.4 Childcare
Please provide details regarding the Child Care programs at the school which are licensed
under the Day Nursery Act. This information will include the Child Care Operator, the
licensed program capacity and the current number of children enrolled.
Child Care Operator
Program Licensed Capacity Current Enrollment
Infant Not applicable
Toddler Not applicable
Pre-School Not applicable
Nursery School Not applicable
School Aged Not applicable
Please indicate the square footage of the discrete space child care and the shared space
child care areas as indicated on the child care license for the current year.
Licensed Spaces at School
Discrete Space Area Not applicable
Shared Space Area Not applicable
Number of Rooms Not applicable
Annual Revenue Received from Child Care Not applicable
All Child Care centres are run on a cost recovery basis and are operated as not-for-profit
entities.

Notre Dame CES
P a g e | 20
SECTION 6 – FAITH FORMATION/PARISH INFORMATION
Provide information regarding the breadth of the faith formation programs available at the
school and all programs run in conjunction with the parish on an annual basis in the current
year.
Faith Formation Programs
Religion and Family Life Programs
Family Life Education is taught through the lens of the Fully Alive program in Grades 1 through 8.
Sacramental Preparation
Grade 2 and Grade 7. The school supports the grade two students by following the Religion curriculum for and assists with the planning of the delivery of the sacraments. Grade seven students prepare for Confirmation through the classroom delivery of the sacramental program, priest support and Confirmation Retreat.
Catholic Social Teachings
The school takes every opportunity to demonstrate the relevancy of our Catholic Social Teachings particularly during community outreach projects and when there are relevant curriculum connections.
Faith Formation Programs
Liturgical Celebrations
The Catholic Liturgical school year calendar is developed with the parish priest prior to beginning of school year and followed throughout the year. School masses are held at the church and religious observances are held at the school throughout the year.
Involvement with Parish
The parish priest of St. Michael the Archangel Parish makes regular visits to the school to talk to classes on themes related to their faith journey and on points of emphasis as related to the liturgical calendar. The priest offers confessions at the school to support students. and offers just to talk to students about events in their lives
Catholic Graduate Expectations, Curriculum Maps and Virtues
The Catholic Graduate Expectations are incorporated into the daily life at Notre Dame Catholic Elementary School. Staff refer to the expectations regularly and the students are reminded of them throughout the school year as situations present themselves and during whole school assemblies.
Associated Parish(es) St. Michael the Archangel Parish, 379 Division Street, Cobourg, Ontario
Distance to Parish 2.3 KM
Programs run in conjunction with Parish
Occurrence
Sacramental Preparation for First Eucharist
4 Sessions at Church Lessons as part of Religion Program in Grade 2
Sacramental Preparation for Confirmation
Lessons as part of Religion Program in Grade 7 Retreat held at Parish (1 day)