peru retail foods convenience trend driving … gain publications/retail foods... · and...
TRANSCRIPT
THIS REPORT CONTAINS ASSESSMENTS OF COMMODITY AND TRADE ISSUES MADE BY
USDA STAFF AND NOT NECESSARILY STATEMENTS OF OFFICIAL U.S. GOVERNMENT
POLICY
Required Report - public distribution
Date: 6/28/2018
GAIN Report Number:
Peru
Retail Foods
Convenience trend driving opportunities in Peru's market
Approved By:
Kirsten Luxbacher
Prepared By:
FAS Lima Team
Report Highlights:
Peru's food retail market has found its path to growth through compact store formats. The market
currently holds over 450 convenience stores and 250 conventional supermarkets. The sector’s strategy
for growth includes expansion into Lima’s lower-middle income districts. As a result, the retail food
market’s growth is projected at 4.3 percent for 2018.
Post:
Lima

Market Fact Sheet: PERU
For over a decade, Peru has been one of the world’s top
performing economies, registering sustained high growth
accompanied by low inflation. Agriculture accounts for
approximately five percent of Peru’s GDP, but employs
around 28 percent of the population. The U.S.-Peru
Trade Promotion Agreement, which entered into force in
February 2009, has increased bilateral trade of
agricultural products from $1.46 billion in 2009 to $3.45
billion in 2017, an increase of 136 percent. More than
two-thirds of current U.S. agricultural exports enter Peru
duty-free. The United States remains the largest
agricultural product supplier to Peru, accounting for 30
percent of market share.
Peru offers good opportunities for U.S. exporters of
consumer-oriented agricultural products, but there are
some challenges. The successful introduction of new to
market food products depends on knowledge of the
market and personal contact. Exporters should review
Peru’s food laws, packaging and labeling requirements,
business practices, and trade-related laws and tariffs.
Getting to know the potential importer and the local
distribution system is critical.
Peru’s food processing industry is a dynamic sector of the
national economy. The food industry in Peru accounts
for almost 27 percent of the industrial GDP and sales are
forecasted to reach $14.3 billion by the end of 2017. Its
growth is directly linked to the development of the food
retail and food service sectors. Food product
manufacturers source both domestic and imported
product ingredients. Local processed food products cover
70 percent of the market demand.
There are three main supermarket chains in Peru:
Cencosud (Wong and Metro), Saga Fallabella (Tottus)
and Supermercados Peruanos (Vivanda and Plaza Vea).
The market includes 250 conventional supermarkets and
superstores, with 171 alone in Lima, and 450
convenience stores, with two outside of Lima. The sector
is comprised of both conventional supermarkets and
traditional channels (comprised of wet markets and
independent stores). While different foods appear to
perform better in the two formats, snacks, dairy, edible
oils, confectionaries, breads and cookies do well in both.
Imports of
Consumer-
Oriented
Products: $263
Million
Food Industry Gross Sales 2017: $45.2 Billion
GDP/Population
Population (Millions): 32
GDP (Billions USD): 198
GDP Per-Capita (USD): 6,287
Data and Information Sources: FAS Lima / Contact: FAS Li
SECTION I. Market Overview
Top 10 Growth Products in Peru
1. Fresh Cut Flowers
2. Fruit & Nuts
Provisionally
Preserved
3. Nutmeg
4. Egg Yolks, dried
5. Hazelnuts or Fiberts
6. Dates
7. Linseed oil, refined.
8. Vegetables Mixture,
raw/cooked.
9. Mixtures of Dried
Fruits
10. Dairy Spreads.
Food Industry by Channels 2017
1. Food Exports: $7.0 billions
2. Food Imports: $5.7 billions
3. Domestic Market: $14.3 billion
4. Retail: $22 billion
5. Food Service: $8 billion
6. Wet market: $18 billion
Strengths Weaknesses
Strong demand for
consumer food products.
Low penetration of modern
food retail along the
country
Opportunities Threats
Growing middle class Stiff competition from
other countries in the
region
Food Retail Industry
Quick Facts CY 2017
Strengths/Weaknesses/Opportunities/Challenges
Executive Summary
Imports of Consumer-Oriented Products
Food Processing Industry

The retail food sector in Peru is comprised of two segments: modern (supermarket stores, convenience
stores and discount stores) and traditional (open markets and mom and pop stores). While the traditional
channel holds over 80 percent of market share, the modern channel experienced a high rate of growth
over the last 10 years. In 2018, growth in retail food sales is projected at 4.3 percent, reaching $23.8
billion by the end of the year. Supermarkets have reported more sales because of the maturity of some
of their outlets that opened in 2017, the development of convenience store formats and an aggressive
discounting campaign to encourage sales.
There are three main supermarket chains in Peru: Cencosud (Wong and Metro), Saga Fallabella (Tottus)
and Supermercados Peruanos (Vivanda and Plaza Vea). The market includes 250 conventional
supermarkets and superstores (171 of which are located in Lima), and 450 convenience stores two of
which are located outside of Lima and 172 discount stores, only 6 outside of Lima . A limiting factor
for supermarket expansion, especially within Lima, is the lack of affordably priced land available for
new, large store construction. As a result, food retailers have developed other formats, such as
convenience and discount stores, to increase penetration and ensure competitive pricing. Last year, out
of 70 new retail food outlets, only four were large store formats, the rest were convenience and discount
stores.
The sector’s expansion strategy aims to expand into Lima’s lower-middle income districts.
Convenience stores are the format of choice to achieve this objective. Tambo+ (Lindley Corporation) is
the fastest growing chain and holds about 90 percent of market share or 200 stores. The second largest
chain is Listo (Grupo Romero), with 110 locations. Listo stores are primarily attached to gas stations in
Lima. Mass (Supermercados Peruanos) and Repshop (Repsol) currently have 105 and 100 locations,
respectively. Convenience store sales are currently at about $244 million per year, and are projected to
double over the next five years.
The expansion of the modern retail channel has not been entirely detrimental to traditional channel
growth. Competition between these modern and traditional channels occurs in specific categories
mainly groceries. Peru’s growing middle class enabled supermarket chains to expand rapidly over the
past ten years. The traditional channel maintains a large consumer base formed by low and middle-
income consumers. This channel offers a good mix of mid- and low-priced brands that are available in
small packaging sizes to favor sales to people with a small daily budget. Proximity is also a highly
weighted feature within this market segment.
Advantages and Challenges Facing U.S. Products in Peru
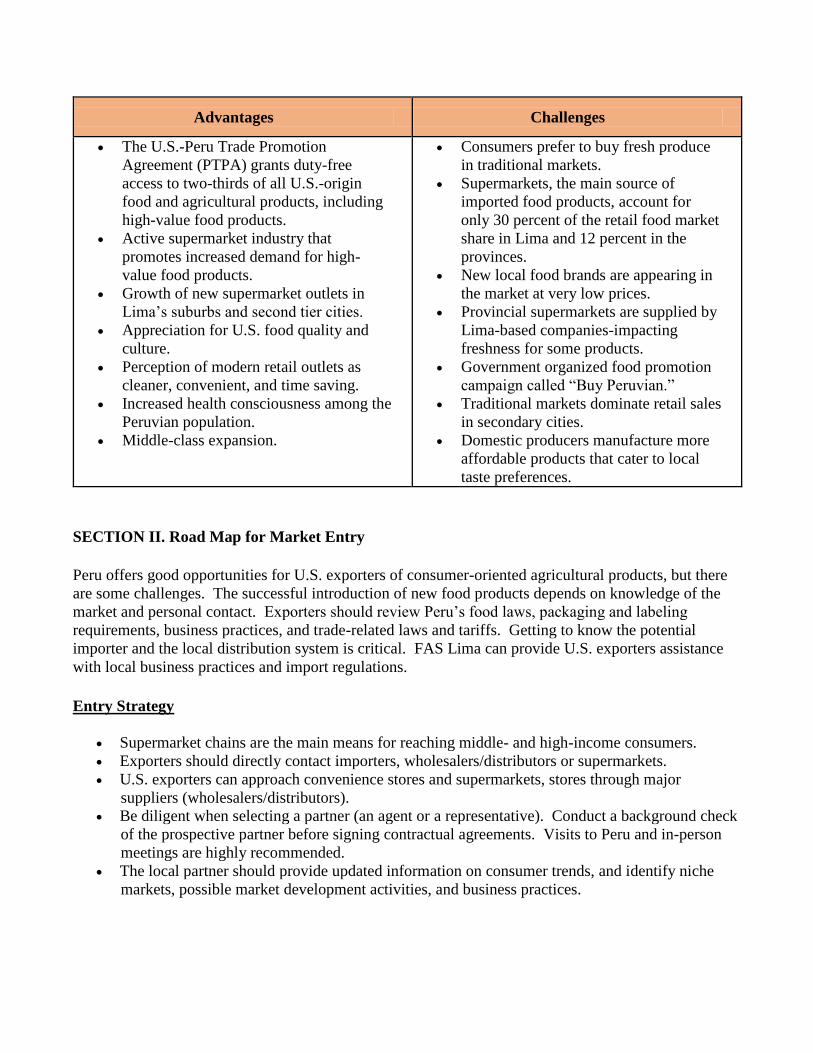
Advantages Challenges
The U.S.-Peru Trade Promotion
Agreement (PTPA) grants duty-free
access to two-thirds of all U.S.-origin
food and agricultural products, including
high-value food products.
Active supermarket industry that
promotes increased demand for high-
value food products.
Growth of new supermarket outlets in
Lima’s suburbs and second tier cities.
Appreciation for U.S. food quality and
culture.
Perception of modern retail outlets as
cleaner, convenient, and time saving.
Increased health consciousness among the
Peruvian population.
Middle-class expansion.
Consumers prefer to buy fresh produce
in traditional markets.
Supermarkets, the main source of
imported food products, account for
only 30 percent of the retail food market
share in Lima and 12 percent in the
provinces.
New local food brands are appearing in
the market at very low prices.
Provincial supermarkets are supplied by
Lima-based companies-impacting
freshness for some products.
Government organized food promotion
campaign called “Buy Peruvian.”
Traditional markets dominate retail sales
in secondary cities.
Domestic producers manufacture more
affordable products that cater to local
taste preferences.
SECTION II. Road Map for Market Entry
Peru offers good opportunities for U.S. exporters of consumer-oriented agricultural products, but there
are some challenges. The successful introduction of new food products depends on knowledge of the
market and personal contact. Exporters should review Peru’s food laws, packaging and labeling
requirements, business practices, and trade-related laws and tariffs. Getting to know the potential
importer and the local distribution system is critical. FAS Lima can provide U.S. exporters assistance
with local business practices and import regulations.
Entry Strategy
Supermarket chains are the main means for reaching middle- and high-income consumers.
Exporters should directly contact importers, wholesalers/distributors or supermarkets.
U.S. exporters can approach convenience stores and supermarkets, stores through major
suppliers (wholesalers/distributors).
Be diligent when selecting a partner (an agent or a representative). Conduct a background check
of the prospective partner before signing contractual agreements. Visits to Peru and in-person
meetings are highly recommended.
The local partner should provide updated information on consumer trends, and identify niche
markets, possible market development activities, and business practices.
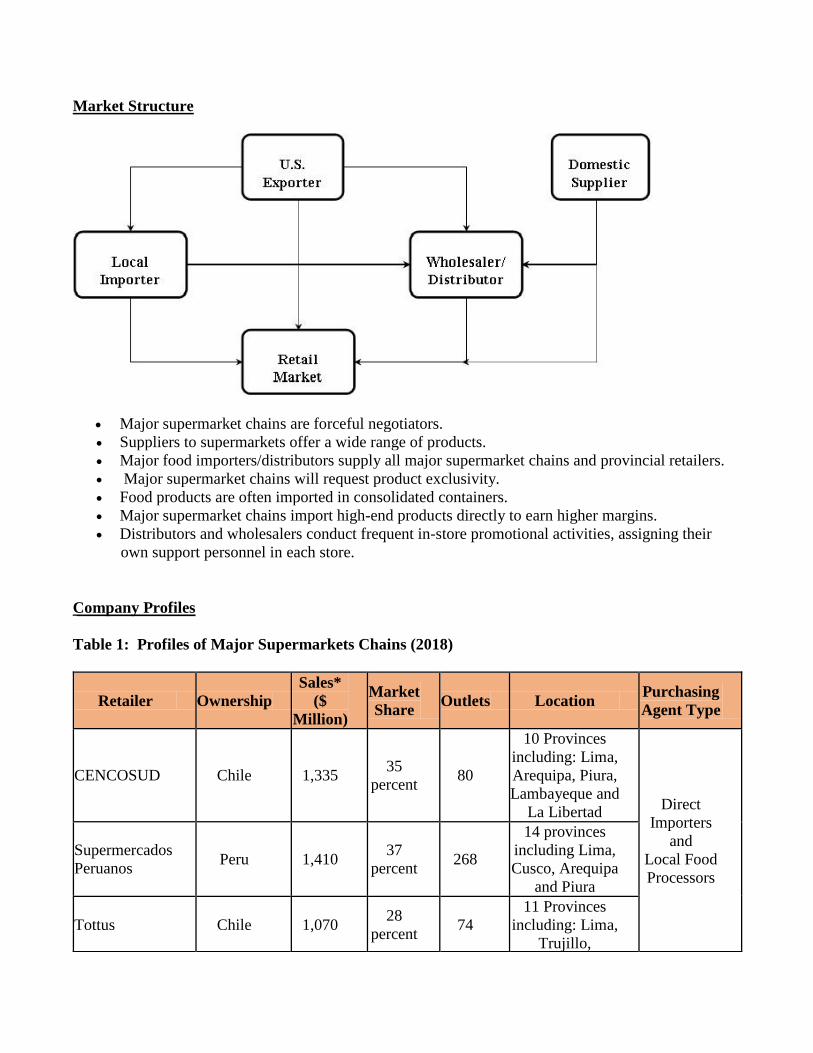
Market Structure
Major supermarket chains are forceful negotiators.
Suppliers to supermarkets offer a wide range of products.
Major food importers/distributors supply all major supermarket chains and provincial retailers.
Major supermarket chains will request product exclusivity.
Food products are often imported in consolidated containers.
Major supermarket chains import high-end products directly to earn higher margins.
Distributors and wholesalers conduct frequent in-store promotional activities, assigning their
own support personnel in each store.
Company Profiles
Table 1: Profiles of Major Supermarkets Chains (2018)
Retailer Ownership
Sales*
($
Million)
Market
Share Outlets Location
Purchasing
Agent Type
CENCOSUD Chile 1,335 35
percent 80
10 Provinces
including: Lima,
Arequipa, Piura,
Lambayeque and
La Libertad Direct
Importers
and
Local Food
Processors
Supermercados
Peruanos Peru 1,410
37
percent 268
14 provinces
including Lima,
Cusco, Arequipa
and Piura
Tottus Chile 1,070 28
percent 74
11 Provinces
including: Lima,
Trujillo,
Chiclayo, Ica,
Piura, Arequipa Source: FAS Lima / * Projections for 2018
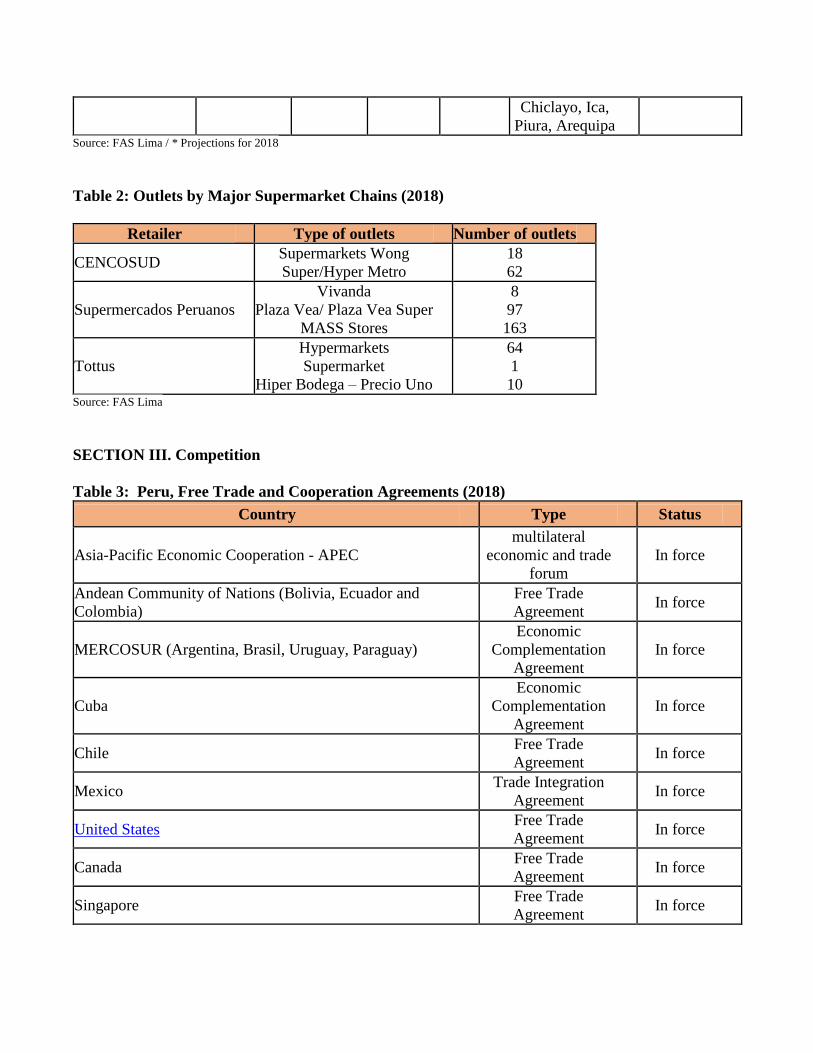
Table 2: Outlets by Major Supermarket Chains (2018)
Retailer Type of outlets Number of outlets
CENCOSUD Supermarkets Wong
Super/Hyper Metro
18
62
Supermercados Peruanos
Vivanda
Plaza Vea/ Plaza Vea Super
MASS Stores
8
97
163
Tottus
Hypermarkets
Supermarket
Hiper Bodega – Precio Uno
64
1
10 Source: FAS Lima
SECTION III. Competition
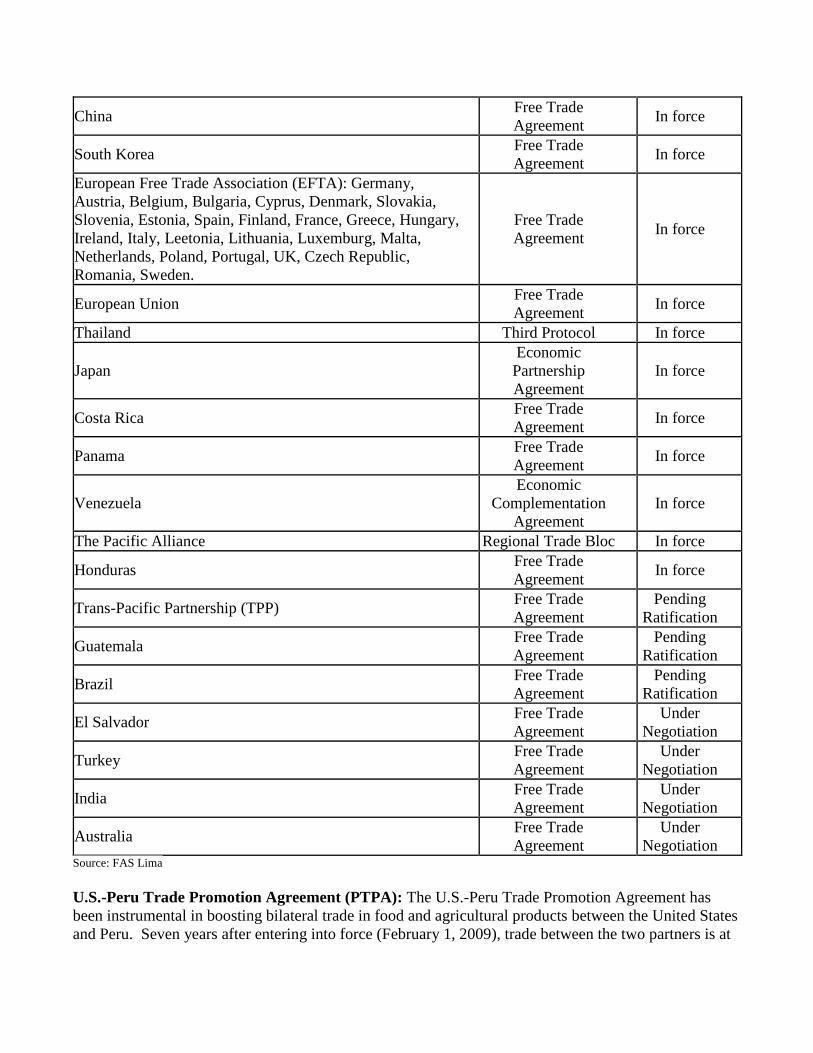
Table 3: Peru, Free Trade and Cooperation Agreements (2018)
Country Type Status
Asia-Pacific Economic Cooperation - APEC
multilateral
economic and trade
forum
In force
Andean Community of Nations (Bolivia, Ecuador and
Colombia)
Free Trade
Agreement In force
MERCOSUR (Argentina, Brasil, Uruguay, Paraguay)
Economic
Complementation
Agreement
In force
Cuba
Economic
Complementation
Agreement
In force
Chile Free Trade
Agreement In force
Mexico Trade Integration
Agreement In force
United States
Free Trade
Agreement In force
Canada Free Trade
Agreement In force
Singapore Free Trade
Agreement In force
China Free Trade
Agreement In force
South Korea Free Trade
Agreement In force
European Free Trade Association (EFTA): Germany,
Austria, Belgium, Bulgaria, Cyprus, Denmark, Slovakia,
Slovenia, Estonia, Spain, Finland, France, Greece, Hungary,
Ireland, Italy, Leetonia, Lithuania, Luxemburg, Malta,
Netherlands, Poland, Portugal, UK, Czech Republic,
Romania, Sweden.
Free Trade
Agreement In force
European Union Free Trade
Agreement In force
Thailand Third Protocol In force
Japan
Economic
Partnership
Agreement
In force
Costa Rica Free Trade
Agreement In force
Panama Free Trade
Agreement In force
Venezuela
Economic
Complementation
Agreement
In force
The Pacific Alliance Regional Trade Bloc In force
Honduras Free Trade
Agreement In force
Trans-Pacific Partnership (TPP) Free Trade
Agreement
Pending
Ratification
Guatemala Free Trade
Agreement
Pending
Ratification
Brazil Free Trade
Agreement
Pending
Ratification
El Salvador Free Trade
Agreement
Under
Negotiation
Turkey Free Trade
Agreement
Under
Negotiation
India Free Trade
Agreement
Under
Negotiation
Australia Free Trade
Agreement
Under
Negotiation Source: FAS Lima
U.S.-Peru Trade Promotion Agreement (PTPA): The U.S.-Peru Trade Promotion Agreement has
been instrumental in boosting bilateral trade in food and agricultural products between the United States
and Peru. Seven years after entering into force (February 1, 2009), trade between the two partners is at
record highs. From 2009 to 2016, U.S. exports of food and agricultural products to Peru grew almost
2.4 times from $530 million to $1.2 billion; with U.S. consumer-oriented product exports at $232
million accounting for 18 percent of U.S. food exports to Peru. U.S. food and agricultural product
exports to Peru are expected to grow by three percent in 2017. The PTPA strengthens U.S.-origin food
and agricultural products’ competitiveness within the Peruvian market. High-end consumers are
familiar with the quality of U.S. products. FAS Lima foresees exports of U.S.-origin consumer-
oriented products to Peru becoming as important as U.S. bulk commodity exports in the next few years.
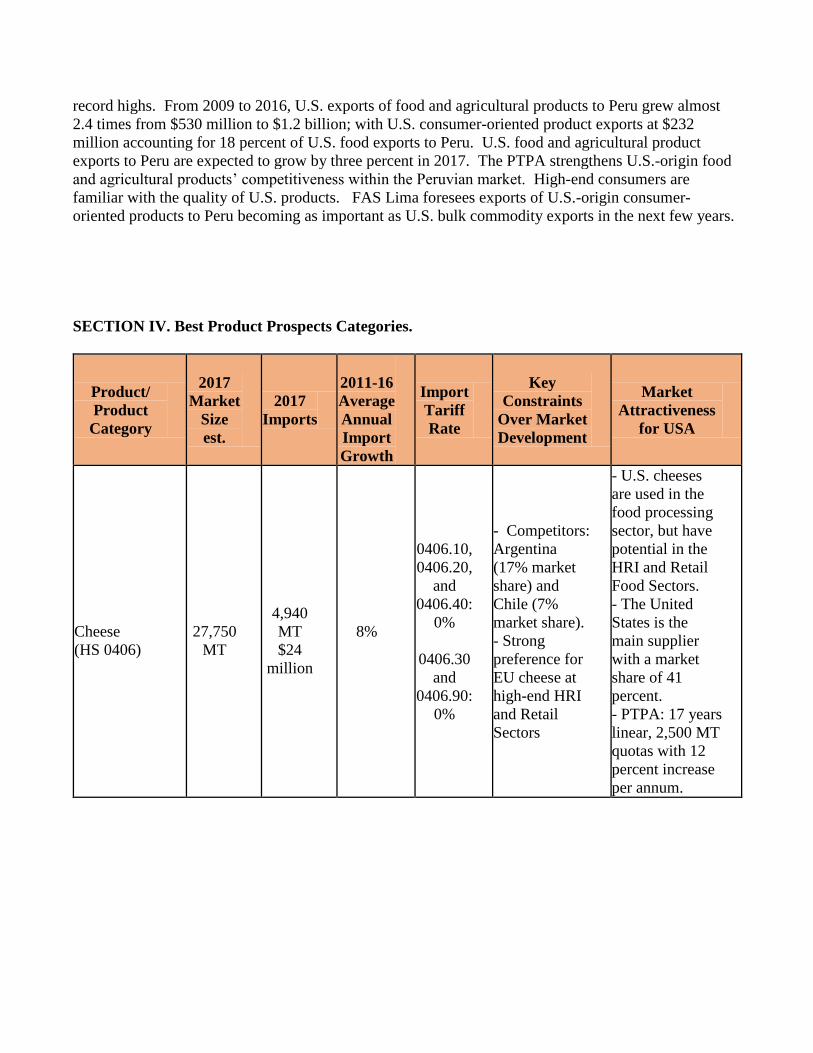
SECTION IV. Best Product Prospects Categories.
Product/
Product
Category
2017
Market
Size
est.
2017
Imports
2011-16
Average
Annual
Import
Growth
Import
Tariff
Rate
Key
Constraints
Over Market
Development
Market
Attractiveness
for USA
Cheese
(HS 0406)
27,750
MT
4,940
MT
$24
million
8%
0406.10,
0406.20,
and
0406.40:
0%
0406.30
and
0406.90:
0%
- Competitors:
Argentina
(17% market
share) and
Chile (7%
market share).
- Strong
preference for
EU cheese at
high-end HRI
and Retail
Sectors
- U.S. cheeses
are used in the
food processing
sector, but have
potential in the
HRI and Retail
Food Sectors.
- The United
States is the
main supplier
with a market
share of 41
percent.
- PTPA: 17 years
linear, 2,500 MT
quotas with 12
percent increase
per annum.
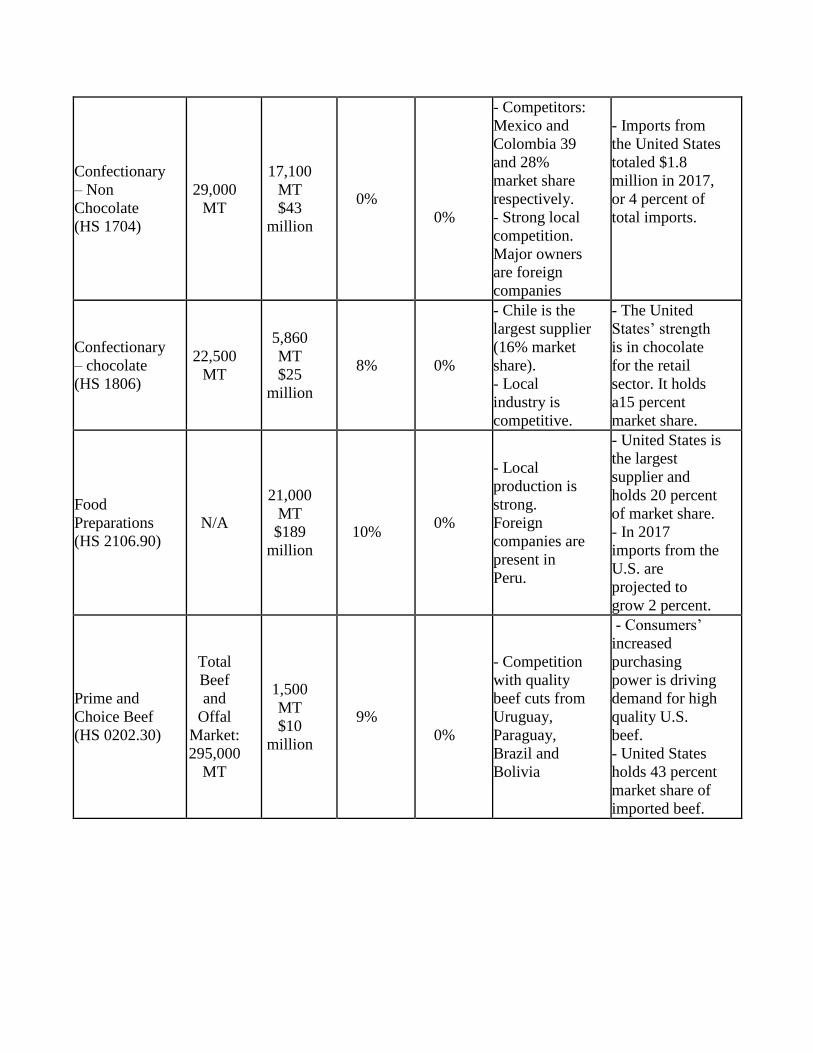
Confectionary
– Non
Chocolate
(HS 1704)
29,000
MT
17,100
MT
$43
million
0%
0%
- Competitors:
Mexico and
Colombia 39
and 28%
market share
respectively.
- Strong local
competition.
Major owners
are foreign
companies
- Imports from
the United States
totaled $1.8
million in 2017,
or 4 percent of
total imports.
Confectionary
– chocolate
(HS 1806)
22,500
MT
5,860
MT
$25
million
8% 0%
- Chile is the
largest supplier
(16% market
share).
- Local
industry is
competitive.
- The United
States’ strength
is in chocolate
for the retail
sector. It holds
a15 percent
market share.
Food
Preparations
(HS 2106.90)
N/A
21,000
MT
$189
million
10% 0%
- Local
production is
strong.
Foreign
companies are
present in
Peru.
- United States is
the largest
supplier and
holds 20 percent
of market share.
- In 2017
imports from the
U.S. are
projected to
grow 2 percent.
Prime and
Choice Beef
(HS 0202.30)
Total
Beef
and
Offal
Market:
295,000
MT
1,500
MT
$10
million
9%
0%
- Competition
with quality
beef cuts from
Uruguay,
Paraguay,
Brazil and
Bolivia
- Consumers’
increased
purchasing
power is driving
demand for high
quality U.S.
beef.
- United States
holds 43 percent
market share of
imported beef.
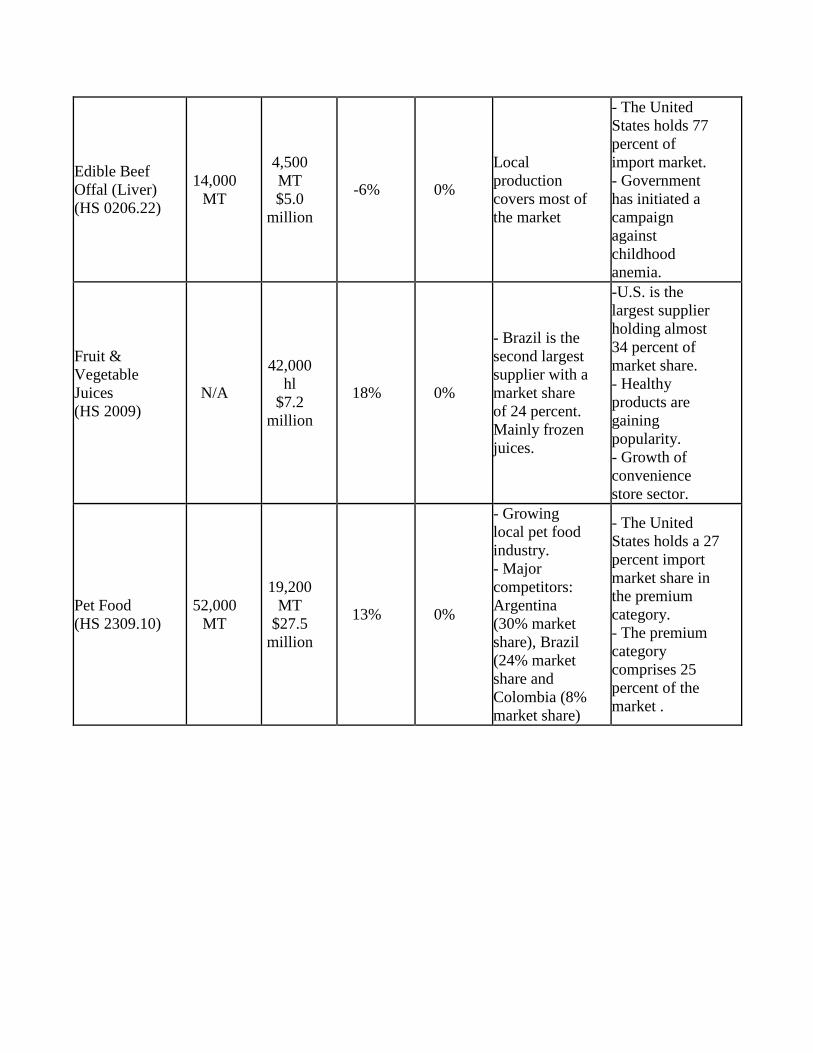
Edible Beef
Offal (Liver)
(HS 0206.22)
14,000
MT
4,500
MT
$5.0
million
-6% 0%
Local
production
covers most of
the market
- The United
States holds 77
percent of
import market.
- Government
has initiated a
campaign
against
childhood
anemia.
Fruit &
Vegetable
Juices
(HS 2009)
N/A
42,000
hl
$7.2
million
18% 0%
- Brazil is the
second largest
supplier with a
market share
of 24 percent.
Mainly frozen
juices.
-U.S. is the
largest supplier
holding almost
34 percent of
market share.
- Healthy
products are
gaining
popularity.
- Growth of
convenience
store sector.
Pet Food
(HS 2309.10)
52,000
MT
19,200
MT
$27.5
million
13% 0%
- Growing
local pet food
industry.
- Major
competitors:
Argentina
(30% market
share), Brazil
(24% market
share and
Colombia (8%
market share)
- The United
States holds a 27
percent import
market share in
the premium
category.
- The premium
category
comprises 25
percent of the
market .
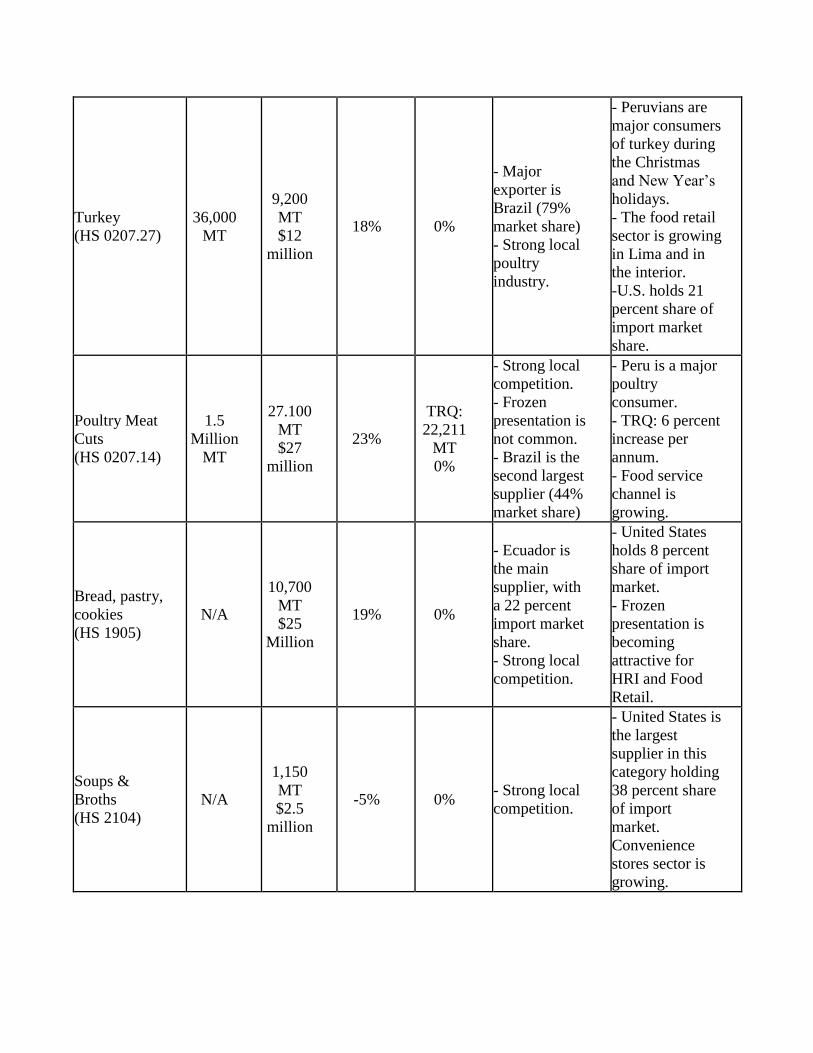
Turkey
(HS 0207.27)
36,000
MT
9,200
MT
$12
million
18% 0%
- Major
exporter is
Brazil (79%
market share)
- Strong local
poultry
industry.
- Peruvians are
major consumers
of turkey during
the Christmas
and New Year’s
holidays.
- The food retail
sector is growing
in Lima and in
the interior.
-U.S. holds 21
percent share of
import market
share.
Poultry Meat
Cuts
(HS 0207.14)
1.5
Million
MT
27.100
MT
$27
million
23%
TRQ:
22,211
MT
0%
- Strong local
competition.
- Frozen
presentation is
not common.
- Brazil is the
second largest
supplier (44%
market share)
- Peru is a major
poultry
consumer.
- TRQ: 6 percent
increase per
annum.
- Food service
channel is
growing.
Bread, pastry,
cookies
(HS 1905)
N/A
10,700
MT
$25
Million
19% 0%
- Ecuador is
the main
supplier, with
a 22 percent
import market
share.
- Strong local
competition.
- United States
holds 8 percent
share of import
market.
- Frozen
presentation is
becoming
attractive for
HRI and Food
Retail.
Soups &
Broths
(HS 2104)
N/A
1,150
MT
$2.5
million
-5% 0% - Strong local
competition.
- United States is
the largest
supplier in this
category holding
38 percent share
of import
market.
Convenience
stores sector is
growing.
Sauces
(HS 2103) N/A
7,350
MT
$17
million
57% 0% - Strong local
competition.
- United States
imports are
projected to
grow 12 percent
in 2017 the U.S.
is the top import
supplier in this
category,
holding 31
percent share of
import market.
Nuts and
almonds
(HS 0802)
N/A
1,400
MT
$11
million
26% 0%
- Chile is very
competitive in
almond and
walnut
production,
holding a 37
percent of the
market.
- Importers
recognize that
the quality of
U.S. nuts and
almonds.
- U.S. exports
are expected to
grow 18 percent
in 2017. The
U.S became the
largest supplier,
holding 62
percent share of
import market.
Wine
(HS 2204)
50
million
liters
8
million
liters
$26
million
1%
0%
- Argentina
(40% market
share), Chile
(29% market
share), and
Spain (15%
market share).
- Niche market
for U.S. wines.
- Niche market
for quality
wines.
- Peru’s wine
consumption is
low but growing
to 1.5 liters /
person.
- HRI sector is
growing and
demanding high
value products.
Category B: Products Not Present in Significant Quantities, but with Good Sales Potential
Product/
Product
Category
2017
Market
Size
Est.
2017
Imports
2011-16
Average
Annual
Import
Growth
Import
Tariff
Rate
Key
Constraints
over Market
Development
Market
Attractiveness
for the U.S.
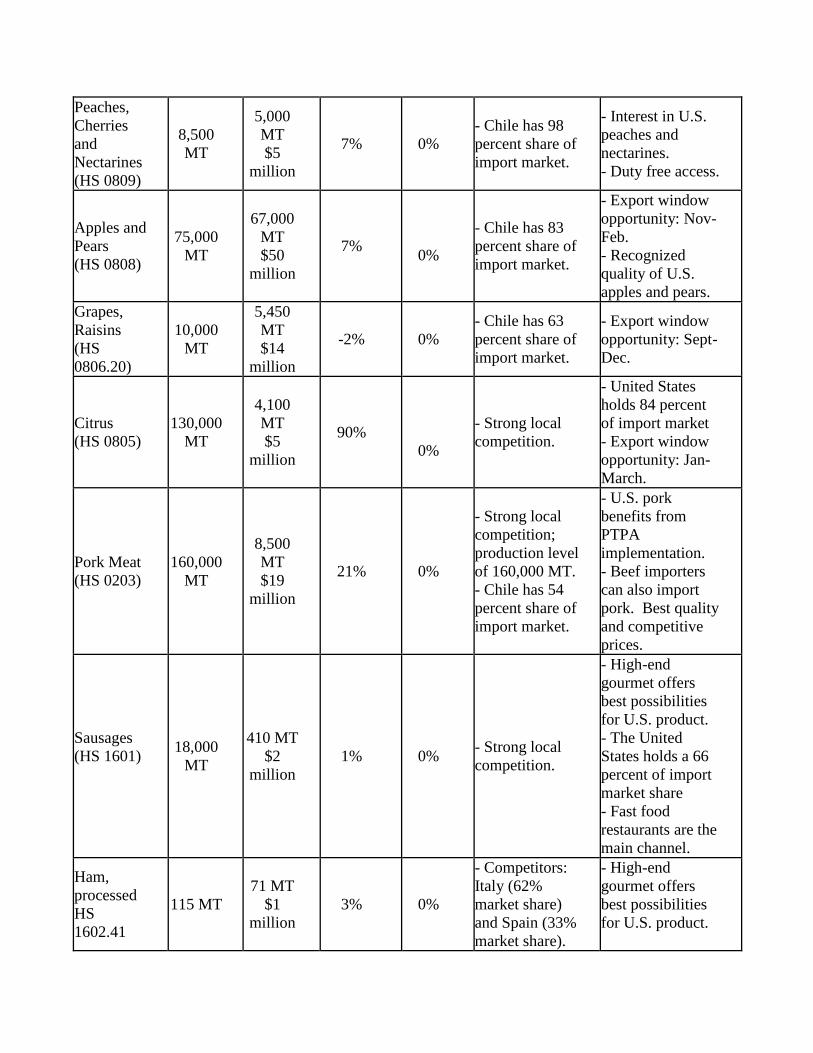
Peaches,
Cherries
and
Nectarines
(HS 0809)
8,500
MT
5,000
MT
$5
million
7% 0%
- Chile has 98
percent share of
import market.
- Interest in U.S.
peaches and
nectarines.
- Duty free access.
Apples and
Pears
(HS 0808)
75,000
MT
67,000
MT
$50
million
7%
0%
- Chile has 83
percent share of
import market.
- Export window
opportunity: Nov-
Feb.
- Recognized
quality of U.S.
apples and pears.
Grapes,
Raisins
(HS
0806.20)
10,000
MT
5,450
MT
$14
million
-2% 0%
- Chile has 63
percent share of
import market.
- Export window
opportunity: Sept-
Dec.
Citrus
(HS 0805)
130,000
MT
4,100
MT
$5
million
90%
0%
- Strong local
competition.
- United States
holds 84 percent
of import market
- Export window
opportunity: Jan-
March.
Pork Meat
(HS 0203)
160,000
MT
8,500
MT
$19
million
21% 0%
- Strong local
competition;
production level
of 160,000 MT.
- Chile has 54
percent share of
import market.
- U.S. pork
benefits from
PTPA
implementation.
- Beef importers
can also import
pork. Best quality
and competitive
prices.
Sausages
(HS 1601)
18,000
MT
410 MT
$2
million
1% 0% - Strong local
competition.
- High-end
gourmet offers
best possibilities
for U.S. product.
- The United
States holds a 66
percent of import
market share
- Fast food
restaurants are the
main channel.
Ham,
processed
HS
1602.41
115 MT
71 MT
$1
million
3% 0%
- Competitors:
Italy (62%
market share)
and Spain (33%
market share).
- High-end
gourmet offers
best possibilities
for U.S. product.
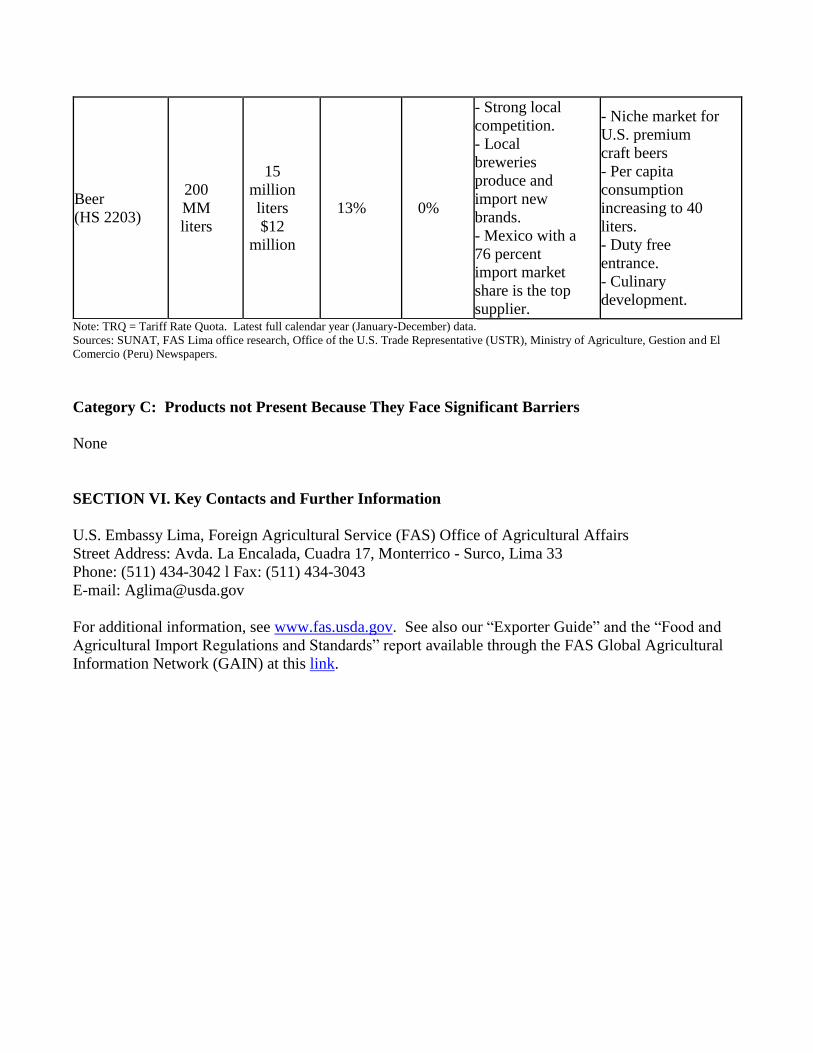
Beer
(HS 2203)
200
MM
liters
15
million
liters
$12
million
13% 0%
- Strong local
competition.
- Local
breweries
produce and
import new
brands.
- Mexico with a
76 percent
import market
share is the top
supplier.
- Niche market for
U.S. premium
craft beers
- Per capita
consumption
increasing to 40
liters.
- Duty free
entrance.
- Culinary
development.
Note: TRQ = Tariff Rate Quota. Latest full calendar year (January-December) data.
Sources: SUNAT, FAS Lima office research, Office of the U.S. Trade Representative (USTR), Ministry of Agriculture, Gestion and El
Comercio (Peru) Newspapers.
Category C: Products not Present Because They Face Significant Barriers
None
SECTION VI. Key Contacts and Further Information
U.S. Embassy Lima, Foreign Agricultural Service (FAS) Office of Agricultural Affairs
Street Address: Avda. La Encalada, Cuadra 17, Monterrico - Surco, Lima 33
Phone: (511) 434-3042 l Fax: (511) 434-3043
E-mail: [email protected]
For additional information, see www.fas.usda.gov. See also our “Exporter Guide” and the “Food and
Agricultural Import Regulations and Standards” report available through the FAS Global Agricultural
Information Network (GAIN) at this link.