russian federation retail foods russian retail … gain publications/retail foods... · modern...
TRANSCRIPT
THIS REPORT CONTAINS ASSESSMENTS OF COMMODITY AND TRADE ISSUES MADE BY
USDA STAFF AND NOT NECESSARILY STATEMENTS OF OFFICIAL U.S. GOVERNMENT
POLICY
Date:
GAIN Report Number:
Approved By:
Prepared By:
Report Highlights:
In 2011, retail sales in Russia finally reached their pre-2008 crisis level and the industry recorded
revenues of $654 billion, which is a 7 percent increase from 2010 in comparable prices, according to
Rosstat. Food retailers contributed 47.8 percent (versus 48.6 percent in 2010) to total 2011 retail market
turnover with $311 billion in sales. Foreign suppliers continue to be competitive in Russia. Market
opportunities for U.S. products include red meats, poultry, fish and seafood products, tree nuts, fresh and
dried fruits, food preparations and pet foods. Russia officially joined the WTO in August 2012 and
committed to reducing and binding import tariffs on all agricultural goods, thereby providing more
predictability to the trading relationship and opening export opportunities for the U.S. agricultural
industry. In 2012, the ATO Russia estimates moderate growth for the Russian retail sector at about 4
percent due to slow increases in Russians’ disposable incomes. Russian consumers remain braced for
economic instability that could inhibit the long-term development of the retail market.
Post:
Moscow ATO
Olga Kolchevnikova,
Marketing Specialist
Deanna Ayala, ATO
Director
Russian Retail Market Steady On
Retail Foods
Russian Federation
RSATO1210
9/24/2012
Required Report - public distribution
Executive Summary:
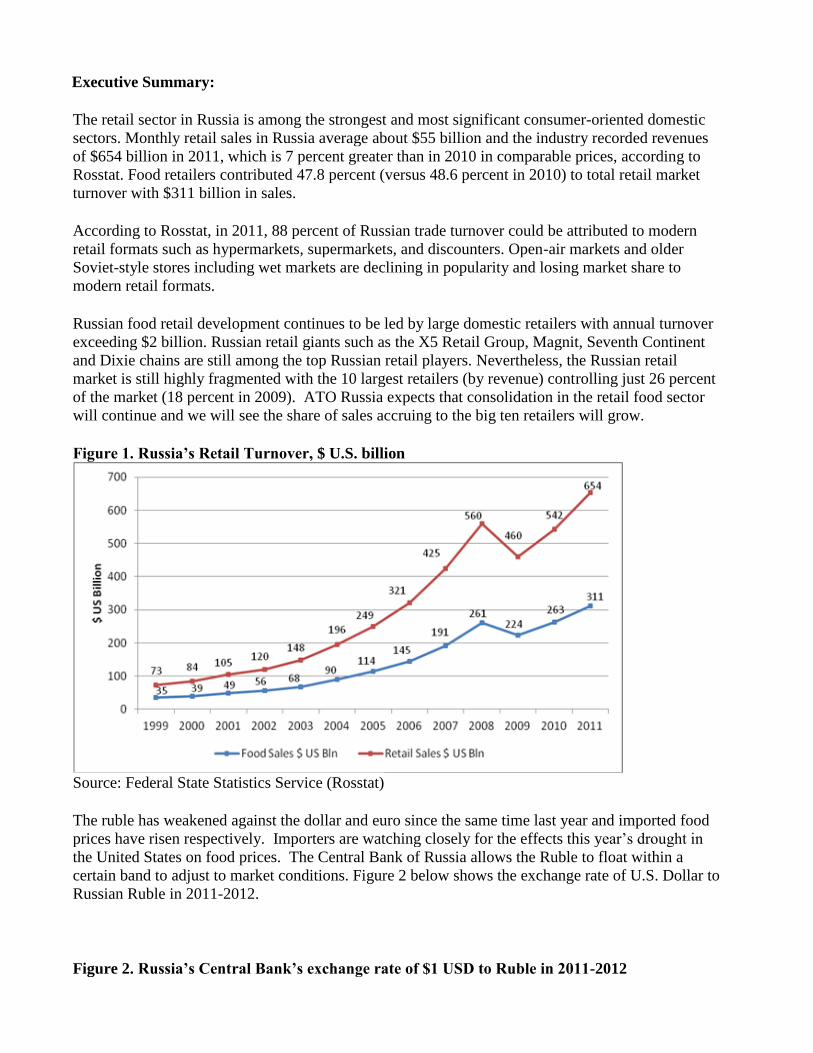
The retail sector in Russia is among the strongest and most significant consumer-oriented domestic
sectors. Monthly retail sales in Russia average about $55 billion and the industry recorded revenues
of $654 billion in 2011, which is 7 percent greater than in 2010 in comparable prices, according to
Rosstat. Food retailers contributed 47.8 percent (versus 48.6 percent in 2010) to total retail market
turnover with $311 billion in sales.
According to Rosstat, in 2011, 88 percent of Russian trade turnover could be attributed to modern
retail formats such as hypermarkets, supermarkets, and discounters. Open-air markets and older
Soviet-style stores including wet markets are declining in popularity and losing market share to
modern retail formats.
Russian food retail development continues to be led by large domestic retailers with annual turnover
exceeding $2 billion. Russian retail giants such as the X5 Retail Group, Magnit, Seventh Continent
and Dixie chains are still among the top Russian retail players. Nevertheless, the Russian retail
market is still highly fragmented with the 10 largest retailers (by revenue) controlling just 26 percent
of the market (18 percent in 2009). ATO Russia expects that consolidation in the retail food sector
will continue and we will see the share of sales accruing to the big ten retailers will grow.
Figure 1. Russia’s Retail Turnover, $ U.S. billion
Source: Federal State Statistics Service (Rosstat)
The ruble has weakened against the dollar and euro since the same time last year and imported food
prices have risen respectively. Importers are watching closely for the effects this year’s drought in
the United States on food prices. The Central Bank of Russia allows the Ruble to float within a
certain band to adjust to market conditions. Figure 2 below shows the exchange rate of U.S. Dollar to
Russian Ruble in 2011-2012.
Figure 2. Russia’s Central Bank’s exchange rate of $1 USD to Ruble in 2011-2012
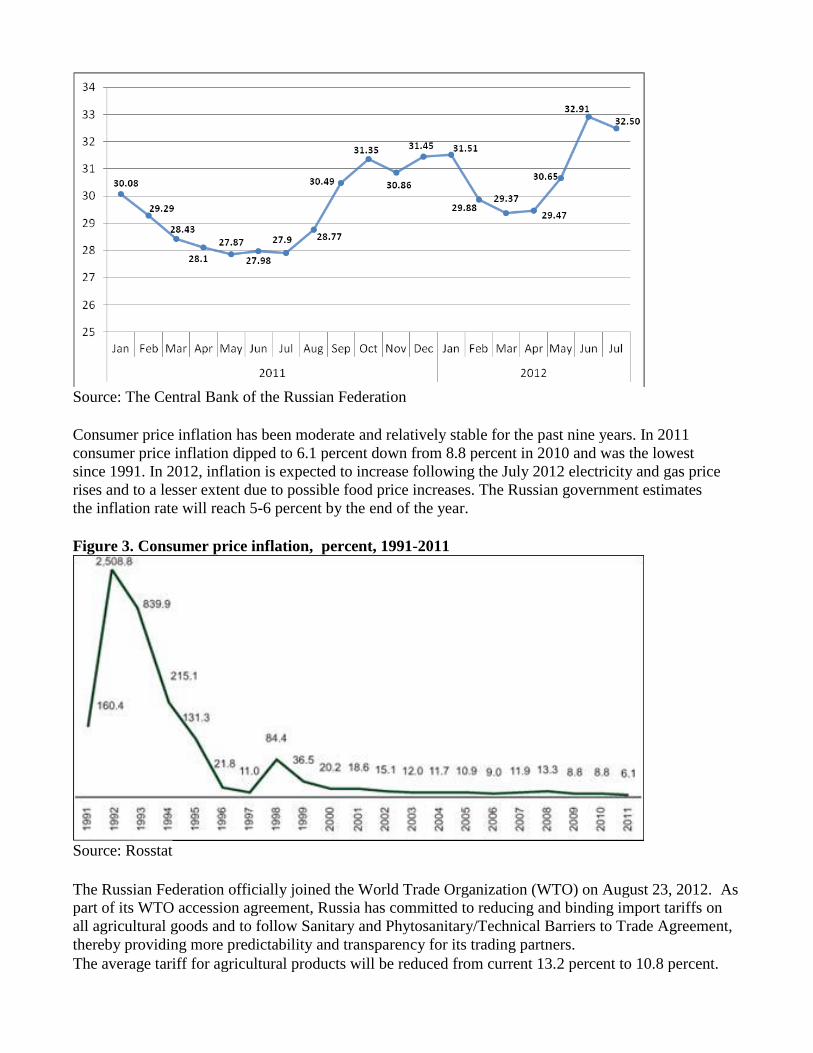
Source: The Central Bank of the Russian Federation
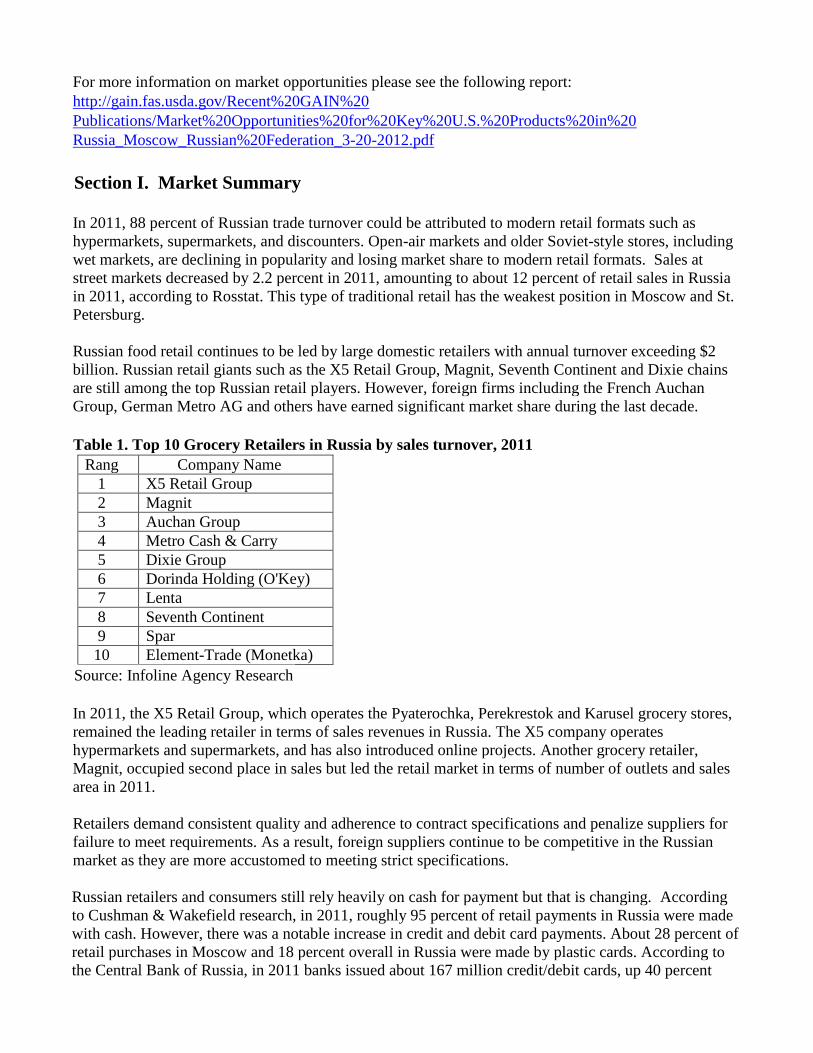
Consumer price inflation has been moderate and relatively stable for the past nine years. In 2011
consumer price inflation dipped to 6.1 percent down from 8.8 percent in 2010 and was the lowest
since 1991. In 2012, inflation is expected to increase following the July 2012 electricity and gas price
rises and to a lesser extent due to possible food price increases. The Russian government estimates
the inflation rate will reach 5-6 percent by the end of the year.
Figure 3. Consumer price inflation, percent, 1991-2011
Source: Rosstat
The Russian Federation officially joined the World Trade Organization (WTO) on August 23, 2012. As
part of its WTO accession agreement, Russia has committed to reducing and binding import tariffs on
all agricultural goods and to follow Sanitary and Phytosanitary/Technical Barriers to Trade Agreement,
thereby providing more predictability and transparency for its trading partners.
The average tariff for agricultural products will be reduced from current 13.2 percent to 10.8 percent.
For more information on market opportunities please see the following report:
http://gain.fas.usda.gov/Recent%20GAIN%20
Publications/Market%20Opportunities%20for%20Key%20U.S.%20Products%20in%20
Russia_Moscow_Russian%20Federation_3-20-2012.pdf
Section I. Market Summary
In 2011, 88 percent of Russian trade turnover could be attributed to modern retail formats such as
hypermarkets, supermarkets, and discounters. Open-air markets and older Soviet-style stores, including
wet markets, are declining in popularity and losing market share to modern retail formats. Sales at
street markets decreased by 2.2 percent in 2011, amounting to about 12 percent of retail sales in Russia
in 2011, according to Rosstat. This type of traditional retail has the weakest position in Moscow and St.
Petersburg.
Russian food retail continues to be led by large domestic retailers with annual turnover exceeding $2
billion. Russian retail giants such as the X5 Retail Group, Magnit, Seventh Continent and Dixie chains
are still among the top Russian retail players. However, foreign firms including the French Auchan
Group, German Metro AG and others have earned significant market share during the last decade.
Table 1. Top 10 Grocery Retailers in Russia by sales turnover, 2011
Rang Company Name
1 X5 Retail Group
2 Magnit
3 Auchan Group
4 Metro Cash & Carry
5 Dixie Group
6 Dorinda Holding (O'Key)
7 Lenta
8 Seventh Continent
9 Spar
10 Element-Trade (Monetka)
Source: Infoline Agency Research
In 2011, the X5 Retail Group, which operates the Pyaterochka, Perekrestok and Karusel grocery stores,
remained the leading retailer in terms of sales revenues in Russia. The X5 company operates
hypermarkets and supermarkets, and has also introduced online projects. Another grocery retailer,
Magnit, occupied second place in sales but led the retail market in terms of number of outlets and sales
area in 2011.
Retailers demand consistent quality and adherence to contract specifications and penalize suppliers for
failure to meet requirements. As a result, foreign suppliers continue to be competitive in the Russian
market as they are more accustomed to meeting strict specifications.
Russian retailers and consumers still rely heavily on cash for payment but that is changing. According
to Cushman & Wakefield research, in 2011, roughly 95 percent of retail payments in Russia were made
with cash. However, there was a notable increase in credit and debit card payments. About 28 percent of
retail purchases in Moscow and 18 percent overall in Russia were made by plastic cards. According to
the Central Bank of Russia, in 2011 banks issued about 167 million credit/debit cards, up 40 percent
from 2008. A significant number of retailers in 2011 provided consumers with the opportunity to pay by
credit card.
The retail market in Russia varies significantly among the Federal Districts both in terms of its value
and the nature of its development. The variations result from the number of inhabitants, population
density, level of urbanization, as well as average monthly income and expenditures, existing
competition and other regional characteristics.
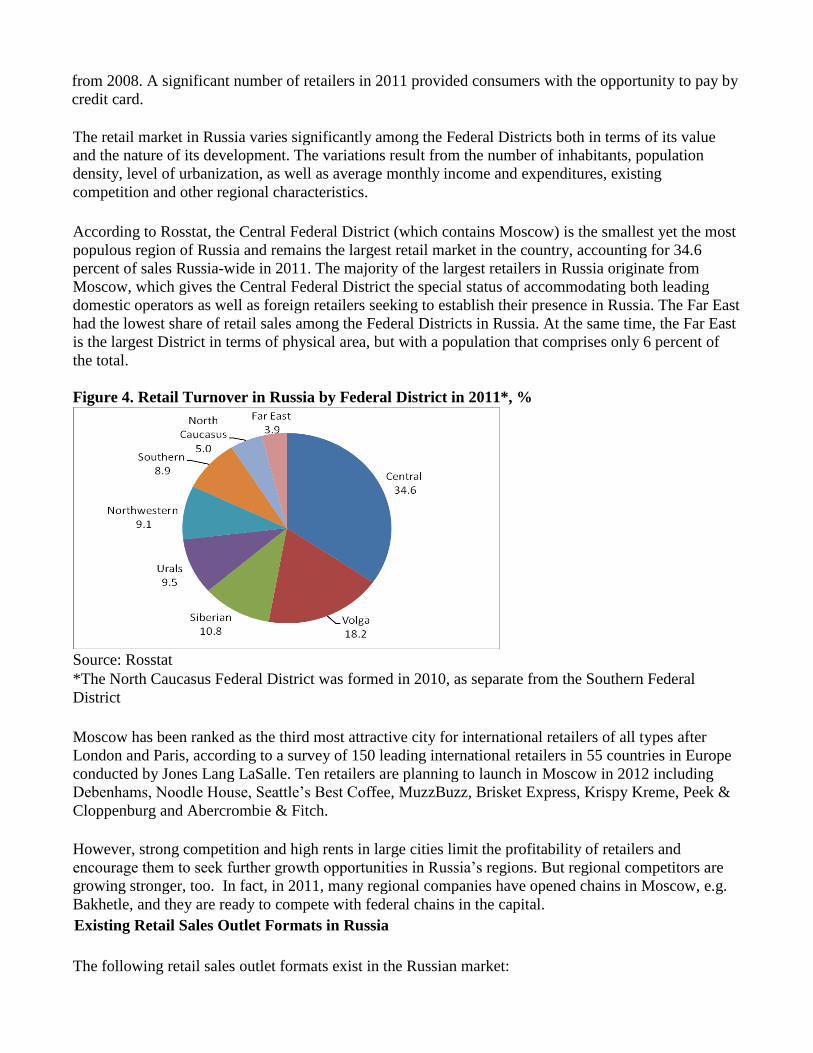
According to Rosstat, the Central Federal District (which contains Moscow) is the smallest yet the most
populous region of Russia and remains the largest retail market in the country, accounting for 34.6
percent of sales Russia-wide in 2011. The majority of the largest retailers in Russia originate from
Moscow, which gives the Central Federal District the special status of accommodating both leading
domestic operators as well as foreign retailers seeking to establish their presence in Russia. The Far East
had the lowest share of retail sales among the Federal Districts in Russia. At the same time, the Far East
is the largest District in terms of physical area, but with a population that comprises only 6 percent of
the total.
Figure 4. Retail Turnover in Russia by Federal District in 2011*, %
Source: Rosstat *The North Caucasus Federal District was formed in 2010, as separate from the Southern Federal
District
Moscow has been ranked as the third most attractive city for international retailers of all types after
London and Paris, according to a survey of 150 leading international retailers in 55 countries in Europe
conducted by Jones Lang LaSalle. Ten retailers are planning to launch in Moscow in 2012 including
Debenhams, Noodle House, Seattle’s Best Coffee, MuzzBuzz, Brisket Express, Krispy Kreme, Peek &
Cloppenburg and Abercrombie & Fitch.
However, strong competition and high rents in large cities limit the profitability of retailers and
encourage them to seek further growth opportunities in Russia’s regions. But regional competitors are
growing stronger, too. In fact, in 2011, many regional companies have opened chains in Moscow, e.g.
Bakhetle, and they are ready to compete with federal chains in the capital.
Existing Retail Sales Outlet Formats in Russia
The following retail sales outlet formats exist in the Russian market:
Hypermarket. A store with retail space of more than 2,500 sq. meters, where not less than 35
percent of the space is used for sales of non-food products. As a rule, a hypermarket is located
on the outskirts of large cities, or is the anchor store of a large urban shopping mall (e.g.,
Auchan, O'Key, Lenta).
Hypermarkets target car-owning households of all income levels who seek higher-quality products,
more services and wider product assortments. So-called “family shopping”, when many products are
purchased on a weekly basis, has become very popular in Russia. In 2011, food products accounted for
about 82.5 percent of retail value sales in hypermarkets, according to Euromonitor.
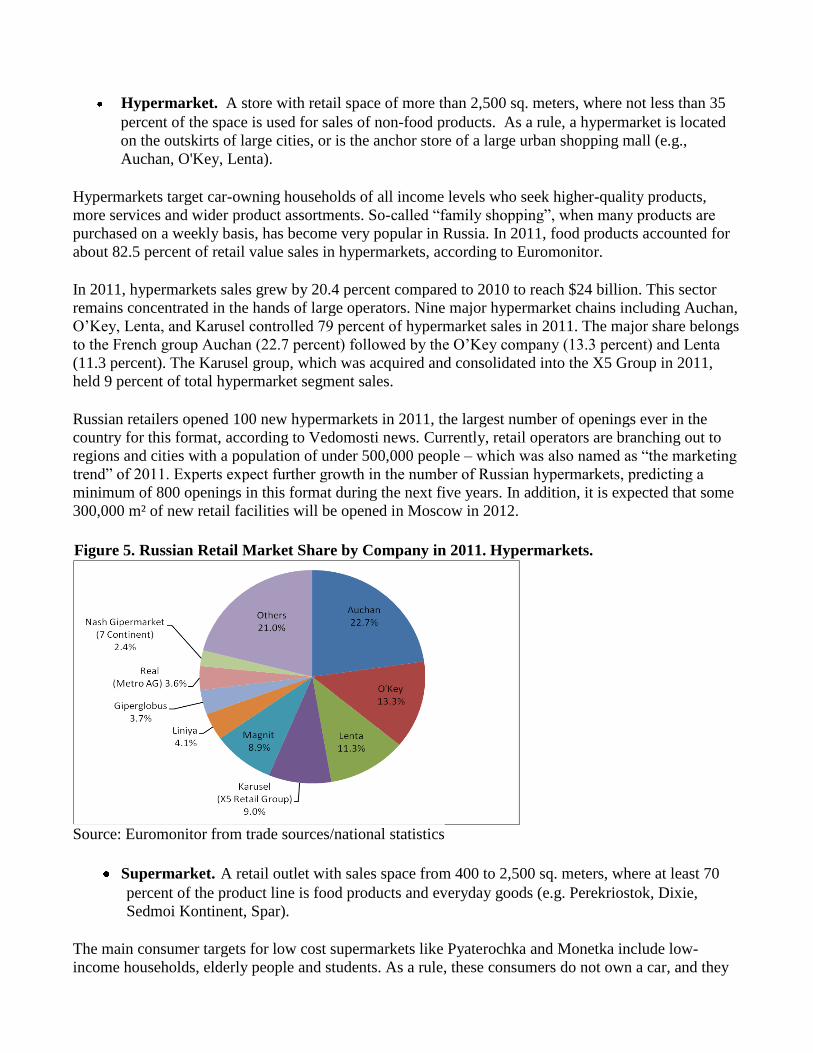
In 2011, hypermarkets sales grew by 20.4 percent compared to 2010 to reach $24 billion. This sector
remains concentrated in the hands of large operators. Nine major hypermarket chains including Auchan,
O’Key, Lenta, and Karusel controlled 79 percent of hypermarket sales in 2011. The major share belongs
to the French group Auchan (22.7 percent) followed by the O’Key company (13.3 percent) and Lenta
(11.3 percent). The Karusel group, which was acquired and consolidated into the X5 Group in 2011,
held 9 percent of total hypermarket segment sales.
Russian retailers opened 100 new hypermarkets in 2011, the largest number of openings ever in the
country for this format, according to Vedomosti news. Currently, retail operators are branching out to
regions and cities with a population of under 500,000 people – which was also named as “the marketing
trend” of 2011. Experts expect further growth in the number of Russian hypermarkets, predicting a
minimum of 800 openings in this format during the next five years. In addition, it is expected that some
300,000 m² of new retail facilities will be opened in Moscow in 2012.
Figure 5. Russian Retail Market Share by Company in 2011. Hypermarkets.
Source: Euromonitor from trade sources/national statistics
Supermarket. A retail outlet with sales space from 400 to 2,500 sq. meters, where at least 70
percent of the product line is food products and everyday goods (e.g. Perekriostok, Dixie,
Sedmoi Kontinent, Spar).
The main consumer targets for low cost supermarkets like Pyaterochka and Monetka include low-
income households, elderly people and students. As a rule, these consumers do not own a car, and they
often prefer to shop in outlets closest to home. Most supermarket operators benefit from convenient
locations in residential areas.
Supermarkets compete with hypermarkets, convenience stores and independent small grocers as they
focus on the same consumer groups. Almost all retail operators offer a range of ready-to-eat food and
chilled ready-to-cook products. The share of food sales versus non-food sales in supermarkets increased
in 2011 to reach 91.5 percent.
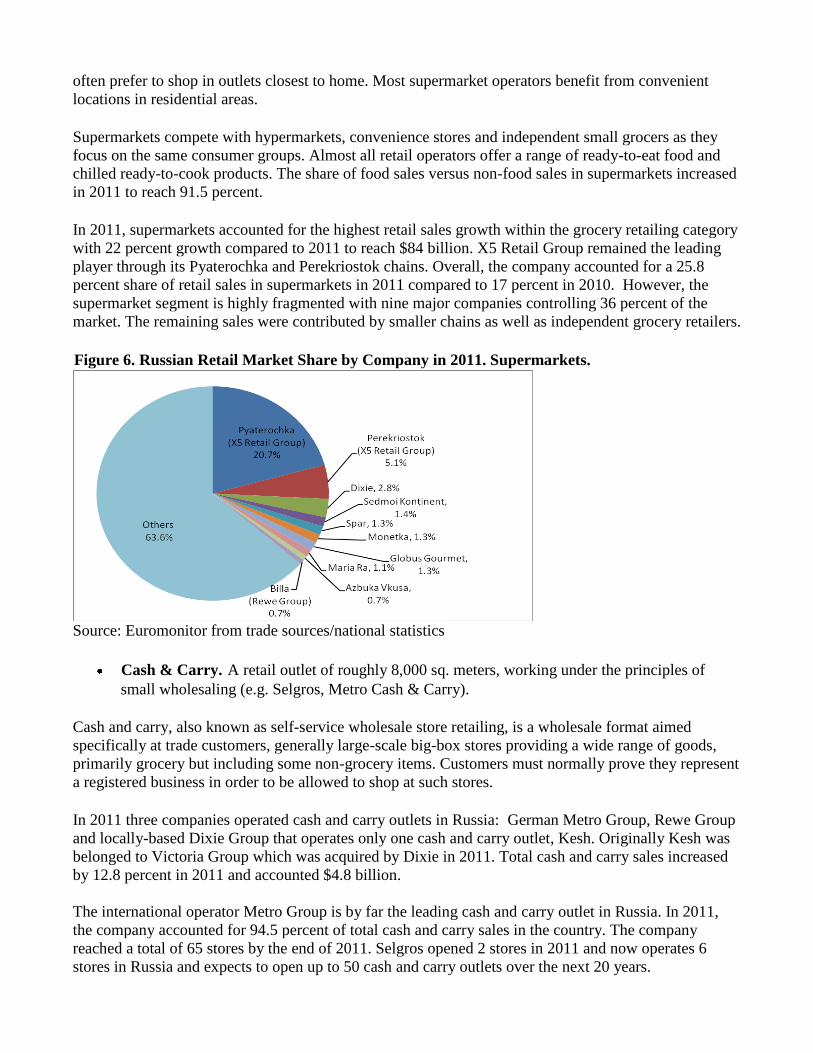
In 2011, supermarkets accounted for the highest retail sales growth within the grocery retailing category
with 22 percent growth compared to 2011 to reach $84 billion. X5 Retail Group remained the leading
player through its Pyaterochka and Perekriostok chains. Overall, the company accounted for a 25.8
percent share of retail sales in supermarkets in 2011 compared to 17 percent in 2010. However, the
supermarket segment is highly fragmented with nine major companies controlling 36 percent of the
market. The remaining sales were contributed by smaller chains as well as independent grocery retailers.
Figure 6. Russian Retail Market Share by Company in 2011. Supermarkets.
Source: Euromonitor from trade sources/national statistics
Cash & Carry. A retail outlet of roughly 8,000 sq. meters, working under the principles of
small wholesaling (e.g. Selgros, Metro Cash & Carry).
Cash and carry, also known as self-service wholesale store retailing, is a wholesale format aimed
specifically at trade customers, generally large-scale big-box stores providing a wide range of goods,
primarily grocery but including some non-grocery items. Customers must normally prove they represent
a registered business in order to be allowed to shop at such stores.
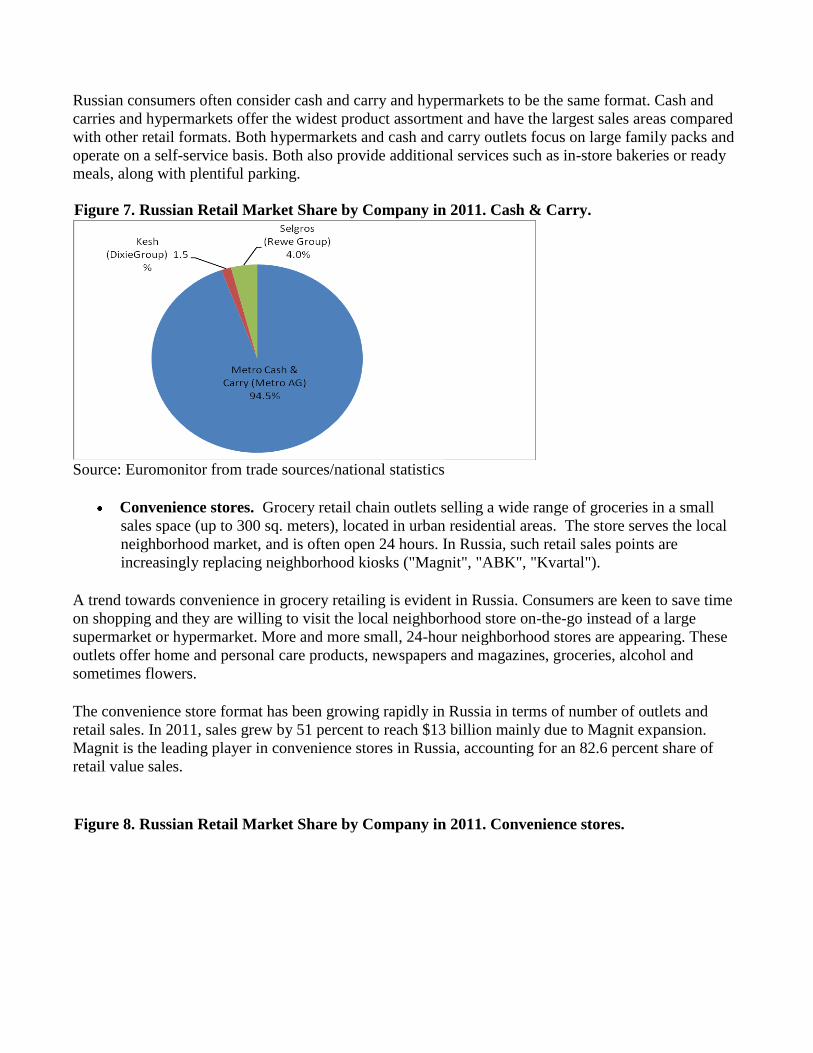
In 2011 three companies operated cash and carry outlets in Russia: German Metro Group, Rewe Group
and locally-based Dixie Group that operates only one cash and carry outlet, Kesh. Originally Kesh was
belonged to Victoria Group which was acquired by Dixie in 2011. Total cash and carry sales increased
by 12.8 percent in 2011 and accounted $4.8 billion.
The international operator Metro Group is by far the leading cash and carry outlet in Russia. In 2011,
the company accounted for 94.5 percent of total cash and carry sales in the country. The company
reached a total of 65 stores by the end of 2011. Selgros opened 2 stores in 2011 and now operates 6
stores in Russia and expects to open up to 50 cash and carry outlets over the next 20 years.
Russian consumers often consider cash and carry and hypermarkets to be the same format. Cash and
carries and hypermarkets offer the widest product assortment and have the largest sales areas compared
with other retail formats. Both hypermarkets and cash and carry outlets focus on large family packs and
operate on a self-service basis. Both also provide additional services such as in-store bakeries or ready
meals, along with plentiful parking.
Figure 7. Russian Retail Market Share by Company in 2011. Cash & Carry.
Source: Euromonitor from trade sources/national statistics
Convenience stores. Grocery retail chain outlets selling a wide range of groceries in a small
sales space (up to 300 sq. meters), located in urban residential areas. The store serves the local
neighborhood market, and is often open 24 hours. In Russia, such retail sales points are
increasingly replacing neighborhood kiosks ("Magnit", "ABK", "Kvartal").
A trend towards convenience in grocery retailing is evident in Russia. Consumers are keen to save time
on shopping and they are willing to visit the local neighborhood store on-the-go instead of a large
supermarket or hypermarket. More and more small, 24-hour neighborhood stores are appearing. These
outlets offer home and personal care products, newspapers and magazines, groceries, alcohol and
sometimes flowers.
The convenience store format has been growing rapidly in Russia in terms of number of outlets and
retail sales. In 2011, sales grew by 51 percent to reach $13 billion mainly due to Magnit expansion.
Magnit is the leading player in convenience stores in Russia, accounting for an 82.6 percent share of
retail value sales.
Figure 8. Russian Retail Market Share by Company in 2011. Convenience stores.
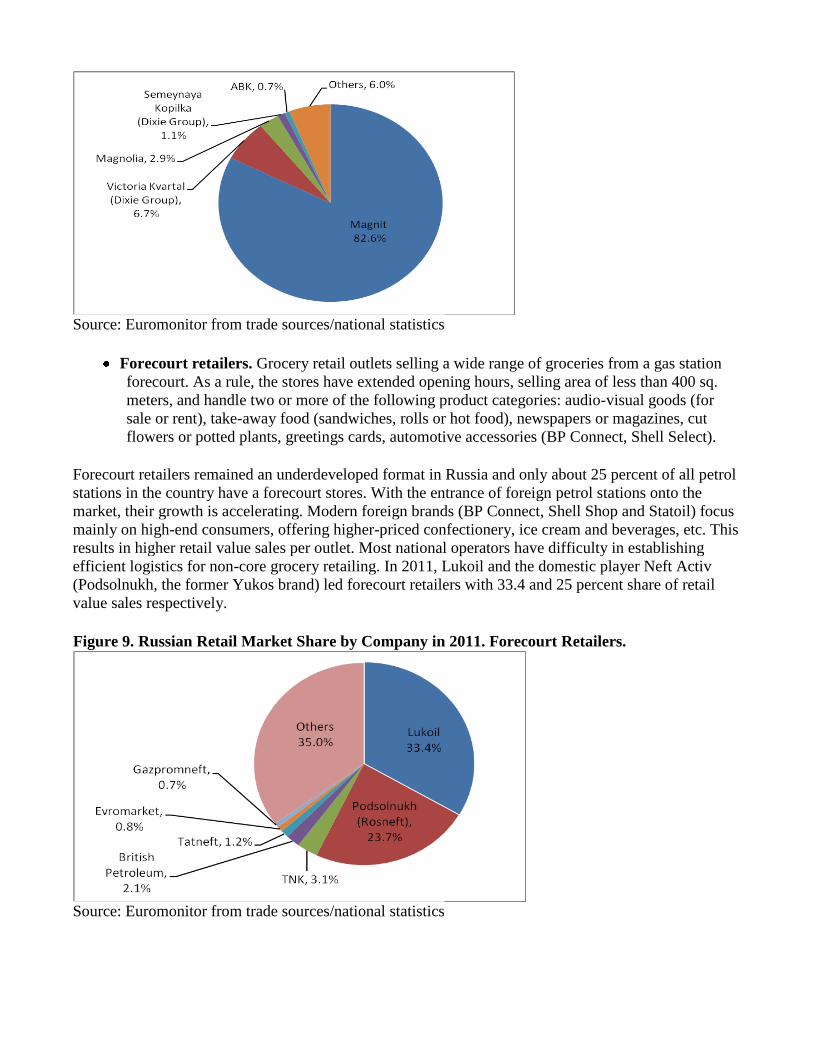
Source: Euromonitor from trade sources/national statistics
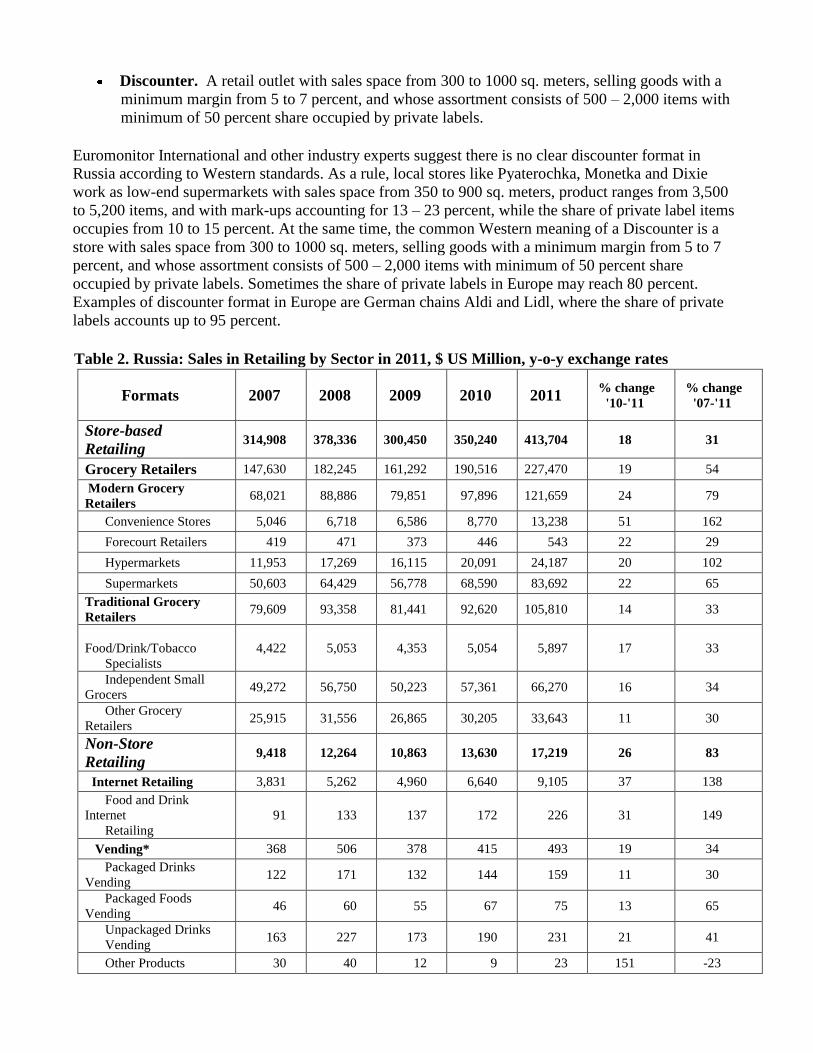
Forecourt retailers. Grocery retail outlets selling a wide range of groceries from a gas station
forecourt. As a rule, the stores have extended opening hours, selling area of less than 400 sq.
meters, and handle two or more of the following product categories: audio-visual goods (for
sale or rent), take-away food (sandwiches, rolls or hot food), newspapers or magazines, cut
flowers or potted plants, greetings cards, automotive accessories (BP Connect, Shell Select).
Forecourt retailers remained an underdeveloped format in Russia and only about 25 percent of all petrol
stations in the country have a forecourt stores. With the entrance of foreign petrol stations onto the
market, their growth is accelerating. Modern foreign brands (BP Connect, Shell Shop and Statoil) focus
mainly on high-end consumers, offering higher-priced confectionery, ice cream and beverages, etc. This
results in higher retail value sales per outlet. Most national operators have difficulty in establishing
efficient logistics for non-core grocery retailing. In 2011, Lukoil and the domestic player Neft Activ
(Podsolnukh, the former Yukos brand) led forecourt retailers with 33.4 and 25 percent share of retail
value sales respectively.
Figure 9. Russian Retail Market Share by Company in 2011. Forecourt Retailers.
Source: Euromonitor from trade sources/national statistics
Discounter. A retail outlet with sales space from 300 to 1000 sq. meters, selling goods with a
minimum margin from 5 to 7 percent, and whose assortment consists of 500 – 2,000 items with
minimum of 50 percent share occupied by private labels.
Euromonitor International and other industry experts suggest there is no clear discounter format in
Russia according to Western standards. As a rule, local stores like Pyaterochka, Monetka and Dixie
work as low-end supermarkets with sales space from 350 to 900 sq. meters, product ranges from 3,500
to 5,200 items, and with mark-ups accounting for 13 – 23 percent, while the share of private label items
occupies from 10 to 15 percent. At the same time, the common Western meaning of a Discounter is a
store with sales space from 300 to 1000 sq. meters, selling goods with a minimum margin from 5 to 7
percent, and whose assortment consists of 500 – 2,000 items with minimum of 50 percent share
occupied by private labels. Sometimes the share of private labels in Europe may reach 80 percent.
Examples of discounter format in Europe are German chains Aldi and Lidl, where the share of private
labels accounts up to 95 percent.
Table 2. Russia: Sales in Retailing by Sector in 2011, $ US Million, y-o-y exchange rates
Formats 2007 2008 2009 2010 2011 % change
'10-'11
% change
'07-'11
Store-based
Retailing 314,908 378,336 300,450 350,240 413,704 18 31
Grocery Retailers 147,630 182,245 161,292 190,516 227,470 19 54
Modern Grocery
Retailers 68,021 88,886 79,851 97,896 121,659 24 79
Convenience Stores 5,046 6,718 6,586 8,770 13,238 51 162
Forecourt Retailers 419 471 373 446 543 22 29
Hypermarkets 11,953 17,269 16,115 20,091 24,187 20 102
Supermarkets 50,603 64,429 56,778 68,590 83,692 22 65
Traditional Grocery
Retailers 79,609 93,358 81,441 92,620 105,810 14 33
Food/Drink/Tobacco
Specialists
4,422 5,053 4,353 5,054 5,897 17 33
Independent Small
Grocers 49,272 56,750 50,223 57,361 66,270 16 34
Other Grocery
Retailers 25,915 31,556 26,865 30,205 33,643 11 30
Non-Store
Retailing 9,418 12,264 10,863 13,630 17,219 26 83
Internet Retailing 3,831 5,262 4,960 6,640 9,105 37 138
Food and Drink
Internet
Retailing
91 133 137 172 226 31 149
Vending* 368 506 378 415 493 19 34
Packaged Drinks
Vending 122 171 132 144 159 11 30
Packaged Foods
Vending 46 60 55 67 75 13 65
Unpackaged Drinks
Vending 163 227 173 190 231 21 41
Other Products 30 40 12 9 23 151 -23
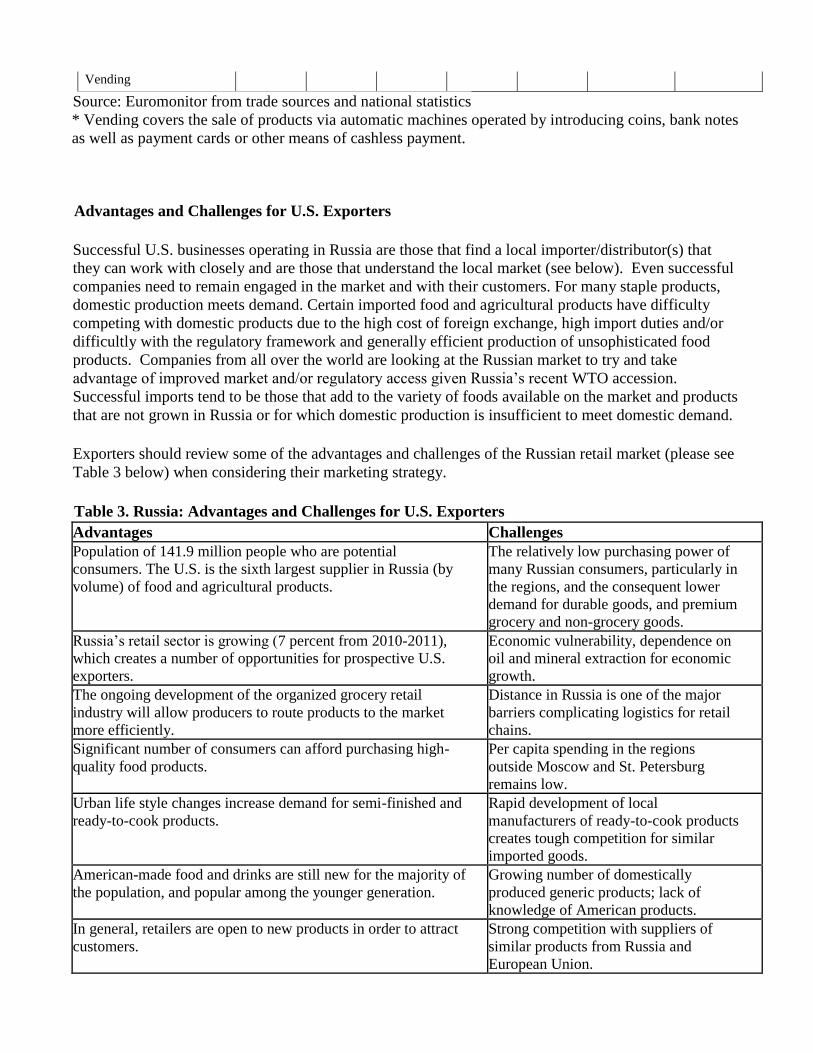
Vending
Source: Euromonitor from trade sources and national statistics
* Vending covers the sale of products via automatic machines operated by introducing coins, bank notes
as well as payment cards or other means of cashless payment.
Advantages and Challenges for U.S. Exporters
Successful U.S. businesses operating in Russia are those that find a local importer/distributor(s) that
they can work with closely and are those that understand the local market (see below). Even successful
companies need to remain engaged in the market and with their customers. For many staple products,
domestic production meets demand. Certain imported food and agricultural products have difficulty
competing with domestic products due to the high cost of foreign exchange, high import duties and/or
difficultly with the regulatory framework and generally efficient production of unsophisticated food
products. Companies from all over the world are looking at the Russian market to try and take
advantage of improved market and/or regulatory access given Russia’s recent WTO accession.
Successful imports tend to be those that add to the variety of foods available on the market and products
that are not grown in Russia or for which domestic production is insufficient to meet domestic demand.
Exporters should review some of the advantages and challenges of the Russian retail market (please see
Table 3 below) when considering their marketing strategy.
Table 3. Russia: Advantages and Challenges for U.S. Exporters
Advantages Challenges Population of 141.9 million people who are potential
consumers. The U.S. is the sixth largest supplier in Russia (by
volume) of food and agricultural products.
The relatively low purchasing power of
many Russian consumers, particularly in
the regions, and the consequent lower
demand for durable goods, and premium
grocery and non-grocery goods.
Russia’s retail sector is growing (7 percent from 2010-2011),
which creates a number of opportunities for prospective U.S.
exporters.
Economic vulnerability, dependence on
oil and mineral extraction for economic
growth.
The ongoing development of the organized grocery retail
industry will allow producers to route products to the market
more efficiently.
Distance in Russia is one of the major
barriers complicating logistics for retail
chains.
Significant number of consumers can afford purchasing high-
quality food products.
Per capita spending in the regions
outside Moscow and St. Petersburg
remains low.
Urban life style changes increase demand for semi-finished and
ready-to-cook products.
Rapid development of local
manufacturers of ready-to-cook products
creates tough competition for similar
imported goods.
American-made food and drinks are still new for the majority of
the population, and popular among the younger generation.
Growing number of domestically
produced generic products; lack of
knowledge of American products.
In general, retailers are open to new products in order to attract
customers.
Strong competition with suppliers of
similar products from Russia and
European Union.
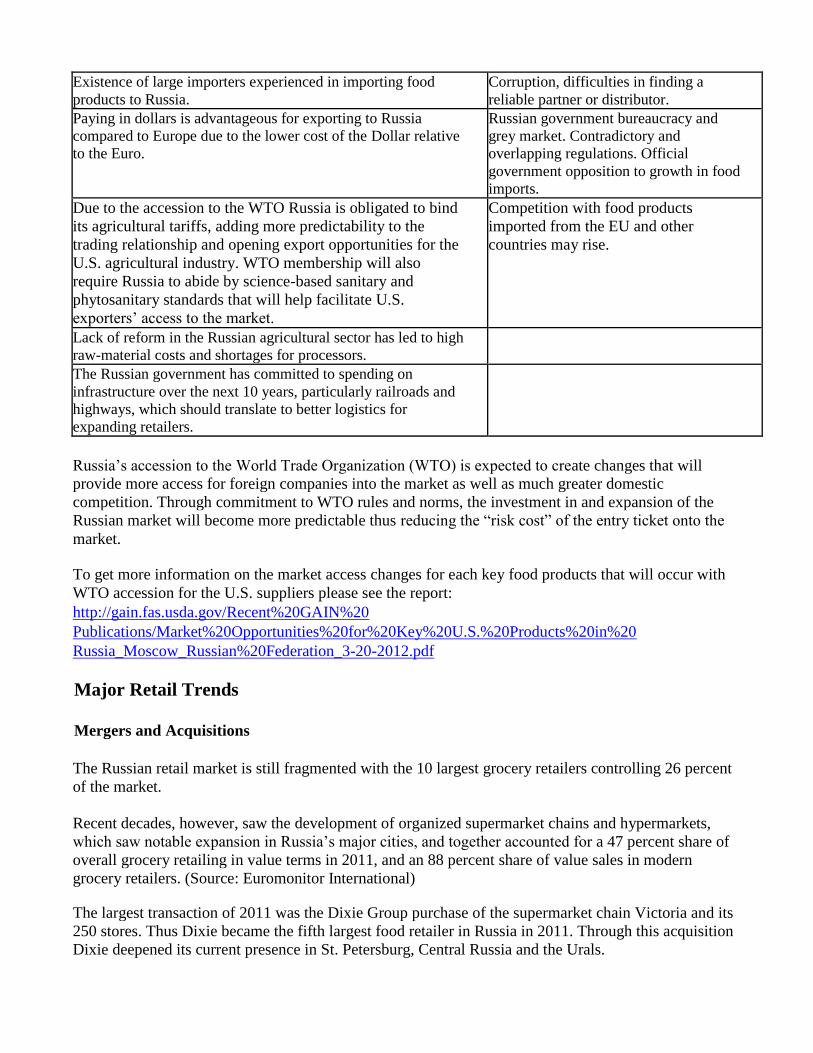
Existence of large importers experienced in importing food
products to Russia.
Corruption, difficulties in finding a
reliable partner or distributor.
Paying in dollars is advantageous for exporting to Russia
compared to Europe due to the lower cost of the Dollar relative
to the Euro.
Russian government bureaucracy and
grey market. Contradictory and
overlapping regulations. Official
government opposition to growth in food
imports.
Due to the accession to the WTO Russia is obligated to bind
its agricultural tariffs, adding more predictability to the
trading relationship and opening export opportunities for the
U.S. agricultural industry. WTO membership will also
require Russia to abide by science-based sanitary and
phytosanitary standards that will help facilitate U.S.
exporters’ access to the market.
Competition with food products
imported from the EU and other
countries may rise.
Lack of reform in the Russian agricultural sector has led to high
raw-material costs and shortages for processors.
The Russian government has committed to spending on
infrastructure over the next 10 years, particularly railroads and
highways, which should translate to better logistics for
expanding retailers.
Russia’s accession to the World Trade Organization (WTO) is expected to create changes that will
provide more access for foreign companies into the market as well as much greater domestic
competition. Through commitment to WTO rules and norms, the investment in and expansion of the
Russian market will become more predictable thus reducing the “risk cost” of the entry ticket onto the
market.
To get more information on the market access changes for each key food products that will occur with
WTO accession for the U.S. suppliers please see the report:
http://gain.fas.usda.gov/Recent%20GAIN%20
Publications/Market%20Opportunities%20for%20Key%20U.S.%20Products%20in%20
Russia_Moscow_Russian%20Federation_3-20-2012.pdf
Major Retail Trends
Mergers and Acquisitions
The Russian retail market is still fragmented with the 10 largest grocery retailers controlling 26 percent
of the market.
Recent decades, however, saw the development of organized supermarket chains and hypermarkets,
which saw notable expansion in Russia’s major cities, and together accounted for a 47 percent share of
overall grocery retailing in value terms in 2011, and an 88 percent share of value sales in modern
grocery retailers. (Source: Euromonitor International)
The largest transaction of 2011 was the Dixie Group purchase of the supermarket chain Victoria and its
250 stores. Thus Dixie became the fifth largest food retailer in Russia in 2011. Through this acquisition
Dixie deepened its current presence in St. Petersburg, Central Russia and the Urals.
In 2012, the X5 Retail Group purchased 23 retail stores in the city of Kirov called Economnaya Sem’ya
(Saving Family) and Mir Produktov (World of Products) as well as 24 stores of Tatarstan chain
Norodniy (Peoples'). That adds to X5’s already large group which grew in 2011 by acquiring the
grocery chains “Island” and “Kopeyka”.
Foreign retailers such as France's Auchan and Germany's Metro have a strong market presence in Russia
but in the past two years both Carrefour and Wal-Mart have withdrawn from Russia in the face of strong
domestic competition. Rumors still surface about a return in the future.
In order to expand into the regions, Russian retail chains offer franchising opportunities to local chains.
This is advantageous from the point of view of increasing market penetration and reducing cost and, as
local players already have a share of the market, the base expenses are only for retraining staff,
introducing new technology, and bringing the retail space up to brand standards. Chains that use such a
franchise scheme tend to be bought up by the franchise owner at a later date. (Source: EastKommerts
Investment Group)
Private Labels
Private label merchandise represents a relatively new phenomenon in Russia, and still has a limited
presence in the retail market, which is tied to the low concentration of retail chains outside of the major
cities. Companies offering private label products are still not accustomed to competing with brands.
Retailers confirm that it is difficult to establish long-lasting and trusting relationships with contractors,
as private label manufacturing brings little profit. Although private label products have increasingly
come to be associated with quality in mature European markets, in Russia they tend to simply indicate
lower prices, and are interpreted to offer lower quality. Also, there are differences in the preparedness of
consumers to consider private label products, depending on the category of products in question. Many
Russian consumers are still brand-oriented, and they are not ready to buy private label products in large
volumes.
According to Euromonitor International, in Russia private label sales reached $16 billion in 2011, an
increase of 20 percent compared with the previous year. Private label sales represented about 3 percent
of total retail food sales in 2011.
Private label (aka generic) products such as home care products and staple food items such as pasta or
rice tend to attract interest from a broader range of consumers, whilst feminine hygiene products, baby
food, pet food, cosmetics and indulgence products such as chocolate fare less well, given the more
emotional relationship consumers have with these items. Private label products also do well in
categories in which products are commodity-based and technological innovation is less important,
feeding into categories such as chilled, processed food.
Under the current conditions, only the large retailer chains are able to convincingly compete in private
label, given their ability to absorb more costs, drive growth through volume sales, and invest in product
development, packaging design and advertising.
Amongst the first to enter private label were the X5 Retail Group and Magnit. The X5 Retail Group
leads in terms of private label sales, reported at $1.7 billion in 2011, after its acquisition of the Kopeyka
chain, which saw the company adding several private labels to its portfolio.
Magnit offers a wide range of more than 530 private label products, representing around a 15 percent
share of the total assortment of an average Magnit outlet. All private label products in Magnit outlets
target low-income consumers.
Regional retail operators, namely the Tatarstan-based Bakhetle and the Siberia-based Maria Ra retail
chains, have become leaders in terms of the share of private label merchandise within their total sales. In
2011, private label accounted for 35 percent of Bakhetle’s and 20 percent of Maria Ra’s value sales,
which was more than in other grocery retailers.
Auchan will continue placing 500-700 private label SKUs annually. However, Seventh Continent’s
strategy is to ensure their private label share is not too high, since all manufacturers should be present
equally in its stores.
Nonetheless, retailers see private label products as offering strong advantages in terms of price
competition in the longer term. The leading retailers are investing in better packaging and improving the
quality of private label offerings. The X5 Retail Group plans to develop premium private label products
for distribution through its hypermarkets and high-end Perekriostok Green supermarkets. Azbuka Vkusa
launched its Pochti Gotovo private label in its high-end supermarkets in October 2010. In the short-
term, Azbuka Vkusa plans to offer premium private label products from Russian farms.
Although the majority of retailers operating in private label tend to focus on the lower-priced segment
of the market, the character of private labeling in Russia is changing. Many retail chains intend to
increase the percentage of revenue earned from private label over the coming years, and expand their
range of private label products. X5 Retail Group aims to increase its private label share of the total
range to 30 percent in Perekriostok supermarkets, to 50 percent in Pyaterochka outlets and 10 percent in
Karusel hypermarkets. Expansion plans have been reported by all low-end supermarkets, as well. These
retailers aim to increase private label’s share of total sales in their outlets up to 25- 30 percent in the
short-to-medium term.
Organic, Healthy and Ready-to-Cook Products
Busier lifestyles, particularly in Russia’s largest cities, has created steady growth in demand for
products such as chilled ready meals and frozen ready-to-cook products. As a result, supermarkets,
hypermarkets, and independent grocery stores have improved offerings of chilled and ready-to-cook
meals. In addition, a health-conscious trend has led to a greater offering of healthy, low-fat, salt-and
sugar-free foods, fresh exotic fruits and vegetables. The assortment is wider particularly in large cities
such as Moscow and St. Petersburg and in Vladivostok where fresh fruits and vegetables are available
from the western United States and China. High-end supermarkets have begun to develop a range of
organic foods, and some entrepreneurs have tried to develop supermarkets specializing in organic
produce.
The demand for eco-brands and organic products is growing. However, there is a lack of regulation in
Russia concerning eco-brands, and firms can freely label products as “bio” or “eco”. This is the reason
Russian consumers do not trust the quality of so-called eco-brands, and they are not ready to pay extra
for them.
Most organic products are imported from Europe and sold in specialty shops in areas where upper
income Russians live, as well as in other premium shops, like Grunvald and Azbuka Vkusa in Moscow,
which are well known for the distribution and promotion of value-added “green” and healthy products.
Domestic manufacturers are searching for ways to gain a larger share in this niche, including via
voluntary certification for organic products.
In 2012, several Russian producers of so-called “bio” products, e.g. Corporation Organic, the "Planet
Health" group of companies, and the Association "Ecoklaster", came out with an open letter to the
Russian Minister of Agriculture wherein they raised concerns about the lack of regulation of organic
agricultural products in Russia and stressed the need to amend current regulatory rules. These
companies introduced proposals to be included into draft regulation “On Producing Ecologically Clean
(Organic) Agricultural Products”. Currently the producers are working on detailed suggestions and they
will be a part of the group that, together with Russian Minister of Agriculture representatives, will be
working out the draft law.
For more information on Russian organic market please see the Gain report
http://gain.fas.usda.gov/Recent%20GAIN%20Publications/Russian%20Organic%20Market
%20Taking%20Root_Moscow%20ATO_Russian%20Federation_4-27-2011.pdf
Shopping Malls
Consumers in urban areas prefer to spend less time shopping and consequently choose one-stop
shopping malls. As a rule, shopping malls located in city centers have one or more cinemas, restaurants,
grocery retailers, durable goods retailers, souvenir stores, cosmetic retailers and beauty salons. Some
property developers also allocate space for sports and fitness clubs under the roof of a shopping mall.
Local government authorities have recognized the advantages of megastores in cities and created a
favorable environment for the rapid development of hypermarkets, megastores of all types and shopping
malls. Shopping malls and megastores are appearing on the sites of former outdoor markets, which have
been slowly vanishing.
In 2011, over 25 shopping centers were completed in Russia. Moscow and St. Petersburg still account
for the highest number of malls in Russia. At the end of 2011, approximately 45 percent of all shopping
centers in the country were in these two cities. However, the 11 Russian cities with populations over 1
million, (e.g. Novosibirsk, Yekaterinburg, Nizhniy Novgorod, etc.) accounted for more than 110 of the
370 malls operating in the Russian market at the end of 2011. Over 100 shopping centers are due to start
operations in Russia in 2012, according to the research of the InfoLine research agency.
The rental rates in Moscow’s shopping centers are very high in the range of $500-$4,000 (per sq. m. per
year) depending on the size of the retail unit and the type of retailer. In 2011, rental rates grew
moderately (3-5 percent per quarter on average). In other Russian cities rental rates are 30 to 60 percent
below Moscow or St. Petersburg levels.
Internet Retailing
During 2011, growth of internet retailing in Russia remained high and exceeded growth rates of store-
based retailing although it remains a very narrow market. According to Data Insight research, internet
sales in Russia grew by 30 percent to reach $11 billion in 2011. More than 50 percent of consumers who
buy goods online live in Moscow or St. Petersburg. The average bill is $296. Experts estimate the
number of online shoppers in Russia will increase by 25 percent in 2012, while sales turnover will grow
by 22 percent to reach $13 billion.
There are reported to be in excess of 50 million internet users in Russia, with approximately seven
million of these ordering products online at least once a month during 2011. Russia now boasts the most
internet users amongst European countries, and is sixth in the world, according to the TNS media
research company, with only China, the U.S., Japan, India and Brazil having more internet users.
Russian consumers mainly shop online for non-grocery products. In 2011, the online grocery market in
Russia was worth $545 million and accounted for 5 percent of total internet sales. Russian consumers
are not accustomed to shopping for groceries online, and they rarely use the internet for this purpose. It
is still perceived to be less stressful and less time consuming to visit the local supermarket than to shop
for groceries online. However, significant annual growth in Internet sales in recent years shows that
online grocery retailing has great potential.
In March 2012, Utkonos, one of the largest online grocery retailers in Russia, started selling grocery
goods using the online retail platform Wikimart, which is forecast to grow Utkonos' turnover by 3-5
percent, according to the Utkonos’ management. In 2011, Utkonos’ online sales reached approximately
$300 million annually. Currently, they handle about 10,000 orders per day.
One of the obstacles to the faster development of grocery internet retailers is the underdeveloped system
of e-payments, related to the scarce use of credit cards. Currently most e-shop operators accept cash on
delivery only. Russian consumers do not trust e-payments. Only 10 percent of e-shops offer the option
to pay by debit/credit cards. Industry experts explain that e-shop operators prefer to call to consumers
before the final confirmation of purchase. The PayPal system of security for e-payments has recently
opened a subsidiary in Russia, but it mainly serves foreign e-shop operators. In Moscow, auto traffic
may also be a factor limiting internet and delivery sales.
The internet sites developed by store-based retailers are increasingly important, as the current
environment favors well-established chains such as X5 Retail Group, with an established physical
presence in major cities and across the regions, which removes some issues related to storage and
transportation. The X5 chain launched its E5 project, offering a wide online range of non-grocery
products, including books, electronics and home care products, amongst others. Consumers are able to
collect products through Perekriostok outlets which are a particularly attractive option to Russian
consumers unwilling to pay online, although courier delivery and post office collection are also offered
as options. (Source: Euromonitor)
Some market experts estimate Russia will become the largest e-commerce market in Europe by 2019,
based on current growth rates. Forecasts remain optimistic on the whole, based on changing consumer
lifestyles and emerging retail trends, which are becoming gradually more closely aligned with Western
consumer trends.
Legislation Regulating Retail Trade
The Russian Federal Law on Trade came into force on February 1, 2010. This law is aimed at creating
transparent conditions for cooperation between domestic suppliers and retailers and boosting
competition in the retail sector. The law contains strict antimonopoly regulations, such as capping store
openings once a retailer reaches a 25 percent market share threshold within a city or municipal region, a
10 percent limit on bonuses paid to retailers by suppliers, and payment terms regulating how fast a
retailer has to pay for goods with a certain shelf life, among other provisions.
The core regulations of the new Federal Law on Trade have caused bitter debate amongst suppliers and
retailers. Some retailers declare that they will try to find ways to evade the new regulations. For
example, the legislation does not cover non-store retailing; therefore store-based operators can develop
internet retailing and continue to increase their sales and shares in certain regions. The Law does not
preclude companies from franchising and as a result a chain may still exceed the 25 percent cap on
market share in one region if stores are operated by various franchisees.
In 2011, the Federal Antimonopoly Service (FAS) monitored adherence to the 2010 regulations on a
monthly basis. In total, Federal Antimonopoly Service checked 464 retail chains in 2011, and found
5,695 infractions of the statute, according to Euromonitor. Retail chains which broke the law paid fines
or in some cases were closed. The cost to retailers of the 2010 regulations and their enforcement has
increased considerably and has affected consumer prices.
Retailers continue to suggest amendments to the legislation regarding retailing. Business representatives
suggested increasing the market share cap from 25 to 35 percent in Russian towns where the population
is less than 100,000 citizens. Retailers also suggested changes in tax regulations. For example, they
suggested removing expenses related to theft “shrinkage” in supermarkets (no more than 2 percent of
total revenues) from the balance sheets of the retail chains. The amendments to this legislation were
viewed favorably by some authorities; however official changes in the legislation have not been made.
For more information on Russian Federal Law on Trade please see Gain Report:
http://gain.fas.usda.gov/Recent%20GAIN%20Publications/The%20Russian%20Federal%
20Law%20on%20Trade%20_Moscow%20ATO_Russian%20Federation_8-30-2010.pdf
Section II. Road Map for Market Entry
Advice to Exporters
The World Bank's Ease of Doing Business 2012 report ranked Russia 111
th out of 183 countries, a
measurable improvement compared to the 2011 ranking of 120th
. However, the conditions for starting a
business have deteriorated significantly since 2009 when Russia ranked 88th out of 183 countries. This
is due to the lack of reform in terms of the time and number of procedures required for setting up a
business in the country. While many countries have simplified and streamlined the process, it takes 9.0
procedures and 30.0 days in Russia to open a business. This compares unfavorably to an OECD
(Organization for Economic Co-operation and Development) average of 5.7 procedures and 13.0
days. However, the cost of starting a business in Russia is low: only 2.7 percent of per capita income,
compared to an average of 8.3 percent of per capita income in the Eastern Europe and Central Asia
region.
USDA/FAS Services
Exporters can request a brief market assessment for their products and/or a list of Russian importers
from ATO Moscow, St. Petersburg and Vladivostok. Additionally, ATO Moscow offers the following
recommendations to help exporters select the best approach for their firm:
A prospective entrant is advised to estimate market prospects for their product with respect to
consumer preferences and incomes, local competition and sales channels (marketing research
from a specialized consulting firm may be required). A thorough review of Russian regulations
is also advised including a review of any changes to the tariff post-WTO-accession.
One of the main challenges to exporters entering the Russian market is product promotion. A
cost-effective way exporters can promote their products is to participate in one of the largest
general food and beverage trade shows in Russia, World Food Moscow, held annually in
September. If exporters are targeting specific regions within Russia, the Moscow ATO
recommends participating in regional exhibitions. Participation fees for regional exhibitions are
lower, and are aimed at local consumers and retail food chains. The Russian retail market is
competitive; exporters should allocate time to visit Russia and earmark funds in their sales plans
for local promotional support.
Selecting the right trade partner is one of the most important decisions for exporters developing
their business in Russia. Working with a local partner in Russia significantly expands business
opportunities, and minimizes the need for exporters to establish direct contact with multiple
retail chains. A local Russian partner familiar with market conditions and the regulatory
environment can help exporters navigate the Russian retail market, resolve issues, and increase
the likelihood of success.
In order to make the first delivery, usually a large local import company is chosen. The company
should have a good reputation and experience in customs clearance, and must have storage facilities and
a developed distribution network. Make sure the company has experience working with Western
suppliers and has experience in arranging regular supplies of food products. Western companies that
strive to supply directly, circumventing Russian middle men, often sustain losses due to lack of local
market knowledge. A large domestic import company may be better adjusted to local conditions, with
established trade ties and contacts in state structures.
Exporters representing U.S. companies may contact the Moscow ATO for assistance in locating
importer lists. Performing due diligence is critically important, such as verifying banking and supplier
references of potential importers, and local and U.S.-based organizations in Russia can provide helpful
information to exporters. However, credit reporting is a relatively new practice in Russia, and credit-
reporting agencies may not have complete information on potential Russian business partners. Retail
chains may be another valuable source for exporters collecting information on importers.
Provide Sales Support: Exporters must help market the products they sell in Russia. Russian
importers and wholesalers expect exporters to participate in the sales process, either by
providing event marketing support, advertising assistance, training, packaging/handling advice,
or point of sales materials.
Establish a Representative Office: Once a company has established firm contacts and has a solid
prospect for sales, one of the best ways to conduct business in Russia is to open a representative
office. Depending on the product and target market, an office might be situated in Moscow, a
city that hosts a large concentration of retailers and representative offices; St. Petersburg, the
port city through which the largest volume of sea-borne freight passes; or Vladivostok, the
principal transpacific gateway to the Russian Far East.
Distribution Channels
Imported food products for Russian retail chains and food service establishments come through
importers, distributors, and wholesalers. Large suppliers are typically also importers.
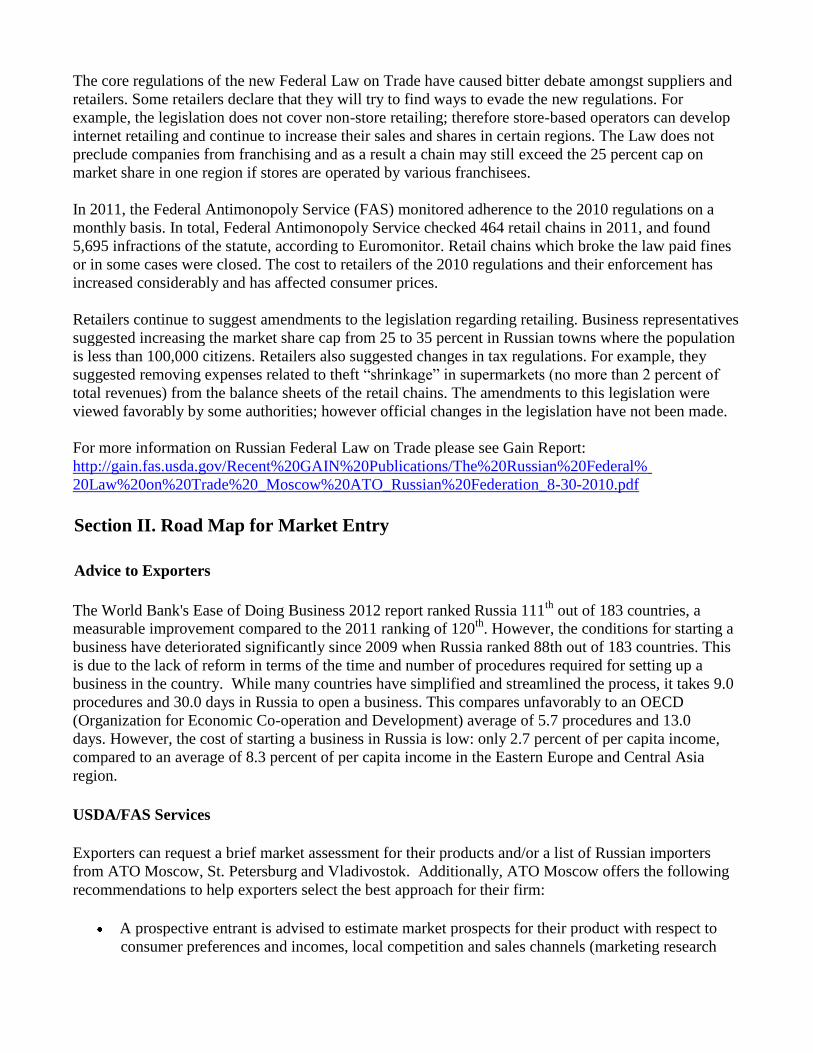
Imported products arrive in Russia via land, sea, or air freight into ports or customs warehouses for
clearance before proceeding to the next destination. The transportation system for shipping U.S. high
value food products into Russia via St. Petersburg and Moscow is well established. Most consumer-
oriented food and beverage products enter through St. Petersburg or Moscow for customs clearance.
Transit time from the United States to St. Petersburg ranges from 20 days to 27 days with an additional
four days shipping time for final delivery by rail or truck to Moscow.
Outside of Russia, imports are also delivered to Baltic ports and then shipped by truck or rail to St.
Petersburg or Moscow. Baltic and Finnish ports had offered greater efficiency, fewer problems with loss
or damage, and lower port fees. However, changes in Russian import requirements have largely
redirected Baltic shipments to Russian ports: St. Petersburg, Ust-Luga, Vysotsk, Kronshtadt,
Novorossiysk and Vladivostok.
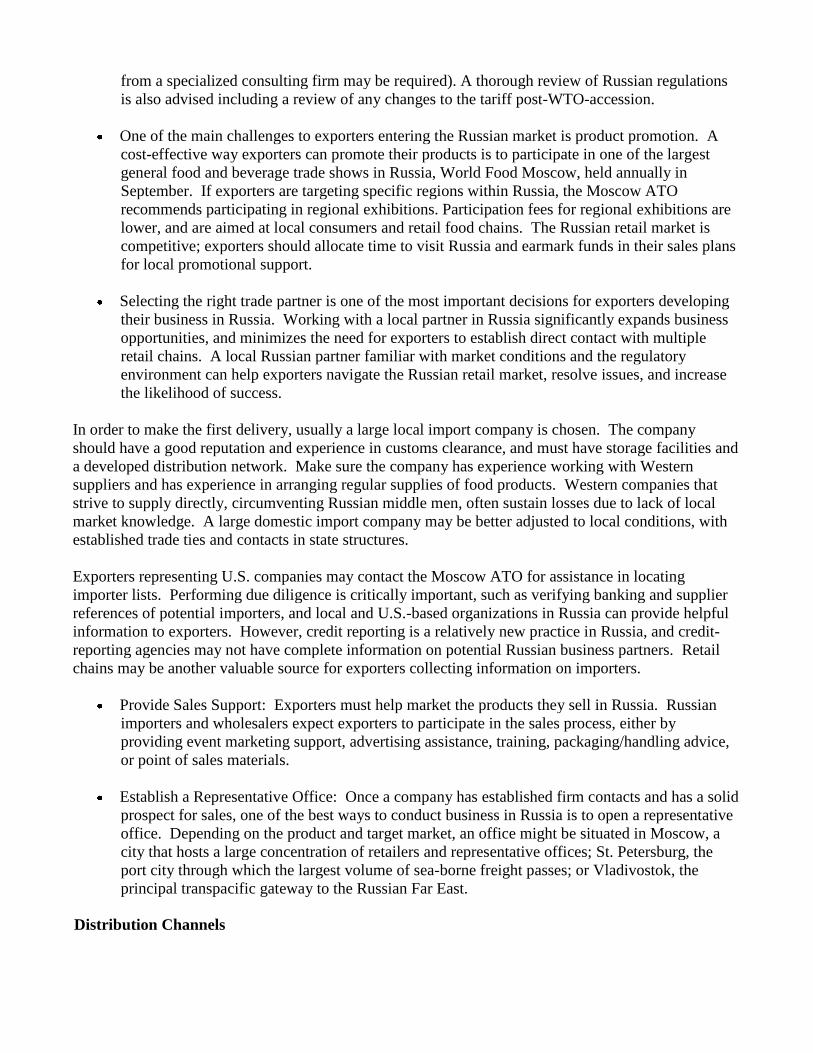
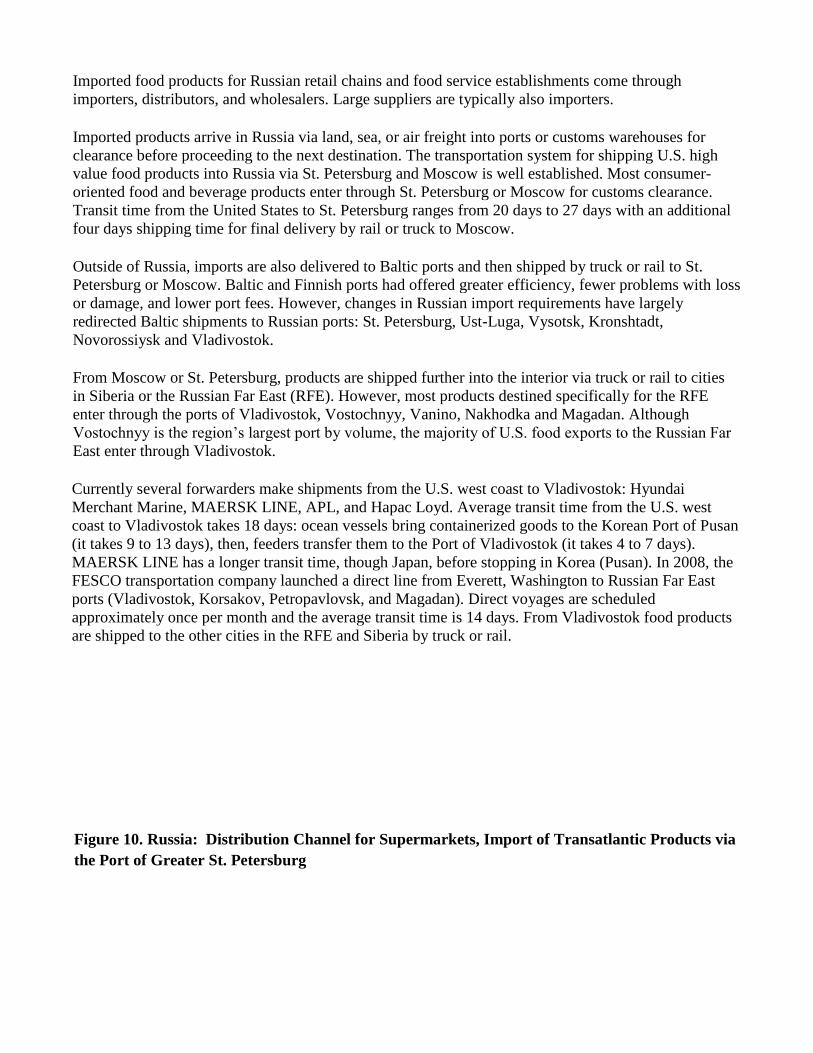
From Moscow or St. Petersburg, products are shipped further into the interior via truck or rail to cities
in Siberia or the Russian Far East (RFE). However, most products destined specifically for the RFE
enter through the ports of Vladivostok, Vostochnyy, Vanino, Nakhodka and Magadan. Although
Vostochnyy is the region’s largest port by volume, the majority of U.S. food exports to the Russian Far
East enter through Vladivostok.
Currently several forwarders make shipments from the U.S. west coast to Vladivostok: Hyundai
Merchant Marine, MAERSK LINE, APL, and Hapac Loyd. Average transit time from the U.S. west
coast to Vladivostok takes 18 days: ocean vessels bring containerized goods to the Korean Port of Pusan
(it takes 9 to 13 days), then, feeders transfer them to the Port of Vladivostok (it takes 4 to 7 days).
MAERSK LINE has a longer transit time, though Japan, before stopping in Korea (Pusan). In 2008, the
FESCO transportation company launched a direct line from Everett, Washington to Russian Far East
ports (Vladivostok, Korsakov, Petropavlovsk, and Magadan). Direct voyages are scheduled
approximately once per month and the average transit time is 14 days. From Vladivostok food products
are shipped to the other cities in the RFE and Siberia by truck or rail.
Figure 10. Russia: Distribution Channel for Supermarkets, Import of Transatlantic Products via
the Port of Greater St. Petersburg
Figure 11. Russia: Distribution channel for food retail chains, delivery from U.S. to the Russian
Far East
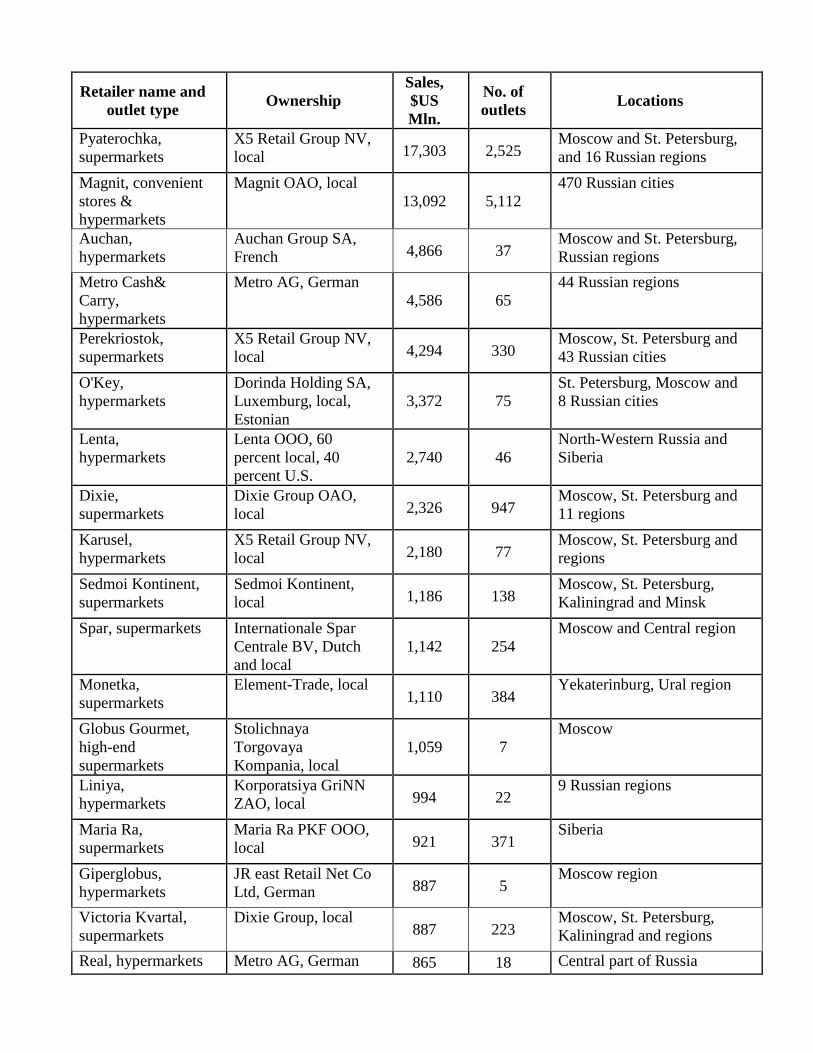
Company Profiles
Table 4. Russia: Major Retail Chains, 2011 (Retail Value excl. Sales Tax)
Retailer name and
outlet type Ownership
Sales,
$US
Mln.
No. of
outlets Locations
Pyaterochka,
supermarkets
X5 Retail Group NV,
local 17,303 2,525 Moscow and St. Petersburg,
and 16 Russian regions
Magnit, convenient
stores &
hypermarkets
Magnit OAO, local
13,092 5,112
470 Russian cities
Auchan,
hypermarkets
Auchan Group SA,
French 4,866 37 Moscow and St. Petersburg,
Russian regions
Metro Cash&
Carry,
hypermarkets
Metro AG, German
4,586 65
44 Russian regions
Perekriostok,
supermarkets
X5 Retail Group NV,
local 4,294 330 Moscow, St. Petersburg and
43 Russian cities
O'Key,
hypermarkets
Dorinda Holding SA,
Luxemburg, local,
Estonian
3,372 75
St. Petersburg, Moscow and
8 Russian cities
Lenta,
hypermarkets
Lenta OOO, 60
percent local, 40
percent U.S.
2,740 46
North-Western Russia and
Siberia
Dixie,
supermarkets
Dixie Group OAO,
local 2,326 947 Moscow, St. Petersburg and
11 regions
Karusel,
hypermarkets
X5 Retail Group NV,
local 2,180 77 Moscow, St. Petersburg and
regions
Sedmoi Kontinent,
supermarkets
Sedmoi Kontinent,
local 1,186 138 Moscow, St. Petersburg,
Kaliningrad and Minsk
Spar, supermarkets Internationale Spar
Centrale BV, Dutch
and local
1,142 254
Moscow and Central region
Monetka,
supermarkets
Element-Trade, local 1,110 384
Yekaterinburg, Ural region
Globus Gourmet,
high-end
supermarkets
Stolichnaya
Torgovaya
Kompania, local
1,059 7
Moscow
Liniya,
hypermarkets
Korporatsiya GriNN
ZAO, local 994 22 9 Russian regions
Maria Ra,
supermarkets
Maria Ra PKF OOO,
local 921 371 Siberia
Giperglobus,
hypermarkets
JR east Retail Net Co
Ltd, German 887 5 Moscow region
Victoria Kvartal,
supermarkets
Dixie Group, local 887 223
Moscow, St. Petersburg,
Kaliningrad and regions
Real, hypermarkets Metro AG, German 865 18 Central part of Russia
Auchan City,
supermarkets
Auchan Group SA,
French 634 15
Moscow and Moscow
region, St. Petersburg,
Novosibirsk, and
Yekaterinburg
Azbuka Vkusa,
supermarkets Gorodskoy
Supermarket, local 626 49
Moscow and Moscow
region
Billa, supermarkets Billa Russia (Rewe
Group), German &
local
597 69
Moscow and Central region
Nash Gipermarket Sedmoi Kontinent,
local 580 20 Moscow and Russian
regions
Kirovsky,
supermarkets
Kirovsky
Supermarket, local 567 130 Yekaterinburg, Ural region
Sources: Euromonitor International, company reports and websites
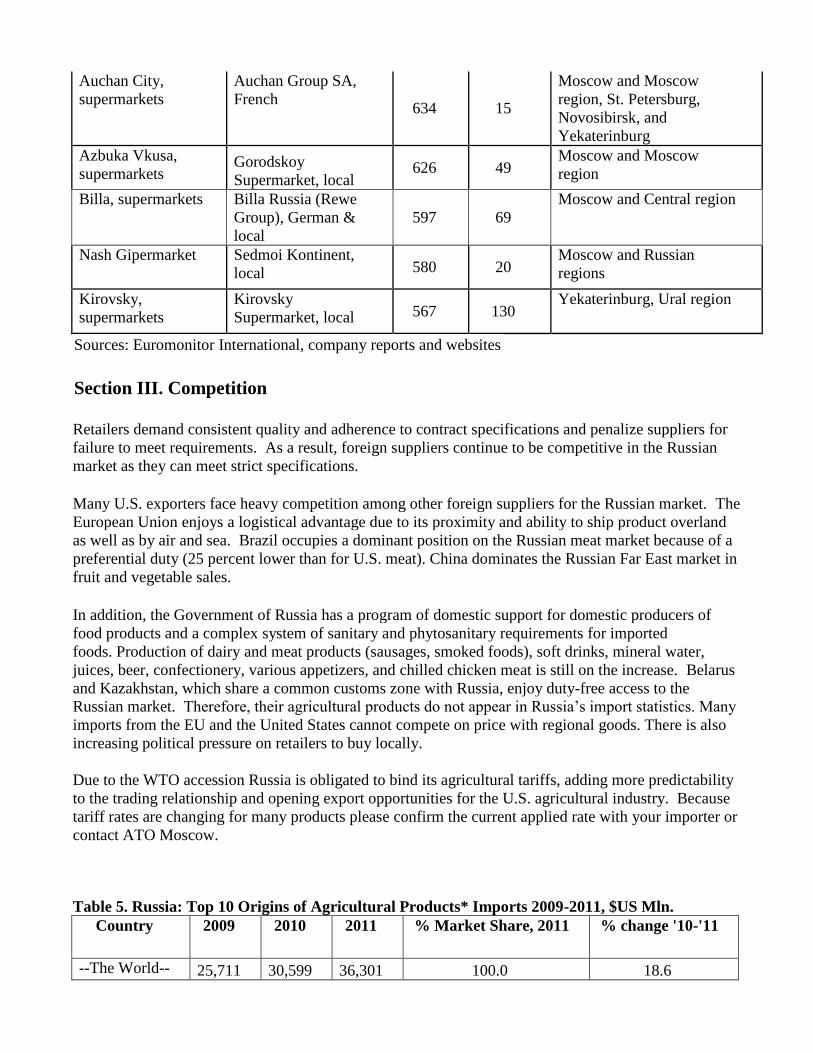
Section III. Competition
Retailers demand consistent quality and adherence to contract specifications and penalize suppliers for
failure to meet requirements. As a result, foreign suppliers continue to be competitive in the Russian
market as they can meet strict specifications.
Many U.S. exporters face heavy competition among other foreign suppliers for the Russian market. The
European Union enjoys a logistical advantage due to its proximity and ability to ship product overland
as well as by air and sea. Brazil occupies a dominant position on the Russian meat market because of a
preferential duty (25 percent lower than for U.S. meat). China dominates the Russian Far East market in
fruit and vegetable sales.
In addition, the Government of Russia has a program of domestic support for domestic producers of
food products and a complex system of sanitary and phytosanitary requirements for imported
foods. Production of dairy and meat products (sausages, smoked foods), soft drinks, mineral water,
juices, beer, confectionery, various appetizers, and chilled chicken meat is still on the increase. Belarus
and Kazakhstan, which share a common customs zone with Russia, enjoy duty-free access to the
Russian market. Therefore, their agricultural products do not appear in Russia’s import statistics. Many
imports from the EU and the United States cannot compete on price with regional goods. There is also
increasing political pressure on retailers to buy locally.
Due to the WTO accession Russia is obligated to bind its agricultural tariffs, adding more predictability
to the trading relationship and opening export opportunities for the U.S. agricultural industry. Because
tariff rates are changing for many products please confirm the current applied rate with your importer or
contact ATO Moscow.
Table 5. Russia: Top 10 Origins of Agricultural Products* Imports 2009-2011, $US Mln.
Country 2009 2010 2011 % Market Share, 2011 % change '10-'11
--The World-- 25,711 30,599 36,301 100.0 18.6
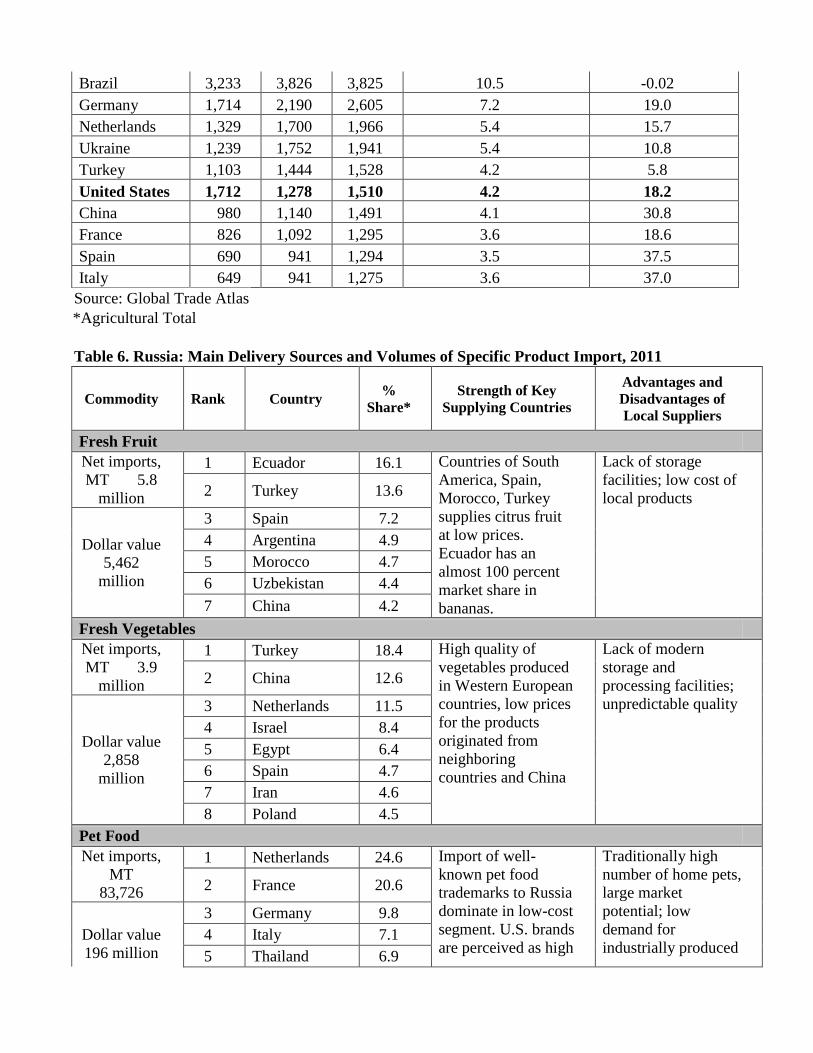
Brazil 3,233 3,826 3,825 10.5 -0.02
Germany 1,714 2,190 2,605 7.2 19.0
Netherlands 1,329 1,700 1,966 5.4 15.7
Ukraine 1,239 1,752 1,941 5.4 10.8
Turkey 1,103 1,444 1,528 4.2 5.8
United States 1,712 1,278 1,510 4.2 18.2
China 980 1,140 1,491 4.1 30.8
France 826 1,092 1,295 3.6 18.6
Spain 690 941 1,294 3.5 37.5
Italy 649 941 1,275 3.6 37.0
Source: Global Trade Atlas
*Agricultural Total
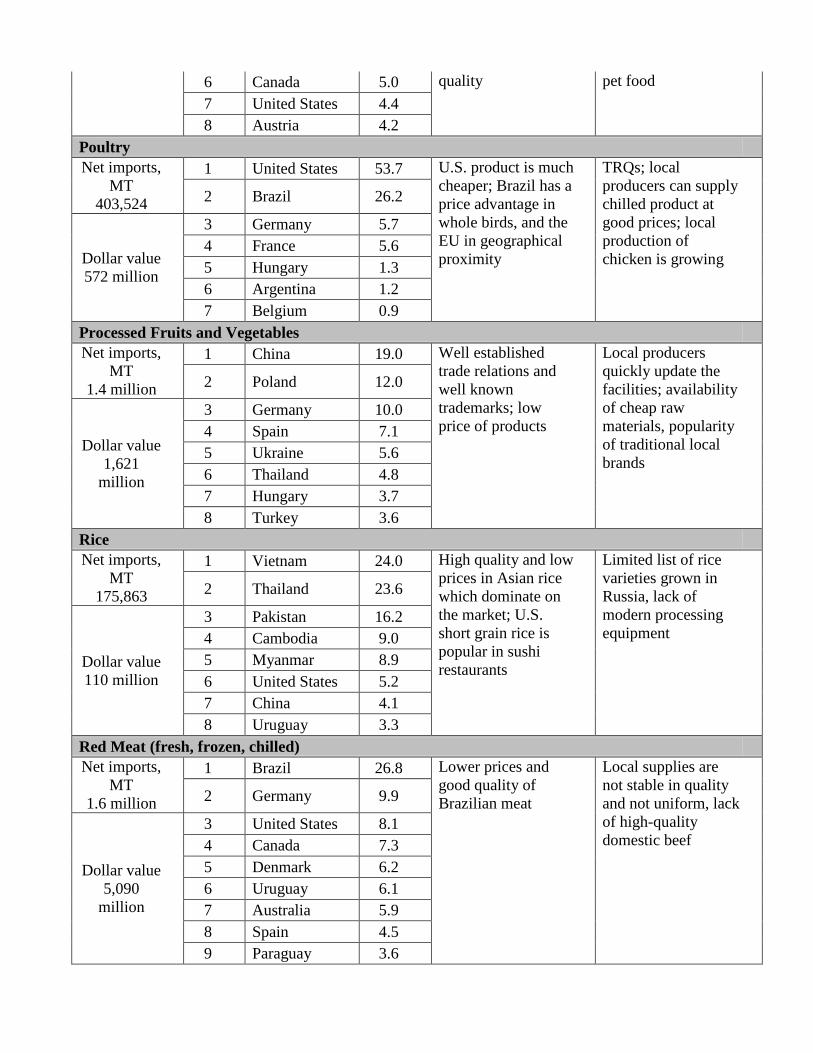
Table 6. Russia: Main Delivery Sources and Volumes of Specific Product Import, 2011
Commodity Rank Country %
Share*
Strength of Key
Supplying Countries
Advantages and
Disadvantages of
Local Suppliers
Fresh Fruit
Net imports,
MT 5.8
million
1 Ecuador 16.1 Countries of South
America, Spain,
Morocco, Turkey
supplies citrus fruit
at low prices.
Ecuador has an
almost 100 percent
market share in
bananas.
Lack of storage
facilities; low cost of
local products 2 Turkey 13.6
Dollar value
5,462
million
3 Spain 7.2
4 Argentina 4.9
5 Morocco 4.7
6 Uzbekistan 4.4
7 China 4.2
Fresh Vegetables
Net imports,
MT 3.9
million
1 Turkey 18.4 High quality of
vegetables produced
in Western European
countries, low prices
for the products
originated from
neighboring
countries and China
Lack of modern
storage and
processing facilities;
unpredictable quality
2 China 12.6
Dollar value
2,858
million
3 Netherlands 11.5
4 Israel 8.4
5 Egypt 6.4
6 Spain 4.7
7 Iran 4.6
8 Poland 4.5
Pet Food
Net imports,
MT
83,726
1 Netherlands 24.6 Import of well-
known pet food
trademarks to Russia
dominate in low-cost
segment. U.S. brands
are perceived as high
Traditionally high
number of home pets,
large market
potential; low
demand for
industrially produced
2 France 20.6
Dollar value
196 million
3 Germany 9.8
4 Italy 7.1
5 Thailand 6.9
6 Canada 5.0 quality pet food
7 United States 4.4
8 Austria 4.2
Poultry
Net imports,
MT
403,524
1 United States 53.7 U.S. product is much
cheaper; Brazil has a
price advantage in
whole birds, and the
EU in geographical
proximity
TRQs; local
producers can supply
chilled product at
good prices; local
production of
chicken is growing
2 Brazil 26.2
Dollar value
572 million
3 Germany 5.7
4 France 5.6
5 Hungary 1.3
6 Argentina 1.2
7 Belgium 0.9
Processed Fruits and Vegetables
Net imports,
MT
1.4 million
1 China 19.0 Well established
trade relations and
well known
trademarks; low
price of products
Local producers
quickly update the
facilities; availability
of cheap raw
materials, popularity
of traditional local
brands
2 Poland 12.0
Dollar value
1,621
million
3 Germany 10.0
4 Spain 7.1
5 Ukraine 5.6
6 Thailand 4.8
7 Hungary 3.7
8 Turkey 3.6
Rice
Net imports,
MT
175,863
1 Vietnam 24.0 High quality and low
prices in Asian rice
which dominate on
the market; U.S.
short grain rice is
popular in sushi
restaurants
Limited list of rice
varieties grown in
Russia, lack of
modern processing
equipment
2 Thailand 23.6
Dollar value
110 million
3 Pakistan 16.2
4 Cambodia 9.0
5 Myanmar 8.9
6 United States 5.2
7 China 4.1
8 Uruguay 3.3
Red Meat (fresh, frozen, chilled)
Net imports,
MT
1.6 million
1 Brazil 26.8 Lower prices and
good quality of
Brazilian meat
Local supplies are
not stable in quality
and not uniform, lack
of high-quality
domestic beef
2 Germany 9.9
Dollar value
5,090
million
3 United States 8.1
4 Canada 7.3
5 Denmark 6.2
6 Uruguay 6.1
7 Australia 5.9
8 Spain 4.5
9 Paraguay 3.6
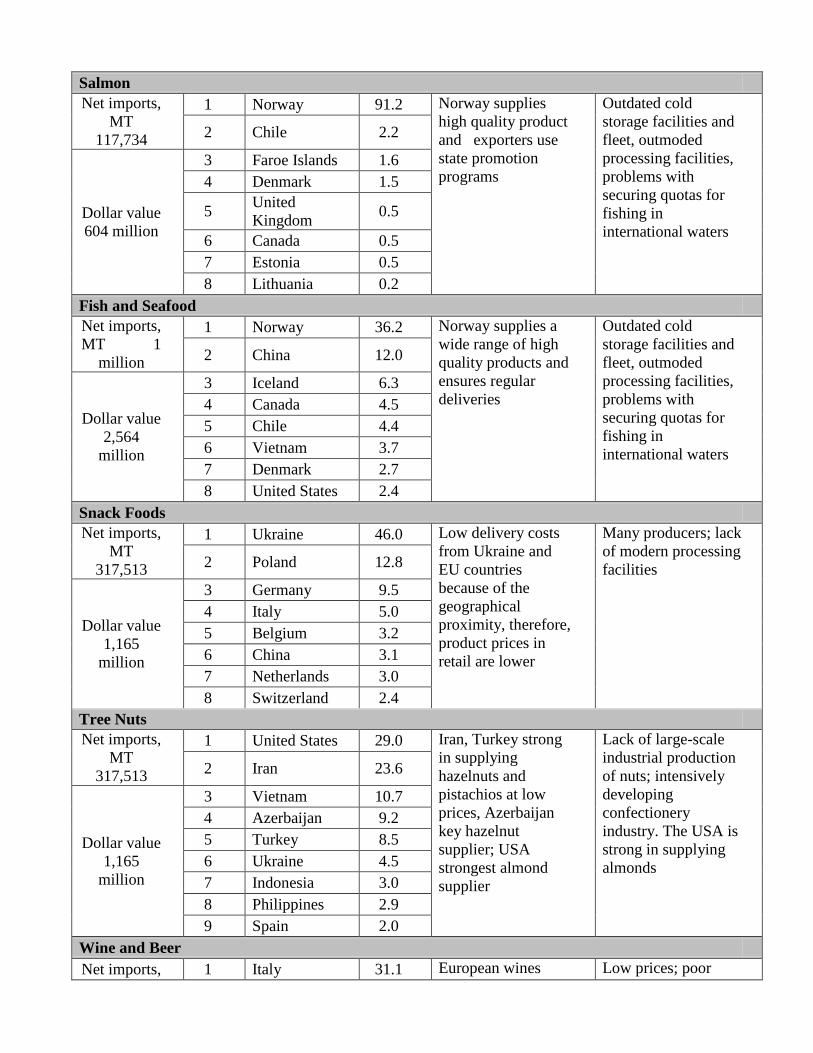
Salmon
Net imports,
MT
117,734
1 Norway 91.2 Norway supplies
high quality product
and exporters use
state promotion
programs
Outdated cold
storage facilities and
fleet, outmoded
processing facilities,
problems with
securing quotas for
fishing in
international waters
2 Chile 2.2
Dollar value
604 million
3 Faroe Islands 1.6
4 Denmark 1.5
5 United
Kingdom 0.5
6 Canada 0.5
7 Estonia 0.5
8 Lithuania 0.2
Fish and Seafood
Net imports,
MT 1
million
1 Norway 36.2 Norway supplies a
wide range of high
quality products and
ensures regular
deliveries
Outdated cold
storage facilities and
fleet, outmoded
processing facilities,
problems with
securing quotas for
fishing in
international waters
2 China 12.0
Dollar value
2,564
million
3 Iceland 6.3
4 Canada 4.5
5 Chile 4.4
6 Vietnam 3.7
7 Denmark 2.7
8 United States 2.4
Snack Foods
Net imports,
MT
317,513
1 Ukraine 46.0 Low delivery costs
from Ukraine and
EU countries
because of the
geographical
proximity, therefore,
product prices in
retail are lower
Many producers; lack
of modern processing
facilities 2 Poland 12.8
Dollar value
1,165
million
3 Germany 9.5
4 Italy 5.0
5 Belgium 3.2
6 China 3.1
7 Netherlands 3.0
8 Switzerland 2.4
Tree Nuts
Net imports,
MT
317,513
1 United States 29.0 Iran, Turkey strong
in supplying
hazelnuts and
pistachios at low
prices, Azerbaijan
key hazelnut
supplier; USA
strongest almond
supplier
Lack of large-scale
industrial production
of nuts; intensively
developing
confectionery
industry. The USA is
strong in supplying
almonds
2 Iran 23.6
Dollar value
1,165
million
3 Vietnam 10.7
4 Azerbaijan 9.2
5 Turkey 8.5
6 Ukraine 4.5
7 Indonesia 3.0
8 Philippines 2.9
9 Spain 2.0
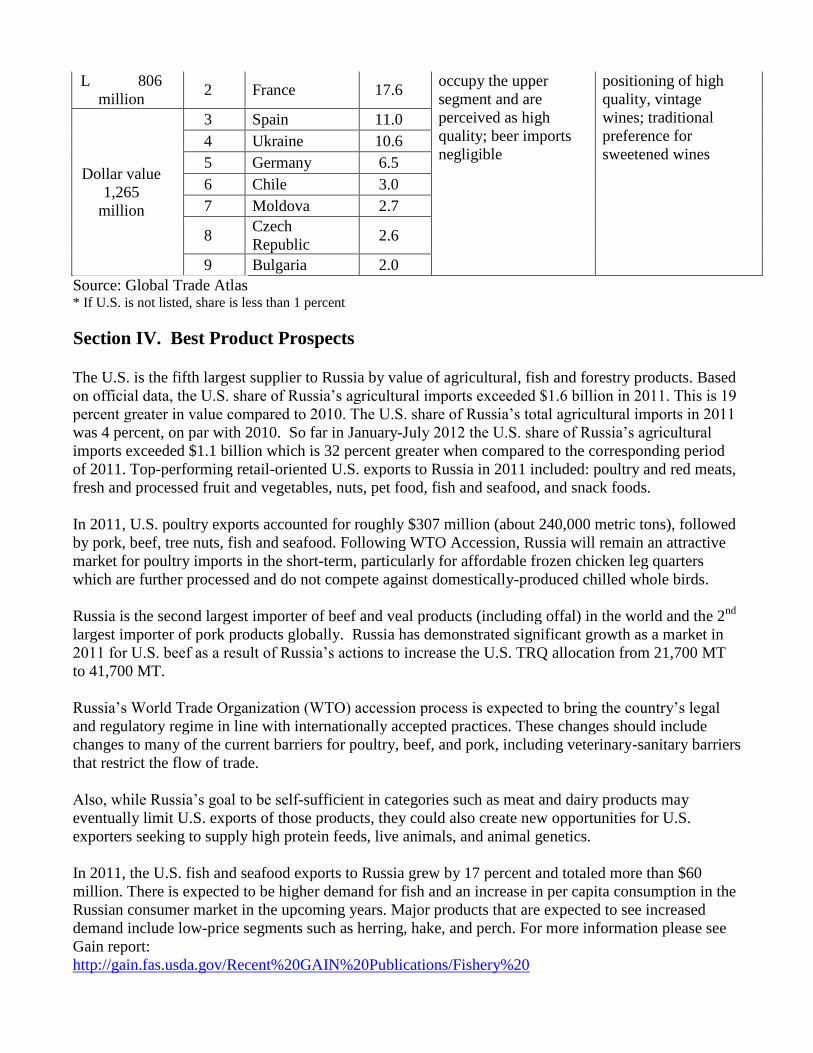
Wine and Beer
Net imports, 1 Italy 31.1 European wines Low prices; poor
L 806
million 2 France 17.6
occupy the upper
segment and are
perceived as high
quality; beer imports
negligible
positioning of high
quality, vintage
wines; traditional
preference for
sweetened wines
Dollar value
1,265
million
3 Spain 11.0
4 Ukraine 10.6
5 Germany 6.5
6 Chile 3.0
7 Moldova 2.7
8 Czech
Republic 2.6
9 Bulgaria 2.0
Source: Global Trade Atlas * If U.S. is not listed, share is less than 1 percent
Section IV. Best Product Prospects
The U.S. is the fifth largest supplier to Russia by value of agricultural, fish and forestry products. Based
on official data, the U.S. share of Russia’s agricultural imports exceeded $1.6 billion in 2011. This is 19
percent greater in value compared to 2010. The U.S. share of Russia’s total agricultural imports in 2011
was 4 percent, on par with 2010. So far in January-July 2012 the U.S. share of Russia’s agricultural
imports exceeded $1.1 billion which is 32 percent greater when compared to the corresponding period
of 2011. Top-performing retail-oriented U.S. exports to Russia in 2011 included: poultry and red meats,
fresh and processed fruit and vegetables, nuts, pet food, fish and seafood, and snack foods.
In 2011, U.S. poultry exports accounted for roughly $307 million (about 240,000 metric tons), followed
by pork, beef, tree nuts, fish and seafood. Following WTO Accession, Russia will remain an attractive
market for poultry imports in the short-term, particularly for affordable frozen chicken leg quarters
which are further processed and do not compete against domestically-produced chilled whole birds.
Russia is the second largest importer of beef and veal products (including offal) in the world and the 2nd
largest importer of pork products globally. Russia has demonstrated significant growth as a market in
2011 for U.S. beef as a result of Russia’s actions to increase the U.S. TRQ allocation from 21,700 MT
to 41,700 MT.
Russia’s World Trade Organization (WTO) accession process is expected to bring the country’s legal
and regulatory regime in line with internationally accepted practices. These changes should include
changes to many of the current barriers for poultry, beef, and pork, including veterinary-sanitary barriers
that restrict the flow of trade.
Also, while Russia’s goal to be self-sufficient in categories such as meat and dairy products may
eventually limit U.S. exports of those products, they could also create new opportunities for U.S.
exporters seeking to supply high protein feeds, live animals, and animal genetics.
In 2011, the U.S. fish and seafood exports to Russia grew by 17 percent and totaled more than $60
million. There is expected to be higher demand for fish and an increase in per capita consumption in the
Russian consumer market in the upcoming years. Major products that are expected to see increased
demand include low-price segments such as herring, hake, and perch. For more information please see
Gain report:
http://gain.fas.usda.gov/Recent%20GAIN%20Publications/Fishery%20
Sector%20Production%20and%20Trade%20Update_Moscow_Russian%20
Federation_7-27-2011.pdf
Russia’s pet food market is still developing and is very concentrated around big cities such as Moscow,
St. Petersburg and Yekaterinburg. Experts forecast continued growth and demand in the local pet food
market as household incomes increase and table-scrap feeding declines. According to the Pet Food
Institute (PFI), expansive advertising conducted by multinational companies has led to significant
changes in the perception of pet food as a product category. However, lack of information in less urban
areas on the benefits of commercially prepared pet food remains the biggest constraint for development
of the pet food market. For more information please see Gain report RS1117 Pet Food Market Brief:
http://gain.fas.usda.gov/Recent%20GAIN%20Publications/Pet%20Food%20Market%20Brief_Moscow
_Russian%20Federation_4-21-2011.pdf
In 2011, the United States exported 20,999 metric tons of tree nuts to Russia. The main driver of this
growth was the increase in California almond exports. California pistachios are also present in the
market but volumes fluctuate based on price competitiveness, particularly vis-a-vis Iranian pistachios.
Upon accession to the WTO, Russia will bind its tariffs on almonds, walnuts and pistachios to 5 percent,
which may provide for additional increases in U.S. exports. For more information on the Russian nuts
market please see Gain report RSATO1108:
http://gain.fas.usda.gov/Recent%20GAIN%20Publications/Russia%20Going%20
Nuts%20Over%20Almonds_St.%20Petersburg_Russian%20Federation_4-20-2011.pdf
Russia is the world’s third largest importer of fruit in value terms, and ranks as the number one market
for pears. In 2011, Russia imported 25,535 metric tons (MT) of U.S. fruit worth $32 million, an 85
percent increase in volume and 344 percent increase in value compared to 2005. In 2011, Russia was
the third largest export market for Northwest Pears globally. For more information on the Russian fruit
market please see Gain report:
http://gain.fas.usda.gov/Recent%20GAIN%20Publications/Fresh%20Deciduous
%20Fruit%20Annual_Moscow%20ATO_Russian%20Federation_10-26-2011.pdf
The most dynamic sales growth in the U.S. high-valued category over the past several years has been
for U.S. products such as jams and fruit jellies, tomato ketchup and other tomato sauces, frozen
potatoes, prunes, alcoholic and nonalcoholic beverages (excl. fruit and veg. juices), fresh grapes, and ice
cream. This reflects larger trends toward more convenience (prepared jam versus home-made) and more
diversified diets as well as greater disposable income of some consumers.
Given the potential of the Russian agricultural market, U.S. high value products can penetrate some
niche markets, especially for those products which are not produced in Russia or are produced in limited
quantities. In many cases, Russian processors are not yet producing products of consistently high quality
(e.g. high quality beef steaks). There are markets for baby food or for specialty “niche” products
including low-fat, low-salt and sugar-free products, cake and bread mixes, corn meal, and chocolate
chips. U.S. exporters could also supply new market segments that are just beginning to develop. This
includes organics, microwaveable and semi-prepared food as well as frozen dinners. Potential importers
must be aware that promotion of innovative or new to market products can be expensive.
For more information on market opportunities for the U.S. products in Russia please see
http://gain.fas.usda.gov/Recent%20GAIN%20Publications/Market%20Opportunities%
20for%20Key%20U.S.%20Products%20in%20Russia_Moscow_Russian%20Federation
_3-20-2012.pdf
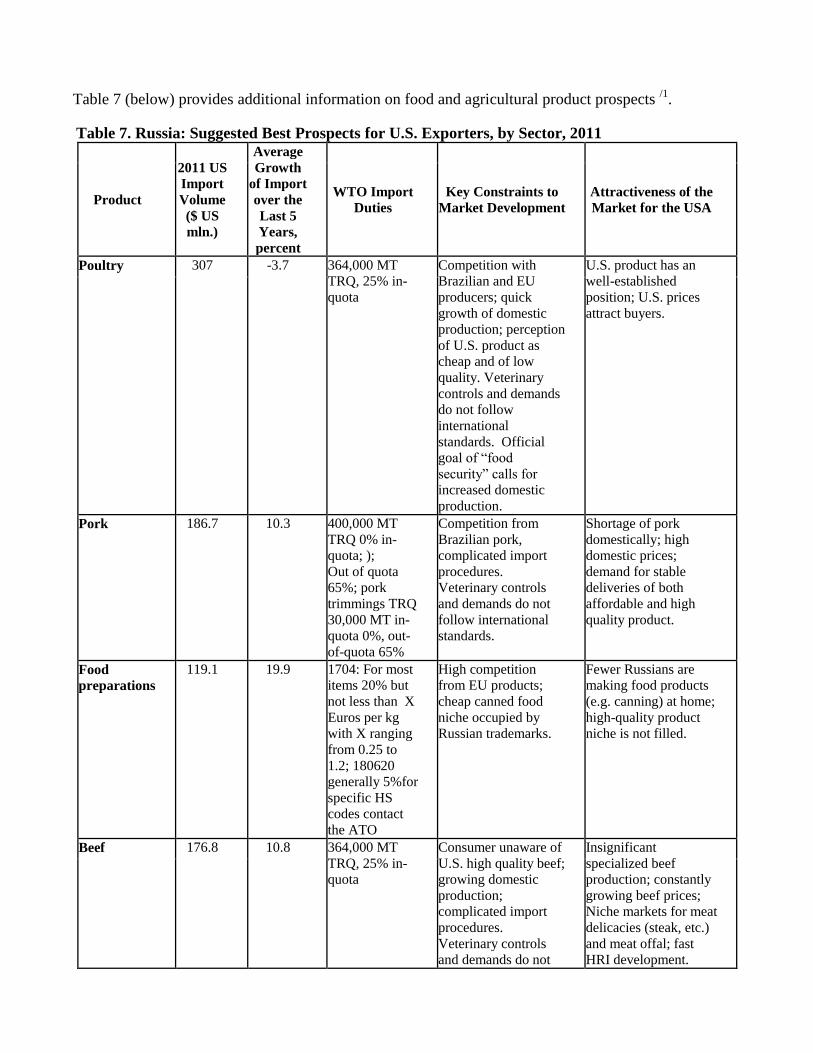
Table 7 (below) provides additional information on food and agricultural product prospects /1
.
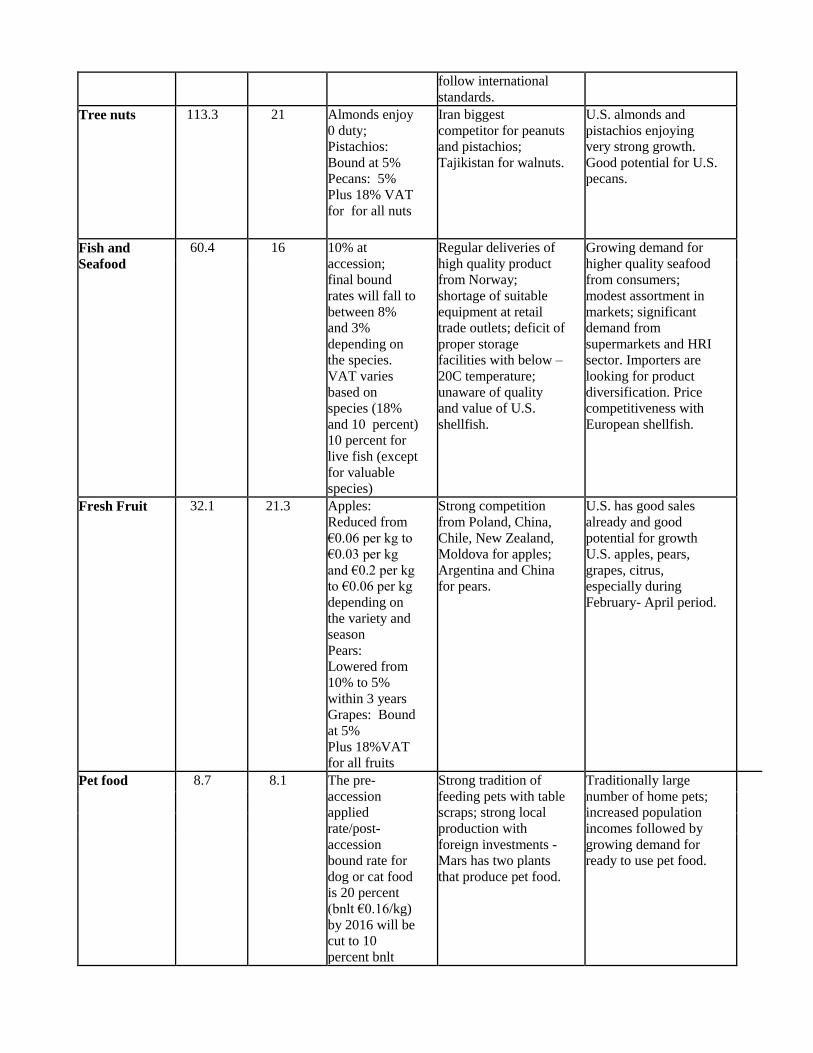
Table 7. Russia: Suggested Best Prospects for U.S. Exporters, by Sector, 2011
Product
2011 US
Import
Volume
($ US
mln.)
Average
Growth
of Import
over the
Last 5
Years,
percent
WTO Import
Duties Key Constraints to
Market Development Attractiveness of the
Market for the USA
Poultry 307 -3.7 364,000 MT
TRQ, 25% in-
quota
Competition with
Brazilian and EU
producers; quick
growth of domestic
production; perception
of U.S. product as
cheap and of low
quality. Veterinary
controls and demands
do not follow
international
standards. Official
goal of “food
security” calls for
increased domestic
production.
U.S. product has an
well-established
position; U.S. prices
attract buyers.
Pork 186.7 10.3 400,000 MT
TRQ 0% in-
quota; );
Out of quota
65%; pork
trimmings TRQ
30,000 MT in-
quota 0%, out-
of-quota 65%
Competition from
Brazilian pork,
complicated import
procedures.
Veterinary controls
and demands do not
follow international
standards.
Shortage of pork
domestically; high
domestic prices;
demand for stable
deliveries of both
affordable and high
quality product.
Food
preparations 119.1 19.9 1704: For most
items 20% but
not less than X
Euros per kg
with X ranging
from 0.25 to
1.2; 180620
generally 5%for
specific HS
codes contact
the ATO
High competition
from EU products;
cheap canned food
niche occupied by
Russian trademarks.
Fewer Russians are
making food products
(e.g. canning) at home;
high-quality product
niche is not filled.
Beef 176.8 10.8 364,000 MT
TRQ, 25% in-
quota
Consumer unaware of
U.S. high quality beef;
growing domestic
production;
complicated import
procedures.
Veterinary controls
and demands do not
Insignificant
specialized beef
production; constantly
growing beef prices;
Niche markets for meat
delicacies (steak, etc.)
and meat offal; fast
HRI development.
follow international
standards. Tree nuts 113.3 21 Almonds enjoy
0 duty;
Pistachios:
Bound at 5%
Pecans: 5%
Plus 18% VAT
for for all nuts
Iran biggest
competitor for peanuts
and pistachios;
Tajikistan for walnuts.
U.S. almonds and
pistachios enjoying
very strong growth.
Good potential for U.S.
pecans.
Fish and
Seafood 60.4 16 10% at
accession;
final bound
rates will fall to
between 8%
and 3%
depending on
the species.
VAT varies
based on
species (18%
and 10 percent)
10 percent for
live fish (except
for valuable
species)
Regular deliveries of
high quality product
from Norway;
shortage of suitable
equipment at retail
trade outlets; deficit of
proper storage
facilities with below –
20C temperature;
unaware of quality
and value of U.S.
shellfish.
Growing demand for
higher quality seafood
from consumers;
modest assortment in
markets; significant
demand from
supermarkets and HRI
sector. Importers are
looking for product
diversification. Price
competitiveness with
European shellfish.
Fresh Fruit 32.1 21.3 Apples:
Reduced from
€0.06 per kg to
€0.03 per kg
and €0.2 per kg
to €0.06 per kg
depending on
the variety and
season
Pears:
Lowered from
10% to 5%
within 3 years
Grapes: Bound
at 5%
Plus 18%VAT
for all fruits
Strong competition
from Poland, China,
Chile, New Zealand,
Moldova for apples;
Argentina and China
for pears.
U.S. has good sales
already and good
potential for growth
U.S. apples, pears,
grapes, citrus,
especially during
February- April period.
Pet food 8.7 8.1 The pre-
accession
applied
rate/post-
accession
bound rate for
dog or cat food
is 20 percent
(bnlt €0.16/kg)
by 2016 will be
cut to 10
percent bnlt
Strong tradition of
feeding pets with table
scraps; strong local
production with
foreign investments -
Mars has two plants
that produce pet food.
Traditionally large
number of home pets;
increased population
incomes followed by
growing demand for
ready to use pet food.
€0.08/kg. +18
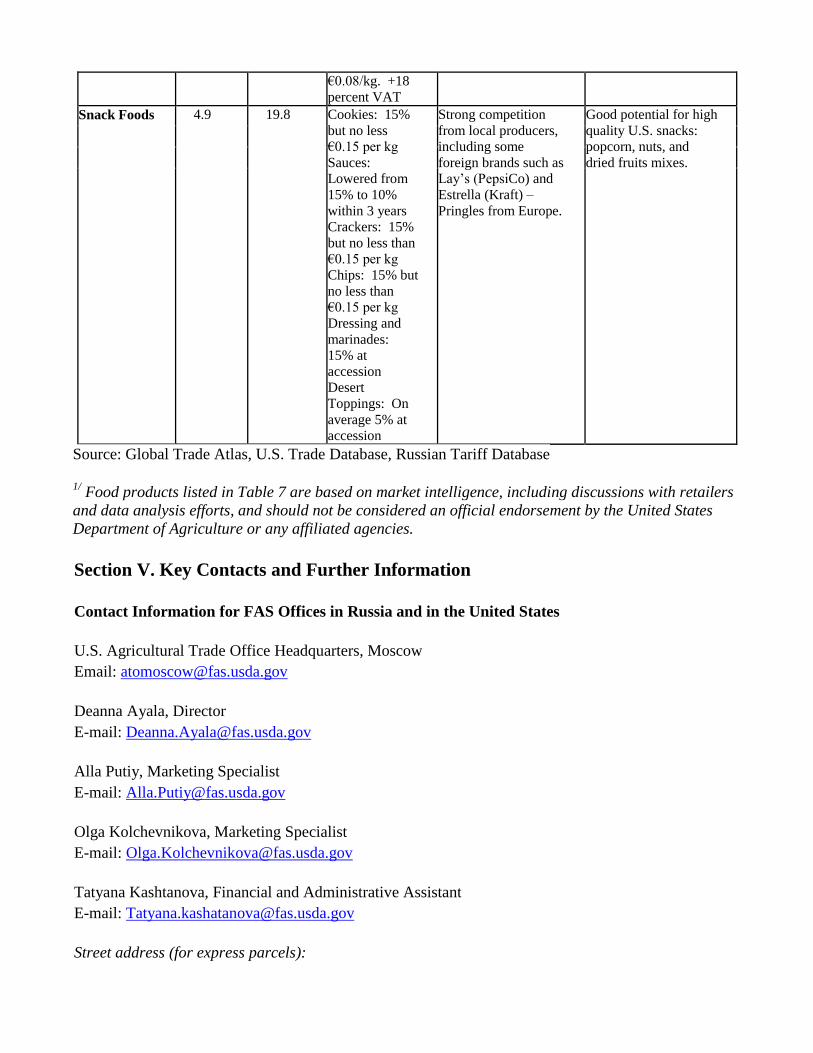
percent VAT Snack Foods 4.9 19.8 Cookies: 15%
but no less
€0.15 per kg
Sauces:
Lowered from
15% to 10%
within 3 years
Crackers: 15%
but no less than
€0.15 per kg
Chips: 15% but
no less than
€0.15 per kg
Dressing and
marinades:
15% at
accession
Desert
Toppings: On
average 5% at
accession
Strong competition
from local producers,
including some
foreign brands such as
Lay’s (PepsiCo) and
Estrella (Kraft) –
Pringles from Europe.
Good potential for high
quality U.S. snacks:
popcorn, nuts, and
dried fruits mixes.
Source: Global Trade Atlas, U.S. Trade Database, Russian Tariff Database
1/
Food products listed in Table 7 are based on market intelligence, including discussions with retailers
and data analysis efforts, and should not be considered an official endorsement by the United States
Department of Agriculture or any affiliated agencies.
Section V. Key Contacts and Further Information
Contact Information for FAS Offices in Russia and in the United States
U.S. Agricultural Trade Office Headquarters, Moscow
Email: [email protected]
Deanna Ayala, Director
E-mail: [email protected]
Alla Putiy, Marketing Specialist
E-mail: [email protected]
Olga Kolchevnikova, Marketing Specialist
E-mail: [email protected]
Tatyana Kashtanova, Financial and Administrative Assistant
E-mail: [email protected]
Street address (for express parcels):
U.S. Agricultural Trade Office
American Embassy
Bolshoy Devyatinskiy pereulok, 8
121099 Moscow, Russia
Fax: 7 (495) 728-5069
Tel: 7 (495) 728-5560
http://www.usda.ru
For mail coming from the U.S. (delivery may take 4 to 6 weeks):
Director, Agricultural Trade Office
5430 Moscow Place
Washington, DC 20521-5430
For international mail, especially from Europe:
Agricultural Trade Office
U.S. Embassy - Box M
Itainen Puistotie 14
00140 Helsinki, Finland
Covering Northwest Russia (St. Petersburg):
Svetlana Ilyina, ATO Marketing Specialist
American Consulate General
Furshtatskaya Street 15
191028, St. Petersburg, Russia
Fax: 7 (812) 331-2675
Tel: 7 (812) 331-2880
E-mail: [email protected]
Covering the Russian Far East (Vladivostok):
American Consulate General
Ulitsa Pushkinskaya, 32
690001 Vladivostok, Russia
Fax: 7 (423) 230-00-89
Tel: 7 (423) 230-00-89
For General Information on FAS/USDA Market Promotion Programs and Activities:
Office of Trade Programs
U.S. Department of Agriculture
Foreign Agricultural Service
1400 Independence Ave., S.W.
Washington, DC 20250
http://www.fas.usda.gov/OTP_contacts.asp
FAS Website: www.fas.usda.gov
For Trade Policy/Market Access Issues, General Information on the Russian Agricultural Sector, etc:
Holly Higgins, Agricultural Minister-Counselor
Levin Flake, Senior Agricultural Attaché
Chris Riker, Agricultural Attaché
Office of Agricultural Affairs
American Embassy
(address same as above for ATO Moscow)
Fax: 7 (495) 728-5133 or 728-5102
Tel: 7 (495) 728-5222
E-mail: [email protected]
Other Useful Contacts
The Agricultural Trade office works with a large number of U.S. industry organizations, several of
which are resident in Russia. These cooperators share the view that Russia is a promising market for
food products.
California Prune Board
Suite 18, Harborough Innovation Centre, Airfield Business Park
Leicester Road, Market Harborough
Leicestershire, LE16 7QX, UK
Tel.: + 44 (0) 1858 414218
Fax : + 44 (0) 1858 898123
Email: [email protected]
www.californiaprunes.ru
USA Poultry and Egg Export Council (USAPEEC)
Albert Davleev
Address: 127051 Moscow, Russia, Kulakova str., 20, Building 1A
PO Box 305
Fax: 7 (495) 781-9200
Tel.: 7 (495) 781-9201
E-mail: [email protected]
http://www.usapeec.ru
U.S. Meat Export Federation (USMEF)
Galina Kochubeyeva (Moscow)
Address: 119049 Moscow, Russia, Leninsky Prospekt, 2, 9th Floor, Business Center
Fax: 7 (495) 230-6849
Tel.: 7 (495) 544-9387
E-mail: [email protected], [email protected]
Yuriy Barutkin (St. Petersburg)
Address: 190031 St. Petersburg, Russia, Yefimova str., 4a, office 303
Fax: 7 (812) 309-71102
Tel.: 7 (812) 309-1101
E-mail: [email protected]
Pear Bureau Northwest
Katerina Akulenko
Address: 690090 Vladivostok, Russia, Svetlanskaya str., 37, Office 2
Fax: 7 (4232) 63-8411
Tel.: 7 (4232) 56-5536
E-mail: [email protected]
http://www.usapears.ru
Ksenia Gorovaya (St. Petersburg)
Address: 194223, St. Petersburg, Russia, Orbeli str., 25/3, office 7
Tel: 7 (812) 702-7151
E-mail: [email protected]
http://crispconsulting.ru/
Almond Board of California
RK Marketing Office,
29/1 Generala Tyuleneva Str., 117465, Moscow, Russia
Tel: 7 (495) 729-3080
Fax: 7 (495) 989-2670
E-mail: [email protected]
http://www.Almonds.ru
Washington Apple Commission
Ksenia Gorovaya (St. Petersburg)
Address: 194223, St. Petersburg, Russia, Orbeli str., 25/3, office 7
Tel: 7 (812) 702-7151
E-mail: [email protected]
www.bestapples.ru
Katerina Akulenko (Vladivostok)
Address: 690090 Vladivostok, Russia, Svetlanskaya str., 37, Office 2
Fax: 7 (4232) 63-8411
Tel.: 7 (4232) 56-5536
E-mail: [email protected]
California Table Grape Commission
Ksenia Gorovaya (St. Petersburg)
Address: 194223, St. Petersburg, Russia, Orbeli str., 25/3, office 7
Tel: 7 (812) 702-7151
E-mail: [email protected]
http://crispconsulting.ru/
Katerina Akulenko (Vladivostok)
Address: 690090 Vladivostok, Russia, Svetlanskaya str., 37, Office 2
Fax: 7 (4232) 63-8411
Tel.: 7 (4232) 56-5536
E-mail: [email protected]
Wine Institute of California
Olga Tuzmukhamedova
Address: 127521 Moscow, Russia, Staromarinskoe shosse, 14-77
Tel: 7 (495) 616-3829
E-mail: [email protected]
www.california-wines.org
www.wineinstitute.org
The American Chamber of Commerce is another good source for information on doing business in
Russia. The Chamber has offices in Moscow and St. Petersburg.
American Chamber of Commerce in Russia (AmCham)
Ul. Dolgorukovskaya, Building 7, 14th floor
127006 Moscow, Russia
Fax: 7 (495) 961-2142
Tel: 7 (495) 961-2141
Email: [email protected]
http://amcham.ru/
American Chamber of Commerce in St. Petersburg
Ulitsa Yakubovicha 24, left wing, 3rd
Floor
190000 St. Petersburg, Russia
Fax: 7 (812) 448-1645
Tel: 7 (812) 448-1646
Email: [email protected]
http://amcham.ru/spb/
The U.S Commercial Service has offices in Moscow, St. Petersburg, and Vladivostok. For questions
regarding agricultural machinery, food processing and packaging equipment or materials, refrigeration
equipment, and other industrial products, please contact:
U.S. Commercial Service
Bolshoy Devyatinskiy pereulok, 8
121099 Moscow, Russia
Fax: 7 (495) 728-5585
Tel: 7 (495) 728-5580
E-mail: [email protected]
http://www.buyusa.gov/russia/en/
Other Relevant Reports
Attaché reports on the Russian food and agricultural market are available on the FAS
Website; the search engine can be found at
http://www.fas.usda.gov/scriptsw/AttacheRep/default.asp
RSATO1204 Exporter Guide / Annual
http://gain.fas.usda.gov/Recent%20GAIN%20Publications/Exporter%
20Guide_Moscow%20ATO_Russian%20Federation_7-6-2012.pdf
RS1168 Food and Agricultural Import Regulations and Standards
http://gain.fas.usda.gov/Recent%20GAIN%20Publications/Food%20and%
20Agricultural%20Import%20Regulations%20and%20Standards%20-
%20Narrative_Moscow_Russian%20Federation_1-17-2012.pdf
RS1167 Food and Agricultural Import Regulations and Standards – Certification
http://gain.fas.usda.gov/Recent%20GAIN%20Publications/Food%20and%20
Agricultural%20Import%20Regulations%20and%20Standards%20-
%20Certification_Moscow_Russian%20Federation_1-17-2012.pdf
RS1215 Market Opportunities for Key U.S. Products in Russia
http://gain.fas.usda.gov/Recent%20GAIN%20Publications/Market%20Opportunities
%20for%20Key%20U.S.%20Products%20in%20Russia_Moscow_Russian%
20Federation_3-20-2012.pdf
RSATO1002 Trade Law Report
http://gain.fas.usda.gov/Recent%20GAIN%20Publications/The%20Russian%20Federal%
20Law%20on%20Trade%20_Moscow%20ATO_Russian%20Federation_8-30-2010.pdf
RSATO1208 Customs Union Technical Regulations on Food Products Labeling
http://gain.fas.usda.gov/Recent%20GAIN%20Publications/Customs%20Union%20
Technical%20Regulations%20on%20Food%20Products%20Labeling_Moscow%20
ATO_Russian%20Federation_7-18-2012.pdf
RSATO1205 Russian Duma Revises Wine Definitions and Other Alcohol Rules
http://gain.fas.usda.gov/Recent%20GAIN%20Publications/Russian%20Duma%20
Revises%20Wine%20Definitions%20and%20Other%20Alcohol%20Rules_Moscow
%20ATO_Russian%20Federation_7-13-2012.pdf
RSATO 1205 Strategy of the Russian Food Industry Development until 2020
http://gain.fas.usda.gov/Recent%20GAIN%20Publications/Strategy%20of%20the%
20Russian%20Food%20Industry%20Development%20until%202020_Vladivostok
_Russian%20Federation_6-7-2012.pdf
RS 1247 Fish and Seafood Trade Update
http://gain.fas.usda.gov/Recent%20GAIN%20Publications/Fish%20and%20Seafood%
20Production%20and%20Trade%20Update_Moscow_Russian%20Federation_
7-24-2012.pdf
RS 1251 Poultry and Products Annual
http://gain.fas.usda.gov/Recent%20GAIN%20Publications/Poultry%20and
%20Products%20Annual_Moscow_Russian%20Federation_8-23-2012.pdf
RSATO1107 Russian Food Processing Sector
http://gain.fas.usda.gov/Recent%20GAIN%20Publications/Food%20Processing
%20Ingredients_Moscow%20ATO_Russian%20Federation_12-21-2010.pdf
RSATO1102 Russian HRI Sector
http://gain.fas.usda.gov/Recent%20GAIN%20Publications/Food%20Service%20-
%20Hotel%20Restaurant%20Institutional_Moscow%20ATO_
Russian%20Federation_3-3-2011.pdf
RSATO1109 Russian Organic Market
http://gain.fas.usda.gov/Recent%20GAIN%20Publications/Russian%20Organic%20
Market%20Taking%20Root_Moscow%20ATO_Russian%20Federation_4-27-2011.pdf
RS 1144 Livestock and Products Annual
http://gain.fas.usda.gov/Recent%20GAIN%20Publications/Livestock%20and%20Products
%20Annual_Moscow_Russian%20Federation_9-15-2011.pdf
RS 1146 Dairy and Products Annual
http://gain.fas.usda.gov/Recent%20GAIN%20Publications/Dairy%20and%20Products
%20Annual_Moscow_Russian%20Federation_10-20-2011.pdf
RS1117 Pet Food Market Brief
http://gain.fas.usda.gov/Recent%20GAIN%20Publications/Pet%20Food%20Market%20Brief_
Moscow_Russian%20Federation_4-21-2011.pdf
RS 1015 Declaration of Conformity Replaces Certification for Many Products
http://gain.fas.usda.gov/Recent%20GAIN%20Publications/Declaration%20of%20Confor
mity%20Replaces%20Certification%20for%20Many%20Products_Moscow_Russian%2
0Federation_3-22-2010.pdf