peru in the mining equipment global value chain · 1 peru in the mining equipment global value...
TRANSCRIPT

1
Peru in the Mining Equipment Global Value Chain OPPORTUNITIES FOR UPGRADING
Penny Bamber, Karina Fernandez-Stark and Gary Gereffi
Contributing Researchers: Stacey Frederick and Edgardo Sara
January 2016
Report commissioned by the World Bank

2
This research was prepared on behalf of the World Bank. The report is based on both primary and secondary information sources. In addition to interviews with firms operating in the sector and supporting institutions, the report draws on secondary research and information sources, including Peruvian organizations such as Superintendencia Nacional de Aduanas y de Administración Tributaria del Perú. The project report will be available at www.cggc.duke.edu.
Acknowledgements
Duke CGGC would like to thank all of the interviewees, who gave generously of their time and expertise. Duke CGGC would also like to thank Thomas Farole and Ekaterina Vostroknutova for their feedback on earlier drafts.
Duke University, Center on Globalization, Governance and Competitiveness (Duke CGGC)
The Duke Center on Globalization, Governance & Competitiveness (Duke CGGC) undertakes client-sponsored research that addresses economic and social development issues for governments, foundations and international organizations. We do this principally by utilizing the global value chain (GVC) framework, created by Founding Director Gary Gereffi, and supplemented by other analytical tools. As a university-based research center, we address clients’ real world questions with transparency and rigor.
www.cggc.duke.edu Center on Globalization, Governance & Competitiveness, Duke University © January 2016

3
Table of Contents Acronyms ............................................................................................................................ 5 1. Introduction .................................................................................................................. 6 2. The Global Mining Equipment Industry ...................................................................... 8
2.1 Introduction ............................................................................................................ 8 2.2 The Mining Equipment Global Value Chain ....................................................... 11 2.3 Global Demand and Supply in the Mining Equipment GVC .............................. 14 2.4 Governance, Lead Firms and Standards .............................................................. 18 2.5 Upgrading Trajectories ........................................................................................ 23
3. Peru and the Mining Equipment Global Value Chain ............................................... 27 3.1 Peru’s Current Participation in the Mining Equipment GVC .............................. 30 3.2 Upgrading Analysis in Peru’s Mining Equipment GVC ..................................... 33 3.3 Mining Equipment Industry Institutionalization in Peru: Local Context for GVC Participation .................................................................................................................. 38
3.3.1 Advantages and Constraints for the Mining Equipment Industry in Peru .... 41 4. Potential Upgrading Trajectories for the Mining Equipment Sector in Peru ............. 45
4.1 Upgrading Trajectories ........................................................................................ 45 5. Bibliography .............................................................................................................. 48 6. Appendices ................................................................................................................. 52
6.1 Appendix A. Product Categories ......................................................................... 52 6.2 Appendix B. Lead Firms in Engineering Services .............................................. 55 6.3 Appendix C. Peru Product Exports and Raw Material Imports ........................... 56
List of Tables Table 1. Global Exports of Mining Equipment, 2003-2013 ............................................. 14 Table 2. Top Five Mining Underground & Surface Final Equipment (SUM) World
Exporters by Value, by Year, 2003-2013 ................................................................. 15 Table 3. Top Five Mineral Processing General Final Equipment World Exporters by
Value, by Year, 2003-2013 ....................................................................................... 15 Table 4. Top Five Materials Handling Final Equipment World Exporters by Value, by
Year, 2003-2013 ....................................................................................................... 15 Table 5. Top 10 Importers, All Mining Equipment, by Value, by Year, 2003-2013 ....... 17 Table 6. Key Actors in the Mining Equipment Global Value Chain ................................ 19 Table 7. Select Lead OEM Firms, By Principal Product Category .................................. 21 Table 8. Select Standards in the Mining Equipment Sector .............................................. 23 Table 9. Select Upgrading Trajectories for the Mining Equipment GVC ........................ 23 Table 10. Peru's Metal Mechanics Exports by Product Category & Supply Chain Stage,
by Value, 2003-2013 ................................................................................................. 30 Table 11. Peru's Top Five Mining Surface and Underground (MUS) Intermediate & Final
Equipment Export Destinations, by Value, by Year, 2003-2013 ............................. 37 Table 12. Peru's Top Five Mineral Processing General (MPG) Intermediate & Final
Equipment Export Destinations, by Value, by Year, 2003-2013 ............................. 37 Table 13. Primary Stakeholders in the Mining Equipment GVC in Peru ......................... 39 Table 14. Summary of Key Advantages and Constraints for Industry Upgrading ........... 41 Table 15. Recommended Upgrading Trajectories ............................................................ 46 Table 16. Surface and Underground Mining Equipment .................................................. 52 Table 17. Mineral Processing Equipment ......................................................................... 53 Table 18. Materials Handling Equipment ......................................................................... 53 Table 19. Wear Parts ......................................................................................................... 53 Table 20. Engineering Lead Firms (Origin, Revenue, Ownership/HQ Location, Market
Share) ........................................................................................................................ 55 Table 21. Top Ten Imported Raw Materials of Leading Exporters in Peru, 2012 ........... 56

4
Table 22. Peru's Mining Equipment Exports, By Product 2003-2013 ............................. 56
List of Figures Figure 1. Mining Capital Equipment Global Value Chain ............................................... 12 Figure 2. Exports in the Mining Equipment Global Value Chain, Select Countries 2003-
2013 .......................................................................................................................... 16 Figure 3. Evolution of Regional Demand for Mining Equipment, 2003-2013 ................. 18 Figure 4. Peru’s Copper, Zinc, Gold and Silver Production, 1990-2014 .......................... 29 Figure 5. Peru's Participation in the Mining Equipment Global Value Chain .................. 31 Figure 6. Peru’s Mining Equipment Value Chain Exports, By Product Category 2003-
2013 .......................................................................................................................... 34 Figure 7. Industrial Electricity Prices, Select Countries 2013 .......................................... 42 Figure 8. Number of Mining Equipment Exporters in Peru (Exports > US$50,000), 2000-
2012 .......................................................................................................................... 57
List of Boxes Box 1. The Emergence of Remanufacturing ..................................................................... 13 Box 2. A Brief Overview of Peru's Mining Sector ........................................................... 28 Box 3. Steel Recycling in Peru ......................................................................................... 32 Box 4. Resemin: A Peruvian OEM Upgrading Story ....................................................... 35 Box 5. Incentivizing R&D in Mining Equipment GVC in Peru ....................................... 43

5
Acronyms ACFR The Australian Centre for Field Robotics
ADEX Export Association (Asociación de Exportadores)
AEMPE Association of Private Metalmechanics Firms of Peru (Asociación de Empresas Privadas Metalmecánicas de Perú)
CAGR Compound Annual Growth Rate
CDI Industrial Development Center (Centro de Desarrollo Industrial-SNI)
CNC Computer Numerical Control
CONCYTEC National Council for Science, Technology and Technological Innovation (Consejo Nacional de Ciencia, Tecnología e Innovación Tecnológica)
CSIRO Australian Commonwealth Scientific and Industrial Research Organisation
E&MJ Engineering and Mining Journal
EHS Environment, health and safety
EPC Engineering, Procurement and Construction
EPCM Engineering, Procurement, Construction Management
EU European Union
GMSG Global Mining Standards Group
GVC Global Value Chain
HQ Headquarters
ISO International Standards Organization
IT Information technology
MENA Middle East and North Africa
MHSA Mining Health and Safety Administration
NSB United Kingdom National Standards Body
OHSAS Occupational Health and Safety Assessment Series
R&D Research and Development
SENATI National Service for Industrial Training (Servicio Nacional de Adiestramiento en Trabajo Industrial)
SNI National Societies of Industries (Sociedad Nacional de Industrias)
SUNAT National Superintendency of Tax Administration (Superintendencia Nacional de Aduanas y de Administración Tributaria)
UK United Kingdom
UNCTAD United Nations Conference on Trade and Development
UNCOMTRADE United Nations Commodity Trade Statistics Database
US United States
SUM Surface and underground mining equipment

6
1. Introduction
This report analyses Peru’s participation in the mining equipment sector with a specific focus on metal-mechanics operations in the country. Mining equipment is a small, yet growing sector of the Peruvian economy. Exports grew ten-fold during the 2000s, and reached US$102 million in 2013 (UN Comtrade, 2015) and total estimated employment that year was 57,000 (SNI, 2013). Peru’s metal-mechanics firms participate in the manufacturing segments of the value chain, although new capabilities are emerging in the design and development of new equipment for underground mining. The growth of the sector to date has been driven by the development of capabilities supplying the domestic and regional mining industry with a diverse range of geological features, combined with low energy and labor costs.
The development of the mining equipment sector has attracted increasing attention from mining countries in recent years as a potential opportunity to capture additional value from natural resources. The development of backward linkages in mining offers an attractive development alternative to upgrading into downstream activities, which are large scale and capital intensive. Although the industry remains dominated by the United States, Germany and Japan, where the leading firms are located, numerous other mining countries, including Australia, China, Chile and South Africa have entered and upgraded in the industry over the past decade. With demanding global lead firms, the industry requires rigorous levels of quality to ensure high equipment availability and performance. Increasingly in recent years, as the mining sector has come under pressure to improve its environmental and safety records, standards governing these aspects of production have also been transferred to their equipment suppliers. These changes can all contribute to both improved productivity and quality of equipment manufacturers.
Indeed, Peruvian firms have already begun to improve their capabilities as a result of operating in this global value chain. Total production has expanded, the number of components and final products fabricated in the country has begun to increase particularly amongst high rotation wear parts, and two innovative firms have leveraged their experience as operators in the world-class mines to begin to design and develop new equipment for export. Firms have also begun to adapt to the international safety culture of the mines. However, the sector remains challenged by weak connections between value chain actors, and there are few backward linkages between firms in the components and assembly stages of the chain. Furthermore, firms in the sector are heavily concentrated in the industry and have not yet leveraged spillovers into other sectors. In addition, it is constrained by a global poor quality perception and an absence of raw materials, combined with infrastructure and bureaucratic challenges.
With the domestic mining industry still in relatively early stages, its vast range of resources will be exploited for many years to come. Although the mining equipment sector is still small, upgrading strategies taken to support the growth of the mining equipment sector today can help to generate benefits for the country in the future. However, Peru needs to focus its efforts if it is to succeed, identifying one or two specific areas of expertise to build a critical mass to gain credibility. Following this, the next upgrading trajectories are recommended: (1) process upgrading is required to increase the efficiency, ensure local firms can meet global standards, and improve their technological processes, amongst others; (2) consolidate Peru’s position as a wear parts provider within those segments, and begin to leverage relationships with clients to produce permanent components; and (3) those firms that are already competing need to diversify their base into other segments in order to mitigate the risk of overexposure to the mining sector.

7
This reports is structured as follows: Section 2 provides an introduction to the global mining equipment industry, a discussion of the main segments of the value chain and analysis of the changing trends in the global trade in the industry. This also includes an analysis of the different upgrading strategies which have been pursued by different actors in the GVC. This global analysis provides insights into the dynamics of the global industry and provides broader context to analyse the development of Peru’s industry to date. Section 3 analyses Peru’s position in the GVC in detail, providing both a snap-shot of the country’s current participation in the sector, but also examining how Peru’s sector has both upgraded and benefited from this engagement in GVCs. Section 4 concludes with recommended for upgrading strategies.

8
2. The Global Mining Equipment Industry
2.1 Introduction
Mining equipment includes a wide range of equipment used from exploration to smelting operations in the discovery, extraction and processing of coal, minerals and ores (UNCTAD, 2007). This report analyses the equipment used in the mining value chain in three principal categories:
(1) Surface and underground mining equipment,1 mineral processing equipment and bulk materials handling. Surface and underground mining equipment (SUM) includes equipment involved in extracting the materials from the earth (e.g. continuous miners, dozers, draglines, drills, excavators, loaders, scrapers, shovels, and mining trucks amongst others).2
(2) Mineral processing equipment (MP) includes those used to separate the mineral from waste material, remove impurities, or prepare the ores for further refinement (e.g. crushers, cyclones, feeders, flotation cells, grinders/mills, etc.).3
(3) Bulk materials handling (MH) includes equipment that is involved in moving ore and waste materials in all stages of the mining operations (e.g. conveyers and wagons).4
These categories reflect the different stages of use in the mining industry and each of them includes equipment with a range of equipment from low to high value. For example, each of these categories includes components and parts that must be regularly replaced due to abrasion during use. These are low value parts and are referred to as wear parts and include items such as steel balls and liners for grinding mills and liners for dump truck bodies. Higher value parts include technologically sophisticated items such as automation software. This equipment is all used at the site of the mine (UNCTAD, 2007). Other equipment such as that used in the smelting and refining process or ship-loading is not included within the scope of this report, as this equipment is usually operated off-site or may be used for multiple different sectors. Mining infrastructure is also not included in this study. Table A.1 in the Appendix details the products by product category.
In 2013, international trade in the global mining equipment sector was over US$107 billion, following strong years in 2010 and 2011 (UN Comtrade, 2015). While growth rates have subsequently slowed as the mining sector has weakened, the sector is expected to continue to grow at a compound annual growth rate (CAGR) of approximately 8% to 10% between 2014 and 2020 as a result of continued demand for coal, metals and minerals in developing countries. In 2012, surface mining equipment accounted for 36.3% of the overall market share in 2012 and is expected to continue being the dominant product segment between 2014-2020, followed by mineral processing equipment (23%) and underground mining equipment (22%) (Grand View Research, 2014).
1 This also includes drilling equipment used in exploration activities. This equipment needs to be light and easily transportable, as exploration activities generally take place in remote locations. 2 It should be noted that several of these earthmoving machines may also be utilized in the construction sector; however, efforts have been made to focus the analysis primarily on that equipment used in mining. 3 This product segment can be further disaggregated into communition (crushers, feeders, mills, cyclones) and concentration (flotation cells, filters, pumps) (Lydall, 2009), however, this level of disaggregation is not relevant to this report. 4 These categories broadly coincide with those listed in the United States International Trade Administration definition. According to their classification, this equipment includes ‘coal breakers, cutters and pulverisers; under- ground mining core drills; minerals processing machinery; mining cars; stationary rock crushing machinery; excavating machinery; and conveyor systems’.

9
The evolution of the mining equipment sector is closely linked to changes in the global mining industry and worldwide demand for commodities, as the mining industry is highly dependent upon use of equipment for achieving targets of profitability (Lanke 2014). Between 2002 and 2012, a “mining super-cycle” (commodities boom) drove demand for new equipment. The expansion of existing mines and the commissioning of new mines around the globe increased the need for new equipment. Mining equipment companies responded by maximizing their production capacity to meet demand. The end of the commodities boom in 2012 brought with it a slump in demand for equipment – manufacturers scaled back, reduced their workforce and shifted their focus from new equipment sales to after-market services. In addition to on-going requirements for improved safety, energy efficiency and reduced environmental impact, mine operators are now looking for equipment that can operate in deeper, more remote mines and efficiently handle declining ore grade as well as placing renewed emphasis on equipment productivity and availability to optimize their costs.
Consolidation & Rationalization: Over the past five to ten years, the sector has undergone tremendous consolidation and a large number of mergers and acquisitions have taken place (Farooki, 2012; Scott-Kemmis, 2011). This has been driven by strategies (1) to increase production capacity, (2) to diversify end-markets by gaining entry into new mining centers in emerging markets, and (3) to increase product and service portfolios to provide increasingly larger clients with more efficient and technologically superior integrated solutions. First, with high demand for new equipment during the commodities boom, manufacturers purchased new factories to increase production capacity. Second, as mining has shifted from traditional end-markets to emerging markets, manufacturers have sought to gain a local presence by acquiring or merging with local firms. Finally, miners have sought to rationalize their supply chains seeking fewer, but more strategic suppliers to reduce transaction costs. Equipment suppliers have responded by increasingly adopting an integrated solution approach – covering a broader range of products and services for their clients.
Increased Production in Emerging Mining Centers: Several firms have adopted supply chain decisions to increase production and assembly operations in regions where demand is growing rapidly, that is, to Asia (China and India), Australia, and Latin America.5 As equipment specifications are customized to the unique conditions of each mine, proximity to the client can be an important driver in the sector. The growing technological capabilities of these countries combined with lower labor and transportation cost advantages provide attractive incentives to relocate many aspects of manufacturing. Leading manufacturers in all product segments have established manufacturing plants in Brazil and China in recent years. While some firms have used greenfield strategies to enter these markets, many have also entered through the acquisition of local companies. For example, several leading manufacturers acquired firms in China, while others acquired firms in Africa and Latin America, providing them with access to their growing regional markets. Some have pursued aggressive strategies closing most manufacturing plants in their traditional hubs and shifting production to these emerging regions. Due to importance of quality of key performance components to ensuring equipment productivity and availability for their clients, the majority of firms, however, maintain the production of these parts in their developed country facilities.
Product Upgrading: Although mining has generally not been considered a high technology field in the past (Bartos, 2007), in recent years, equipment manufacturing has been increasingly characterized by innovations in product capabilities and design. Four
5 It is important to note that few companies have established production or assembly operations in Africa despite strong growth in mining on the continent.
10
areas are notable: (1) improved environmental performance; (2) increase in size; (3) adoption of automation; and (4) increased modularity.
• First, all large equipment manufacturers have actively focused on reducing the environmental impact of their machinery. This includes reducing fuel consumption (which also cuts costs for operators), improved water use, as well as decreasing carbon dioxide emissions. Numerous manufacturers are developing hybrid machines. These changes have been partly driven by regulation – with the US, the EU and Japan all adopting higher standards for emissions, but also to meet the demands for equipment that can operate in more extreme circumstances, such as in locations where water is very scarce.
• Second, surface mining operations are demanding increasingly larger rigs with greater operational efficiency, while underground operations are seeking smaller, autonomous rigs which can operate in smaller seams (Field Research, 2015). This not only increases productivity, but also decreases fuel costs, and improves safety. Mining haul trucks, for example, have increased in size dramatically helping miners to reduce the number of runs required through the mines (Mining-Technology, 2013). The largest dump truck in the field today can carry almost 500 tons of equipment (Mining-Technology, 2013).
• Third, driven by the dual needs to decrease accidents and to increase operating availability in the context of limited human capital, there is a shift towards automated operations as well as operations that can be managed through surface control centers. Australian firms, in particular, have invested significantly in improved automation. In 2008, Rio Tinto launched ‘Mine of the Future’, a project which envisions full automation of the company’s Australian mines operated from a central operations center in Perth – up to 500 km away from the mine site. They already have over 50 autonomous trucks in operation (Rio Tinto, 2015).
• Fourth, as mines are becoming increasingly remote and equipment and operating systems need to be deployed as quickly as possible, while allowing for future expansion (Craven, 2014). This is resulting in a shift towards modularity both internally and to add on third-party equipment. This modularity is then being combined with unique integration services to meet the specific needs of each mine (UNCTAD, 2007). This modularity can ensure that equipment fits together seamlessly avoiding bottlenecks as materials move from one point to another. This increases process efficiency. This may drive further consolidation of the sector or increased collaboration across complementary suppliers. These modular machines are also becoming more mobile, allowing them to be moved closer to the extraction site as mines expand.
Lifecycle management and big data: With the volatility in the commodities sector over the past five years and current declining prices, mining companies are under pressure to increase productivity and curtail operating costs– in particular, decreasing downtime in the mines to an absolute minimum. They are beginning to turn towards performance-based contracts with their equipment suppliers, who are compensated on the basis of machine productivity and availability (Porter et al., 2014).6 This has placed increased emphasis on equipment life-cycle management by the manufacturer, that is, closely managed preventative maintenance and operation to maximize performance and increase returns on investment over time.7 Lifecycle costs for machinery in the mining sector can 6 Joy Global have even entered into performance-based contracts with their mining clients which include guarantees for uptime. Compensation is based on performance of equipment plus output of the mine (Porter et al., 2014). 7 See procurement discussion regarding purchasing decisions, but ultimately this is based on a calculation of total cost of the machine over its life cycle and not simply purchase price.

11
amount to more than double the original purchase cost of the machinery – including fuel, operators, repairs, maintenance etc. (Komatsu, 2014). Equipment suppliers have thus begun to analyze the data accumulated by their machines during operations. This analysis helps to identify more precisely equipment wear in specific conditions, allowing for better planning of preventative maintenance to avoid downtime, as well as to improve inventory management of spare parts and increase the efficiency of their supply chains.8 Furthermore, in the future, this data will be able to drive better procurement decisions at the system levels regarding whether investments in one area of the mining chain reduce equipment expenses in other segments of the chain, with important improvements in mine productivity (Porter et al., 2014).
Competition from China: Chinese mining equipment producers have been rapidly growing and upgrading their quality, supported both by protective market regulations for the domestic demand, as well as the strong demand for equipment during the super cycle (E&MJ, 2012).9 Several of these Chinese firms are opening up manufacturing operations in the Americas (Brazil and the US), allowing them to get closer to their end markets. For example, Samy Heavy, a leading Chinese equipment company, built a US headquarters and manufacturing site in Georgia. Chinese suppliers have also benefited from the expansion of Western equipment manufacturers into the Chinese market. In order to meet the price point of the local market, several Western OEMs began to incorporate Chinese-made components into their equipment, thus facilitating upgrading of the local suppliers. Chinese firms are actively seeking to improve their skills bases, increasing and improving their training programs and sending professionals abroad to learn from foreign expertise (E&MJ, 2012). When their quality reaches the right level, OEMs plan to incorporate them into their global supply chains to compete with their traditional suppliers. Furthermore, the internationalization of these firms is being helped by the new investments of Chinese mining companies around the world. As these companies invest abroad, they are bringing their equipment suppliers with them (International Mining, 2011).
2.2 The Mining Equipment Global Value Chain
The mining equipment GVC is comprised of a large number of activities, from innovation to service operations up to 20 years after the original sale of the equipment. These activities can be broadly grouped into five main stages: Research and Product Development; Components and Sub-Assembly Manufacturing; Assembly; Sales, Distribution and Marketing; and After-Sales Services. Figure 1 illustrates this value chain and the primary activities that take place in each stage.
8 Komatsu, for example, has installed its KOMTRAX software on 340,000 units in operation globally, helping to support a “zero inventory” approach for its dealers (Komatsu, 2014). 9 Limited capacity at traditional manufacturers meant that miners began to consider equipment from the Chinese providers in order to meet purchase deadlines (International Mining, 2011).

12
Figure 1. Mining Capital Equipment Global Value Chain
Source: Authors.
Research and Development (R&D): This segment includes the development, design and testing of new equipment for the sector, as well as engineering for manufacturing. Recently, R&D activities have been driven by new challenges such as improving mine productivity, increasingly remote mines, complexity of extraction, declining ore grades, environmental pressures, safety concerns and scarcity of qualified human capital (Scott-Kemmis, 2011). R&D activities are generally managed by lead firms, often in collaboration with mining clients and government funded research organizations (e.g. the Australian Commonwealth Scientific and Industrial Research Organisation (CSIRO)).
Manufacturing of mining equipment can be subdivided into several different stages, including inputs supply, components manufacturing, and assembly. Key inputs include raw materials for the sector such as iron and steel, and non-ferrous metals and alloys. Components manufacturing can be loosely divided into three or more categories: standard (e.g. bearings, seals, housings, couplings, valves, screws, nuts, bolts etc.), casting and foundry products (e.g. axels, drive shafts, engine casings, etc.) and electronics (e.g. sensors, circuit boards, displays, etc.). Metal-mechanics firms are the most important suppliers of components. Sub-assemblies include engines and turbines, gear boxes, drive trains, breaking systems, etc. Final assembly includes the final manufacture of the equipment (e.g. crushers, drilling rigs, grinders, etc.). Firms operating in these different manufacturing stages of the mining equipment GVC can be divided into four different categories – Tier 1 or Original Equipment Manufacturers (OEMs), Tier 2 suppliers – who provide sub-assemblies and Tier 3 suppliers who provide components. In addition to manufacturing suppliers, a large number of service providers are also engaged in the supply chain.
Within the sector, there are differences across the leading firms regarding outsourcing versus in-house production of these different manufacturing stages. Some firms are
Components Manufacturing
Other components
Metal works
Metal casting Sub-Assembly
Final Assembly
Installation & Commissioning
Assembly Sales &
Distribution
Chemicals Metals
Others
Input Suppliers
Materials Handling Components & Equipment
Underground & Surface Components & Equipment
Mineral Processing Components & Equipment
Main Segments: Exports
After-Sales Services
Operation/Contracting
Maintenance, Repair
Training
Research & Product
Development
Process Development
Engineering for manufacturing
Prototype Dealers
Direct Sales Offices

13
largely vertically integrated building the machines from the ground up.10 Others engage third-party contractors to supply different components, sub-assemblies and even some final assembly operations. Almost all major firms, however, maintain that they produce all key performance components in-house.
Box 1. The Emergence of Remanufacturing
Over the past ten years, remanufacturing services have emerged as an important growth area for major firms in the mining equipment sector. This growth has been driven by the strong demand for equipment during the commodities supercycle, allowing manufacturers to increase the overall number of units sold annually, and at the same time, helping mining operations to lower their costs. Today, this latter driver is particularly important. A remanufactured machine can save the client between 30 to 50% of the purchase costs. Remanufactured equipment is first thoroughly inspected, entirely overhauled, worn or damaged components are replaced, the machine is tested to OEM new equipment standards, incorporated into the company’s traceability system and is often provided the same, if not better, warranty than new equipment. Remanufacturing is also being used at the component and sub-assembly level. By 2014, Caterpillar had established 9 remanufacturing locations, employing 3,600 people, while Komatsu had developed 12 centers worldwide. Other firms, such as Liebherr have maintained a more centralized approach to remanufacturing, carrying out these activities in one or two centers.
Source: (Caterpillar, 2013; Field Research, 2015; Komatsu, 2014; Liebherr, 2015)
Sales are managed either by in-house subsidiaries or independent dealers. Proximity to the client is critical, and thus these operations are generally geographically located in mining centers. Sales can be divided into three categories – new equipment, remanufactured equipment (see Box1), or used equipment. There are different modalities for procuring equipment, which range from outright sales to rental agreements. With technological innovations increasing equipment safety, productivity, and energy efficiency, rental agreements allow miners to access these advances more quickly than through outright purchase arrangements. At the same time, these facilitate access to equipment without the significant financial capital outlays required for new equipment and allow access to specialized equipment that may only be required for short periods of time and not full-use (EngineerLive, 2013). Some firms exclusively focus on providing rental equipment, others operate in the used equipment segment, while still others will work in all three segments. As they have a vested interested in the long-term success of the sector, several large OEMs offer favorable financing options to facilitate the purchase of equipment, including low-interest loans (Spence, 2014).
Distribution: This is an essential part of mining equipment business model due to the average size of the equipment, the geographic distribution of clients and the reliability of on-time delivery in the sector. Large equipment must be shipped around the globe and often delivered to remote mining sites. The distribution operations are also central to providing after-market services, as they ensure timely delivery of spare parts, reducing equipment downtime for clients. Firms may either run these operations in-house or outsource.
After-Sales Services refers to all post-sales services for mining equipment, including installation and commissioning, operator training, spare parts provision, maintenance, inspection and audits. Installation and commissioning includes the on-site assembly of equipment, training of mining personnel and operators to begin to use the equipment as well as making any adjustments for the particular conditions of the client’s mine. This is 10 Liebherr has only 100 specialized suppliers, for example.

14
particularly important in the mineral processing equipment segment, as crushers and other equipment generally are assembled at the mine’s location. In addition, some firms may even operate the equipment for the buyer as external contractors.
Spare parts provision is a core element of the manufacturing business model due to the length of the equipment lifecycle. The availability of spare parts is essential for rapid repair of equipment to avoid costly downtime. Dealers can maintain millions of dollars worth of inventory to ensure parts are available on time. As the cost of financing these operations is high, the majority of OEMs and their suppliers have also established global logistics operations with regional and local hubs allowing for next-day delivery for many of the components and parts. Maintenance is also an essential element helping to reduce unscheduled downtime and all service providers have large teams of skilled mechanics and technicians. An important part of these after-market services is thus training provision – both of the operators and of the maintenance teams. After-market services may be managed entirely by the OEM or by some combination of OEM and its dealers depending on the specific firm’s business model.
This stage of the value chain typically offers more stability than equipment purchases due to the operating life cycle of the machinery. In the volatile post-crisis market, many large miners have focused on extending the life of equipment through maintenance rather than replacing equipment. While miners have also been pushing for longer cycles between maintenance to reduce their maintenance costs, the segment remains an attractive aspect of the sector, and accounts for between 40-60% of OEM businesses (Financial Times, 2013).
2.3 Global Demand and Supply in the Mining Equipment GVC
Global trade in mining equipment in the three categories analyzed in this paper declined to US$107 billion in 2013, after peaking at US$123 billion in 2012 (Table 1). This follows strong growth between 2002 and 2012 during which mining equipment trade almost tripled. While comprehensive trade data is not available for 2014, qualitative analysis suggests that global trade has continued to decline.
Table 1. Global Exports of Mining Equipment, 2003-2013
Value ($, Billions) World Share (%)
2003 2005 2007 2009 2011 2013 2003 2005 2007 2009 2011 2013
All Equipment 39.8 66.0 100.0 69.0 114.1 106.7 Underground and Surface 25.5 44.1 69.1 39.9 76.4 66.6 64% 67% 69% 58% 67% 62% Mineral Processing 10.6 15.9 22.5 23.0 28.7 29.7 41% 36% 33% 58% 38% 45% Materials Handling 3.7 6.0 8.4 6.1 9.0 10.4 35% 38% 37% 27% 31% 35%
Source: UNCOMTRADE, HS92, exports represented by world imports
Tables 2, 3 and 4 highlight that global supply is dominated by developed country producers, US (all categories), Japan (Surface & Underground Mining equipment (SUM)), and Germany (Mineral Processing equipment (MP), although China has emerged as an important exporter gaining a total market share of 10.9% by 2013. Since 2005/7, the country has rapidly gained market share in all three product categories analyzed in this report; by 2013, its world market share by category was 9.6% (surface and underground mining equipment), 14.5% (mineral processing equipment), and 9.2% (materials handling equipment). South Korea also emerged as a developing country supplier of SUM equipment, accounting for 6% of exports in this category between 2003

15
and 2013. In Latin America, Mexico has emerged as an exporter of materials handling equipment, accounting for 5% of global trade between 2003 and 2013.
Table 2. Top Five Mining Underground & Surface Final Equipment (SUM) World Exporters by Value, by Year, 2003-2013
Exporter Value
(US$, Millions) World Share
(%) 2003 2005 2007 2009 2011 2013 2003 2005 2007 2009 2011 2013
World 25,528 44,101 69,083 39,868 76,447 66,597 USA 4,014 7,156 12,048 9,018 16,337 13,207 15.7 16.2 17.4 22.6 21.4 19.8
Japan 6,561 10,943 13,913 7,158 14,776 11,636 25.7 24.8 20.1 18.0 19.3 17.5
China -- -- -- 2,404 -- 6,425 -- -- -- 6.0 -- 9.6
Germany 2,483 4,526 7,007 3,997 5,683 5,386 9.7 10.3 10.1 10.0 7.4 8.1
UK 2,053 3,488 5,813 1,931 5,053 4,467 8.0 7.9 8.4 4.8 6.6 6.7
Rep. Korea -- 2,184 4,071 -- 5,422 -- -- 5.0 5.9 -- 7.1 -- Belgium 1,492 -- -- -- -- -- 5.8 -- -- -- -- -- Top Five 16,603 28,296 42,852 24,507 47,271 41,122 65.0 64.2 62.0 61.5 61.8 61.7
Source: UN Comtrade, HS92, exports represented by world imports
Table 3. Top Five Mineral Processing General Final Equipment World Exporters by Value, by Year, 2003-2013
Exporter Value
(US$, Millions) World Share
(%) 2003 2005 2007 2009 2011 2013 2003 2005 2007 2009 2011 2013
World 10,585 15,899 22,487 23,011 28,733 29,722
Germany 2,306 3,275 4,615 4,668 5,531 5,294 21.8 20.6 20.5 20.3 19.3 17.8
China -- -- 1,705 2,488 3,733 4,319 -- -- 7.6 10.8 13.0 14.5
USA 1,110 1,356 1,967 2,211 2,498 3,105 10.5 8.5 8.7 9.6 8.7 10.4
Italy 1,369 2,112 2,545 2,301 2,926 2,569 12.9 13.3 11.3 10.0 10.2 8.6
UK -- 983 1,514 -- -- 1,589 -- 6.2 6.7 -- -- 5.3
France 763 1,032 -- 1,516 1,405 -- 7.2 6.5 -- 6.6 4.9 -- Japan 643 -- -- -- -- -- 6.1 -- -- -- -- -- Top Five 6,192 8,759 12,346 13,183 16,093 16,877 58.5 55.1 54.9 57.3 56.0 56.8
Source: UN Comtrade, HS92, exports represented by world imports
Table 4. Top Five Materials Handling Final Equipment World Exporters by Value, by Year, 2003-2013
Exporter Value
(US$, Millions) World Share
(%) 2003 2005 2007 2009 2011 2013 2003 2005 2007 2009 2011 2013
World 3,652 6,050 8,383 6,109 8,963 10,420
Germany 583 1,029 1,256 1,269 1,733 1,658 16.0 17.0 15.0 20.8 19.3 15.9
USA 383 719 1,298 541 1,023 1,097 10.5 11.9 15.5 8.9 11.4 10.5
China -- -- -- 451 -- 957 -- -- -- 7.4 -- 9.2
Japan 465 777 671 454 907 908 12.7 12.8 8.0 7.4 10.1 8.7
Mexico -- 316 -- -- 549 672 -- 5.2 -- -- 6.1 6.4
Italy -- -- -- -- 505 -- -- -- -- -- 5.6 -- Canada 412 577 653 364 -- -- 11.3 9.5 7.8 6.0 -- -- France 260 -- 547 -- -- -- 7.1 -- 6.5 -- -- -- Top Five 2,103 3,419 4,425 3,080 4,716 5,292 57.6 56.5 52.8 50.4 52.6 50.8
Source: UN Comtrade, HS92, exports represented by world imports

16
Although the mining equipment sector continues to be dominated by traditional manufacturing countries, there are several newcomers which have gained market share in the industry during the commodities boom of the 2000s, thanks in part to leverage the economies of scale and expertise provided by their domestic mining interests. These include Australia, Brazil, Mexico, South Africa and Turkey. Figure 2 illustrates the evolution of exports from these countries between 2003 and 2013.
Figure 2. Exports in the Mining Equipment Global Value Chain, Select Countries 2003-2013
Source: UN Comtrade, 2015.
All regions experienced an increase in demand for mining goods between 2003 and 2012, reflective of the commodity boom. Total demand tripled during this period, although the global financial crisis resulted in a slowdown in 2009, most notably in established markets in North America and Europe. Demand contraction in emerging regions including Africa, the Middle East and North Africa, Russia and Latin America by comparison was marginal. The end of the supercycle saw a global contraction of 13%. Of the top 10 markets in 2012, eight saw a decrease (France and Germany increased their imports marginally in 4% and 3% respectively). Australia saw the greatest decline of the top ten contracting 58%, followed by Indonesia (51%), Brazil (20%), Canada (18%), Russia (14%), USA (12%) and China (10%).
-
500
1,000
1,500
2,000
2,500
3,000
3,500
Australia Mexico Brazil South Africa
Turkey Chile Peru
Mill
ions
(U
S$)
2003 2005 2007 2009 2011 2013

17
Table 5. Top 10 Importers, All Mining Equipment, by Value, by Year, 2003-2013
Importer Value
(US$, Millions) World Share
(%) 2003 2005 2007 2009 2011 2013 2003 2005 2007 2009 2011 2013
World 39,764 66,049 99,953 68,989 114,142 106,729 USA 5,889 11,047 10,035 4,954 10,182 11,497 14.8 16.7 10.0 7.2 8.9 10.8
Russia -- 1,916 5,445 4,092 7,591 8,359 -- 2.9 5.4 5.9 6.7 7.8
Canada 2,144 3,575 4,968 3,224 6,575 5,950 5.4 5.4 5.0 4.7 5.8 5.6
China 3,101 3,182 4,854 5,331 8,084 5,682 7.8 4.8 4.9 7.7 7.1 5.3
Australia 1,309 2,441 3,784 2,527 6,260 4,160 3.3 3.7 3.8 3.7 5.5 3.9
Germany 1,659 2,472 3,990 2,398 4,102 3,810 4.2 3.7 4.0 3.5 3.6 3.6
Mexico -- -- -- 2,343 2,572 3,037 -- -- -- 3.4 2.3 2.8
France 1,679 2,165 3,088 1,861 2,770 2,716 4.2 3.3 3.1 2.7 2.4 2.5
Turkey -- -- -- -- -- 2,716 -- -- -- -- -- 2.5
Brazil -- -- -- -- 2,679 2,611 -- -- -- -- 2.3 2.4
Indonesia -- -- -- 1,752 4,736 -- -- -- -- 2.5 4.1 -- India -- -- -- 1,970 -- -- -- -- -- 2.9 -- -- UK 1,644 3,327 3,751 -- -- -- 4.1 5.0 3.8 -- -- -- Spain 1,413 2,302 3,133 -- -- -- 3.6 3.5 3.1 -- -- -- Netherlands 1,189 -- 3,038 -- -- -- 3.0 -- 3.0 -- -- -- Italy 1,462 1,865 -- -- -- -- 3.7 2.8 -- -- -- -- Top 10 21,490 34,290 46,087 30,451 55,551 50,537 54.0 51.9 46.1 44.1 48.7 47.4
Source: UN Comtrade, HS92 world imports
There has been a shift away from traditional mining centres to new markets (Farooki, 2012), as the commodity boom, combined with declining ore grades in traditional centres, drove the development of new mines in locations that may once have been considered too risky/expensive. In 2003, the top ten destinations for mining equipment imports were mostly developed countries: US, Canada, Germany, France, UK, Australia, Italy and Spain amongst others. By 2013, five of the top ten destinations were developing countries (Brazil, China, Mexico, Russia, and Turkey). As a whole, these emerging mining centers doubled their share of the market between 2003 and 2013, from 19% to 37%. During the same time period, Europe, excluding Russia which became the second largest market for mining equipment imports, saw a decline from 38% in 2003 to 23% in 2013.
Latin America and the Caribbean emerged as an important new market during this period, with a CAGR of 21.3% between 2003 and 2013, accounting for just US$3 billion less than the North American market by 2013. The region was driven by demand in Mexico, Brazil and Chile, which together accounted for 55% of the region’s demand in 2012. Peru, Colombia and Venezuela also grew significantly during this period, accounting for an additional 29% of the market.
Middle East and North Africa (MENA), Russia, and sub-Saharan Africa have all also emerged as smaller, but steady markets, that have seen less contraction in 2013. Asia-Pacific, which saw the strongest growth post-2009, has also experienced the most pronounced contraction in the 2012-2013 period. Demand in the region is dominated by three countries – China, Australia and Indonesia, which together accounted for 60% of demand in 2012. Incredibly strong growth between 2009 and 2012 in Australia (imports increased from US$2 billion to US$9.8 billion in 2012) has been followed by rapid contraction, falling to half in 2013.

18
Figure 3. Evolution of Regional Demand for Mining Equipment, 2003-2013
Source: Authors elaboration based on UN Comtrade, HS92 world imports
Note: 2012 data is included in the figure due to its importance as a peak year prior to the decline in 2013.
2.4 Governance, Lead Firms and Standards
The mining equipment GVC is comprised of several groups of actors, which play different roles depending on factors such as the stage of development of a mine, the product segment and the particular structure of the target market. These actors include mine operators, engineering firms, OEMs and component and sub-assembly manufacturers, detailed in Table 6. This section briefly describes the roles of each of these firms in the equipment value chain, followed by a discussion regarding which of these firms are the most important firms for gaining access to market.
-
5,000
10,000
15,000
20,000
25,000
30,000
35,000
40,000
2003 2005 2007 2009 2011 2012 2013
USD
Mill
ions
Sub-Saharan Africa
LAC
Asia-Pacific
Europe excl. Russia
Russia
North America
MENA

19
Table 6. Key Actors in the Mining Equipment Global Value Chain
Mining companies
This group of firms includes both mine owners, such as Anglo American, BHP Billiton, Rio Tinto, and Xstrata, as well as mining contractors. These firms operate the mine. There has been increased consolidation amongst these actors in the past decade. Today, the industry is dominated by five very large global firms: BHP Billiton, Rio Tinto, Glencore, Vale, and Anglo America. These firms are global and diversified, with interests in four or more different commodities. In addition to these “majors”, there are a number of medium-sized international firms dedicated to one or two key commodities, and a large number of smaller firms that operate in one or two countries.
Engineering firms
This group of firms is responsible for the development and planning of the mines. The firms function either as EPCM (Engineering, Procurement and Construction Management) or EPC (Engineering, Procurement and Construction) firms. Global lead firms in this segment include Bechtel, Fluor, and KBR (see Table 6). Due to the role these firms play in designing the mine and development of fixed assets, they play a central role in the selection of equipment to be installed in the mineral processing plants.
Original Equipment Manufacturers (OEM)/ Tier 1
These firms are responsible for the design and manufacture of mining equipment. These firms may or may not outsource elements of design and manufacturer to Tier 2 and 3 suppliers. These firms also provide a wide-range of after-market services or “life-cycle management” services to extend the life of the equipment, as well as to minimize on the total cost of equipment over time. The sector continues to consolidate and OEMs are becoming increasingly global in scope, using M&As to broaden their product ranges (see Table 7). The market power of these firms creates significant barriers to entry for new firms.
Sub-Assembly and Components suppliers (Tier 2 and Tier 3)
These firms provide wear parts and components such as ball bearings, valves, and seals, and sub-assemblies including engines, gear boxes and breaking systems to OEMs. These suppliers also play a role in providing maintenance and spare parts in the after-market services segment. Some global suppliers, such as SKF, are consolidating their position in the sector, making it more difficult for smaller producers to access these chains.
Raw material providers
These suppliers provide manufacturers with raw materials including iron and steel and non-ferrous metals and alloys used in the fabrication of mining equipment. Due to the durability and resistance required for these machines, these raw materials tend to have very specific technical requirements.
Source: Authors.
Mine operators, engineering firms and OEMs all act as lead firms within the chain, although the degree of their power with respect to the flow of resources within the chain and market access varies according to the specific situation.
Mining companies: Mining companies act as the lead firms in three main situations; (1) where no external procurement actors are contracted during mine establishment such as EPC or EPCM contracts with engineering firms, (2) once the mine enters operation and, (3) centralized corporate procurement operations. First, in some markets, smaller to medium sized mines may opt to maintain procurement operations in-house as the size of the project does not warrant outside expertise. In these cases, the mining company engages directly with OEMs for the purchase of necessary equipment. Second, once a mine enters operation, mining companies interact directly with OEMs, particularly in the provision of after-market services such as maintenance and training. Third, in order to maximize on economies of scale and share the cost of equipment over multiple mines, some mining companies over the past ten years have shifted towards centralized procurement. Anglo-American, for example, launched “One Anglo” in 2008, which incorporated centralized equipment purchases (Accenture, 2010; Anglo American, 2008).

20
Rio Tinto launched a similar strategy in 2012, in response to cost cutting pressures following the end of the commodity boom, although they are beginning to global procurement primarily in developed country markets (Rio Tinto, 2013). Mining companies, regardless of size, may also directly engage in the purchase of more “off-the-shelf” equipment in the surface and underground mining equipment segments. The relationship that these mining companies forge with their suppliers can act as a strong mechanism to support entry into the export market; Australian (Scott-Kemmis, 2011), Canadian (Ritter, 2000), Chinese (Scott-Kemmis, 2011) and South African (Kaplan, 2012) equipment suppliers have all been able to leverage the foreign investments of local mining companies to internationalize their sales.
Engineering firms: These firms play a particularly important role in providing access to market in the early stages of a mine’s development in markets where mines tend to be larger and owned by the large multinational miners. These miners will typically engage engineering firms in EPC or EPCM contracts to establish the mines (Scott-Kemmis, 2011). Firms undertaking EPCM contracts are engaged in all aspects of mine design, including facilitating the procurement of mining equipment. Under EPCM contracts, engineering firms develop short-lists of approved equipment manufacturers who are invited to bid on a project and provide advisory services regarding which equipment should be selected. Under EPC contracts, engineering firms are responsible for essentially providing a turn-key operation for mine operators. They construct the mine as well as purchase any necessary equipment. In Chile, where the mining sector is dominated by large mining firms, approximately 90% of procurement operations are managed by 6 EPCM firms ("An Ever-Increasing Range of Providers,"", 2011), which thus completely control access to market. These firms tend to favor working with providers with whom they have long-standing, global relationships. This situation makes it difficult for new or smaller firms to break into the market (Lydall, 2009). These firms also tend to play a more important role in the procurement of mineral processing plant equipment than other product categories, as a high degree of customization is required for the specific circumstances of the mine (Field Research, 2015).
OEMs: OEMs derive much of their power in the chain as a result of their investments in innovation and the development of new equipment and systems to drive productivity at the mine. The development of larger, more efficient and more productive equipment, such as continuous miners and autonomous rigs, and the development of integrated systems solutions for different stages of the mining value chain, provide OEMs with an advantageous position vis-à-vis their clients which are eager to benefit from these productivity enhancements. This power has been further enhanced by the consolidation in the sector and the dominance of a handful of firms in the production of each product category, particularly in the surface mining equipment sector where the top ten firms, including Caterpillar and Komatsu account for over 60% of the market (Sleight, 2015). The underground mining equipment sector is less concentrated, with more potential for new firm entry (Scott-Kemmis, 2011). Table 7 indicates the leading companies in each of these product segments. Due to the importance of availability and performance of equipment to buyers, miners often prefer to limit their options to well-known global OEMs for key products, making it difficult for new firms to break into the market.

21
Table 7. Select Lead OEM Firms, By Principal Product Category
Firm Mining Division Revenues
(US$ million)
Mining Division Employees
Origin Principal Product Category
Caterpillar 13,720 118,500 US Surface Mining Equipment Underground Mining Equipment
Komatsu 15,949 47,208 Japan Hitachi 6,393 Japan Liebherr 1,435 Germany Joy Global 5,012 16,000 US Sandvik 4,804 12,965 Sweden Atlas Copco 3,037 13,357 Sweden Sany Heavy 533 35,000 China Metso 2,869 10,000 Finland Mineral
Processing Equipment
FLSmidth 2,525 6,146 Denmark Wier Minerals 1,963 8,900 UK Outotec 1,110 4,978 Finland
Source: Authors, based on 2013 company annual reports and websites.
As described earlier, after-sales services typically accounts for at least the same if not more than the value of the original equipment purchase, and with equipment life-cycles of 10 to 20 years, the ongoing relationship between mining companies and OEMs is important. These are long-term partnerships focused on maximizing on the return on investment for the machines. On the other hand, however, although OEMs can service the equipment of other manufacturers, it is more common for them to provide after sales services for their own equipment. Thus the initial sale of the equipment is an important driver of firm profitability.
Relationship between OEMs and Component Suppliers
Tier 2 and 3 manufacturers respond to a specific set of requirements from OEMs for the production of sub-assemblies and components respectively. These suppliers respond to request for proposals and quotations from OEMs, and must undergo a rigorous supplier selection process. During this process, suppliers may be required to alter the specific manufacturing processes proposed to meet the needs of the OEM and the components are thoroughly tested for performance. Due to the importance of life-cycle management, all components must be fully traceable, allowing OEMs to determine optimum replacement schedules, as well as identify potential challenges that may arise in operation. Many firms maintain a zero-defect policy for their suppliers and require them to assume the risk and management of compliance failure including on-site servicing and repair, which means that selected suppliers tend to have not only strong technical capabilities but also rapid post-sales services. However, once a supplier is selected for a specific component, this is often a long-term relationship between the component supplier and the OEM. For example, Komatsu commits to suppliers for the duration of a particular model, only reopening supplier selection when a new model is developed.
Optimization of the supply chain leads OEMs in some cases to purchase the raw materials for component manufacturers, as they can access economies of scale, while in other cases, due to the specificity of the OEM’s parts and the capital intensity of the sector, the OEM may own the machinery and tools used by the suppliers in the production of their parts. In general, however, in the mining equipment sector, OEMs have been slower to
22
outsource manufacturing to suppliers than in other manufacturing sectors, although outsourcing in the mineral processing segment has begun to expand rapidly in recent years. Intellectual property concerns combined with the importance of performance for brand reputation amongst others increase the risk of outsourcing.
Standards in the Mining Equipment Sector Mining equipment manufacturers design and develop their equipment according to a wide range of international standards, many of which are closely aligned with those governing the mining sector as a whole. Amongst these standards, there has been a steadily growing focus on issues of environment, health and safety (EHS) and, with growing competition from lower cost, but quality providers from developing countries, leading OEMs have begun to focus on these concerns to differentiate their products. There are a large number of public and private standards, as well as national regulations governing equipment performance. Key national standard setting organizations include the US Mining Health and Safety Administration (MHSA), the European Union, Standards Australia/Standard New Zealand, the United Kingdom National Standards Body (NSB), while internationally, the International Standards Organization (ISO) plays an important role (Mining Standards and Guidelines Committee, 2015). While the proliferation of standards, combined with their general lack of harmonization, makes it complicated for equipment manufacturers, there is a tendency for OEMs to produce to the standards of mature markets in the US, Europe and Japan. For example, in the case of environmental emissions standards, European and US (EPA) emissions standards (e.g. Tier 4) have driven most changes in the mobile mining equipment market (Carter, 2010). Although a large share of mobile mining equipment is destined for use in developing countries, buyers tend to be global mining firms, which operate with global standards and thus require equipment meets leading country standards for emissions.11 Within the scope of safety standards, there has been concerted effort on the part of mine operators to push OEMs to improve upon their safety designs for equipment. The safety culture at many of the large mining operations has changed significantly over the past two decades, with firms now placing safety concerns central to their equipment procurement decisions. This means that OEMs have to provide evidence of their machines safety records in order to enter the market. In the past, most safety features demanded by individual mining companies were retrofitted to the machines by local dealers, however, today, as a result of a joint initiative, the Earth Moving Equipment Safety Round Table (EMESRT), which brings together mine and oilfield operators, these buyers are effectively influencing the design of the equipment at the world’s leading OEMs, such as Sandvik and Caterpillar (Burgess-Limerick et al., 2012).14 A second initiative, the Global Mining Standards Group, which also brings together mining companies and equipment manufacturers, is also focused on sharing information regarding standards formation and compliance and global best practices in quality performance, environmental, health and safety standards (Mining Standards and Guidelines Committee, 2015).
These initiatives view the standards being adopted as a minimal threshold and, in practice, there is a drive towards educating procurement staff on purchasing equipment that exceeds the EHS standards established. 11 Many mines have adopted the ISO 14001:2004 Environmental Management Systems standards. A central element of this standard is CO2 emissions management (Tole & Koop, 2013).

23
Table 8. Select Standards in the Mining Equipment Sector
Standard Description ISO 9000 Quality Management System ISO 14001 Environmental Management System ISO 2631.1 Evaluation of human exposure to whole-body vibration. ISO/NP 17757 Earth-moving machinery – autonomous machine safety system. ISO 73.100 Mining Equipment in general OHSAS 18001 Health and Safety ISO 21873 Safety Requirements for Crushers ISO TC 127 Earth moving equipment ISO TC 82 Underground mining equipment
Source: Authors.
2.5 Upgrading Trajectories Although current demand for mining equipment has slowed, the shift in the production models in the industry towards emerging mining centers provides interesting opportunities for these countries to participate and upgrade in the GVC. Table 9 provides examples of select upgrading trajectories followed by firms and countries that have been successful in the global industry.
Table 9. Select Upgrading Trajectories for the Mining Equipment GVC
Upgrading Strategy
Description
Entry into global value chain
Entry into the mining equipment GVC to date has been closely linked with developing capabilities to serve the domestic market. Example. South African mining equipment firms first developed to support the local mining sector (Kaplan, 2012; Lydall, 2009; Walker & Minnitt, 2006). These firms today export all over the globe; they are also key exporters for mining equipment in Africa (UNComtrade, 2015).
Func
tiona
l Upg
radi
ng in
to S
ervi
ce S
egm
ents
Into R&D activities
A mining equipment cluster begins to develop new innovative solutions, such as increased automation and reduced emissions; companies engage directly with research institutions to develop solutions. Example. The Australian Centre for Field Robotics (ACFR) was commissioned in 2007 as a major new center for mine automation R&D. This initiative, whose aim is to develop a fully autonomous, remotely operated mine, is supported by both the Australian government and the private mining companies, including Rio Tinto (Rio Tinto, 2014; Scott-Kemmis, 2011).
Into after sale service
Due to the length of the product lifecycle and use of wear parts, after sales services are essential to the operation of mining equipment. Component and equipment manufacturers are increasingly upgrading their offerings to include after sales service provision. Example. Between 2011 and 2014, a number of OEMs established new service operations in industrial parks in Antofagasta, Chile. Firms in this cluster are both strategically located to serve the local mining operations, but also intend to use the center as a regional base to service equipment from other countries in Latin America (Fundación Chile, 2013; Latinominería, 2013; Minería Chile, 2014).
Into engineering services
Equipment manufacturers are adding new services such as mining engineering services. This type of services provides an integrated approach to operate the equipment more efficiently and effectively. In addition, it facilitates connections with equipment from other manufacturers.

24
Example. Italian equipment manufacturer, Tenova acquired South African firm Bateman Engineering in 2011. Tenova Bateman now offers EPCM services for the installation of sophisticated mineral processing plants, which leverage the suite of products fabricated by the company’s other business units (Tenova Delkor, 2012).
Product Upgrading
Firms begin to produce larger, more powerful and more fuel-efficient models facilitating increased mine productivity and reducing environmental impacts Example. In 2014, the Belarussian firm, Belaz, introduced the Belaz 75710 – the world’s largest dump truck with a payload capacity of 496T (Fleming, 2014). Increased capacity allows for the reduction in the total number of runs required to move materials in the mine. This reduces the potential for accidents on site, as well as minimizing fuel requirements.
Process Upgrading
Improved supply chain management through the introduction of online supplier portals has facilitated the flow of inputs and components through manufacturing plants, and allows for optimal use of capacity and just in time delivery. Furthermore, the incorporation of this system provides information regarding supplier performance. Example. Over the past three years, Sandvik has introduced new supplier management procedures for their production plants around the world. SupplierConnect covers 750 suppliers in 22 countries (Sandvik, 2013).
End-market diversification (Geographic)
The shift into new markets to mitigate risk and tap into new sources of demand. Many established equipment manufacturers have shifted their focus away from mature markets in the US and Europe towards developing countries, such as Brazil and China. Example. The Finnish firm Metso has aggressively increased its China targets. In 2014, the firm entered into a joint venture with Guangxi Liugong Group, a mobile equipment manufacturer to leverage its 900 local distributors to gain access to the market (Metso Corporation, 2014).
Inter-Sectoral Upgrading
Leveraging the skills developed serving the mining equipment sector to diversify into other industry value chains, such as agriculture and oil and gas. Example. With weak demand in the mining sector following the end of the super-cycle, many equipment manufacturers such as Finnish firm Outotec, have strengthened their efforts in alternative areas. Outotec, for example, are using their expertise in the mineral processing segment to enter into the water management sector (Outotec, 2015).
The entry into the mining equipment GVC has been fairly consistent, with almost all countries, both traditional manufacturers and new comers, entering the sector to support their domestic mining interests. The subsequent upgrading trajectories followed by these countries, however, have varied. The four cases below illustrate these divergent approaches.
South Africa: Manufacturing in Specialized Product Segments with Strong Backward Linkages. South Africa built on its manufacturing base that developed through the apartheid years during which the wide range of minerals extracted in the local market offered sufficient economies of scale and scope for local firms to develop, while local research and development carried out by both large miners and public research organizations contributed to the foundations for technological advancements (Kaplan, 2012). The internationalization of firms was facilitated by South African miners global expansion following the end of sanctions (Kaplan, 2012). Equipment suppliers leveraged their areas of expertise to enter the global market. Due to the hard rock and high levels of impurities, suppliers had developed particular skills in underground mining and mineral processing. For example, gold has to be mined in hard rock and at far deeper levels than anywhere else. Many of these firms operate on the technological frontier with global patents, while simultaneously leveraging local inputs – with an estimated local content of around 90% of exports, although offshoring production is beginning to take root. By 2012, locally developed products that are exported included products such as spirals for washing coal; mining pumps for deep level mines; tracked mining equipment; and

25
underground locomotives amongst others. In 2012, there were approximately 650 firms operating in the sector, although concentration is relatively high with just 17 firms accounting for 60% of the 95,000 employees (Kaplan, 2012). With the declining local market for mining equipment, suppliers have increased their focus on international expansion. In 2013, equipment exports reached US$1.8 billion (UNComtrade, 2015).12 The principal market for South African mining equipment developers are regional mines in Sub-Saharan Africa (UNComtrade, 2015). Analysts are now concerned however, that South Africa’s advantages having upgraded in this value chain are beginning to erode due to brain drain at the research level, a decline in technical training and lack of access to trade finance.
Australia: Manufacturing to High Tech Services Solutions and R&D. Australian suppliers began with manufacturing, but quickly began to focus on disruptive technologies to allow them to develop a wide range of new product-services. In particular, this was driven by the incorporation of information technologies into mining equipment. Australian firms have been at the forefront of the applications of IT to almost all aspects of mining. Currently 60% of the software used in the mining industry globally is provided by Australian suppliers. Furthermore, there has been a strong increase in R&D in Australia by equipment suppliers, and at least one lead firm has relocated its R&D center to the country. There has been a particularly strong focus on research in automation, thanks in part to the research and efforts being undertaken by Rio Tinto’s Mine of the Future program. About three-quarters of Australian suppliers invest in R&D (Austmine, 2014), while in 2010, some 15% were spending more than US$1 million on R&D (Scott-Kemmis, 2011). While concentration in high value services has increases in recent years, there has been a recent slump in manufacturing. In 2014, lead firms began consolidating their Australian manufacturing operations or moving them abroad to lower cost locations (Australian Mining, 2014). Australian suppliers benefitted from the expansion of local miners, such as Rio Tinto (Scott-Kemmis, 2011). By 2014, 55% of Australian mining equipment and technology suppliers were exporting products and services to all major mining locations around the world (Austmine, 2014); these exports exceeded those of Australia’s perhaps better known global wine exports (Scott-Kemmis, 2013).
Chile: Upgrading into Services. Chile has followed a trajectory of upgrading into service provision, with little manufacturing being carried out in the country. The small manufacturing supply is primarily directed to local mining operations rather than for export; between 2000 and 2011, total cumulative equipment exports from Chile accounted for less that US$300 million (UN Comtrade, 2015). Miners in Chile, including state-owned copper giant, CODELCO, largely rely on foreign rather than locally produced equipment. This can partially be attributed to the high degree of sophistication of the Chilean mining sector which is comprised of world-class mining firms operating on the technological frontier, combined with a weak history of manufacturing in the country. However, despite weak local manufacturing, the pressure from these lead miners operating in Chile quickly drove the development of a services sector. Contracting operation services in Chile is particularly high compared to other mining countries. In Chile, these contractors accounted for 60% of the workforce in Chile’s mining sector, compared to 24% in Australia and Canada and 8% in the US (Korinek, 2012). This shows a high level of knowledge accumulation by Chilean firms that offer mining services
12 These figures differ from other studies such as Kaplan, 2011 which cite exports closer to US$4 billion as a result of the definition of the industry and the specific incorporation of products. There is not, as of yet, a widely agreed upon measurement system.

26
operating equipment to lead global mining companies. Chileans firms are beginning to export services in mining. Firms in general tend to serve a wide range of industries, with mining accounting for less than 60% of sales for 63% of firms in the sector in 2012 (Fundación Chile, 2014). In addition, recent efforts to replicate the Australian upgrading experience have placed emphasis on developing knowledge intensive and technological service solutions for the industry. This services upgrading is reflected in the labor force working in the mining sector. The labor force serving firms in the sector now consists of skilled and highly skilled personnel; of the 184,000 employees in 2012, 40% have some degree of tertiary education, while the remainder have technical degrees (Fundación Chile, 2014).
One of the areas of services expertise is in that of maintenance. Sending equipment abroad for maintenance and repairs was not cost effective, either in terms of shipping costs or downtime, as a result these skills were developed locally, and by 2014, a regional services hub had begun to develop in Antofagasta with representation from most of the global lead firms. These plants typically cover all aspects of after-market services – installation, commissioning, maintenance, repairs and overhauls or rebuilds (Latinominería, 2013). These maintenance and repair centers today also service equipment from neighboring countries (Minería Chile, 2013, 2014). China: Entry through Component Manufacturing. Chinese firms focused primarily on manufacturing to provide components and machinery for their local mining operations. They strengthened production capacity by establishing joint ventures with lead firms in all product segments. These joint ventures have helped to contribute to the development of local capabilities. Global lead firms from Caterpillar to Metso have been attracted to China’s large domestic mining operations. However, in order to compete in these lower cost markets, these lead firms had to adapt their global designs to incorporate more economical parts and components from local suppliers. As these local suppliers have improved their capabilities, lead firms have begun to incorporate them into their global supply chains. In addition, these suppliers have also begun to internationalize alongside Chinese miners as they expand abroad. Today, there are numerous large Chinese firms competing on the global market, such as Sany Heavy and CITIC group.
Notably, of the four examples, only China has entered directly into the surface mining equipment segment, typically dominated by the large multinationals. South African and Australian manufacturers have tended to focus on alternative sectors where the larger manufacturers have less of a presence. In addition, South Africa and Australia have focused more on providing final equipment or solutions than participating as contract manufacturers in the global supply chains of these large companies. In China, on the other hand, local suppliers were directly engaged by lead firms entering the Chinese equipment market, in turn providing those component suppliers access to the global market. Australian, Chinese and South African firms have all benefited from the internationalization of local miners, which preferred to work with their long-term suppliers. In comparison, Chilean miners have been slower to expand abroad. Chile’s participation in the mining equipment sector has been more service oriented than that of Australia or China. Local companies have developed expertise on services operations, accumulating valuable knowledge and they are starting to export mining services.

27
3. Peru and the Mining Equipment Global Value Chain
The mining equipment sector in Peru has emerged over the past three decades primarily to service the local mining industry, protected from external competition in part by distance from the global sector and in part by macroeconomic instability in Peru in the 1980s that limited imports. Although the strongest growth domestically has occurred in the past ten to fifteen years driven by the entry of several of the large global mining companies into the sector, the industry’s participation in the global market remains very small with approximately US$103 million in exports. The local industry has primarily focused on products where it had a natural competitive advantage such as products that are more difficult to ship due to their size, those that are relatively simple to fabricate, as well as those with regular demand from the industry such as wear parts for mineral processing plants. Over time, the sector has developed expertise in these lower value products, and has become a supplier for both global OEMs and mining clients in these categories.
Beginning in the 1960s, several Peruvian metal mechanics firms were established to provide direct inputs for the mining sector, generally with the backing of foreign firms, which facilitated the transfer of technology to local firms to begin their operations. Initially, these products were mostly rudimentary inputs, and up until the 1980s, most of the components and equipment used in the mines was imported directly from the OEMs abroad. Locally based companies were engaged in adapting these imported machines to function more efficiently in the Peruvian environment. Mining firms also established on-site workshops, which would fabricate temporary parts and components using reverse engineering to ensure equipment continued to operate while new parts were in transit to the mine. Through this process, local firms began to develop a deeper understanding of the needs of the industry, as well as regarding design and fabrication of parts. This learning was further enhanced during the 1980s, when, due to limited access to foreign exchange, operators were forced to source many of the parts locally. As import challenges lessened towards the end of the 1990s, mining firms began once again importing components from abroad, but continued to substitute wear parts with those from the local providers.
As demand for parts, components and final equipment increased in the 2000s, with the commodity boom, a handful of the larger local manufacturers began actively investing in their operations processes, including obtaining the certifications necessary to meet the needs of the increasingly demanding mining sector with a growing presence of the large international miners. They began to standardize production to ensure quality and put in place quality control systems and to invest in new equipment to manage the growing size of the machinery in the sector. Other advances included the development of fabrication design capabilities. Today, several firms produce these blue prints for manufacturing in-house rather than receive them from their clients.
By the mid-late 2000s, local capabilities were considered sufficient for two foreign manufacturers to establish operations in the country to serve the local markets with their brands, as well as for local firms to enter the export market. In addition, two firms began to export own-brand highly specialized equipment for underground mining. Exports of final equipment grew from just US$3 million in 2003 to US$38 million in 2013, while exports of wear parts and components increased from US$8 million to $64 million during that same period (UN Comtrade, 2015). Surface and underground mining equipment exports are destined to a range of global mining destinations, while mineral processing equipment is primarily destined to regional markets with Chile accounting for the largest share (40.8%) (see Table 11, page 33).

28
Industry Organization
The industry is fragmented and dominated by small and mid-size firms. While there are numerous metal-mechanics firms serving the domestic mining industry, the majority of these firms do not participate in the mining capital equipment sector, and of those that do, there are even fewer that participate in any significant form in the global market. The top five companies alone accounted for approximately half of all exports in 2012, and only 22 firms exported more than US$1 million in total that year (SUNAT, 2015).13 Local manufacturing is dominated by locally owned firms, while foreign OEMs are engaged in the distribution and after-sales services of mining equipment to the domestic market.14 There is limited interaction between these groups of firms as the majority of OEM parts are imported directly from the in-house plants around the world, thus limiting potential for spillovers. Anecdotal evidence, nonetheless, suggests that there is greater collaboration emerging between the larger local firms, in particular between these firms and the local foundries, such as between Fima and Mepsa, which is helping to strengthen backward linkages in the country (Field Research, 2015).
Most firms operate independently and/or in isolation, and very little clustering has occurred beyond a small mining cluster in Arequipa. Although a large number are members of the SNI Metal-Mechanics Sector or the Association for Exporters (ADEX), these two industry associations are quite broad in scope, which reduces their potential to adequately coordinate and identify key issues which are affecting different parts of the industry. Efforts are being made to overcome this challenge, yet these are in their infancy and have yet to emerge among the mining capital equipment manufacturers. For example, in 2013, firms engaged in the provision of structural metalworks for the mining industry established a new industry association (AEMPE) to better represent their interests.
Box 2. A Brief Overview of Peru's Mining Sector
As a country endowed with significant natural resources, Peru has a long history of mineral extraction, although this has only operated on a large commercial scale since the 1950s. The enactment of the Mining Code in 1950 and high commodity prices fostered investment in the sector (Waszkis, 1993). During this period, the Toquepala copper mine started operations, becoming one of the biggest of the world at the time (Glave & Kiramoto, 2007). Private investment stagnated due to nationalization of mining operations by the military governments of the late 1960s and 1970s, while low commodity prices in the mid-1980s forced several medium and small-scale mines to close. Macroeconomic instability and terrorism further deteriorated the profitability of the sector during the late 80s.
Private investment recovered and increased rapidly in the early 1990s as a consequence of the policy reforms that liberalized the economy and which were implemented by Fujimori’s administration. The General Mining Law, enacted in 1992, provided greater incentives and legal security to mining ventures. Between 1990 and 1997 investment in exploration increased 90 % worldwide, four-fold in Latin America, and twenty-fold in Peru (Bebbington et al., 2008). The business environment enabled new projects, including Yanacocha and Antamina, and the expansion and modernization of newly privatized mines, such as Cerro Verde and Tintaya (Glave & Kiramoto, 2007). Thus, output recovered as a result of high commodities prices and new investments.
13 This includes at least one contracting firm relocating their drilling fleet (SUNAT, 2015). Some of these contracting firms cater exclusively to the oil and gas sector and thus these figures may overestimate the size of the sector. 14 Investments by mines in equipment reached a peak in 2012 with investments of US$776 million (EY, 2014).

29
Figure 4. Peru’s Copper, Zinc, Gold and Silver Production, 1990-2014
Source: Peruvian Ministry of Energy and Mining. Elaboration: author.
Today, mining is one of the most dominant sectors of the Peruvian economy (11.7% of GDP in 2014). Since 2003 mining has accounted for more than 50% of all exports in Peru (51.9%, US$20.4 million in 2014), with copper and gold being the country’s most important exports by value. Peru is a world leader in mining, and its principal products are: gold (6th largest producer in the world), silver (2nd), copper (3rd), lead (4th), tin, tellurium, molybdenum and zinc (3rd) (EY, 2014).
The investment portfolio in the mining sector is estimated at US$63.9 billion. It is composed of 51 major projects, in the phase of expansion (14.5%), exploration (39.2%), and environmental studies approved (45.2%) or under evaluation (1.1%) (MINEM, 2015). The largest foreign investor is China (35.4%), followed by the United States (15.8%), Canada (13.9)%, and the United Kingdom (7.82%), with domestic investment also playing a small but important role (10.1%). New mining projects are aimed at increasing copper (US$ 47.2 billion, 73%), iron (8.3%) and gold (7.6%) production. Due to the high potential of copper, it is expected that Peru will double its copper annual output from 1.3 million metric tons (MT) to 2.8 million MT by 2016 (EY, 2014). However, projects have been slower to start operations due to both bureaucratic issues and social conflicts over water use and environmental degradation. The US$ 4.8 billion Conga project has been suspended since 2011 due to widespread protests in the Cajamarca Region over water use, while the US$ 1.4 billion Tia María project is currently facing strong opposition by farmers in Arequipa (Reuters, 2015).
0
500
1,000
1,500
2,000
2,500
3,000
3,500
4,000
0
200
400
600
800
1,000
1,200
1,400
1,600
1,800
1990 1995 2000 2005 2010
Gold, Silver (Thousands K
g) C
oppe
r, Z
inc
(Tho
usan
ds T
onne
s)
Copper Zinc Gold Silver
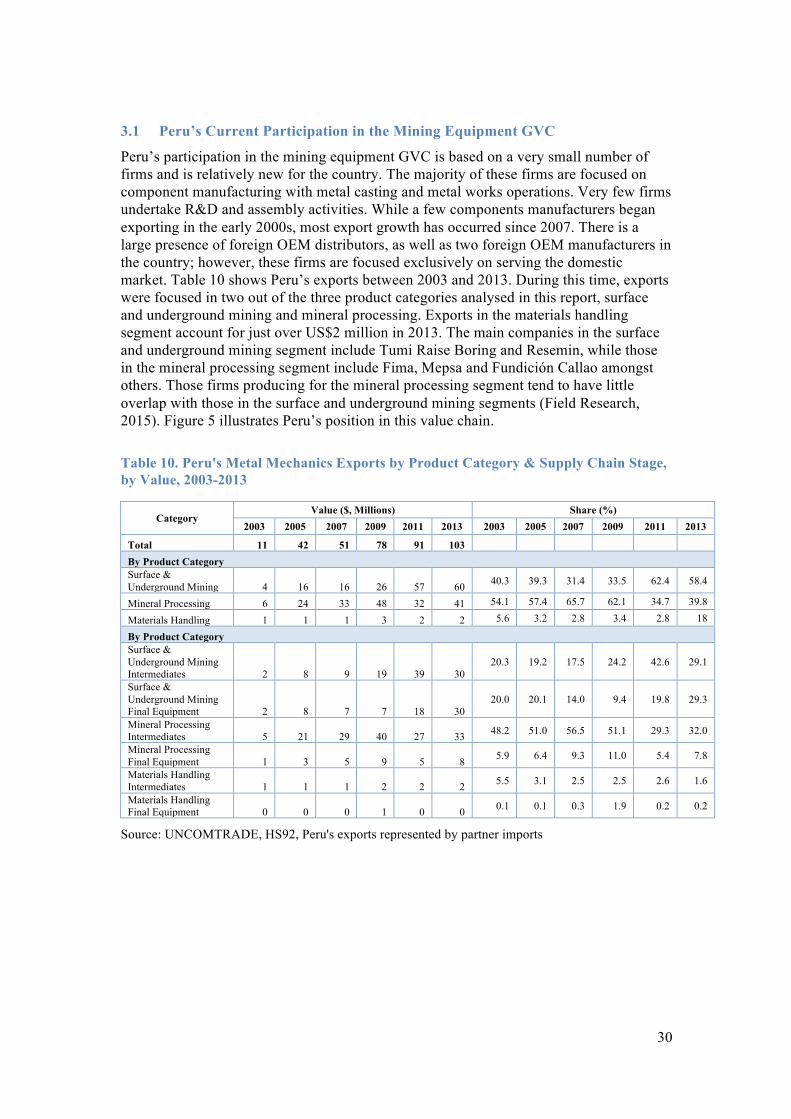
30
3.1 Peru’s Current Participation in the Mining Equipment GVC
Peru’s participation in the mining equipment GVC is based on a very small number of firms and is relatively new for the country. The majority of these firms are focused on component manufacturing with metal casting and metal works operations. Very few firms undertake R&D and assembly activities. While a few components manufacturers began exporting in the early 2000s, most export growth has occurred since 2007. There is a large presence of foreign OEM distributors, as well as two foreign OEM manufacturers in the country; however, these firms are focused exclusively on serving the domestic market. Table 10 shows Peru’s exports between 2003 and 2013. During this time, exports were focused in two out of the three product categories analysed in this report, surface and underground mining and mineral processing. Exports in the materials handling segment account for just over US$2 million in 2013. The main companies in the surface and underground mining segment include Tumi Raise Boring and Resemin, while those in the mineral processing segment include Fima, Mepsa and Fundición Callao amongst others. Those firms producing for the mineral processing segment tend to have little overlap with those in the surface and underground mining segments (Field Research, 2015). Figure 5 illustrates Peru’s position in this value chain.
Table 10. Peru's Metal Mechanics Exports by Product Category & Supply Chain Stage, by Value, 2003-2013
Category Value ($, Millions) Share (%)
2003 2005 2007 2009 2011 2013 2003 2005 2007 2009 2011 2013
Total 11 42 51 78 91 103 By Product Category Surface & Underground Mining 4 16 16 26 57 60 40.3 39.3 31.4 33.5 62.4 58.4
Mineral Processing 6 24 33 48 32 41 54.1 57.4 65.7 62.1 34.7 39.8
Materials Handling 1 1 1 3 2 2 5.6 3.2 2.8 3.4 2.8 18
By Product Category Surface & Underground Mining Intermediates 2 8 9 19 39 30
20.3 19.2 17.5 24.2 42.6 29.1
Surface & Underground Mining Final Equipment 2 8 7 7 18 30
20.0 20.1 14.0 9.4 19.8 29.3
Mineral Processing Intermediates 5 21 29 40 27 33 48.2 51.0 56.5 51.1 29.3 32.0
Mineral Processing Final Equipment 1 3 5 9 5 8 5.9 6.4 9.3 11.0 5.4 7.8
Materials Handling Intermediates 1 1 1 2 2 2 5.5 3.1 2.5 2.5 2.6 1.6
Materials Handling Final Equipment 0 0 0 1 0 0 0.1 0.1 0.3 1.9 0.2 0.2
Source: UNCOMTRADE, HS92, Peru's exports represented by partner imports

31
Figure 5. Peru's Participation in the Mining Equipment Global Value Chain
Source: Authors.
Note: The number of firms participating in each segment was determined using export data from Peru Customs Data with total exports of over US$1 million in 2012, PeruTradeNow and based on finding in interviews regarding backward linkages.
Research and Product Development: Within the past ten years, two firms Tumi Bore Raising and Resemin, based in Peru have begun to carry out R&D for new equipment. Initially this work was based on reverse engineering of foreign equipment, but this has slowly advanced to own designs and branding (Field Research, 2015). In addition, a few firms have developed the expertise and experience to develop their own design and engineering plans for fabrication of components and sub-assemblies for lead firms. These are generally developed in Peru and are approved by OEM clients abroad.
Inputs: The primary input for this industry is steel, followed by other non-ferrous metals. While Peru is a producer of steel thanks to the local production of iron ore, the industry typically does not source steel directly from local producers. Steel inputs for foundries for metal casting tends to be sourced from recycled materials (see Box 3), while a large number of firms involved in metalworks import their steel either directly or through a local dealer. The major local steel producers, including Aceros Arequipa and SiderPeru are primarily focused on providing steel for the country’s booming construction sector and generally do not provide steel with the precise technical specifications and quality required by the mining industry (Field Research, 2015). Other raw material inputs include chrome, ferromanganese, and molybdenum concentrates as well as polyurethane and phenolic resins although in substantially lower quantities.
Components Manufacturing
Other components
Metal works
Metal casting Sub-Assembly
Final Assembly
Installation & Commissioning
Assembly Sales &
Distribution
Chemicals Metals
Others
Input Suppliers
After-Sales Services
Operation/Contracting
Maintenance, Repair
Training
Research & Product
Development
Process Development
Engineering for manufacturing
Prototype
Number of Firms
1 - 5
6 - 10
11 - 15
Dealers/Representatives
Direct Sales Offices
Main Segments: Exports
Materials Handling Components & Equipment US$2 million
Underground & Surface Components & Equipment US$60 million
Mineral Processing Components & Equipment US$41 million

32
Box 3. Steel Recycling in Peru
Steel, an iron-carbon alloy, has long been recycled globally. There are two main ways to produce steel: the basic oxygen furnace (BOF) process, which uses 25 to 35 % recovered steel; and the electric arc furnace (EAF) process which uses nearly 100 % recovered steel (U.S. Enviromental Protection Agency, 2014). Scrap consists of recyclable materials left over from product manufacturing and consumption, such as appliances, old vehicles, building supplies and surplus materials. Recycling steel also reduces the use of iron, carbon and water.
In Peru, the main suppliers of scrap metal are small and medium scrap dealers across the country. Individual or small recyclers sell their scrap to dealers or microenterprises, which in turn separates the steel from other recyclables. The largest steel producer in the country, Aceros Arequipa, buys and combines scrap steel from all over the country and collects it in their scrap recycling plant, where they process new steel. Aceros Arequipa does not deal directly with individual or small scrap dealers due to the high level of informality in the sector. Two other domestic companies, Sider Peru and Mepsa, also possess important scrap recycling plants and foundries that produce recycled steel items (Field Research, 2015).
Component Manufacturing: Component suppliers in the country can be divided between foundries, which perform metal casting, and metalworks shops that focus on cutting, machining, etc. There are a large number of foundries in the country, although the majority of these are small and focused on the domestic market. Larger foundries export primarily wear parts such as steel balls and liners for crushers and grinding mills. Table 10 illustrates that total components exports peaked at US$68 million in 2011, slowing slightly as the mining sector began to contract to US$64 million in 2013. These components range in value from low value steel balls to mid-value liners, which can weigh up to 300-400 tonnes, to higher value sub-assemblies for mineral processing equipment, such as centrifugal pumps.15
These firms include Mepsa, Fundición Callao, Fundición Central and Fundición Ventanilla, amongst others. These firms generally have a long trajectory in Peru, with several firms having operated in the sector for 40 to 50 years. Several provide wear parts directly to OEM manufacturers, including Scandinavian lead firms Metso and Outotec as well as U.S.-based Foster and Wheeler. In addition, there are several firms in the country that provide small components for the automotive and construction sectors that may also be used in the manufacture of sub-components for the mining sector such as brakes, motors, and pumps.
Assembly (Final Equipment and Sub-Assemblies): There are very few firms that operate in this segment of the value chain. Firms operating in this segment of the value chain also fabricate general metallic components. More sophisticated components and subassemblies such as motors and control systems are typically imported from large well-known manufacturers in the US and Germany (Field Research, 2015). Total final equipment exports from Peru have increased steadily over the past decade from US$3 million in 2003 to US$38 million in 2013 (see Table 10). Nonetheless, the country’s participation should not be overestimated, as it ranked 57th in global exports that year, approximately 0.04% (UN Comtrade, 2015). Equipment used in surface and underground mining operations alone accounted for 59% of total exports in the sector and almost 79% of final equipment exports in 2013 (see Table 10).
Firms in this segment include Resemin which manufactures drilling rigs (jumbos) for underground mining (see Box 4), Tumi Raise Boring which produces highly specialized 15 It should be noted that due to the wide range of uses of centrifugal pumps in addition to mining, these were not included in analysis of the trade statistics.

33
raise boring equipment, and Fima, which assembles final equipment for foreign OEMs, amongst others.
Marketing and Distribution: This segment is limited to the country’s two small OEM suppliers. These firms compete directly with global mining equipment suppliers in their segments, including Sandvik and Atlas Copco. Nonetheless, all lead firms in the industry have representation in the country to serve the local mining sector. Amongst the most important of these is the Caterpillar dealer, Ferreyros, which also has operations in Belize, Guatemala, and El Salvador. Many of these firms are establishing their operations in Arequipa to be close to the southern mining operations in the country (Field Research, 2015).
After-Market Services: These services are generally limited to supporting the local market. Although this is an important part of local distributors revenue (up to 60%), there are no significant service exports in this category (Field Research, 2015). Nonetheless, as part of their value-proposition, local OEMs offer extended after-market services for clients abroad, including maintenance and repairs, training, as well as the operation of their machinery in the mine. Several of the foreign OEMs operate small remanufacturing departments; however, these are destined for the domestic market and not for export.
Human Capital
Total employment in the three key metal-mechanics sectors serving the mining equipment industry in Peru (such as firms in the basic metals (iron and steel) operations (e.g., foundries), and those in the fabrication of machinery and electronic equipment) is approximately 57,000, while the broader metal-mechanics industry employed some 280,000 people in 2012 (SNI, 2013). Amongst these, qualified welders are consistently highlighted as the most in demand personnel, driven not only by the mining and metal-mechanics sectors, but also by the growing construction sector. In 2012/2013, monthly salaries ranged from approximately US$600 to US$1,300, up to five times the minimum wage (1,800 to 4,000 soles) (Mendoza, 2012; Sánchez, 2013); this compares to US$1,600 in Chile at that time (Jerez, 2012). In order to work on projects for foreign OEMs, these welders generally must possess a high level certification. In Peru, the general standard adopted by firms serving the sector is the American Welders Society certification and training is often coordinated by the hiring firms.
3.2 Upgrading Analysis in Peru’s Mining Equipment GVC Over the past ten years, Peru’s exports into the mining equipment GVC have grown; new firms have entered the sector and existing firms have both expanded production and upgraded their products. The close relationship with the mining industry, both in Peru and Chile, has helped to foster improvements with respect to quality and safety standards in manufacturing. However, there has been less process upgrading in the sector. There has been little development of backward linkages between firms, and other stakeholders and firms remain highly concentrated in mining, limiting opportunities for spillovers both across the sector and into other segments of the economy. This section analyses these different upgrading experiences within Peru, listed below. 1. Exports have grown: Peruvian exports in the mining equipment value chain have grown from US$11 million in 2003 to US$103 million in 2013, with a CAGR of 25%.16
16 These export figures include both equipment fabricated in Peru and equipment that is imported and exported by mines and contracting companies providing services such as drilling for both mine

34
While these exports are primarily concentrated in a small number of firms, with the top 22 exporters accounting for over 80% of exports, there has been an increase in the number of firms participating in the sector. The total number of firms exporting over US$50,000 annually doubled from 50 to 100 between 2007 and 2012 driven by booming global demand (see Figure 8, page 58). While this increase is notable, and the country’s exports are not far behind neighbouring Chile (US$172 million), the industry remains comparatively very small. For example, exports account for less than 10% of other non-traditional mining equipment exporters Australia (US$1.4 billion) and South Africa (US$1.8 million) (UN Comtrade, 2015). The composition of these exports has changed since 2005, with mineral processing intermediaries losing ground to higher growth in the surface and underground mining equipment segments.
Figure 6. Peru’s Mining Equipment Value Chain Exports, By Product Category 2003-2013
Source: Authors, based on data from UN Comtrade, 2015.
2. Product Upgrading: Product upgrading has generally occurred in both of these categories, with separate groups of firms in each category.
In the mineral processing category, firms in the production of steel balls have expanded production, they have also upgraded into increasingly larger liners for SAG mills and crushers. An important share of these products are wear parts, that is, components that must be replaced on a regular basis during the mine’s operation due to wear and tear as they come into direct contact with the rock and minerals. These items tend to be lower value items since they are not permanent components. Because they are used on an on-going basis in the operation of the mine and the processing plant, these exports provide continuity in a market that is generally highly cyclical. Exports from Peru for wear products have increased over the past ten years; steel balls and parts for grinders alone accounted for US$33 million in 2013 (see Table 22, page 56). These products saw a significant slowdown between 2009 and 2013, although exports began to expand again slightly in 2013.
In the surface and underground mining category, product upgrading has been particularly notable. This has been driven by the growth of final drilling equipment for underground mining manufacturing which was not present in the country before 2002. Exports of these products increased from just US$2 million in 2003 to US$17 million in 2013, accounting
exploration and operation. This should be considered in any interpretations of these figures, as this could lead to an over-estimation of actual productive exports.
0
20
40
60
80
100
120
2003 2005 2007 2009 2011 2013
Expo
rts,
US$
(M
illio
ns)
Surface & Underground Mineral Processing Materials Handling

35
for 17% of the industry exports that year (UN Comtrade, 2015).17 Exports have continued to grow despite the slowdown. This can largely be attributed to the fact that underground mines globally continue to mechanize and look for more efficient and safer operating equipment to maintain their economic viability. Overall product upgrading thus can be attributed in part to increased exports and product development of a small group of firms.
3. Functional Upgrading: One of Peru’s most successful upgrading firms is Resemin, which is a leading global supplier of drilling equipment in the underground mining equipment sector. As Box 4 describes, the company’s upgrading trajectory began as a parts supplier, shifting to parts manufacturing, followed by final equipment production using reverse engineering and finally own engineering for new equipment design. Upgrading was fostered by in-depth industry knowledge from the firm’s founder, who had worked for a foreign OEM supplier in Peru prior to opening the business, as well as, importantly, operating the company’s own equipment in mines in other markets. This experience of hands-on use, which is observed in other important Peruvian equipment manufacturers that operate and install equipment, provided the firm with intimate knowledge of requirements for improving upon existing designs.
Box 4. Resemin: A Peruvian OEM Upgrading Story
Founded in 1989 as a spare parts distributor and manufacturer, Resemin today has become a leading supplier of drilling equipment in the underground mining equipment sector, with global sales of over US$65 million in 2012. The company provides equipment to the domestic market and exports to more than 12 countries. With more than 220 machines in operation globally, Resemin has established sales offices and service centers in key global mining centers including Argentina, Chile, India, Mexico, and Zambia. The company’s global expansion was driven primarily by demand from key clients with the relocation of mining executives at major firms from Peru to other parts of the world. In addition to providing direct sales, primarily in Latin America, Resemin provides contracting services for underground drilling.
The third largest firm in its product segment globally, Resemin is one of the few companies in Peru that designs, manufactures and assembles its equipment in Peru and provides after-market services in all key markets. Major components such as engines are imported from global Tier 2 component and sub-assembly providers. Initially, the firm used sub-contractors to manufacture parts, but soon moved production in-house to improve quality. By 2001, Resemin had gained sufficient experience to enter production of final equipment, launching its first own-designed equipment that year. Relatively unsophisticated, the first drilling rig made by Resemin benefited from reverse engineering and adaptations of machines already in the market. Since then, the company has shifted to its own original designs, and their machines have become increasingly sophisticated, although under the concept of hard-wearing, easy and safe to use – suited to remote operating environments. In 2014, Resemin launched the Muki, an innovative and powerful drilling rig for operating in very small underground seams (<1.8 m), reducing production costs, increasing productivity and improving safety for underground mining. By 2015, the firm employed approximately 500 people in Peru, and another 1,500 employees globally.
Source: (International Mining, 2015; Roca, 2013)
17 For a total list of all products exported by Peru in these categories see Table 22, page 56.

36
4. Process Upgrading: As the mining sector in Peru became more internationalized with the entry of a number of global firms, local equipment manufacturers were forced to upgrade their processes in order to meet the demands of customers. This was most notable in areas of quality management and safety standards. International quality standards uptake in Peru has generally been slow with approximately 1,000 firms certified in ISO: 9001 by 2012 (Benzaquen de Las Casas, 2013). However, in the mining equipment manufacturing sector, a large number of firms – including all of the leading exporters – have obtained these certifications (CDI, 2015). The Centro de Desarrollo Industrial-SNI provides specialized training to help firms obtain these certifications. In the area of safety, even though international certification has been limited, manufacturers have become more aware of the importance of safety protocols – e.g., the use of protective equipment and limiting unauthorized movement through production facilities – since they are required to follow strict safety protocols when visiting the mining operations (Field Research, 2015).
There has been less upgrading of actual production processes. Few firms invested in more sophisticated machinery such as CNC machines. This is partly due to low labor costs, which continue to permit many operations to be carried out by hand, but also a function of availability of capital to justify the investments. With just a few firms improving the technological sophistication of their production processes, opportunities for spillovers into the rest of the manufacturing sector remain limited.
5. End-Markets: Regional markets such as Chile, Mexico and the US dominate Peru’s exports, particularly in the mineral processing segment where geographic proximity is advantageous due to the size and value ratio of the equipment. For example, as shown in Table 12, Chile alone accounted for more than 23% of this equipment segment between 2003 and 2013. While proximity to the large Chilean market has helped drive overall export growth, the region also contributes to capability development for Peruvian firms. First, the high standards demanded by Chilean firms may have helped to foster process and product upgrading among Peruvian manufacturers. Chilean miners tend to operate on the technological frontier. There are over 5 Centers of Excellence of global engineering firms based in Chile, while the Australian national research institute CSIRO established a branch in Chile to maximize on the country’s deep industry knowledge. Firms in the country thus are very demanding of their suppliers. Labor productivity in the sector is six times greater than in manufacturing overall (Korinek, 2012). Second, as a result of the presence of numerous global miners and engineers, there is a high rotation of personnel between Chile, Peru and other mines around the world. Having used Peruvian suppliers to support Chilean operations due to convenience, these clients may be more willing to work with Peruvian suppliers when they are relocated. For example, the experience of Resemin’s expansion into sub-Saharan Africa was largely attributed to this flow of procurement and operations staff from Peru to other parts of the world. The company now has over 1,500 employees outside of Peru.

37
Table 11. Peru's Top Five Mining Surface and Underground (MUS) Intermediate & Final Equipment Export Destinations, by Value, by Year, 2003-2013
Importer Value ($, Millions) Share (%) 2003 2005 2007 2009 2011 2013 2003 2005 2007 2009 2011 2013
World 4 16 16 26 57 60 Mexico -- 2 2 3 10 10 -- 9.5 11.2 10.7 17.3 17.0 Chile 1 -- 2 9 9 10 11.9 -- 10.9 36.1 15.0 16.9 Australia -- -- -- -- -- 8 -- -- -- -- -- 13.7 USA 1 3 2 3 12 7 13.9 16.9 12.1 9.7 21.3 11.8 Canada 0 -- -- -- 4 6 8.2 -- -- -- 7.2 9.3 Colombia -- -- -- 3 3 -- -- -- -- 10.0 6.1 -- Ecuador 1 1 1 4 -- -- 19.2 6.9 8.3 14.6 -- -- Bolivia -- -- 4 -- -- -- -- -- 22.3 -- -- -- Venezuela 1 4 -- -- -- -- 15.8 23.5 -- -- -- -- Argentina -- 3 -- -- -- -- -- 17.5 -- -- -- -- Top 5 3 12 10 21 38 41 68.9 74.3 64.8 81.0 66.9 68.6
Source: UNCOMTRADE, HS92, Peru's exports represented by partner imports
Table 12. Peru's Top Five Mineral Processing General (MPG) Intermediate & Final Equipment Export Destinations, by Value, by Year, 2003-2013
Exporter Value ($, Millions) Share (%) 2003 2005 2007 2009 2011 2013 2003 2005 2007 2009 2011 2013
World 6 24 33 48 32 41 Chile 1 12 10 19 8 17 23.9 52.3 29.4 38.4 24.7 40.8 USA 1 5 9 5 6 6 16.0 20.0 25.7 10.5 17.4 15.1 Mexico -- -- 2 -- 4 4 -- -- 5.3 -- 11.6 8.7 Canada -- -- -- -- -- 2 -- -- -- -- -- 5.8 Bolivia 1 1 2 4 3 2 14.7 4.5 5.8 8.2 8.0 5.4 Ecuador -- -- -- -- 3 -- -- -- -- -- 8.6 -- Dominican Rep. -- -- -- 3 -- -- -- -- -- 6.8 -- -- Colombia -- -- -- 3 -- -- -- -- -- 6.3 -- -- Denmark -- 1 2 -- -- -- -- 4.1 5.7 -- -- -- Venezuela 0 1 -- -- -- -- 8.0 5.7 -- -- -- -- Turkey 0 -- -- -- -- -- 6.8 -- -- -- -- -- Top 5 4 21 24 34 22 31 69.4 86.6 71.9 70.2 70.3 75.7
Source: UNCOMTRADE, HS92, Peru's exports represented by partner imports
6. Backward Linkages: With the exception of foundries, firm interviews suggested there has been very little development of backward linkages in the mining equipment value chain. Components and subassemblies account for the largest share of firm imports, followed by iron and steel and plastics (SUNAT, 2015).18 The reliance on imported components and subassemblies is central for competitiveness. One firm highlighted that in order for their final equipment to compete with global leaders such as Atlas Copco and Sandvik, they need to use many of the same component suppliers. These suppliers do not have operations in Peru, and manufacturers indicated that even those with representation in the country were not able to ensure timely and adequate supply of inputs (Field Research, 2015). Imports of these components primarily originate in the US, Brazil, 18 This is based on the analysis of imports of the top 15 manufacturing companies in Peru.

38
Finland and Korea (SUNAT, 2015). Similarly, several firms indicated that the local steel production did not meet their technical requirements and that the quality of imported steel available from local brokers was questionable. Firms were thus shifting towards a model of direct import for their steel requirements.
Foundries, which account for a large share of the country’s wear parts exports, have developed stronger backward linkages with steel recyclers. These operations, however, are difficult to quantify due to the informal nature of the recycling sector in Peru. Individual collectors gather together steel bits for recycling and, as a result in the collection process, there is very little record-keeping. This segment provides important dual services for the economy – almost all raw materials for the foundries, which account for some 40% of the country’s mining equipment exports, are recycled materials from within Peru. Thus not only generating a source of foreign exchange, but also contributing to cleaning the environment.
7. Weak Inter-Sectoral Upgrading: Finally, the export composition of the leading exporters is also highly concentrated in mining. This weak diversification into other sectors, including agriculture, fishery, and oil and gas, increases the vulnerability of these firms to the cyclical nature of the commodities industry. For half of the top 22 exporters, mining equipment exports account for over 80% of the total. Concentration is even higher in the leading five companies, which account for approximately half of all exports in the sector; mining exports account for over 95% of their exports (SUNAT, 2015). This concentration intensified between 2000 and 2012. This is much higher than in other equipment exporting countries, such as Australia and Canada, where mining equipment exports account for approximately 50% of the firms’ exports (Scott-Kemmis, 2011).
3.3 Mining Equipment Industry Institutionalization in Peru: Local Context for GVC Participation
In the mining equipment industry there is no real coordination amongst the sector stakeholders. The majority of the initiatives have originated in the private sector although without the support of other key industry actors and even with other companies in the same industry. This lack of collaboration has resulted in problems to fully understand the needs of the sector and develop a medium to long-term sector strategy. Table 9 highlights the main industry stakeholders in Peru and describes the role each plays in shaping the industry dynamics at the local level.

39
Table 13. Primary Stakeholders in the Mining Equipment GVC in Peru
Stakeholder Description Level of Importance19
Power and influence20
Local Components and Equipment Manufacturers
Local firms involved in the fabrication of components and equipment. These firms include foundries, metal work operations and final equipment manufacturing.
High High
Foreign OEM Representatives
Foreign OEM distributors and manufacturing operations; these representatives are primarily focused on serving the domestic mining demand. There is little interaction between these firms and the local metal-mechanics operations.
High High
Medium and Large Mining Companies
These mines based in Peru have driven the demand for world-class mining equipment, components and wear parts; these operations also provide a testing ground for new equipment.
High High
Sociedad Nacional de Industria – Metal-mechanics Committee
Broad industry association representing the metal-mechanics sectors; groups all metal-mechanic firms under 9 sub-committees.
Medium Medium
Asociación de Empresas Privadas Metalmecánicas de Perú (AEPME)
Industry association representing 25 metal-mechanics companies; the majority of these firms are primarily focused on supplying structural elements for mine and processing plant construction.
Low Low
Government of Peru – Ministry of Mines
Ministry responsible for the approval of new mining projects. Decisions affect potential demand for new equipment.
Medium Low
Prom-Peru Agency responsible for export promotion; primarily support SMEs, recently included metal mechanics in the 2015 Export Plan. Currently work with approximately 50 firms in all areas of metal mechanics.
Medium Low
Technical Educational Institutions
SENATI is the primary technical institution developing human capital to work in the sector; offer 15 different programs for the sector, several of which include apprenticeship tracks with placement in firms. TECSUP also have programs specific to metalmechanics and equipment maintenance with campuses in Lima and Arequipa. These educational institutions have several internship programs with companies in the sector.
High Low
Source: Authors.
19 The level of importance describes the relevance of the actor in the operation of the value chain activities. 20 Power and influence describes the level of control the actor has over the value chain operations and development.

40
Local component and equipment manufacturers do not coordinate their activities within the value chain. The SNI is one association that groups the private sector; however, it is often too broad in the type of companies that it represents. The organization groups manufacturers of cooking utensils together with sophisticated drilling equipment manufacturers. The Asociación de Empresas Privadas Metalmecánicas de Perú (AEPME) is another new industry organization, but it is not representative of the sector, as members are primarily focused on the provision of structural metal items for the construction of mines and processing plants. In addition to a lack of local organizations, there is no forum that brings together foreign OEM distributors with local manufacturers. Such a forum could provide an important opportunity for foreign firms to identify manufacturers to supply components, particularly wear parts locally and thus develop new backward linkages.
Government institutions are not involved in the sector, and overall, there is a general lack of leadership for the development of a sector strategy or work plan for its growth. PromPeru offers support to smaller firms, but the companies that usually export are medium-sized, and the small firms are not competitive internationally. The sector also lacks coordination with the educational sector, which fails to graduate human capital with sufficient skills. Many of their programs do not meet the international standards required by the industry.
Upgrading and Spillovers: The lack of connections between firms and other stakeholders combined with the concentration of firms in the mining sector provides few opportunities to generate synergies or spillovers for the overall economy. The product and process upgrading trajectories described above have largely been the result of a demand effect, driven by the interaction of firms with their buyers and some employment rotation, rather than knowledge and technology spillovers across firms operating in the industry. As noted earlier on, firms tend to operate in isolation, with no effective industry association bringing them together to share experiences and limited backward linkages across the sector. Furthermore, there was little evidence of interaction between the sector and academic institutions, although one firm, SERMINSA, was beginning to work with the engineering faculty at the Catholic University.
There are also weak linkages with the numerous other metal-mechanics firms serving the mining sector. Many of these opted to specialize in structural elements for mine and plant construction, which were in high demand as the domestic mining industry grew. Production of metallic structures more than tripled in volume between 2003 and 2012 (PRODUCE, 2013). These firms have been relatively successful in establishing an opening with the mining and engineering firms within Peru and abroad. Combined sales reached approximately US$1 billion in 2013 and the 25 firms in the sector employed close to 50,000 (El Comercio, 2014). Firms have adapted to the challenging conditions and high standards of mining operations in Peru, achieving ISO certifications and providing services and products tailored to the mine needs. These firms have also contributed to the export market, including providing engineering and design services for the construction of plants in other countries in Latin America and the Caribbean. However, there has been little cross-over between these firms meeting demand for metallic structures and those serving the mining capital equipment value chain, and thus few opportunities to leverage lessons learned for the mining equipment chain.

41
3.3.1 Advantages and Constraints for the Mining Equipment Industry in Peru
To date, Peru’s entry into the mining equipment GVC has been limited. In order to drive industry growth and upgrading, the country has to leverage its competitive advantages in mining, geographic proximity to major regional mining countries, and cheap energy. It also needs to overcome the numerous constraints to the future development of the sector. Some of those constraints are transversal to numerous Peruvian industries, while others are specific to the mining equipment sector. This section discusses the advantages and constraints of Peru’s current economic, social and institutional context for upgrading in the value chain.
Table 14. Summary of Key Advantages and Constraints for Industry Upgrading
Advantages Constraints Diverse geological features offers good testing field for new product development
Shortage of qualified human capital, particularly amongst welders can increase labor costs
Geographic proximity to regional mining center can drive demand
Absence of raw materials for key inputs increases dependence on imports and corresponding import logistics and procedures
Low energy costs reduce costs of production Poor quality perception undermines sales of both intermediate and final goods
General business environment reducing productivity, particularly regarding zoning, infrastructure and customs
Advantages
Diverse terrain offers good testing field for new product development: With a strong domestic mining presence and a wide range of geological features, combined with both underground and surface mining, Peru offers an interesting testing ground for new equipment and a good environment for product development (E&MJ, 2014). Programs such as Antamina’s supplier development program provide suppliers with access to the mines, allowing them to identify and test potential solutions to the mines’ challenges. The newly passed R&D law (see Box 5) offers tax incentives to both domestic and foreign firms to perform R&D in the country.
Geographic proximity to mining centers in the region: Peru is located at the center of Latin America’s mining region, which represents a range of mining types and levels of sophistication. Argentina, Brazil and Chile have more mature mining sectors, while Bolivia, Colombia, and Ecuador represent important emerging markets. Chile alone accounted for 26% of Peru’s mining equipment exports in 2013 (UN Comtrade, 2015). This provides an important competitive advantage, particularly with respect to large and extremely heavy items, which have higher shipping costs from other parts of the world. Nonetheless, in order to benefit from these markets, significant improvements need to be made in Peru’s road, rail and port infrastructure and services. The weaknesses in these areas currently erode the advantages afforded by geographic proximity. Additionally, these improvements will also be required to serve the local markets. One firm highlighted that they evaluated transporting some oversized equipment by sea from Callao to a southern port to a client in the south of Peru, but that due to lack of competition in the local shipping lanes which are not open to international carriers, this was more than double the price of shipping by land.
Low Energy Costs: Peru offers further advantages to equipment manufacturers in terms of relatively low energy costs. Although the US has highly competitive energy costs,

42
those in other traditional manufacturing hubs for surface and underground mining countries, Germany and Japan, were double those of Peru in 2013. Costs are also lower in Peru with respect to other traditional and emerging countries in the mineral processing segment – Italy, Finland, Sweden and Turkey.
Figure 7. Industrial Electricity Prices, Select Countries 2013
Source: (International Energy Agency, 2014); (Osinergmin, 2013)
Note: *second trimester 2013
6.82 7.48 9.04
9.92 10.66 12.15 12.60
14.67 16.93 17.42
32.17
0
5
10
15
20
25
30
35
USA Peru* Sweden Brazil* Finland Mexico France Turkey Germany Japan Italy
US$
cen
ts/k
Wh

43
Box 5. Incentivizing R&D in Mining Equipment GVC in Peru
As mining equipment suppliers seek to develop more efficient machines and better functioning parts and components, important investments must be made in R&D, including prototype development and testing. For example, the Program for the Development of Suppliers of Excellence, a project launched by Antamina, one of Peru’s largest copper mines, brings together Peruvian based suppliers to solve challenges faced by the mine. One of the solutions offered included an additional layer of tread applied to the dump truck tires, which increased life of the tires by 45%. These investments in prototype development are expensive and often beyond the scope of domestic firms.
In March 2015, the Government of Peru introduced a new law aimed to increase private investment in innovation, research and business development through tax incentives, called the “Law for the Promotion of Scientific Research, Technological Development and Technological Innovation (Nº 30309)”. This new law can help to support R&D expenses required by the sector. Businesses will be eligible to receive additional tax deductions for expenses incurred in scientific research, technological development and innovation (R&D). The additional deductions reduce net income from which the income tax is calculated. To a large extent, the law reduces taxes in proportion to R&D spending to a factor of 1.5 or 1.75. The amount of additional deduction depends on whether the project is carried out by taxpayers domiciled in the country or abroad:
Deduction of
Expenses Domicile Annual Limit by company CONCYTEC
Approval 100% Peruvian or foreigner No No 150% Taxpayer domiciled abroad 1335 UIT (tax units) or USD
1.64 million approximately Yes
175% Taxpayer domiciled in Peru Yes
Any company, regardless of size or sector, can apply for this deduction. Companies can invest within their lines of business or not. The projects can be executed directly by the companies or technological and scientific research centers. Projects must be qualified by the National Council for Science, Technology and Technological Innovation (CONCYTEC) or other technological institutions to be determined, in order to be eligible to the additional tax deductions. This requirement is waived if companies decide to deduct only 100 percent of R&D spending.
There is an annual limit for the additional tax deduction received by a company, equivalent to 1335 UIT (tax unit) or about US $1.64 million. The Ministry of Economy and Finance will establish an annual cap for overall tax deduction in the country. The tax benefits will be available from 2016 until 2019; however, spending on 2014 and 2015 could also be eligible as long as the projects were not previously reviewed by CONCYTEC under the Law Nº 30056.
The new law is built upon Law No 30056 introduced in 2013, under which companies could deduct up to 100 % of R&D expenses. The law proved unsuccessful in promoting private spending in R&D due to its inability to provide real economic incentives and firm concerns about confidentiality as details of the innovations were required to secure the deduction. The norm regulating the new law is pending and should address aspects such as institutions with authority to review and approve projects besides CONCYTEC, the criteria to qualify projects, and the eligibility criteria for projects carried out in 2014 and 2015, among other aspects.
Source: (Congreso de la Republica, 2015; PRODUCE, 2015)

44
Constraints
Shortage of qualified human capital: Overall, there is a shortage of qualified human capital for the sector, from production lines to management. This is partly due to a lack of available training programs catering to the specific needs of the industry, the strong growth of the mining sector in the past decade and due to the waning interest of the younger generations to work in the metal-mechanics sector. While there are two technical institutions (e.g. SENATI and TECSUP) and several universities (e.g. Pontificia Universidad Católica de Perú and Universidad Nacional de Ingeniera de Perú) that train both technical and professional human capital for the sector, there is limited specialization in these courses. The majority of the companies interviewed highlighted that graduates typically need to undergo extensive further training once they enter the workforce (Field Research, 2015). Efforts have been made in terms of technical programs to develop internship programs with the companies to provide students with more hands-on experience, but the number of places in these programs is limited.
Absence of raw materials and key components increases importance of lower cost and efficient logistics: Peru does not produce the particular types of steel required by the sector, and due to the limited potential size of the market, local steel producers are unlikely to make the investment to produce the steel with these specifications. Metal-mechanics firms serving the mining equipment sector will thus continue to rely on the imports of these raw materials, as well as other components such as motors, in order to drive their participation in the GVC. This places important emphasis on the need to streamline and minimize logistics costs. Currently, due to the comparatively smaller export volumes shipped to and from Peru, shipping costs can be up to double those of Chile (Field Research, 2015). This increases the cost of shipping for both imports and exports and reduces Peru’s competitiveness as a manufacturer in the sector. For example, one OEM representative mentioned that importing the raw materials to be manufacturing in Peru would be more expensive than importing the finished component.
Poor Quality Perception of ‘Made in Peru’: Peru is a relative new comer to the mining equipment industry, which, as highlighted earlier in the paper, continues to be dominated by traditional manufacturing centers in the US, Europe and Japan. These centers are renown for their quality in production. Peru, on the other hand, is yet to develop a reputation as a quality production center. Exporters highlight that a key challenge they face in opening up new markets abroad is to demonstrate the quality of Peruvian equipment. Despite offering prices of 20-30% below that of global competitors (Field Research, 2015), together with a wide range of after-market services, this continues to be a difficult sell. As global manufacturers seek to shift production offshore to more economical locations, highlighting the quality of Peruvian production will become very import in order to attract investment.
General business environment: Although the country has made important advances in improving the business environment, shortcomings continue to add to administrative and production costs in the country and delay progress in the sector. Construction and zoning of land together with the facilitation of energy and water lines to new locations remain a problem. Several firms in the sector are interested in moving their industrial operations to the city outskirts as the rising demand for land in Lima and Callao has limited their expansion capacity, however, they highlight that relocation has been significantly delayed by slow processes. One firm, for example, indicated that their plans to relocate had been postponed numerous times over a four year period due to zoning and regulatory issues. As the firm had already reached its maximum capacity in its current location, these delays

45
were hampering further company growth (Field Research, 2015). Corruption,21
informality and excessive auditing of formal enterprises all add to administrative costs and delay firms’ import and export procedures – affecting their ability to meet client expectations, not only eroding price advantages, but jeopardizing hard earned market position.
4. Potential Upgrading Trajectories for the Mining Equipment Sector in Peru
4.1 Upgrading Trajectories
Upgrading in the mining equipment sector can help Peru to increase the benefits derived from its natural resources, improving mining operation efficiency while at the same time establishing backward linkages for the sector. Although the mining sector is currently marked by uncertainty, the vast range of resources in the country will eventually be exploited. While resources in other mining countries, such as Canada and South Africa, are entering the later stages of their exploitation, Peru is just getting started and, upgrading strategies taken to support the growth of the mining equipment sector today, can help to generate benefits for the country in the future. In addition, upgrading will ensure that those firms that have already successfully entered the GVC can increase their competitiveness – which is essential in the current commodities downturn.
However, Peru needs to focus its efforts if it is to succeed in the mining equipment GVC – firstly, like South Africa, Peru should focus one or two specific areas of expertise to build a critical mass to gain credibility. Second, it needs to consolidate its position as a wear parts provider within those segments, and begin to leverage relationships with clients to produce permanent components. Third, all around process upgrading is required to increase the efficiency, highlight that local firms can meet global standards, and improve their technological processes, amongst others. Finally, those firms that are already competing need to diversify their base into other segments in order to mitigate the risk of overexposure to the mining sector.
First, however, specific areas of expertise need to be identified. Peru is essentially breaking into a market that is currently highly competitive and dominated by lead firms in developed countries with a strong focus on quality. As a result, the country needs to build depth in the industry and establish credibility as a provider by focusing on expertise. This is a similar strategy as that pursued in the development of South Africa’s mining equipment sector, in which, understanding that they could not be competitive in all segments, the country leveraged its skills developed in deep gold extraction and removing high levels of impurities. To date, Peru has demonstrated success in two key areas – underground mining and mineral processing as a result of its particular geological conditions. These two product categories offer interesting market potential for Peru – accounting for approximately 1/5 of global demand, as they have proven more open to competition for new countries than the surface mining equipment segments. Furthermore, focusing on issues of simplicity and reduced human capital requirements can help gain traction in developing country markets where isolation and low supply of qualified staff are important considerations.
21 Peru is ranked 85/175 countries by Transparency International in 2014.

46
Table 15. Recommended Upgrading Trajectories
Product Upgrading & Process Upgrading
• Improve the quality of products emerging from Peru’s • Shift perceptions of the existing quality, particularly in core
product segments of underground mining and mineral processing • Obtain the core international certifications (ISO 9000, ISO 14000
and OHSAS 18000 • Invest in new technologies • Enhance labor productivity through skill development
Product Consolidation in Wear Parts and Relatively Simple Components
• Continue to expand wear parts production • Improve product quality and processes • Move into simple permanent components manufacture for existing
wear part clients Diversify into New End Markets
• Leverage skills in mining equipment for agriculture, fishing and oil and gas sectors to drive spillovers into other segments of the economy and reduce vulnerability to commodities cycles
Product Upgrading & Process Upgrading
Overcoming the perception of poor product quality is a key challenge for Peru’s final equipment and component producers alike. Efforts need to be made not only to improve the quality of products emerging from Peru’s operations but also to shift perceptions of the existing quality, particularly in core product segments of underground mining and mineral processing. Firms need to obtain the core international certifications (ISO 9000, ISO 14000 and OHSAS 18000) to help signal their commitment to the quality and safety standards of global buyers. The adoption of these standards will also help to improve firm productivity.
New technologies need to be integrated in the production operations of local firms. Many of the firms are operating using outdated equipment and processes, relying on labor rather than capital equipment for production. For example, few firms use computer-aided design, CNC machining, or advanced project management and accounting software. Adopting these new technologies is essential for these firms integrate into sophisticated foreign supply chains. The emphasis on engineering, protocols and project management required has potential spillovers for the rest of the economy (Kaplan 2011).
There are also opportunities to enhance labor productivity in the sector through skills development. The declining interest in manufacturing in Peru is making it more difficult to attract young, ambitious workers to the sector. Improving the perception of the sector’s contribution to the economy and the innovative nature of the work begin undertaken could help to attract more qualified individuals. Training in particular job categories, such as for welders, would provide important direct spillovers for both the construction and mining sectors as rotation between the three is high. This can help both increase productivity, but also improve quality and safety protocols.
Product Consolidation in Wear Parts and Relatively Simple Components:
Although wear parts are relatively low value products, they provide an important foundation from which Peruvian firms can expand their product lines and develop new capabilities. These parts have a constant rotation and therefore generate ongoing demand over time, providing their suppliers with cash flow. The design functions involved in the development of these products also provide skills development for component and sub-assemblies manufacturing. For those firms that have already demonstrated success to

47
foreign buyers in the production of wear parts, there is an opportunity to upgrade into the production of components for capital equipment. Entering with relatively simple permanent components, such as scoops or buckets, can help firms to gain access to the supply chains of different firms and in doing so prove their production capabilities and quality to these buyers. Several firms to date have developed important skills in terms of fabrication design and engineering plans, however, this next step will depend significantly on improving long-term durability and quality as well as ensuring high labor productivity.
Diversify into New End Markets:
The exports of the leading Peruvian firms are more highly concentrated in the mining sector than other countries such as Australia and Canada that supply equipment. Almost all major global firms are diversified, including equipment sales in agriculture, construction, oil and gas and water and waste management amongst others. Over reliance on the mining sector increases exposure to commodity down cycles and heightens the potential for firm closure. Furthermore, concentration in mining limits spillovers from process upgrading into the rest of the economy Peruvian companies thus need to explore opportunities to leverage the skills developed to date in the mining equipment sector to enter into the agricultural, fishery and potentially, oil and gas sectors. Peru has production in all three areas, and entry strategies can be based on the provision of spare parts for these sectors. As firms serving the mining sector have been forced to operate with higher level of efficiency and safety to date, these operational efficiencies can also help improve those in the agro and fishery sectors. Many of South Africa’s mining equipment companies, for example, faced a critical juncture in their development in 2012 when a series of strikes all but brought domestic mining to a halt (Taylor, 2012). One of the key tools they promoted was to diversify into new end markets.

48
5. Bibliography Accenture. (2010). Anglo American Takes Steps Towards High Performance by
Transforming Procurement. London: Accenture. Anglo American. (2008). Annual Report London: Anglo American. 2008.
http://ar08.angloamerican.solutions.investis.com/ofr/perf/investment/. Austmine. (2014). Australia's New Driver of Growth: Mining Equipment, Technology
and Services. Sydney: Department of Industry, Innovation, Climate Change, Science, Research and Tertiary Education
Australian Mining. (2014). Sandvik to move manufacturing offshore. Australian Mining. June 27 from http://www.miningaustralia.com.au/news/sandvik-to-move-manufacturing-offshore.
Bartos, Paul J. (2007). "Is mining a high-tech industry?: Investigations into innovation and productivity advance." Resources Policy, 32(4): 149-158.
Bebbington, Anthony, Denise Humphreys Bebbington, Jeffrey Bury, Jeannet Lingan, Juan Pablo Muñoz, and Martin Scurrah. (2008). "Mining and social movements: struggles over livelihood and rural territorial development in the Andes." World Development, 36(12): 2888-2905.
Benzaquen de Las Casas, Jorge. (2013). "La ISO 9001 y TQM en las empresas latinoamericanas: Peru." Globalizacion, Competividad y Gobernabilidad, 8(1): 67-89.
Burgess-Limerick, Robin, Jim Joy, Tristan Cooke, and Tim Horberry. (2012). "EDEEP-An Innovative Process for Improving the Safety of Mining Equipment." Minerals, 2(4): 272-282.
Canadian Chamber of Commerce. (2013). Mining Capital: How Canada has Transformed its Resource Endowment into a Global Competitive Advantage. : The Canadian Chamber of Commerce. January
Career Pathways. (2015). Virginia Peninsula Career Pathways in Advanced & Precision Technologies in Manufacturing Retrieved June, 2015, from http://www.virginiapeninsulacareerpathways.com/.
Carter, Russell A. (2010). "Engine Builders Roll Out Models to Meet 2011 Standards." [Article]. Engineering & Mining Journal (00958948), 211(10): 96-101.
Caterpillar. (2013). Annual Report. Peoria: Caterpillar Inc. CDI. (2015). Empresas Certificadas con ISO 9001 en el Peru. Retrieved June 2015,
from http://www.cdi.org.pe/asist_empcertISO9000-010.htm. Congreso de la Republica. (2015). Ley No 30309. Lima: Congreso de la Republica de
Perú. 13 March 2015. Craven, Peter. (2014). "Delivering Processing Systems That Are Fit for Purpose."
[Article]. Engineering & Mining Journal (00958948), 215(8): 126-128. E&MJ. (2012). "Raising the Bar." [Article]. Engineering & Mining Journal
(00958948), 213(10): 94-98. ---. (2014). "Mining in Peru: Equipment." Engineering & Mining Journal: 108-111. El Comercio. (2014). Sector metalmecanico mantendria su produccion en el 2014. El
Comerico. February 27 Retrieved February 2015, from http://elcomercio.pe/economia/peru/sector-metalmecanico-mantendria-su-produccion-2014-noticia-1712647.

49
EngineerLive. (2013). Renting capital equipment in African mining industry grows. from http://www.engineerlive.com/content/renting-capital-equipment-african-mining-industry-grows.
"An Ever-Increasing Range of Providers." (2011). [Article]. Engineering & Mining Journal (00958948), 212(2): 92-96.
EY. (2014). Peru's Mining and Metals Investment Guide 2014/2015. Lima: EY Peru. Farooki, Masuma. (2012). "The diversification of the global mining equipment
industry – Going new places?". Resources Policy, 37(4): 417-424. Field Research. (2015). Peru Interview Series. Personal communication with K.
Fernandez-Stark & P. Bamber. March 16-27. Financial Times. (2013). Mining Equipment. Financial Times. November 5 Retrieved
February 2015, Fleming, Nic. (2014). Belaz 75710: The Giant Dumptruck from Belarus. BBC Online.
December 4 Retrieved February 2015, from http://www.bbc.com/future/story/20141203-the-ultimate-monster-dumptruck.
Fundación Chile. (2013). Proveedores de la Minería Chilena: Estudio de Caracterización 2012. Santiago, Chile: Fundición Chile. http://desarrolloproveedores.cl/dp/wp-content/uploads/2012/11/Estudio-caracterizacion-proveedores-mineria-20121.pdf?d10dda.
---. (2014). Proveedores de la Minería Chilena: Estudio de Caracterización 2014. Santiago, Chile: Fundición Chile. http://desarrolloproveedores.cl/dp/wp-content/uploads/2012/11/Estudio-caracterizacion-proveedores-mineria-20121.pdf?d10dda.
Glave, Manuel and Juana Kiramoto. (2007). La Minería Peruana: lo que sabemos y lo que aún nos falta por saber: Grade. http://www.grade.org.pe.
Grand View Research. (2014). Mining Equipment Market Analysis and Segment Forecases to 2020. San Francisco: Grand View Research March.
Ingenieros del Cobre y Mineria. (2014, February 3). Empresas en Ruta a la Clase Mundial Ingenieros del Cobre y Mineria.
International Energy Agency. (2014). Key World Energy Statistics. https://http://www.iea.org/publications/freepublications/publication/key-world-energy-statistics-2014.html.
International Mining. (2011). Operating and Surviving as OEMs in BRIC. Conference: International Mining Industry Forum, Las Vegas. July
---. (2015). "RESEMin addresses narrow vein drilling with Muki." International Mining 6.
Jerez, Diego. (2012). Desde operadores de maquinaria pesada hasta cajeros... Los oficios que mas escasean en tiempo de "pleno empleo". La Segunda. December 8 Retrieved February 2015, from http://www.lasegunda.com/Noticias/Economia/2012/12/804236/desde-operadores-de-maquinaria-pesada-hasta-cajeros-los-oficios-que-mas-escasean-en-tiempos-de-pleno-empleo.
Kaplan, David. (2012). "South African mining equipment and specialist services: Technological capacity, export performance and policy." Resources Policy, 37: 425-433.
Komatsu. (2014). Komatsu Report Tokyo: Komatsu. http://www.komatsu.com/CompanyInfo/ir/annual/html/2014/topics/existing.html - anchor01_2.

50
Korinek, Jane. (2012). Mineral Resource Trade in Chile: Contribution to Development and Policy Implications. Paris: Organisation for Economic Co-operation and Development.
Latinominería. (2013). Joy Global Inaguró Centro de Servicios de Clase Mundical en Antofagasta. Latinominería. December 3, 2013 Retrieved Feburary 2015, from http://www.latinomineria.com/2013/12/joy-global-inauguro-centro-de-servicios-de-clase-mundial-en-antofagasta/
Liebherr. (2015). The Liebherr Reman Program. Ettlingen: Liebherr. Lydall, Marian. (2009). "Backward linkage development in the South African PGM
industry: A case study." Resources Policy, 34(3): 112-120. Mendoza, Cecilia. (2012). Los trabajos con los sueldos que todos quieren: La
República. Metso Corporation. (2014). The joint venture between Metso and LiuGong will
develop the Chinese track-mounted crushing and screening business. Retrieved February, 2015, from http://www.metso.com/news/2014/2/the-joint-venture-between-metso-and-liugong-will-develop-the-chinese-track-mounted-crushing-and-scre/.
MINEM. (2015). Cartera estimada de proyectos mineros: Ministerio de Energía y Minas. http://www.minem.gob.pe/.
Minería Chile. (2013). Barrio Industrial La Negra se consolida como eje estrategico de servicios. Minería Chile. Retrieved February 2015, from http://www.mch.cl/2013/07/11/barrio-industrial-la-negra-se-consolida-como-eje-estrategico-de-servicios/
---. (2014). Nuevos centros de servicios en la región: Aliados estratégicos en Antofagasta. Minería Chile. Retrieved February 2015, from http://www.mch.cl/reportajes/nuevos-centros-de-servicios-en-la-region-aliados-estrategicos-en-antofagasta/.
Mining Standards and Guidelines Committee. (2015). Global Mining Standards and Guidelines Group. Retrieved March 2015, from http://www.globalminingstandards.org/.
Mining-Technology. (2013). The world's biggest mining dump trucks. from http://www.mining-technology.com/features/feature-the-worlds-biggest-mining-dump-trucks.
Osinergmin. (2013). Tarifas Eléctricas en Latinoamérica: 2do Trimestre de 2013. from http://www2.osinerg.gob.pe/Publicaciones/pdf/TasasInternacionales/TarifasInternacionales_Junio2013.pdf.
Outotec. (2015). Sustainable use of Earth’s natural resources. Peninsula Council for Workforce Development. (2012). Roadmap to Success:
Virginia Peninsula Strategic Plan for Career Pathways in Advanced and Precision Manufacturing Technologies 2012 – 2016.
http://www.pcfwd.org/documents/StrategicPlan-PeninsulaCareerPathwaysinAdvancedandPrecisionManufacturingTechnologies-rv-PRIN.pdf.
Porter, Michael, Eric Snow and Kathleen Mitford. (2014). "Strategic Choices in Building the Smart Connected Mine." Harvard Business Review.
PRODUCE. (2013). "Anuario Estadístico Industrial, Mipyme y Comercio Interno 2012."
---. (2015). Incentivos tributarios para empresas que inviertan en innovación. Lima: Ministerio de Produción de Peru. March.
51
Reuters. (2015). Peruvian foes of Tia Maria copper mine expand month-long protest. Reuters. April 22 Retrieved June 2015, from http://www.reuters.com/article/2015/04/23/peru-mining-protests-idUSL1N0XJ2PB20150423.
Rio Tinto. (2013). Sustainable Development. Melbourne: Rio Tinto. ---. (2014). Mine of the Future. Melbourne: Rio Tinto Limited.
http://www.riotinto.com/documents/Mine_of_The_Future_Brochure.pdf. ---. (2015). Mine of the Future. from http://www.riotinto.com/ironore/mine-of-the-
future-9603.aspx. Ritter, A.R. M. (2000). Canada's "Mineral Cluster": Structure, Evolution, and
Functioning.CEPAL/IDRC. Conference: Seminario Internacional Sobre Clusters Mineros En America Latina, Santiago, Chile.
Robinson, David. (2004). Cluster Evolution: In Itself to For Itself. Observations from Sudbury's Mining Supply and Service Cluster. Sudbury: Laurentian University. http://sites.utoronto.ca/isrn/publications/WorkingPapers/Working04/Robinson04_Mining.pdf.
Roca, Adriana. (2013, 13 September). Máquinas que Conquistan. Poder, 30-34. Sánchez, Fabiana. (2013). Anualmente, solo 20 mil egresan como técnicos en el país:
Peru21. Sandvik. (2013). Sandvik implements initial phase of supply chain optimization
Retrieved February, 2015, from http://www.sandvik.com/en/news-and-media/news/2013/12/sandvik-implements-initial-phase-of-supply-chain-optimization/.
Scott-Kemmis, Don. (2011). The Formation of Australian Mining Technology Services and Equipment Suppliers. Sydney: United States Studies Centre, University of Sydney. November. http://ussc.edu.au/publications/The-formation-of-Australian-mining-technology-services-and-equipment-suppliers.
---. (2013). How about those METS? Leveraging Australia's Mining Equipment, Technology and Services Sector: MInerals Council of Australia. http://www.minerals.org.au/file_upload/files/publications/mca_how_about_those_METS_FINAL.pdf.
Sleight, Chris. (2015, April). The Yellow Table: Equipment Top 50. International Construction.
SNI. (2013). Industria Metal Mecanica Liders Sector. Lima: SNI Comites Metal Mecahnicos.
Spence, Robert. (2014). How to: Finance Mining Equipment. from http://www.miningglobal.com/machinery/1133/How-to:-Finance-Mining-Equipment.
SUNAT. (2015). Firm-Level Foreign Trade Database. Lima. Taylor, Joanne. (2012). Council Calls for Policy to Support Mining Equipment
Manufacturing Cluster. Mining Weekly. November 9 Retrieved February 2015, from http://www.miningweekly.com/article/catch-up-2012-11-09
Tenova Delkor. (2012). Tenova acquires Bateman Engineering: Tenova Delkor. Thomas Nelson. (2015). Thomas Nelson Welding Center Named Accredited Test
Facility, First in Hampton Roads. Hampton Road,s: TNCC. TMG. (2015). On Boarding Solutions: Liebherr Mining Equipment Retrieved
February, 2015, Tole, Lise and Gary Koop. (2013). "Estimating the impact on efficiency of the
adoption of a voluntary environmental standard: an empirical study of the

52
global copper mining industry." Journal of Productivity Analysis, 39(1): 35-45.
Tollinsky, Norm. (2013). "New Industrial Park Home to Three Mining Suppliers." Sudbury Mining Solutions Journal
U.S. Enviromental Protection Agency. (2014). Steel. Retrieved 6 April 2015 from http://www.epa.gov/wastes/conserve/materials/steel.htm.
UN Comtrade. (2015). UN Comtrade Database. from http://comtrade.un.org/. UNCTAD. (2007). World Investment Report 2007: Transnational Corporations,
Extractive Industries and Development. Geneva: United Nations Conference on Trade and Development.
Walker, M. I. and R. C. A. Minnitt. (2006). "Understanding the dynamics and competitiveness of the South African minerals inputs cluster." Resources Policy, 31(1): 12-26.
Waszkis, Helmut. (1993). Mining in the Americas: Stories and History (1 edition ed.): Woodhead Publishing.
6. Appendices
6.1 Appendix A. Product Categories
Table 16. Surface and Underground Mining Equipment
HS-Code Description Value Chain
Segment 842911 Bulldozers and angledozers :-- Track laying Final Equipment 842919 Bulldozers and angledozers :-- Other Final Equipment 842920 Graders and levellers Final Equipment 842930 Scrapers Final Equipment 842940 Tamping machines and road rollers Final Equipment
842951 Mechanical shovels, excavators and shovel loaders :- Front-end shovel loaders Final Equipment
842952 Mechanical shovels, excavators and shovel loaders :-- Machinery with a 360( revolving superstructure Final Equipment
842959 Mechanical shovels, excavators and shovel loaders :-- Other Final Equipment 843010 Pile-drivers and pile-extractors Final Equipment
843031 Coal or rock cutters and tunnelling machinery :-- Self-propelled Final Equipment
843039 Coal or rock cutters and tunnelling machinery :- Other Final Equipment 843041 Other boring or sinking machinery :-- Self-propelled Final Equipment 843049 Other boring or sinking machinery :-- Other Final Equipment 843050 Other machinery, self-propelled Final Equipment
843061 Other machinery, not self-propelled :-- Tamping or compacting machinery Final Equipment
843062 Other machinery, not self-propelled :- Scrapers Final Equipment 843069 Other machinery, not self-propelled :- Other Final Equipment
820713 Rock drilling or earth boring tools :-- With working part of cermets Final Equipment
870130 Track-laying tractors Final Equipment 870410 Dump trucks designed for off-highway use Final Equipment 820712 Parts of rock drilling or earth boring tools except carbide Intermediates 843141 Buckets, shovels, grabs etc for excavating machinery Intermediates 843142 Bulldozer and angledozer blades Intermediates

53
843143 Parts of boring or sinking machinery Intermediates 843149 Parts of cranes, work-trucks, shovels, constr machine Intermediates
Table 17. Mineral Processing Equipment
HS-Code Description Value Chain Segment
845510 Tube mills Final Equipment 845521 Other rolling mills :-- Hot or combination hot and cold Final Equipment 845522 Other rolling mills :-- Cold Final Equipment 847410 Sorting, screening, separating or washing machines Final Equipment 847420 Crushing or grinding machines Final Equipment 847439 Mixing or kneading machines :-- Other Final Equipment 847480 Machines to agglomerate, shape, mould minerals or fuel Final Equipment 841370 Centrifugal pumps nes Final Equipment
841710 Furnaces and ovens for the roasting, melting or other heat-treatment of ores, pyrites or of metals Final Equipment
847982 Other machines and mechanical appliances :-- Mixing, kneading, crushing, grinding, screening, sifting, homogenising, emulsifying or stirring machines
Final Equipment
845530 Rolls for rolling mills Intermediates 845590 Other parts for rolling mills Intermediates
841790 Parts for Furnaces and ovens for the roasting, melting or other heat-treatment of ores, pyrites or of metals Intermediates
847490 Parts Intermediates 732591* Balls, iron or steel, cast, for grinding mills Intermediates
Note*: HS-732591 is not included in firm-level data
Table 18. Materials Handling Equipment
HS-Code Description Value Chain Segment
842831 Mine conveyors/elevators, continuous action Other continuous-action elevators and conveyors, for goods or materials :-- Specially designed for underground use
Final Equipment
842850 Mine wagon pushers, locomotive or wagon traversers, wagon tippers and similar railway wagon handling equipment
Final Equipment
842890 Other lifting handling or loading machinery Final Equipment 843131 Parts of lifts, skip hoist or escalators Intermediates 843139 Parts of lifting/handling machinery nes Intermediates 843110 Parts of hoists and winches Intermediates
Table 19. Wear Parts
HS-Code Description Value Chain Segment
732591 Balls, iron or steel, cast, for grinding mills Intermediates
841790 Parts for Furnaces and ovens for the roasting, melting or other heat-treatment of ores, pyrites or of metals Intermediates
843141 Buckets, shovels, grabs etc for excavating machinery Intermediates 843142 Bulldozer and angledozer blades Intermediates 843143 Parts of boring or sinking machinery Intermediates
843149 Parts of cranes, work-trucks, shovels, constr machine Intermediates

54
845530 Rolls for rolling mills Intermediates 845590 Other parts for rolling mills Intermediates 843139 Parts of lifting/handling machinery nes Intermediates
Note: Wear parts are included with original equipment at delivery and thus are considered intermediates for each type of mining equipment. However, these are pieces that must be replaced regularly during use and thus represent an interesting market as this has constant turn over, thus we examine these as a separate group as well.

55
6.2 Appendix B. Lead Firms in Engineering Services
Table 20. Engineering Lead Firms (Origin, Revenue, Ownership/HQ Location, Market Share)
Company - Headquarters
Sales USD (mil) 2008
Employees Main Activities
1 Bechtel Group Inc - US 31,400 49,000
Bechtel is one of the most prominent engineering, construction and project management companies. The company handles projects related to energy, transportation, communications, mining, and oil and gas industries. The company also handles projects related to government services.
2 Fluor
Corporation - US
22,326 42,119
Fluor delivers engineering, procurement and construction management (EPCM) projects as well as maintenance and project management to governments and clients in diverse industries around the world. Energy & Chemicals; Industrial & Infrastructure; Power; Chemicals and Petrochemicals; Commercial and Institutional; Government Services; Health-care; Life sciences; Manufacturing; microelectronics; Mining; oil and gas; Renewable energy; Telecommunications; and Transportation.
3 Balfour Beatty PLC - UK 15,142 41,030 Balfour Beatty plc is focused on Professional Services, Construction Services, Support
Services and Infrastructure Investments.
4 KBR - US 11,581 57,000 KBR is a leading global engineering, construction and services company supporting the energy, hydrocarbon, government services, minerals, civil infrastructure, power and industrial markets.
5 Jacobs
Engineering Group Inc - US
11,252 38,900 Project Services (engineering, design, architectural), Process, Scientific and Systems Consulting, Construction, Technology Services, Management services, Environmental, Health and Safety Services, Operations and Maintenance.
6 URS
Corporation - US
10,086 45,000
URS Corporation is a provider of engineering, construction and technical services. The company offers a range of program management, planning, design, engineering, construction and construction management, operations and maintenance, and decommissioning and closure services to public agencies and private sector clients worldwide.
7 SNC-Lavalin Group Inc. -
Canada 6,657 21,948
The Company provides engineering, project and construction management, construction, and operations and maintenance services through its network of offices located across Canada and in over 35 other countries. Key market sectors: Infrastructure, Environment, Chemical and petroleum, Power, Mining and Metallurgy, operations and maintenance, Infrastructure concession, Investments, Agrifoods.
8 CH2M HILL - US 6,400 25,744
CH2M Hill is an employee-owned firm that provides engineering, construction and related technical services for public and private clients. The company serves the water, energy, environmental, transportation, communications, construction and industrial sectors.
9 AECOM
Technology Corp. - US
5,200 45,000 AECOM is a global provider of professional technical and management support services to a broad range of markets, including transportation, facilities, environmental, energy, water and government.
10 JGC CORP. - Japan 4,821 4,723
JGC is a Japan-based company mainly engaged in the engineering business. Services: 1. Consulting, planning, basic and detailed design, materials and equipment procurement, construction, commissioning, operation and maintenance services for various plant and facilities; 2. Investment in oil and gas field development projects and utility business; 3. Technology development services
Source: Fernandez-Stark, Bamber & Gereffi, 2010.

56
6.3 Appendix C. Peru Product Exports and Raw Material Imports
Table 21. Top Ten Imported Raw Materials of Leading Exporters in Peru, 2012
Inputs Value
(US$, million) Alloy steel pipe or tubing 4.94 Bar/rod, alloy steel nes,nfw hot rolled/drawn/extruded 3.04 Chromium ores and concentrates 2.72 Ferro-molybdenum 1.40 Ferro-manganese, >2% carbon 1.26 Prepared binders for foundry moulds or cores 1.21 Phenolic resins, in primary forms 1.20 Ferro-chromium, >4% carbon 1.17 Polyurethanes in primary forms 1.16 Molybdenum concentrates, roasted 0.73
Note: Based on imports of the top 20 exporters.
Source: (SUNAT, 2015)
Table 22. Peru's Mining Equipment Exports, By Product 2003-2013
Year 2003 2005 2007 2009 2011 2013 Surface and Underground Intermediates 2 8 9 19 39 30
Buckets, shovels, grabs etc for excavating machinery 0 0 0 2 1 4 Bulldozer and angledozer blades 0
0 0 0
Parts of boring or sinking machinery 1 3 3 7 16 13 Parts of cranes, work-trucks, shovels, constr machine 1 4 4 8 17 10 Rock drilling or earth boring tools except carbide 0 1 2 2 5 3
Surface and Underground Final Equipment 2 8 7 7 18 30 Boring or sinking machinery nes, not self-propelled 1 1 1 2 8 4 Boring or sinking machinery nes, self-propelled 1 1 2 2 7 9 Bulldozers and angledozers, crawler type
0 0
2
Coal or rock cutters, not self-propelled 0 0 0
0 2 Coal or rock cutters, self-propelled
0
1
Construction equipment, not self-propelled nes
0 0 0 0 Construction equipment, self-propelled nes
0
0 0
Dump trucks designed for off-highway use
1
0
2 Earth moving/road making equipment, self-propelled ne
0 0 0 0 0
Front end shovel loaders 0 1 2 1 1 5 Graders and levellers, self-propelled
1 1 0 0 3
Rock drilling, boring heads of sintered metal, carbid 0 0 0 1 1 1 Shovels and excavators with revolving superstructure 0 0
0
1
Tamping machines and road rollers, self- propelled 0 0 0 1 0 0 Track-laying tractors (crawlers) 0 3
Mineral Processing Intermediates 5 21 29 40 27 33 Balls, iron or steel, cast, for grinding mills 1 13 9 18 5 10 Parts for mineral sort, screen, mix, etc machines 3 8 18 17 19 21 Parts of industrial or laboratory furnaces/ovens 1 1 2 4 3 2 Parts of metal rolling mills and rolls
0 0 0
Rolls for metal rolling mills 0 0 0 0 Mineral Processing Final Equipment 1 3 5 9 5 8
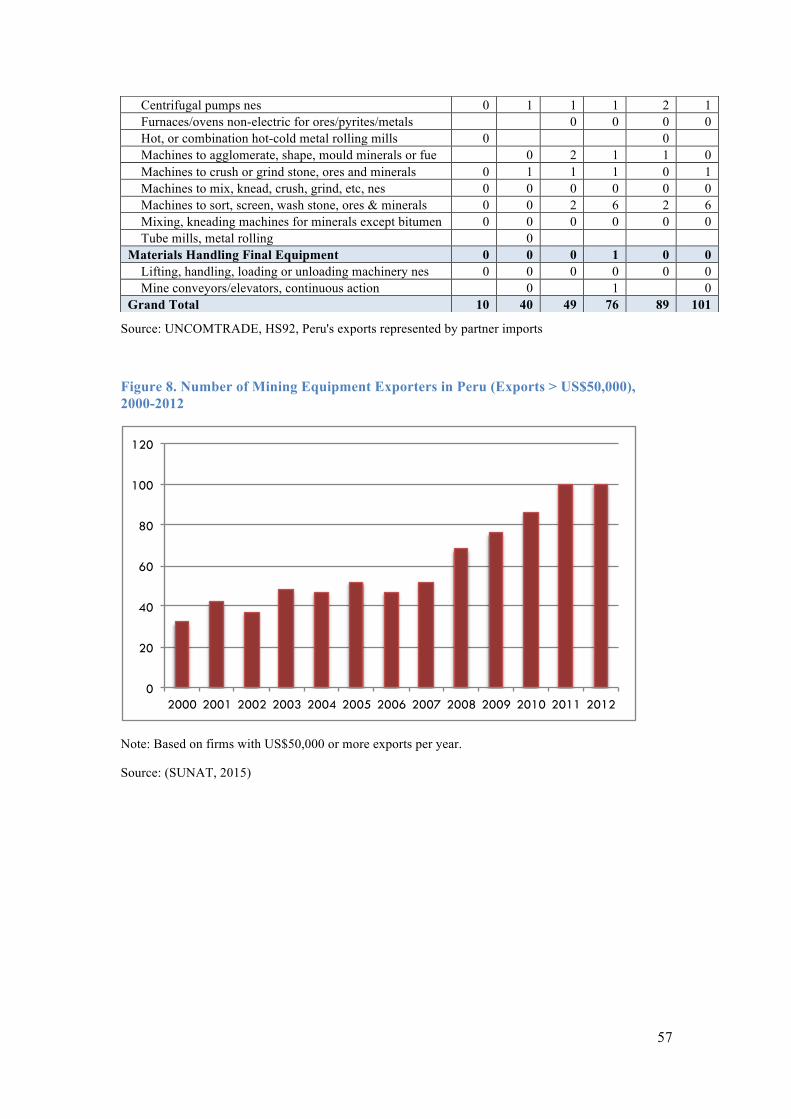
57
Source: UNCOMTRADE, HS92, Peru's exports represented by partner imports
Figure 8. Number of Mining Equipment Exporters in Peru (Exports > US$50,000), 2000-2012
Note: Based on firms with US$50,000 or more exports per year.
Source: (SUNAT, 2015)
0
20
40
60
80
100
120
2000 2001 2002 2003 2004 2005 2006 2007 2008 2009 2010 2011 2012
Centrifugal pumps nes 0 1 1 1 2 1 Furnaces/ovens non-electric for ores/pyrites/metals
0 0 0 0
Hot, or combination hot-cold metal rolling mills 0
0 Machines to agglomerate, shape, mould minerals or fue
0 2 1 1 0
Machines to crush or grind stone, ores and minerals 0 1 1 1 0 1 Machines to mix, knead, crush, grind, etc, nes 0 0 0 0 0 0 Machines to sort, screen, wash stone, ores & minerals 0 0 2 6 2 6 Mixing, kneading machines for minerals except bitumen 0 0 0 0 0 0 Tube mills, metal rolling
0
Materials Handling Final Equipment 0 0 0 1 0 0 Lifting, handling, loading or unloading machinery nes 0 0 0 0 0 0 Mine conveyors/elevators, continuous action
0
1
0
Grand Total 10 40 49 76 89 101