peru in the table grape global value chain - … · peru in the table grape global value chain ......
TRANSCRIPT

1
Peru in the Table Grape Global Value Chain OPPORTUNITIES FOR UPGRADING
Karina Fernandez-Stark, Penny Bamber and Gary Gereffi
Contributing Researchers: Stacey Frederick and Edgardo Sara
January 2016
Report commissioned by the World Bank

2
This research was prepared on behalf of the World Bank. The report is based on both primary and secondary information sources. In addition to interviews with firms operating in the sector and supporting institutions, the report draws on secondary research and information sources, including Peruvian organizations such as Superintendencia Nacional de Aduanas y de Administración Tributaria del Perú. The project report will be available at www.cggc.duke.edu.
Acknowledgements
Duke CGGC would like to thank all of the interviewees, who gave generously of their time and expertise. Duke CGGC would also like to thank Thomas Farole and Ekaterina Vostroknutova for their feedback on earlier drafts.
Duke University, Center on Globalization, Governance and Competitiveness (Duke CGGC)
The Duke Center on Globalization, Governance & Competitiveness (Duke CGGC) undertakes client-sponsored research that addresses economic and social development issues for governments, foundations and international organizations. We do this principally by utilizing the global value chain (GVC) framework, created by Founding Director Gary Gereffi, and supplemented by other analytical tools. As a university-based research center, we address clients’ real world questions with transparency and rigor.
www.cggc.duke.edu Center on Globalization, Governance & Competitiveness, Duke University © January 2016

3
Table of Contents Acronyms ............................................................................................................................ 5 1. Introduction .................................................................................................................. 6 2. The Global Table Grape Industry ................................................................................ 8
2.1 Introduction ............................................................................................................ 8 2.2 The Table Grape Global Value Chain ................................................................. 10 2.3 Global Trade in the Table Grape Value Chain .................................................... 14 2.4 Governance, Lead Firms and Standards .............................................................. 18 2.5 Upgrading Trajectories ........................................................................................ 21
3. Peru in the Table Grape Global Value Chain ............................................................ 24 3.1 Introduction .......................................................................................................... 24 3.2 Peru’s Current Participation in the Table Grape GVC ........................................ 27 3.3 Upgrading and Value-Added Analysis in the Peruvian Table Grape GVC ........ 32 3.4 Grape Industry Institutionalization in Peru: An Assessment for Local Context for GVC Upgrading ............................................................................................................ 38 3.5 Advantages and Constraints for Upgrading ......................................................... 40
4. Potential Upgrading Trajectories for the Grape Sector in Peru ................................. 43 4.1 Recommended Upgrading Trajectories ............................................................... 43
5. Bibliography .............................................................................................................. 46 6. Appendix .................................................................................................................... 52 List of Tables Table 1. Area Under Vines, Major Producing Countries (thousand hectares) .................... 9 Table 2. Top 10 Fresh Grape World Exporters by Value, by Year, 2003-2013 ............... 15 Table 3. Top Five Dried Grape World Exporters by Value, by Year, 2003-2013 ............ 16 Table 4. Top Five Grape Juice World Exporters by Value, by Year, 2003-2013 ............. 16 Table 5. Top Five Fresh Grape World Importers, by Value, by Year, 2003-2013 ........... 17 Table 6. Top 10 Dried Grapes World Importers, by Value, by Year, 2003-2013 ............ 17 Table 7. Top Five Grape Juice World Importers, by Value, by Year, 2003-2013 ............ 18 Table 8. Leading Ten Global Food Retailers, By Sales 2013 ........................................... 18 Table 9. Prominent Standards in the Fruit Industry .......................................................... 20 Table 10. Select Upgrading Trajectories for the Table Grape Global Value Chain ......... 22 Table 11. CAGR of Peru Exports of Key Agricultural Products, 2005-2012 ................... 24 Table 12. Peru’s Top Ten Grape Exporters, 2013-2014 .................................................. 27 Table 13. Key Imported Inputs for Peru Grape Sector ..................................................... 37 Table 14. Value Distribution in Table Grapes Exports of a Large Producer-Exporter from
Peru to Holland, 2013 ............................................................................................... 38 Table 15. Peru Grape Sector Stakeholders Analysis ......................................................... 39 Table 16. Summary of Key Advantages and Constraints for Industry Upgrading ........... 40 Table 17. Increase in Performance After Training- Vine in New Zealand ....................... 43 Table 18. Example of Grape Quality Classifications ........................................................ 52 List of Figures Figure 1. The Table Grape Global Value Chain ............................................................... 10 Figure 2. Peru's Participation in the Table Grape GVC .................................................... 27 Figure 3. New Irrigation Projects in Peru ........................................................................ 29 Figure 4. Peru Exports in the Grape GVC, By Product Category 2003-2013 .................. 32 Figure 5. Top 18 Grape Exporting Firms in Peru, Entry and Evolution by Product ........ 33 Figure 6. Peru Table Grape Exports, By Variety 2005-2014 ............................................ 34 Figure 7. Key Destination Markets for Peru Grape Exports, 2000-2012 .......................... 35 Figure 8. Export Destinations by Firm Export Size, 2012 ................................................ 35

4
List of Boxes Box 1. The Grape Industry and Wine Production ............................................................. 12 Box 2. Pro-Agribusiness Regulations ............................................................................... 25 Box 3. Water and new irrigation projects in Peru ............................................................. 28 Box 4. Peru's Emerging Fruit Juice Sector ........................................................................ 29
5
Acronyms
AGAP Association of Agriculture Exporters Organizations (Asociación de Gremios de Productores Agrarios del Perú)
CAGR Compound Annual Growth Rate
CMO Common Market Organization (European Union)
EU European Union
FAO Food and Agricultural Organization
GFSI Global Food Safety Initiative
GVC Global Value Chain
HAACP Hazard Analysis and Critical Control Point
IESI Institute of Union Studies (Instituto de Estudios Sindicales)
IFG International Fruit Genetics
INIA Chilean Agriculture Research Institute (Instituto de Investigaciones Agropecuarias)
Kha Kilometres per hectare
MINAGRI Ministry of Agriculture, Peru
ODEPA Office of Research and Agricultural Policies of Chile (Oficina de Estudios y Políticas Agrarias de Chile)
PROVID Association of Table Grape Producers of Peru (Asociación de Productores de Uva de Mesa del Perú)
R&D Research and Development
SENASA National Agricultural Sanitary and Phytosanitary Agency of Peru (Servicio Nacional de Sanidad Agraria del Perú)
SPS Sanitary and Phytosanitary Standards
SUNAT National Superintendency of Tax Administration Superintendencia (Nacional de Aduanas y de Administración Tributaria del Perú)
UK United Kingdom
UN United Nations
US United States
USAID United States Agency for International Development
USDA United States Department of Agriculture

6
1. Introduction This report analyses Peru’s participation in table grape global value chain. The sector has shown impressive grow in the past 5 to 10 years. During this time, exports in the sector grew from US$25 million in 2003 to US$565 million in 2013 (UNComtrade, 2015). Peru is the fifth largest exporter of grape with a 6.8% of the world market share, and exports this crop to highly sophisticated markets in Europe and the United States. In 2015, Peru had an estimated 30,000 ha under cultivation, thus requiring some 180,000 to 210,000 farm workers during the peak of the season. Peru participates in several stages of the value chain from production to packing and branding. However, its participation in processing stages such as raisins and grape juice is very limited. This last decade marked the successful entrance of the country into the global value chain; moving forward, the country must develop a strategy to consolidate as a world supplier. The fruit and vegetable industry is considered high value agriculture and is a crucial sector for rural employment in development countries. It is a key source of knowledge for the diffusion of modern farming techniques and the development of sophisticated capabilities to meet strict quality and health safety standards of global markets (Fernandez-Stark et al., 2011a). Grape production is a crop that has been globally dominated by a few numbers of countries. Traditional players are Chile with 27.8% global market share, Italy (11%), United States (10.9%) and South Africa (9.2%). Recently new players have entered the global value chain, especially located close to equator. Peru’s rapid entry into the value chain has largely followed the pattern of other successful non-traditional agricultural exports, which began 10-15 years ago, and it has served to further diversify the sector’s export basket. These agricultural products, which are mostly new for the country, have been developed based on a strictly commercial and export-oriented strategy using modern farming techniques. In Peru, these agro commercial operations have been very successful due to a series of factors including land privatization, the expansion of land through irrigation projects combined with excellent climatic conditions, leveraging foreign expertise, particularly that of Chile to develop local capabilities, and a strong organization to open up new markets. Currently Peru is entering in a new phase in the industry that requires a strategic plan to sustain this tremendous grow of 38% from 2007-2013. The sector is overly dependent of the red globe variety, a low value variety with high levels of global competition. In addition, labor productivity levels are low because farmers do not have experience cultivating this crop. Weak transportation and high bureaucracy are not helping this sector in which time is critical due to the short life shelf of the product. Peru needs to establish a grape sectorial strategy to leverage the recent success of the industry. The country needs to coordinate with all the grape value chain stakeholders to develop a holistic plan that takes into account the most promising value added strategies. The upgrading strategies proposed in this report are: (1) process upgrading including labor productivity, technological sophistication and improved efficiency of government phytosanitary agencies; (2) product upgrading into higher varieties and R&D in genetics development (3) product diversification in horticultural value chain; (4) functional upgrading into processing (raisins and grape juice); and (5) strengthening backward linkages to take advantages of the local capabilities to supply industry inputs.

7
In order to achieve these upgrading goals, several policy actions need to be taken. These include the creation of a public and private commission that develops an industry plan, convened by the industry association, PROVID. Human capital and knowledge transfer policy actions are key for the industry product and process upgrading. In addition, the country should create a local supplier development program to extend the industry growth to other sectors of the local economy that can supply with important inputs. The sector will also benefit from attracting foreign direct investment of companies with expertise in exporting a wide variety of crops as well as working with smallholders. Finally, Peru needs to upgrade the infrastructure and regulatory environment to sustain this industry growth. This report is structure as follows: In the first chapter we provide an overview of sector. The second chapter provides a grape global value chain analysis. In the third chapter we map Peru’s position in the grape GVC including the local institutional context of the industry. In the Chapter fourth we outline the recommended upgrading trajectories for the industry development.

8
2. The Global Table Grape Industry
2.1 Introduction The global table grape industry has grown significantly over the past 10 years. During this time, international trade in the sector has more than doubled from US$4.6 billion in 2003 to US$11.2 billion in 2013 (UNComtrade, 2015). Growth has been primarily driven by fresh grape exports from developing countries, including expansion and upgrading of the Chilean production, and new entrants India, Peru and Turkey. As a labor-intensive crop, grape production is well-suited to developing countries, providing an important source of rural employment (Mencarelli & Bellincontro, 2005). Juice production continues to be led by developed country grape producers with established traditions in production and technology use in processing. However, as trade in fresh grapes has become increasingly global, developing country producers have been required to adopt a wide range of technologies to support production, particularly with respect to variety development and adaptation to specific locations and soil types, integrated pest management, and use of appropriate cold chain techniques to ensure the quality of the grapes is not adversely affected during shipping. Three major changes have shaped the global table grape industry in recent years: (1) production has shifted from developed countries to new producers in developing countries; (2) there has been an increased focus on product differentiation with the introduction of new varieties; and (3) there has been a consolidation of production to large producers. (1) Shift of Production from Developed to Developing Countries: The total global area under grape production has declined slightly since the 1980s as production has shifted from developed to developing countries. In the 1980s, global vineyards reached a total of 8.8 million hectares (ha); by 2011, this had decreased to 7.5 million ha. This decline occurred primarily amongst traditional European producers, Spain, France and Italy. This is mainly due to the implementation of the new Common Market Organization1 (CMO) in the European Union (EU), which provided abandonment subsidies, encouraging producers to reduce overall plantations. While European producers still account for approximately 60% of the world’s vine surface, they reduced planted areas from 4,520 kha in 2008 to 4,253 kha in 2011 (Organisation Internationale de la Vigne et du Vin, 2011).
1 The Common Market Organization (CMO) is designed to monitor EU agriculture markets. The new CMO provides that starting from the 2008/2009 season and lasting until the 2010/2011 season, vine growers will benefit from a definitive renunciation premium, on the sole basis of the individual decision by the applicants, and within the context of a budgetary quota, enabling the uprooting of 175 kha in 3 years. The subsidy is available to all EU producers in member countries that produce more than five million liters of wine.

9
Table 1. Area Under Vines, Major Producing Countries (thousand hectares)
2006 2007 2008 2009 2010 2011 Variation
2011/2006
Spain 1174 1169 1165 1113 1082 1032 -12%
France 888 867 857 836 818 806 -9%
Italy 843 838 825 812 795 776 -8%
China 444 475 480 518 539 560 26%
Turkey 552 521 518 515 514 508 -8%
USA 339 397 402 403 404 407 20%
Portugal 249 248 246 244 243 240 -4%
Iran 318 305 232 232 239 238 -25%
Argentina 223 226 226 229 217 218 -2%
Romania 213 209 207 206 204 204 -4%
Chile 195 196 198 199 200 200 3%
Australia 169 174 173 177 171 170 1%
Moldavia 146 150 150 148 146 143 -2%
South Africa 134 133 132 132 132 131 -2%
Peru 15 16 18 19 21 23 53%
World Total 7,799 7,763 7,674 7,633 7,594 7,517 -4%
Source: (Organisation Internationale de la Vigne et du Vin, 2011), PROVID, 2015. Note: Although the analysis was carried out by the International Wine Organization, the figures include all grapes, be it for fresh consumption or in processed products.
The decline of EU vineyards has been partly compensated by the expansion of the planted surface areas in the rest of the world and improved productivity of new and existing vineyards. Total global production of table grapes increased by 11% between 2007 and 2012. Vineyard expansion has taken place primarily in developing countries, particularly in China, which expanded its vineyard sizes by 17% during the same period and Peru by 27% (Organisation Internationale de la Vigne et du Vin, 2011). The Asian producers have also shown extraordinary improvements in yields, and in 2011 accounted for 59% of global production (Organisation Internationale de la Vigne et du Vin, 2011). Chile, India and Turkey all also increased areas under production and yields, with the latter two quickly supplanting European exporters. Although India and Turkey had not yet entered the export market by 2003, they had become top 10 fresh grape exporters by 2013 with exports of US$243 million and US$259 million respectively (see Table 2) (UNComtrade, 2015). (2) Overproduction of ‘Commodity’ Varieties and Increased Focus on New Variety Development: Varieties of table grapes are broadly classified into three groups: red, black and green (also called white). Thompson Seedless grapes (green) and Red Globe are two of the most commonly grown grape types (Field Research, 2015). In recent years, the explosion in the production of varieties such as Red Globe has led to a rapid decline in prices for these varieties and producers have thus sought to insulate themselves from competition by cultivating ‘club’ varieties. These varieties are being developed mostly by private firms engaged in research and development (R&D), which license their production globally, thus limiting overall production. The market for these new varieties

10
is essentially ‘closed’ with a quota system, helping to ensure returns on investment for producers (Field Research, 2015).
(3) Consolidation of the Supply Chain: The need to adhere to strict management processes, increase traceability and become certified suppliers has resulted in the emergence of larger commercial farms generally owned by exporter firms (producer-exporter firms). Small-scale providers, once important suppliers, have, to some degree, been marginalized in production.2 In India, despite overall production increases, the total number of producers decreased in just one year by 60% to 67 producers in 2011 (Singh, 2013). In South Africa, the total number dropped by 40% between 2008 and 2014 (SATI, 2010). This tendency to rely on large firms reflects a trend in the general fruits and vegetables sector. Supermarkets in key export destinations have gained significant market share and have shifted of more responsibilities back to the supplier firms, rationalizing their supply chains around fewer “preferred suppliers” in the process (Cooke, 2010). This has required increased financial commitments of the suppliers, which is beyond the capacity of many small firms.
2.2 The Table Grape Global Value Chain
The grape global value chain can be divided into seven main segments: R&D, Inputs, Production, Packaging & Cold Storage, Processing, Distribution and Marking and Sales. Figure 1 illustrates the main stages of the table grape GVC, followed by a discussion of each of these stages and the respective role of actors at the global level.
Figure 1. The Table Grape Global Value Chain
Source: Authors.
2 There is considerable debate in the literature regarding the impact of the imposition of standards on smallholder provider. For further discussion see (Humphrey, 2009; Steve Jaffee & Masakure, 2005; Ouma, 2010).
Processing*Companies*
*******
Inputs*
R&D*
Produc6on*for*Export*
Packing*&*Cold*Storage* Processing*
Marke6ng*&*Sales**
Farms:*Grapes*for*fresh*consump6on*
***
Farms:*Grapes*for*processed*food*
Dried*
Juices*&*Pulps*
Small*Farms*
Medium*&*Large*Farms*
Large*ProducerDExporter*Companies*******
Exporter*Companies*
****
Packing*Plants*(Selec6on,*packing,*cuGng,*labeling*
etc)*Cool*Storage*Units*
Packing*Plants*(Selec6on,*packing,*cuGng,*labeling*etc)*
Cool*Storage*Units*
Farms*
Supermarkets*
Food*services*
SmallDscale*retailers*
Residues
Seeds*
Agrochemicals*(Herbicides,*Fungicides*&*Pes6cides)*
Farm*Equipment*
Irriga6on*Equipment*
*Fer6lizers*
*
Distribu6on*
Importers*(wholesalers/dedicated*suppliers)*

11
R&D: This segment of the value chain is primarily focused on improving existing varieties and developing new ones, although it is also essential for innovating in production, packing, processing, and transportation techniques. Improved shipping procedures, for example, can improve the final quality of the grapes upon arrival as well as extend the total number of potential shipping days the grape can sustain, opening up markets that are further afield. There is a large number of grape varieties and this continues to grow. 3 There are four key characteristics that determine the potential of a new variety: fertility (i.e. productivity of the plant); labor intensity; resilience (to shipping and pests); and taste (Field Research, 2015). Developing these varieties requires significant investment and experimentation in the field and can take anywhere from six to 15 years (NPR, 2013). Today, R&D is mostly being carried out in California by public and private actors. Some well-known firms include International Fruit Genetics (IFG) and SunWorld, which carry out cutting edge research on the development of new varieties. IFG, for example, recently created the Cotton Candy grape variety from two different grape species. These organizations license the production of their varieties and producers are required to pay royalties. This closed quota system helps to ensure returns on investment for producers by limiting supply (Field Research, 2015). Developing new varieties can thus have important pay offs for different countries engaged in the industry. In countries such as Chile, there are new policies provide financing to encourage genetic improvement (MINAGRI, 2014). For example, the Chilean Agriculture Research Institute (INIA) at the Ministry of Agriculture, together with local universities and the private sector, are developing four new varieties for 2020 (Portal Frutícula, 2012). Inputs: The most important inputs for this industry are seedlings, fertilizers, agrochemicals (herbicides, fungicides and pesticides), vine infrastructure (wires, poles, etc.), farm and irrigation equipment, and packaging materials such as plastic bags and treated wooden crates for shipping. The wide variety of inputs required offer participating countries potential for the development of a rich supplier sector, which can also cater to the broader horticultural sector. The largest exporters of these inputs tend to be countries that are also major grape exporters, including the US, Italy, and Spain. Due to volume and weight, sourcing also tends to be regional in nature. Grape Production: Commercial grape production is a relatively “high investment– high return” crop. Initial investment costs can be up to US$20,000/ha, and average annual returns are US$15,000/ha once the vines reach maturity. The production cycle is relatively long compared to other fruit; in most grape producing areas, new plantations take two to three years to become productive (USDA, 2009). Once these fixed costs are assumed, vines can continue to be productive for decades (Strik, 2011). During this time, new varieties can be grafted onto existing vines (Field Research, 2015), allowing for some degree of long-term flexibility to switch between varieties. The productive lifecycle for table grape vines is much shorter in tropical climates than more temperate zones (Possingham et al., 1990), and quality tends to decline faster for table grapes vines than those destined for the wine sector (Zabadal, 2002). Production models vary by region. Exporter firms consist of a few large multinational companies with global footprints across two or more developing countries combined with a large number of medium-sized domestic firms. These exporter firms may also own their 3 California, for example, claims to produce more than 80 types of grapes (California Table Grape Comission, 2015).

12
own production operations (producer-exporter) or they may source from a variety of large-, medium- and small-sized farms. In some cases, these developing country firms are also expanding into other countries and vertically integrating along the value chain. Larger firms tend to operate with a higher degree of technological sophistication making use of irrigation, integrated pest management, and pre-packaging cold storage operations, amongst others. Smaller, less capitalized operations have lower levels of technology and they usually sell to larger exporters, which aggregate supplies. Thus, in addition to providing high returns, as a labor-intensive crop, grape production offers high potential for rural employment. Processing: There are two potential products that can be made through processing of table grapes: raisins and grape juice. Grape juice is used as a final product for consumption, but also widely used as an input in many other commercial fruit juices and confections. It is the most popular juice for blending (McKee & Isaacs, 2012). Although wine is not generally produced from table grapes, due to the different varieties and agricultural techniques required to produce quality wine (See Box 1), some grape juice is used by the wine industry, where it is blended with different wine varieties for the low-end market. The processing of grapes to produce raisins involves drying the grapes in the sun or in special equipment for two to three weeks until moisture content reaches 15%. This is followed by stem and chaff removal, and passing the raisins through a vacuum air stream to remove other undesirable material before packaging (Mencarelli & Bellincontro, 2005). In the case of juice, grapes must first undergo heat treatment, after which they are pressed to extract the juice. The juice is then pasteurized and cooled to be stored at a low temperature (Mencarelli & Bellincontro, 2005). This stage of the chain consists primarily of manufacturing activities undertaken by a different set of firms than those involved in production and, while inherently linked to on-farm cycles due to the need for raw materials, this is characterized by lower risk than agricultural production. In addition, this stage further differs in terms of factor intensity compared to cultivation; in the cultivation of grapes, labor is a key component, while in the processing stage of the chain, capital is the main component needed to acquire the necessary equipment. Moving up in the chain to processing can offer multiple country benefits, including additional employment throughout the entire chain and also upgrading into the processing of other crops. Box 1. The Grape Industry and Wine Production
Table grapes differ from wine grapes. Table grapes are grown in a way to make them more physically appealing: larger, seedless, with thicker pulp and thinner skins. They have both lower acidity and higher sugar content than wine grapes. Wine grapes are juicier, smaller, have a large number of seeds and have thicker skins (Wine Folly, 2012). In addition, table grapes are selected to withstand different types of travel and handling, while wine grapes are often picked much riper than table grapes and so will deteriorate faster when picked (WineSpectator, 2015). The vines for table grapes are younger with a focus on quantity per vine, while in the case of the wine, vines are older and the emphasis is to stress the vine to produce rich grapes. The grape variety also differs, as this largely determines the flavour and character of the wine. There is a vast array of grape varieties contributing to different wine styles. The most popular wine varieties are Riesling, Chardonnay, Sauvignon Blanc, Syrah, Bordeaux, Malbec, Merlot, Cabernet Sauvignon, Pinot Noir, among others.

13
Packaging: This segment of the chain involves the preparation of the products for shipping and sale. Grape bunches are packed within 24-48 hours of harvest, following an initial pre-cooling since harvest takes place during summer. Packaging activities for grapes are highly labor intensive, particularly for high quality grapes destined for the export markets which must be moved by hand from the wooden harvest container, trimmed and placed in a plastic bag and then packed into cardboard boxes according to grades for shipping. During this process, the packing worker must also remove any damaged or imperfect fruit from the bunch. Packaging materials used depend on the end market, including factors such as the buyer’s requirements (e.g., supermarkets versus wholesalers), distance to market and required cold treatment (Field Research, 2015). Sophisticated packaging adds value to the exports since it improves the shelf life of the grapes, reduces losses during transportation and improves the attractiveness for buyers (Palanciuc et al., 2011). Unlike many other fruit and vegetables crops, due to the fragile nature of the fruit, grapes are not placed on conveyer belts in the pack houses, but rather are organized with individual packing stations. These activities are often performed by women due to their dexterity and attention to detail, providing an important source of rural employment for women (Bamber & Fernandez-Stark, 2013). These activities are usually carried out by large producer-exporter companies and exporter companies that buy the grapes, package, store and export them. Cold Storage: Cold chain management is essential for ensuring the quality, taste and shelf life of the grape on arrival to its destination market, particularly for higher value added retail segments (Palanciuc et al., 2011). Capabilities in this segment of the value chain are critical for securing full value of high-grade grapes. Producers from some developing countries are forced to sell their grapes in lower value markets, due to the absence of appropriate cold chain use. Cold storage requirements differ according to the specific origin and destination of the grapes, and can manage issues such as the fruit fly transmission and other pests. Developing capabilities in this segment of the value chain can allow producers to access a broader number of markets and sell their products for higher prices. Distribution: The distribution segment of the value chain incorporates all activities corresponding to the reception of the grapes in the end market and delivery to sales outlets. Many exporters sell directly to end clients, but in other cases, brokers or intermediaries may be used in destination country. Through the direct sales operation, the grape producer/exporter receives a fixed price paid directly by the retailer, while in the case of intermediaries, the grapes are sold on consignment, and thus producers face greater uncertainty (Fresh Fruit Portal, 2013). There is a growing tendency today to focus on direct buying and eliminating intermediaries. However, this requires production and shipping of consistent quality fruit, as there are usually limited mechanisms for redirecting the shipments rejected by the client to less demanding markets. Brokers tend to be used more often by smaller producers or those that are new to the global value chain, serving to aggregate supply and minimize transaction costs for final buyers. Marketing and Sales: This stage involves the point of sale to the final consumer. Marketing and sales activities are performed by several different actors depending on the geographic end-market; these include supermarkets, food services and small-scale retail outlets. Supermarkets increasingly represent the most important market channel, accounting for the largest share of the fruits and vegetable sales in key markets. In the EU and the US, they represent around 75-80% of all retail food purchases (Reardon et al.,

14
2007). Important retailers include Wal-Mart, Tesco, Carrefour and Costco amongst others. Human Capital in the Table Grape Global Value Chain Human capital is one of the most important factors in the production of table grapes, especially for GVCs that demand high quality crops. Modern export agriculture requires a skilled labor force, ranging from farmers who must adopt sophisticated production techniques to quality control operators in pack houses and on processing lines of food factories. Thus, human capital development is considered to play a central role in the industry’s competitiveness, and the ability to educate and train the correct personnel required by the sector is essential for entering higher value stages of the chain (Fernandez-Stark et al., 2011b). In practice, in global industries such as the table grape GVC, there has been a tendency towards multi-stakeholder training initiatives, combining resources of the private sector, educational organizations, governments and in some cases even buyers. This combination of actors ensures that supply meets industry demand (Gereffi et al., 2011). The jobs at different stages of the value chain present unique characteristics. At the production stage, a range of actors from management to farm workers must be retrained in modern techniques to meet rigorous enforcement of sanitary and phytosanitary standards, strict buyers requirements and increased productivity. At the packing stage, the labor force must be skilled in food handling and they must follow strict health and safety protocols. This labor force thus is often predominantly female, since they tend to be more skilled at handling delicate fruit and avoiding unnecessary losses. In the processing stage of the chain, workers perform manufacturing tasks. With a shift from agriculture to manufacturing, workers require a completely different set of skills focused on operating processing equipment (Fernandez-Stark et al., 2011b).
2.3 Global Trade in the Table Grape Value Chain Over the past ten years, trade of table grapes has increased significantly in both volume and geographic scope. Demand has been buoyed by rapidly expanding consumption in Europe, China and Russia, while several new grape exporting countries have entered on the supply side in fresh and processed products. Although production has grown relatively slowly over the past decade (11%), trade in both fresh and processed products has more than doubled in value. Fresh grapes account for the largest import market, accounting for US$8,271 million in 2013 compared to US$1,830 million and US$1,140 million in raisin and grape juice trade, respectively (see Tables 2,3 and 4) (UNComtrade, 2015). However, trade in processed products is actually growing faster than in fresh grapes, with compound annual growth rates of 11% compared to 8.8% (UNComtrade, 2015). This section discusses first the evolution of global supply over the past ten years, followed by an analysis of the growing global demand. Global Supply The fresh grape export market is quite concentrated, with Chile dominating all other exporters. Other lead exporters are Italy, US, South Africa and Peru, which together with Chile accounted for 66% of global exports in 2013. Chile has dominated international grape trade over the past decade with more than double the market share of the next largest exporter, Italy, and has steadily increased production and opened new markets. These two market leaders export to quite different destinations and in opposite seasons,

15
with Italy serving a largely regional market while Chile exports globally. Italy’s top ten export destinations since 2009 exports have been European countries, accounting for approximately 80% of exports. In comparison, Chile’s export basket is significantly more diverse; in addition to European destinations, the country’s top ten export destinations include the US, China, Canada, Republic of Korea and Mexico (UNComtrade, 2015). Chile’s regional exports are small, although they have increased from 3% in 2009 to 5% in 2013. In addition, in the last decade, after a period of relative stability in the global grape supply, Peru, Turkey and India have also entered the export market for fresh grapes, showing impressive growth and rapidly gaining market share. The biggest losers over the past ten years amongst the top ten are Italy and Mexico, which compete seasonally with these new entrants, losing 4% and 3%, respectively. Table 2. Top 10 Fresh Grape World Exporters by Value, by Year, 2003-2013
Exporter Value ($, Millions) World Share (%) 2003 2005 2007 2009 2011 2013 2003 2005 2007 2009 2011 2013
World 3,557 4,855 5,951 6,414 7,504 8,271 Chile 1,068 1,414 1,598 1,902 2,152 2,300 30.0 29.1 26.8 29.7 28.7 27.8 Italy 546 655 801 779 850 915 15.3 13.5 13.5 12.1 11.3 11.1 USA 342 462 538 584 739 900 9.6 9.5 9.0 9.1 9.8 10.9 South Africa 403 532 614 635 708 759 11.3 11.0 10.3 9.9 9.4 9.2 Peru -- -- -- -- 381 565 -- -- -- -- 5.1 6.8 Mexico 292 366 328 352 358 418 8.2 7.5 5.5 5.5 4.8 5.1 Spain 166 179 245 246 355 329 4.7 3.7 4.1 3.8 4.7 4.0 Turkey -- 100 166 222 249 259 -- 2.1 2.8 3.5 3.3 3.1 India -- -- -- -- -- 243 -- -- -- -- -- 2.9 Netherlands 72 -- -- -- 188 195 2.0 -- -- -- 2.5 2.4 Brazil 60 146 300 198 216 -- 1.7 3.0 5.0 3.1 2.9 -- Egypt -- -- -- 176 -- -- -- -- -- 2.7 -- -- Greece 134 171 162 174 -- -- 3.8 3.5 2.7 2.7 -- -- Argentina 79 118 155 -- -- -- 2.2 2.4 2.6 -- -- -- Top 10 3,161 4,143 4,908 5,267 6,195 6,883 88.9 85.3 82.5 82.1 82.6 83.2
Source: UNCOMTRADE, HS92-080610; retrieved 2/15/15; exports represent imports from all countries; (--) indicates country is not a top 10 exporter in the given year Raisin exports have tripled in value over the past decade, dominated by Turkey and the US, which have accounted for over 50% of the global market for the past ten years. The top six producers have accounted for approximately 85% of the global market and, together, have maintained this global share. With the exception of Iran, there is considerable overlap between the top ten fresh grape producers, indicating that it is increasingly common for processing countries to further process some portion of their crop prior to export. Turkey’s competitiveness in this sector is based on the country’s long tradition of dried fruit preparations, combined with its rapid growth in the supply of fresh grapes. Although Chile and South Africa are focused primarily on the production of fresh grapes, they have both expanded their exports of raisins by value during this period, increasing their share of grape processing. Iran lost significant market share in 2008 and 2009, partly as the result of economic sanctions (Khajehpour, 2014). Subsequently, the country has redirected its exports to Russia and the Ukraine.

16
Table 3. Top Five Dried Grape World Exporters by Value, by Year, 2003-2013
Exporter Value ($, Millions) World Share (%) 2003 2005 2007 2009 2011 2013 2003 2005 2007 2009 2011 2013
World 662 893 1,100 1,253 1,727 1,830 Turkey 198 269 364 434 565 551 29.9 30.1 33.1 34.6 32.7 30.1 USA 172 221 229 288 406 393 25.9 24.8 20.8 23.0 23.5 21.4 Iran 74 102 131 67 142 191 11.1 11.4 11.9 5.4 8.2 10.5 Chile 49 87 96 121 165 176 7.5 9.7 8.7 9.7 9.6 9.6 South Africa -- -- 55 51 -- 82 -- -- 5.0 4.1 -- 4.5 Greece 46 48 -- -- 76 -- 6.9 5.4 -- -- 4.4 -- Top Five 538 728 875 961 1,355 1,394 81.3 81.5 79.6 76.7 78.4 76.1 Peru 0 0 0 0 0 0 0.0 0.0 0.0 0.0 0.0 0.0
Source: UNCOMTRADE, HS92-080620; retrieved 2/15/15; exports represent imports from all countries; (--) indicates country is not a top five exporter in the given year
International trade in grape juice, on the other hand, is dominated by a different set of countries. The three leading countries, Spain, Argentina and Italy, together account for 60% of the market, followed by the US with an additional 10%, although US exports of grape juice have grown slowly. Chile has also expanded its exports of grape juice, reaching 8.6% global market share by 2013. The top five exporters are traditional grape producers with mature production, which have diversified their product base from fresh production to juice and wine. Table 4. Top Five Grape Juice World Exporters by Value, by Year, 2003-2013
Exporter Value ($, Millions) World Share (%) 2003 2005 2007 2009 2011 2013 2003 2005 2007 2009 2011 2013
World 409 552 762 741 1,005 1,140 Spain 90 89 143 118 245 241 22.1 16.1 18.7 16.0 24.3 21.2 Argentina 59 130 180 145 206 241 14.4 23.6 23.6 19.6 20.5 21.2 Italy 63 99 157 176 216 231 15.5 18.0 20.6 23.7 21.5 20.2 USA 64 66 77 93 104 114 15.7 12.0 10.1 12.5 10.4 10.0 Chile -- 33 46 76 69 98 -- 6.0 6.1 10.2 6.8 8.6 France 33 -- -- -- -- -- 8.0 -- -- -- -- -- Top Five 309 417 603 608 840 925 75.7 75.6 79.1 82.0 83.6 81.1 Peru 0 n/a n/a n/a 0 0 0.0 n/a n/a n/a 0.0 0.0
Source: UNCOMTRADE, HS92-200960; retrieved 2/15/15; exports represent imports from all countries; (--) indicates country is not a top five exporter in the given year Global Demand Major fresh grape importers are the EU, led by Germany, the United Kingdom and the Netherlands, the US, China, Russia and Canada (UNComtrade, 2015). These top five destinations (including EU-15), account for 71% of all imports. While traditional developed country markets continue to represent over 50% of global import demand with strong growth in the European market, import markets have diversified somewhat and Russia and China both emerged as strong growth markets since 2003. Russia grew from US$80 million in 2003 to US$500 million in 2013, while China’s fresh grape import market expanded from US$42 million to US$515 million over that same period (UNComtrade, 2015). Indeed, consumption of fresh grapes in China is very high; the country is a net importer of grapes despite being among the largest producers of grapes in the world.4
4 See Table 1 for total area under production in China.

17
Table 5. Top Five Fresh Grape World Importers, by Value, by Year, 2003-2013
Importer Value ($, Millions) World Share (%) 2003 2005 2007 2009 2011 2013 2003 2005 2007 2009 2011 2013
World 3,557 4,855 5,951 6,414 7,504 8,271 EU-15 1,618 2,171 2,624 2,726 3,011 3,047 45.5 44.7 44.1 42.5 40.1 36.8 USA 834 1,111 1,124 1,235 1,201 1,361 23.5 22.9 18.9 19.3 16.0 16.5 China -- -- -- -- 324 515 -- -- -- -- 4.3 6.2 Russian Federation -- 211 413 452 535 505 -- 4.3 6.9 7.0 7.1 6.1
Canada 235 302 343 368 411 440 6.6 6.2 5.8 5.7 5.5 5.3 China, Hong Kong SAR 132 140 -- 253 -- -- 3.7 2.9 -- 3.9 -- --
Poland -- -- 165 -- -- -- -- -- 2.8 -- -- -- Mexico 94 -- -- -- -- -- 2.6 -- -- -- -- -- Top 5 2,913 3,934 4,668 5,034 5,482 5,868 81.9 81.0 78.4 78.5 73.0 70.9
Source: UNCOMTRADE, HS92-080610; retrieved 2/24/15; (--) indicates country is not a top five importer in the given year Demand for raisins is driven primarily by the EU-15, which accounts for over 50% of the market. The remaining market is diverse, including Japan, Canada, Russia, and Brazil, amongst others. The US is both an important consumer and producer of raisins, although a large segment of the market is supplied by domestically produced fruit. This domestic supply, as with the US’s California production of fresh grapes, is often affected by droughts in the state (USDA, 2014). Table 6. Top 10 Dried Grapes World Importers, by Value, by Year, 2003-2013
Importer Value ($, Millions) World Share (%) 2003 2005 2007 2009 2011 2013 2003 2005 2007 2009 2011 2013
World 662 893 1,100 1,253 1,727 1,830 EU-15 362 445 560 627 922 942 54.7 49.8 50.9 50.0 53.4 51.5 Japan 41 58 60 58 90 96 6.1 6.5 5.5 4.6 5.2 5.2 Canada 42 52 59 62 72 72 6.4 5.8 5.3 5.0 4.2 4.0 Russia 22 29 54 92 64 72 3.3 3.2 4.9 7.3 3.7 3.9 Brazil -- -- -- -- -- 57 -- -- -- -- -- 3.1 USA -- 38 43 -- -- -- -- 4.3 3.9 -- -- -- Australia 18 -- -- 41 67 -- 2.7 -- -- 3.3 3.9 -- Top 5 485 622 776 880 1,216 1,239 73.2 69.6 70.6 70.2 70.4 67.7
Source: UNCOMTRADE, HS92-080620; retrieved 2/24/15; (--) indicates country is not a top five importer in the given year The top five grape juices importers account for over 75% of the market. The principal buyer is the EU with 37% of total imports, followed by the US, Japan and Canada with 16%, 12% and 7%, respectively. This shows a very high concentration of demand with a small number of buyers. Trade in juice continues be focused between developed countries, with over 50% of supply and 70% of demand derived from these nations.

18
Table 7. Top Five Grape Juice World Importers, by Value, by Year, 2003-2013
Importer Value ($, Millions) World Share (%) 2003 2005 2007 2009 2011 2013 2003 2005 2007 2009 2011 2013
World 409 552 762 741 1,005 1,140 EU-15 182 201 290 247 357 423 44.5 36.4 38.1 33.4 35.5 37.1 USA 46 114 127 112 142 180 11.2 20.6 16.6 15.2 14.2 15.8 Japan 43 61 75 95 119 134 10.4 11.0 9.8 12.8 11.8 11.8 Canada 46 56 66 68 81 83 11.2 10.2 8.7 9.2 8.1 7.3 Rep. of Korea 18 24 -- 31 39 46 4.3 4.3 -- 4.1 3.9 4.1
South Africa -- -- 23 -- -- -- -- -- 3.0 -- -- --
Top 5 334 456 581 553 739 867 81.7 82.5 76.2 74.7 73.5 76.0
Source: UNCOMTRADE, HS92-200960; retrieved 2/24/15; (--) indicates country is not a top five importer in the given year
2.4 Governance, Lead Firms and Standards The global grape sector operates as a buyer-driven value chain. Large supermarkets are the leading actors in the key export markets, with controlling market shares of up to 80% across the EU and in the US (Reardon et al., 2007). These buyers seek enhanced cost competitiveness, consistency and product differentiation from their global supply chains. During the past 20 years, they have continuously consolidated, gaining more power over the suppliers. Today, these lead firms exert significant influence over the entire value chain and dictate how fresh produce is cultivated, harvested, transported, processed and stored. For example, one lead firm, Tesco, requires that its suppliers meet specific standards regarding weight (>150g per bunch), diameter (>16 mm), sugar content (>16%) and have no visible blemishes (Singh, 2013). Table 8 lists the ten largest global food retailers, Wal-Mart is the largest outlet, followed by Tesco and Carrefour (Supermarket News, 2013). Table 8. Leading Ten Global Food Retailers, By Sales 2013
Supermarket Country of Origin Sales (US$ billion)
Wal-Mart Stores United States 466 Tesco United Kingdom 119 Carrefour France 116 Costco United States 103 Kroger Co. United States 98 Schwarz Group Germany 98 Metro Group Germany 86 Aldi Germany 81 Target Corp. United States 71 AEON Japan 71 Source: (Supermarket News, 2013) Note: Where necessary, currencies were converted using Oanda historical currency converter, using rates available December 31, 2013.
Supermarkets now wield considerable influence not only over how grapes are produced but, as a result of their control over access to market, they also have substantial bargaining power over how much producers are paid, how they are paid and when. Small Indian producers that supply Tesco, for example, receive a minimal payment on delivery, with the remainder paid up to 90 days post harvest, once the prevailing market price is established each season and all shipping and certification costs have been deducted

19
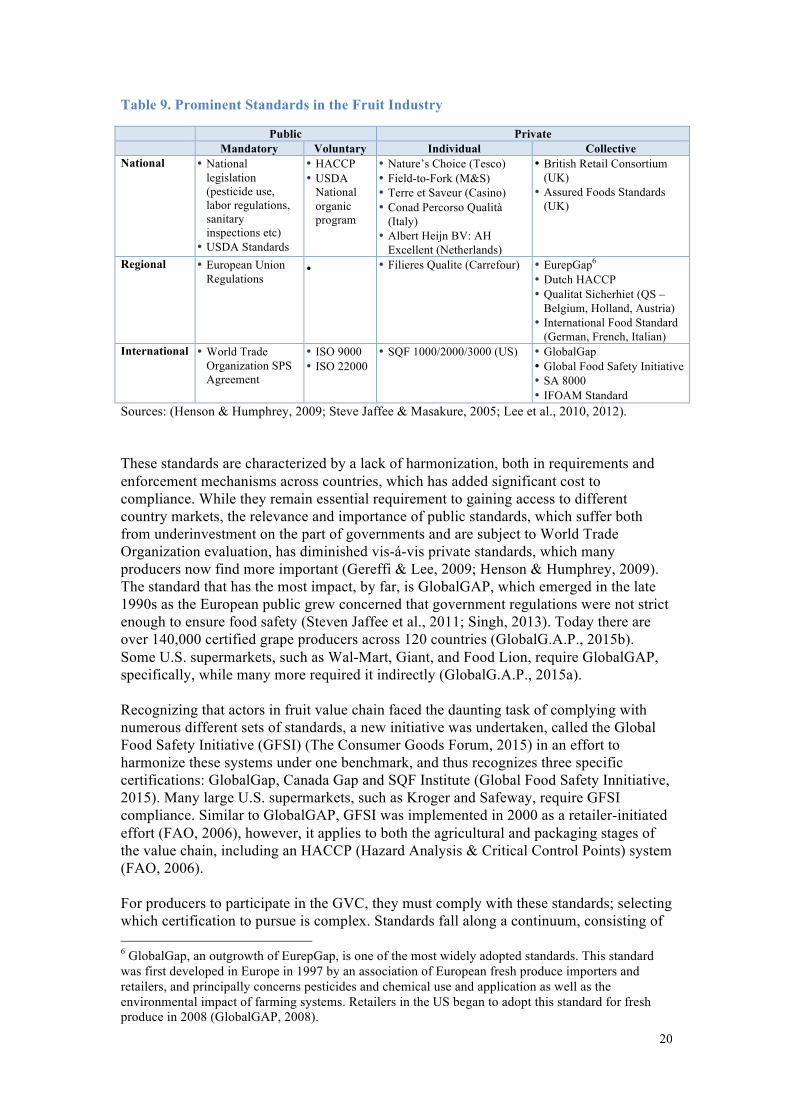
(Singh, 2013). Operations through brokers continue to be less controlling, reflecting the more traditional market structure and allowing for a greater variety of product quality and size. However, with such a large share of the market dominated by supermarkets, sales through brokers and other intermediaries are characterized by greater uncertainty. The control of lead firms over the chain has been achieved through the introduction of private standards and codes of conduct that govern both the characteristics of the product, as noted above, and the social and environmental conditions of cultivation and post-harvest handling. For example, French supermarket, Carrefour, implemented the Filière Qualité, which does not allow post-harvest chemical treatments to preserve freshness (FAO, 2006).5 UK-based Tesco implemented its private standard, Nature’s Choice, for European producers in 1993, and expanded it globally in 2004 (Cox, 2007). Nature’s Choice focuses on environmental impact of fruit production, including integrated pest management, minimal chemical use, encourages water and energy efficiency and recycling. Tesco accepts Assured Produce—a similar certification carried by multiple European supermarkets—as an equivalent to Nature’s Choice (FAO, 2006). These private standards have emerged alongside a host of health and safety standards for fruits sector that have proliferated in developed nations over the past 15 years. The increase in safety standards is largely attributed to a greater public awareness of the potential health risks related to foodstuffs and the potentially high costs that private firms face as a result of selling tainted products (Dolan & Humphrey, 2004; Gulati et al., 2006; Lee et al., 2012). Public phytosanitary standards have also become increasingly strict as countries strive to protect their own agricultural production from disease in the face of increased global movement of products. In general, public and private standards are much stricter in developed countries than developing and emerging economy markets such as Russia and China. As a result, fruit producers face a complex system of multiple standards at national, regional and international levels. As seen in Table 9, this system includes public and private standards. Most public standards focus primarily on preventing sanitary and phytosanitary (SPS) problems, but others, such as the USDA focus on import requirements, establish physical requirements for color, size, weight, and spoilage (USDA, 2015).Private standards are also concerned with product quality and size, but also establish requirements that differentiate their products according to environmental, social, and environmental factors of production (FAO, 2006; TESCO, 2005).
5 Filière Qualité: a system that is based on five core principles: taste and authenticity, long-term sustainable partnerships along the supply chain, fair price, constant product quality, and environmental sustainability.
20
Table 9. Prominent Standards in the Fruit Industry
Public Private Mandatory Voluntary Individual Collective
National • National legislation (pesticide use, labor regulations, sanitary inspections etc)
• USDA Standards
• HACCP • USDA
National organic program
• Nature’s Choice (Tesco) • Field-to-Fork (M&S) • Terre et Saveur (Casino) • Conad Percorso Qualità
(Italy) • Albert Heijn BV: AH
Excellent (Netherlands)
• British Retail Consortium (UK)
• Assured Foods Standards (UK)
Regional • European Union Regulations
• • Filieres Qualite (Carrefour)
• EurepGap6 • Dutch HACCP • Qualitat Sicherhiet (QS –
Belgium, Holland, Austria) • International Food Standard
(German, French, Italian) International • World Trade
Organization SPS Agreement
• ISO 9000 • ISO 22000
• SQF 1000/2000/3000 (US) • GlobalGap • Global Food Safety Initiative • SA 8000 • IFOAM Standard
Sources: (Henson & Humphrey, 2009; Steve Jaffee & Masakure, 2005; Lee et al., 2010, 2012). These standards are characterized by a lack of harmonization, both in requirements and enforcement mechanisms across countries, which has added significant cost to compliance. While they remain essential requirement to gaining access to different country markets, the relevance and importance of public standards, which suffer both from underinvestment on the part of governments and are subject to World Trade Organization evaluation, has diminished vis-á-vis private standards, which many producers now find more important (Gereffi & Lee, 2009; Henson & Humphrey, 2009). The standard that has the most impact, by far, is GlobalGAP, which emerged in the late 1990s as the European public grew concerned that government regulations were not strict enough to ensure food safety (Steven Jaffee et al., 2011; Singh, 2013). Today there are over 140,000 certified grape producers across 120 countries (GlobalG.A.P., 2015b). Some U.S. supermarkets, such as Wal-Mart, Giant, and Food Lion, require GlobalGAP, specifically, while many more required it indirectly (GlobalG.A.P., 2015a). Recognizing that actors in fruit value chain faced the daunting task of complying with numerous different sets of standards, a new initiative was undertaken, called the Global Food Safety Initiative (GFSI) (The Consumer Goods Forum, 2015) in an effort to harmonize these systems under one benchmark, and thus recognizes three specific certifications: GlobalGap, Canada Gap and SQF Institute (Global Food Safety Innitiative, 2015). Many large U.S. supermarkets, such as Kroger and Safeway, require GFSI compliance. Similar to GlobalGAP, GFSI was implemented in 2000 as a retailer-initiated effort (FAO, 2006), however, it applies to both the agricultural and packaging stages of the value chain, including an HACCP (Hazard Analysis & Critical Control Points) system (FAO, 2006). For producers to participate in the GVC, they must comply with these standards; selecting which certification to pursue is complex. Standards fall along a continuum, consisting of 6 GlobalGap, an outgrowth of EurepGap, is one of the most widely adopted standards. This standard was first developed in Europe in 1997 by an association of European fresh produce importers and retailers, and principally concerns pesticides and chemical use and application as well as the environmental impact of farming systems. Retailers in the US began to adopt this standard for fresh produce in 2008 (GlobalGAP, 2008).
21
different levels of quality, contingent on the demands of the end market and buyer. When deciding which market to target, producers assess their current capacity and resources to meet these standards.
2.5 Upgrading Trajectories
As global trade in grapes increases, the market becomes more competitive, and buyers become more demanding, firms and countries within the chain must constantly innovate in order to retain their position in the value chain and find new opportunities to add value from their engagement in the global sector. There are numerous strategies that can be undertaken to increase the value-added in the production of grapes. These range from: Entry into the GVC that means participate in the global industry, product upgrading, that is, improving the quality of the grapes sold, to process upgrading, improving the productivity of production, functional upgrading, such as processing grapes to produce raisins and juice to product diversification, that is including new crops in the export basket. Table 10 provides examples of select upgrading trajectories followed by firms and countries that have been successful in the global industry.

22
Table 10. Select Upgrading Trajectories for the Table Grape Global Value Chain
Entry into the GVC
Entry into the table grape GVC. This can occur organically as producers improve quality and shift from serving the local market to serving the regional or global market; or firms can be ‘born global’, with operations established as commercial export-oriented vineyards. Due to the scale and requirements demanded by global buyers, today, this second trajectory is more likely to be successful than the first. Example: Peru’s entry into the grape GVC was based on the development of large-scale, well-financed commercial plantations in new farming areas in the 2000s. As a result of new irrigation schemes and privatization of state land, agricultural areas were opened up for private investment in the 1990s, leading to the rise of commercial agriculture.
Func
tiona
l Upg
radi
ng
Processing Entry into the processing function to produce dried grapes (raisins), grape juice, etc. This requires investment in capital equipment and a new set of workers that can perform manufacturing tasks. Generally, wine country producers are the ones that master the grape juice production and are the leading exporters. Example: Long time table grape producers, Spain, Argentina and Italy, upgraded into processing of the fruit as a means of capturing additional value from their fresh grape production. Chile leverages discarded grapes, which are not suitable for its export market to produce raisins for export (ODEPA, 2014).
R&D Entry into the R&D function to develop new grape varieties. This can help to increase disease resistance, improve sugar content, as well as improve plant productivity amongst others. The development of new varieties has gained importance in driving competitiveness in recent years. Example: 24 Chilean exporters, together with Chile’s INIA and a leading local university, collaborated in the financing and development of four new varieties which are set to enter production in 2020 (Fresh Fruit Portal, 2013). The group intends not only to produce these new differentiated varieties locally, but also to begin to sell this genetic material as a ‘club good’ abroad. The US dominates this segment developing a number of varieties per year; there are over 80 varieties produced today in California.
Process Upgrading
Process upgrading can include the installation of irrigation systems, improved pest management, improvement of the planting material used, amongst others. These processes contribute to increased plant productivity. Process upgrading can also be undertaken in other stages of the chain. For example, reorganization of the workflow in the pack-house can significantly improve labor productivity by making it easier for workers to reach materials, move boxes, etc. Example: Installing irrigation technology alone resulted in an increase of production of Moscatel grapes in Chile from 5,000kg/ha to 20,000kg/ha, 75% of which met commercial standards (Consultora AgrariaSur, 2009). In New Zealand, labor training in pruning, canopy management and harvesting techniques resulted in financial gains of US$4,000 per hectare.
Product Upgrading
Product upgrading can include improving the quality grade of the grapes, producing a more highly demanded/higher value grape variety or a variety with longer shelf-life or pre-packaging fruit into smaller packs instead of exporting as bulk. Example: In order to enter into the regional export market for grapes, Moldovan producers significantly improved the quality of their produce, including weight, form, color, maturity, sugar content and acidity (Palanciuc et al., 2011).
Product Diversification
The production of a larger number of table grape varieties in order to extend the production and harvesting season, mitigate risk of particular diseases or shifts in market preferences, and supply a wider range of products to buyers. Example: Californian table grape producers today export more than 80 varieties of table grapes, the most popular varieties include Sugarone, Flame seedless, Crimson seedless, and Autumn Royal (California Table Grape Comission, 2015).
Chile and South Africa present interesting upgrading cases from the Southern Hemisphere. Currently both countries export a broad variety of fresh grapes to sophisticated markets in the North. Chile’s upgrading, in particular, in the last decade has been remarkable, following multiple trajectories. The country expanded total area under

23
plantation by 17% between 2000 and 2010, increased production by 25%, augmented export volume by 31%, while at the same time more than doubling export value from US$662 million in 2000 to US$1.3 billion in 2010. Product upgrading has continued since 2010, although volumes have held fairly constant in that period, the FOB price per kilogram has increased substantially. Product value improvement alone accounted for 50% increase in export value between 2010 and 2013 (Bravo, 2013). In addition, the country increased grape juice and raisin production, and initiated R&D which will begin to provide returns by 2020. The Genetic Improvement Program in Table Grapes, which brought together the Chilean fruit industry association, 24 grape companies and Universidad Catolica, expects to create four new varieties by this time (Fresh Fruit Portal, 2013). This upgrading has been driven by the implementation of new technologies including controlled irrigation and pest management, phytosanitary management and the incorporation of specialized departments and advisors for post-harvest handling. The South African industry has also upgrading in along multiple dimensions during the past 15 years with a particular focus on the European market. Between 2001 and 2011, South Africa tripled their exports from US$134 million to US$427 million (Barrientos & Visser, 2012). This growth has been driven by improvements in post-harvest technology, use of more efficient inputs and improved supply chain technologies (Ntombela, 2010). The country has also focused on product diversification, adding numerous varieties, particularly high demand seedless grapes. While many producers work with the leading global variety producers, as in Chile, the Agriculture Research Council in South Africa is also working on developing new varieties to sell abroad. The country is also conducting active publicity campaigns in buyers markets to promote their fresh grapes ("Early grape success," 2015). Both countries have also consolidated their upgrading into the wine industry, joining other ‘New World’ wine producers, Australia and the US. To upgrade into the wine industry, grape vines must be at least 10 years old to produce a quality wine. In the case of Chile, some of the vines have been around for more than 100 years, when the Spaniards introduced them in the country.

24
3. Peru in the Table Grape Global Value Chain
3.1 Introduction The table grape export industry in Peru has developed over the past 10 years, characterized by sustained high annual growth rates since its inception. Between 2003 and 2013, grape exports from Peru grew from just US$25 million to US$565 million with exports rapidly gaining access to highly sophisticated markets in Europe and the US. The evolution of the sector has largely followed the pattern of other successful non-traditional agricultural exports from Peru which began 10-15 years ago. These agricultural products, which are mostly new for the country, have been developed based on a strictly commercial and export-oriented strategy using modern farming techniques. Over the past two decades, Peru has emerged as an important global supplier of high quality fresh produce. Non-traditional agricultural exports grew from US$ 226 million in 1994 to US$4.2 billion in 2014, with a five-fold increase between 2004 and 2014. Peru’s new agri-business “miracle” began with the production of simple non-traditional crops and quickly evolved to more sophisticated products; producers began with asparagus, followed by paprika, avocado and citrus then grapes and, most recently blueberries (Field Research, 2015; Meade et al., 2010). Cultivation of asparagus started in the late 1980s in the valley of Ica and production expanded rapidly over the next decade driven by a favorable climate, soil conditions, new irrigation projects and high productivity (O’Brien & Rodríguez, 2004). By 2003 Peru became the largest exporter of asparagus in the world and its exports represented 24,4% of agricultural exports. Table 11 shows the compound annual growth rate (CAGR) of these crops. Exports of the first products in this cycle, asparagus, have stabilized and have entered a more mature stage; grape exports, on the other hand, continue to expand, with the highest CAGR between 2005 and 2012, as existing exporters continue to extend their plantations and new players enter the market. In 2014, fresh grapes became the largest agricultural export, representing 14.9%, followed by asparagus (13.5%), avocado (7.3%), quinoa (4.6%) and mangoes (4.6%). Table 11. CAGR of Peru Exports of Key Agricultural Products, 2005-2012
Product CAGR 2005-2012
Exports FOB 2013 US$ million
Fresh Grapes 38% 412.6 Fresh Mandarins (citrus) 24% 41.1 Fresh Avocado 23% 178.7 Fresh Tangelo (citrus) 19% 22.4 Fresh Asparagus 10% 404.1 Total exports 20%
Source: Asociación de Gremios Productores Agrarios del Peru (AGAP), (SUNAT, 2015b)
Note: The exports noted here are based on Peruvian customs database. Due to differences in reporting protocols, these do not coincide directly with the figures from UN Comtrade, which use imports reported by Peru’s tradining parters.
The history of Peru’s fresh grape production differs from traditional grape country producers, such as Chile, France, Italy, South Africa and the US (California). Peruvian production has been led by large-scale, vertically integrated commercial enterprises that have aggressively invested for the sole purpose of serving the export market. In the other countries, growth was slower and more organic, with small and medium producers selling
25
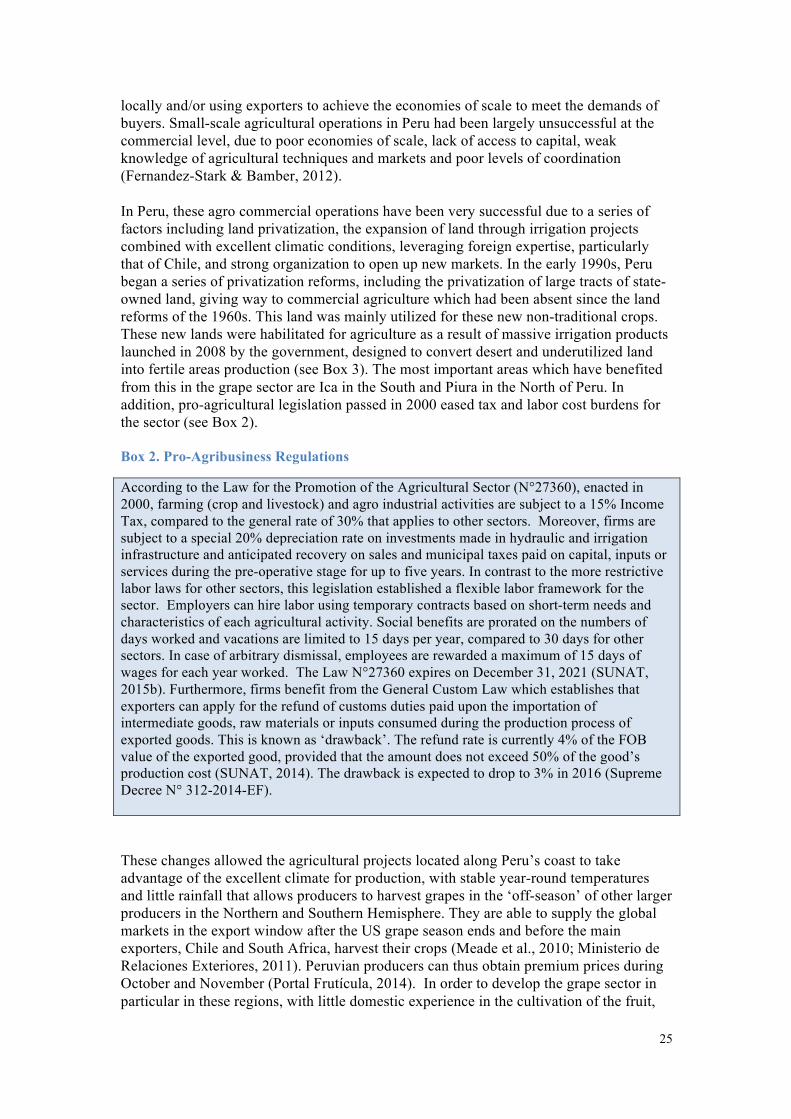
locally and/or using exporters to achieve the economies of scale to meet the demands of buyers. Small-scale agricultural operations in Peru had been largely unsuccessful at the commercial level, due to poor economies of scale, lack of access to capital, weak knowledge of agricultural techniques and markets and poor levels of coordination (Fernandez-Stark & Bamber, 2012). In Peru, these agro commercial operations have been very successful due to a series of factors including land privatization, the expansion of land through irrigation projects combined with excellent climatic conditions, leveraging foreign expertise, particularly that of Chile, and strong organization to open up new markets. In the early 1990s, Peru began a series of privatization reforms, including the privatization of large tracts of state-owned land, giving way to commercial agriculture which had been absent since the land reforms of the 1960s. This land was mainly utilized for these new non-traditional crops. These new lands were habilitated for agriculture as a result of massive irrigation products launched in 2008 by the government, designed to convert desert and underutilized land into fertile areas production (see Box 3). The most important areas which have benefited from this in the grape sector are Ica in the South and Piura in the North of Peru. In addition, pro-agricultural legislation passed in 2000 eased tax and labor cost burdens for the sector (see Box 2). Box 2. Pro-Agribusiness Regulations
According to the Law for the Promotion of the Agricultural Sector (N°27360), enacted in 2000, farming (crop and livestock) and agro industrial activities are subject to a 15% Income Tax, compared to the general rate of 30% that applies to other sectors. Moreover, firms are subject to a special 20% depreciation rate on investments made in hydraulic and irrigation infrastructure and anticipated recovery on sales and municipal taxes paid on capital, inputs or services during the pre-operative stage for up to five years. In contrast to the more restrictive labor laws for other sectors, this legislation established a flexible labor framework for the sector. Employers can hire labor using temporary contracts based on short-term needs and characteristics of each agricultural activity. Social benefits are prorated on the numbers of days worked and vacations are limited to 15 days per year, compared to 30 days for other sectors. In case of arbitrary dismissal, employees are rewarded a maximum of 15 days of wages for each year worked. The Law N°27360 expires on December 31, 2021 (SUNAT, 2015b). Furthermore, firms benefit from the General Custom Law which establishes that exporters can apply for the refund of customs duties paid upon the importation of intermediate goods, raw materials or inputs consumed during the production process of exported goods. This is known as ‘drawback’. The refund rate is currently 4% of the FOB value of the exported good, provided that the amount does not exceed 50% of the good’s production cost (SUNAT, 2014). The drawback is expected to drop to 3% in 2016 (Supreme Decree N° 312-2014-EF). These changes allowed the agricultural projects located along Peru’s coast to take advantage of the excellent climate for production, with stable year-round temperatures and little rainfall that allows producers to harvest grapes in the ‘off-season’ of other larger producers in the Northern and Southern Hemisphere. They are able to supply the global markets in the export window after the US grape season ends and before the main exporters, Chile and South Africa, harvest their crops (Meade et al., 2010; Ministerio de Relaciones Exteriores, 2011). Peruvian producers can thus obtain premium prices during October and November (Portal Frutícula, 2014). In order to develop the grape sector in particular in these regions, with little domestic experience in the cultivation of the fruit,

26
companies leveraged expertise from abroad, and Chile in particular, partly a function of geographic proximity, but also due to the country’s tremendous upgrading record. Chilean investors also entered the sector. Large scale investors provided access to capital to support the relatively high initial investment in infrastructure and technology. Finally, coordination amongst this small number of actors was relatively easy, and they developed a strong industry organization to open up new markets, PROVID, the Asociación de Productores de Uva de Mesa del Perú. This organization has played an important role, ensuring that Peruvian producers meet the SPS requirements of authorities of destination market by supporting the development of SENASA, the public agency responsible for export certification. These factors have quickly led the country to establish a reputation for producing high quality products and most Peruvian producers already sell their owns brands to supermarkets and grocery stores in most major markets around the world. The relative immaturity of the sector compared to peers such as Chile and South Africa, combined with sustained success to date in the fresh grape segment and no tradition of grape processing in the country, has meant few firms have explored further processing as of yet. The industry is thus primarily concentrated in the fresh fruit segment with very limited exports of juice and raisins and other types of products including wine and pisco (grape distillate). Peruvian wine export is incipient (UNComtrade, 2015) and pisco is mainly produced for domestic consumption (Field Research, 2015). Industrial Organization As highlighted earlier, the Peruvian grape sector is characterized by vertically integrated large and medium sized export-oriented firms. These firms typically sell a range of products including asparagus, avocados and citrus. These medium and large firms are mostly Peruvian in origin, although a growing number have foreign investors. Camposol, the country’s largest agro food firm, for example, is a publically owned company and is traded on the Norwegian Stock Exchange (Camposol, 2013). Several Chilean exporters have also expanded their grape production into Peru. El Pedregal, one of the pioneers in the production and export of table grapes in the country, was developed by mixed capital from Chile and Peru, while Sociedad Agricola Rapel which accounted for approximately 6.3% of total Peruvian grape exports in 2013/2014 is a Chilean company. The total number of firms in the sector has increased substantially since 2000, with the attraction of new firms; in 2000, there were just 12 exporters, but by 2012, there were already 114 firms exporting grapes (SUNAT, 2015a). The sector is fairly concentrated with the leading ten grapes exporters accounting for approximately 50% of exports (see Table 12). Smaller firms do not have an important presence in the sector. In 2012, the 60 firms with less than US$1 million in exports comprised just 6% of the total, while the 24 firms with under US$200,000 contributed just 0.5% (SUNAT, 2015a). Large companies mostly have more than 1,000 ha of grape production and they are still in an expansion stage. The sector is well coordinated, and members of the industry association PROVID producing 80% of Peru’s crop.7
7 El Pedregal is no longer a member of the organization (Field Research, 2015).

27
Table 12. Peru’s Top Ten Grape Exporters, 2013-2014
Firm Exports $ Million Share Other Exported Items
El Pedregal S.A. 62.0 9,6% Avocado, tangerine Sociedad Agricola Rapel S.A.C. (Verfrut Peru) 46.6 7,2% Avocado
Complejo Agroindustrial Beta S.A. 34.0 5,3% Avocado, tangerine, tangelo, asparagus
Agricola Don Ricardo S.A.C. 31.8 4,9% Avocado
Sociedad Agricola Drokasa S.A. 30.0 4,7% Avocado, asparagus
Ecosac Agricola S.A.C. 28.3 4,4% Avocado, mango, peppers, shrimps, scallops
Sociedad Agricola Saturno S.A. 23.7 3,7% Avocado, mango
Camposol S.A. 23.3 3,6% Avocado, asparagus, mango, tangerine, pomegranate, peppers, artichoke, red berries, blueberries, shrimp
Agro Victoria S.A.C. 20.6 3,2% Avocado, asparagus, pomegranate
Empresa Agricola San Juan S.A. 18.3 2,8% Blueberries, quinoa
Others 326.2 50,6%
TOTAL 645.3
Source: Company websites, (PROVID, 2014)
3.2 Peru’s Current Participation in the Table Grape GVC As discussed in Section 2.2, the grape GVC is comprised of seven major segments: R&D, inputs, production, packing & cold storage, distribution, and marketing & sales. The current position of Peru in this grape GVC is illustrated in Figure 2 by the red rectangles. The majority of the firms both produce and export fresh grapes. These firms all perform production, packing, and cold storage activities in-house, while many of them also distribute directly to big supermarkets in developed countries using their own brands. Participation in processed products categories raisins and juice is incipient. The majority of the inputs continue to be imported. No R&D activities are performed in the country. Figure 2. Peru's Participation in the Table Grape GVC
Source: Authors
Processing*Companies*
*******
Inputs*
R&D*
Produc6on*for*Export*
Packing*&*Cold*Storage* Processing* Marke6ng*&*
Sales**
Dried*
Juices*&*Pulps*
Medium?Large*Producer*Exporter*Companies**
*Packing*Plants*
(Selec6on,*packing,*cuCng,*labeling*etc)*
Cool*Storage*Units*
Farms*
Supermarkets*
Food*services*
Small?scale*retailers*
Seeds*
Agrochemicals*(Herbicides,*Fungicides*&*Pes6cides)*
Farm*Equipment*
Irriga6on*Equipment*
*Fer6lizers*
*
Distribu6on*
Importers*(wholesalers/dedicated*suppliers)*

28
R&D: Peru does not participate in the R&D segment of the value chain. Seeds, the primary target of R&D in the industry, are mainly purchased by international companies located in developed countries. Leading exporters Agricola Don Ricardo and Camposol, for example, have purchased licenses from SunWorld and IFG (Sun World, 2015). Peruvian firms pay royalties to these firms to produce these new varieties in order to diversify their supply base. Many of these varieties are already in the testing stage to analyze how they adapt to the Peruvian conditions (Field Research, 2015). In the meantime, there are currently no initiatives in Peru to develop new varieties.
Inputs: The Peruvian grape industry imports the majority of the inputs required. Products imported range from large farm equipment to fertilizers, and wires and poles (Field Research, 2015). PROVID also serves as a buying club, offering members a channel through which to aggregate their inputs orders to obtain lower prices. Table 13, page 37 highlights the key products that are imported for the sector and their origin.
Production for Export: In the early stages of production, table grapes were produced in the Ica valley in southern Peru. Recently, with the new irrigation projects, grapes are now also being cultivated in other locations in the north, especially in Piura. Fresh grape exports from Piura increased from 1,500 tons in 2007/2008 to 40,000 tons in 2011/2012, accounting for more than 30% of total grape exports nationally in 2012 (Información Agraria, 2013). Around 30,000 hectares of table grapes are estimated to be cultivated in 2015 (El Comercio, 2015). Table grape production is expected to increase by 15.8% in 2015 as a consequence of new plantings and improved agricultural practices (Fresh Fruit Portal, 2014a). Grape production in these Northern areas of the country has allowed for even earlier harvesting extending the period producers can obtain premium prices.
Box 3. Water and new irrigation projects in Peru
Peru is a country with significant water surplus, accounting for about 4% of the planet's water resources. Divided by the Andes, the country's water resources are distributed into three water basins: Pacific, Atlantic and Lake Titicaca. The Pacific basin in the coast, characterized by its aridity, accounts for 70% of the population and more than 80% the country’s GDP, yet only has access to 1.8% of the country's renewable water resources (Moreno, 2012).
Agriculture is the biggest consumer of water at the national level, at 80%, followed by population use (12%), manufacturing (6%) and mining (2%). Most of the irrigated areas in the country are located on the coast, where agriculture is not viable without irrigation systems. Rivers flowing west from the Andes to the coast supply the bulk of water. The coastal region has several conditions that are very favorable for agriculture, including soil quality, warm weather and the relative availability of infrastructure to access national and international markets.
The Peruvian Government has been investing in coastal irrigation infrastructure at an annual average of US$ 600-700 million between 2008 and 2012 (The World Bank, 2013). The projects have transformed arid land into useful and arable land, such as Chavimochic in northern Peru. Several additional projects, as well as expansion of existing ones, will be implemented in the coming years to meet increasing demand for water and land by the booming agricultural sector. Through concessions, the private sector is also playing an important role in complementing the required investments in infrastructure. Thus, as a result of public-private investments, more than 200,000 new hectares are expected to be available for agriculture by 2020.

29
Figure 3. New Irrigation Projects in Peru
Source:(Camposol, 2015).
Processing: The sector principally produces fresh grapes, and does not yet export processed grapes in form of raisins or grape juice, although a small amount of processing is carried out using discarded grapes for the local market. The high returns from the fresh grape exports has lowered firm interest in upgrading into this stage of the value chain (Field Research, 2015). Moreover, processing grapes for export requires significant investments in capital equipment and a shift from agriculture activities to manufacturing. In addition, table grapes is a new crop for the country, with limited local demand. Local fruit juice consumption is dominated by tropical fruits, including passionfruit and mango (see Box 4). As highlighted in Section 2.3, the economies that export processed grape products, including Argentina, Chile, France, Italy and the US, have a long tradition of cultivating grapes and their internal markets demand processed grapes in the form of juice or raisins. For example, in the case of Chile, even with very high fresh grape exports, around 25% of the table grape production is allocated for grape processing (ODEPA, 2014). Box 4. Peru's Emerging Fruit Juice Sector
Peru’s fruit and vegetable juice exports have expanded rapidly from just US$4 million in 2005 to US$52 million in 2013 (UNComtrade, 2015), led by exports in passion fruit juice. The global sector export amounted US$16.5billion in 2013. Passion fruit juice exports have grown significantly during this time with over 10,000MT in exports in 2011. Quicornac, the largest firm in the sector, accounting for approximately one third of the country’s exports is foreign with combined Swiss-Ecuadorian capital which established operations in Peru in 2008. Other firms include Agromar Industrial, Agroindustrias AIB, Corporacion Lindley (a Coca-Cola Company) and Selva Industrial. These firms all export both passion fruit and mango juice while some produce a wider range of fruit juices for the local market, including orange, pineapple and camu camu juice. These products are primarily destined for the Netherlands and the U.S. Source: (Fresh Fruit Portal, 2014b; Freshplaza, 2012; Pekic, 2015; Quicornac, 2015; UNComtrade, 2015)

30
Packaging: As the local industry is vertically integrated, the same grape producers own their packing houses which are located in the area of production. This is a very different model than that operated in Chile, where exporters often do not have their own production. These pack houses are usually run by a predominantly female labor force who package the grapes according to buyers’ specifications regarding materials, weight, varieties, etc. According to the producers, one of the most difficult tasks in the early years of the industry’s development was managing these packing plants due to the lack of skills of the labor force (Field Research, 2015). Cold storage: Cold chain management has been widely adopted by the large and medium producer-exporters in Peru and has been considered a standard element of their production model since their entry into the GVC (Field Research, 2015). The cold storage units are integrated with the pack houses and owned by the grape producers. The cold chain is a critical aspect in the export of grapes as temperature changes directly affect the quality of the grapes. Some of the most demanding Peruvian markets require ‘extra cold treatment’ to minimize the potential of pest contamination. This extra process increases the total cost of US$700-US$1,000 per container (Field Research, 2015). Distribution and Logistics (Export): There are two ports to export table grapes in Peru. Callao, the main Peruvian port located in Lima, dispatches grapes produced in southern Peru, especially from Ica, while Paita, handles the growing volume of grapes from the north. This later port, however, is limited to smaller-sized ships. Overall, the cost of the sea transportation from Peru is still very expensive, especially in Paita since the ships do not unload freight. As they only load fruit, exporters must assume costs for both unloading empty containers and loading the full ones. As a result of these high costs, several grape companies are collaborating to negotiate with shipping companies to reduce their fees. Road transportation is also expensive. Moving a container from Trujillo to the port in Callao (550 km) costs approximately US$1,500; this is twice the cost of shipping the same distance in the US (Field Research, 2015). Marketing and Sales: Peruvian grape producers sell to most major export markets as well as to regional markets (SUNAT, 2015a). Generally, in addition to directly exporting their production rather than using intermediary exporters, grape producers in Peru also tend to maintain relationships with supermarkets, their primary customers. Relationships with brokers or other intermediaries are mostly reserved for customers handling smaller volumes such as greengrocers and convenience stores, where these actors help to reduce transaction costs (Field Research, 2015). Many firms, however, use a mixed approach in order to mitigate risks of shipments being rejected by supermarket clients. By maintaining relationships with brokers, firms can utilize these actors to re-direct rejected lots to less demanding customers. This is facilitated by the fact that the majority of the Peruvian grape producers have developed their own brands which account for the majority of their sales, although many of them have also offer private label services for their buyers. This allows for grapes to be re-directed without further handling to repackage. Human Capital in the Grape Sector in Peru Grape production is labor-intensive and as such the sector provides an important source of rural employment. During harvest season in Peru, for example, a firm can require 6-7 workers per hectare (Field Research, 2015). In 2015, Peru had an estimated 30,000 ha

31
under cultivation, thus requiring some 180,000 to 210,000 farm workers during the peak of the season. While this is an important source of employment, low productivity of labor increases the costs of production. Although Peru’s labor costs are just half those of Chile at US$20/day compared to US$40/day (Field Research, 2015), companies in the sector estimate that labor productivity in Peru is just half that of Chile. Chilean productivity in turn is half of that of California. Thus, the sector in Peru requires four employees to complete the tasks carried out by one employee in California and two in Chile. The implications of this is that a very large number of people are required to carry out the tasks, in what is already a very labor-intensive sector. This undermines the competitive advantages Peru offers in terms of low labor costs. Low productivity can be attributed to the country’s limited experience in the production of grapes, a weak education and training sector to develop the required skills and the poor living conditions of the rural population amongst others (Field Research, 2015). First, as this crop is relatively new to the country, workers have had to learn all of the required techniques from scratch and workers have not yet begun to specialize in specific tasks. This has been compounded by the need to adjust these techniques -- developed in other countries -- to the Peruvian context. Technology transfer has mainly flowed through international experts hired by the local Peruvian firms. There are not yet national programs in place focused on promoting best practice. Second, this learning has principally been done ‘on-the-job’ as there are no technical training programs or organizations that teach specific skills for the sector. This applies not only to those workers involved in manual labor, but also includes technicians and management. Only recently have new initiatives focused on developing a better understanding of agribusiness have emerged in a few of the country’s business schools (Field Research, 2015). Third, the rural agricultural labor force is comprised primarily of poor people, living without basic services such as potable water, electricity, adequate housing, etc. This lack of basic service provision distracts time and energy away from work (Bamber & Fernandez-Stark, 2013). Unlike the widespread informal labor trend in the country and general trends in the global agricultural export industry, employment in the Peruvian grape export industry is generally formal (León, 2012). Workers are hired through the agricultural labor regime (Law N°27360), a flexible labor framework characterized by temporary contracts lasting from 3 to 11 months a year, based on the needs of each agricultural activity (IESI, 2014b). Long-term contracts are scarce. Salaries must be equal or higher than the minimum monthly salary established by law (around US$ 238), but in contrast to other sectors, vacations and other benefits (bonuses, unemployment fund) are included in the salary and prorated on the numbers of days worked. According to the law, daily wages are set at US$9.30. Most workers’ income exceeds the minimum daily wage by working overtime or meeting production incentives. Thus, on average, a worker receives between US$64.70 and US$95.20 weekly (IESI, 2014a), with daily wages increasing during the high season. This compounds the problem of low labor productivity for production costs. Access to formal labor provides benefits and health insurance can dramatically improve the lives of farm workers. Although labor benefits are less than other sectors, most employers compensate their workers with others benefits, including transport, food and in some cases housing and child daycare (Field Research, 2015). In addition, women and men are equally employed, with women participation above 40% and increasing rapidly (Apoyo Consultoría, 2012; IESI, 2014a).

32
3.3 Upgrading and Value-Added Analysis in the Peruvian Table Grape GVC Peru has made a dramatic entry into the table grape GVC with particularly rapid growth over the past five years. In 2013, the country was already the 5th largest global exporter of fresh grapes. This growth has been facilitated by the recent previous experience in exporting non-traditional agro products – asparagus, avocados and citrus -- and also by the participation of Chilean producers that expanded their operations to Peru, transferring not only their technical, but also their deep market knowledge and experience to the country. These combined learning trajectories have enabled Peru to achieve a high degree of market diversification for its grape exports, exporting to developed and developing economies in all regions. Currently, some firms are exploring variety diversification, although red globe continues to be the majority of their production which could be problematic in the long term if diversification is not accelerated. The country has been able to expand in the fresh grape sector; however, it has not yet upgraded into the processing stage of the chain. 1. Rapid expansion of the table grape industry: Peru became the 5th largest table grape exporter in 2012. Peru has demonstrated impressive industry growth in the last decade. As can be seen in Figure 4, Peruvian exports of fresh grape have grown significantly in the last decade. In 2003, the country exported US$25 million; by 2013 exported had reached US$ 565 million and the country had become the 5th largest fresh grape exporter in the world after Chile, Italy, US and South Africa (UNComtrade, 2015). Comparatively, very little upgrading has been made into the processing segment of the value chain, as the industry is still relatively immature. Usually the main exporters of raisins and grape juice have a long established tradition of grape cultivation. Figure 4. Peru Exports in the Grape GVC, By Product Category 2003-2013
Source: UN Comtrade, 2015. HS-080610 fresh grapes; HS-080620 dried grapes; HS-200960 grape juice.
2. Two main drivers facilitated the entry of Peru in the table grape GVC: product upgrading into grapes by established domestic horticulture firms and expansion of Chilean grape firms in Peru. The first driver of Peru’s entry into the grape GVC was capabilities development in the exports of other non-traditional agro crops, including asparagus, citrus and avocados. The second driver was the transfer of extensive technical and market knowledge of Chilean grape firms which expanded their operations into Peru to take advantages of the climate and early harvesting. These two drivers have resulted in
25 23 42 54 77 117 141 221
381 475
565
0
100
200
300
400
500
600
2003 2004 2005 2006 2007 2008 2009 2010 2011 2012 2013
Exp
ort V
alue
($, M
illio
ns)
Grape Juice
Dried Grapes
Fresh Grapes

33
distinct patterns of entry and product upgrading that can be identified from the analysis of firm-level exports of the top 18 grape exporters in 2012 shown in Figure 5. The first set of firms that entered the GVC via product upgrading from lower value horticultural products are quite diversified, and have continued to upgrade into new products. General product diversification began with asparagus, followed by citrus, then avocados and grapes, and now into blueberries. The second set of firms began their operations in Peru exclusively focused on grape production. Industry interviews highlight these firms were mostly Chilean firms. Between 2002 and 2012, these firms subsequently undertook very little product diversification and only produce small quantities of one product in addition to grapes. Figure 5 highlights these two different models. Firms that diversified are also typically considerably larger in terms of total exports. Figure 5. Top 18 Grape Exporting Firms in Peru, Entry and Evolution by Product
Source: (SUNAT, 2015a).
0"
50"
100"
150"
200"
250"
300"
350"
400"
2002" 2004" 2006" 2008" 2010" 2012"
Millions'
Chilean Firms Exporting Grapes From Peru
Grapes" Avocados"
0"
50"
100"
150"
200"
250"
300"
350"
400"
2002" 2004" 2006" 2008" 2010" 2012"
Millions'
Domestic Firms Exporting Grapes From Peru
Asparagus" Avocados" Citrus" Peppers" Passionfruit/Mango" Shrimp" Grapes"
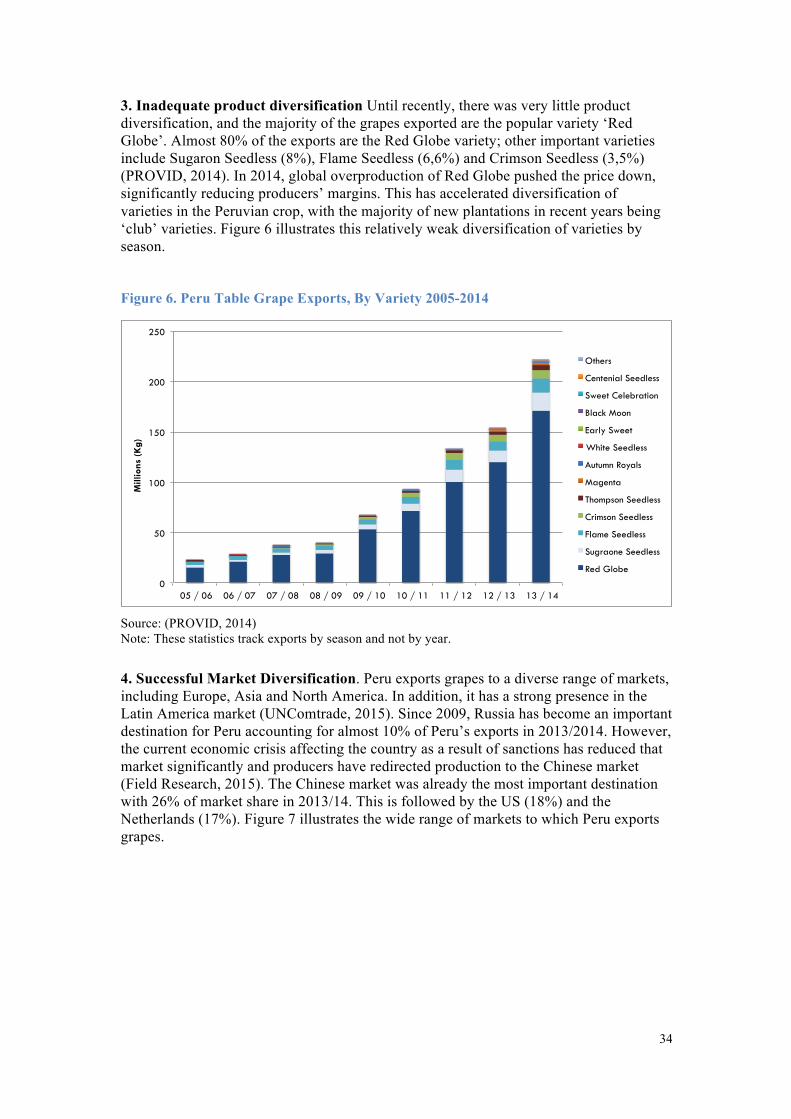
34
3. Inadequate product diversification Until recently, there was very little product diversification, and the majority of the grapes exported are the popular variety ‘Red Globe’. Almost 80% of the exports are the Red Globe variety; other important varieties include Sugaron Seedless (8%), Flame Seedless (6,6%) and Crimson Seedless (3,5%) (PROVID, 2014). In 2014, global overproduction of Red Globe pushed the price down, significantly reducing producers’ margins. This has accelerated diversification of varieties in the Peruvian crop, with the majority of new plantations in recent years being ‘club’ varieties. Figure 6 illustrates this relatively weak diversification of varieties by season. Figure 6. Peru Table Grape Exports, By Variety 2005-2014
Source: (PROVID, 2014) Note: These statistics track exports by season and not by year.
4. Successful Market Diversification. Peru exports grapes to a diverse range of markets, including Europe, Asia and North America. In addition, it has a strong presence in the Latin America market (UNComtrade, 2015). Since 2009, Russia has become an important destination for Peru accounting for almost 10% of Peru’s exports in 2013/2014. However, the current economic crisis affecting the country as a result of sanctions has reduced that market significantly and producers have redirected production to the Chinese market (Field Research, 2015). The Chinese market was already the most important destination with 26% of market share in 2013/14. This is followed by the US (18%) and the Netherlands (17%). Figure 7 illustrates the wide range of markets to which Peru exports grapes.
0
50
100
150
200
250
05 / 06 06 / 07 07 / 08 08 / 09 09 / 10 10 / 11 11 / 12 12 / 13 13 / 14
Mill
ions
(K
g)
Others
Centenial Seedless
Sweet Celebration
Black Moon
Early Sweet
White Seedless
Autumn Royals
Magenta
Thompson Seedless
Crimson Seedless
Flame Seedless
Sugraone Seedless
Red Globe

35
Figure 7. Key Destination Markets for Peru Grape Exports, 2000-2012
Source: UNCOMTRADE, HS92-080610; retrieved 2/15/15; exports represent imports from all countries The market destinations of Peruvian companies, however, differ by export size. As can be seen in Figure 8, companies with low level of exports (<US$1 million) serve principally developing and emerging country markets, while the main markets companies with high levels of grape exports (>US$10 million) are developed countries. Countries with exports between US$1 million and US$10 million export similar shares to both developed and developing country markets. For example, in 2012, Russia (emerging market) was a more important destination for smaller and mid-size exporters, while the UK (developed country market) was served primarily by the mid-size and larger exporters only. Figure 8. Export Destinations by Firm Export Size, 2012
Note: Export destinations based on the top twenty export destinations for each group size. Exporters included as low, exported under US$1 million in 2012, medium, between US$1 million and US$10 million and high, over US$10 million in exports. Source: Authors based on (SUNAT, 2015a)
0"
10"
20"
30"
40"
50"
60"
70"
80"
2000" 2001" 2002" 2003" 2004" 2005" 2006" 2007" 2008" 2009" 2010" 2011" 2012"
Millions'
China"
USA"
Netherlands"
Russia"
United"Kingdom"
Thailand"
Colombia"
Indonesia"
Korea"
Spain""
Canada"
0
10
20
30
40
50
60
70
80
90
100
Low Medium High
%
Level of Firm Exports
Developed Country Markets
Emerging & Developing Country Markets
36
Firm interviewed highlighted that they grade their grapes according to these different markets.8 These destination markets differ in terms of demanded quality standards. In general, the more demanding markets are the United States and Europe and the less demanding markets are Russia and Latin America. As a result, the highest quality grapes are typically destined for Europe and sophisticated segments of the US and Asian markets. Medium quality grapes are destined for the US and Asia and the lowest quality grapes for Latin America and Eastern Europe. Nonetheless, the low quality segment accounts for just a small portion of the crop and usually there is very little waste(Field Research, 2015). A small detail such is the colour of the grape may affect the quality specification, and thus the ultimate destination of the product. For example, darker grapes, considered to be superior in quality, are sent to Europe, while the same grape which are lighter in colour are directed to the Asian market. Many of the producers are certified under quality standards from the large buyers, including Tesco, one of the largest European supermarkets and Wal-Mart, the largest American retailer. Satisfying public SPS standards established by the country’s growing number of destination markets has required a strong coordination between the private sector and SENASA, the Peruvian agency in charge of SPS controls. One of the main issues is the pest situation in Peru, and the fruit-fly, in particular, as it has not yet been eradicated in the country. Producers themselves have had to undertake strict monitoring of both plantations and neighbouring farms has been required to prevent this problem from resulting in exclusion from key markets, adding to their production costs (Field Research, 2015). 5. Weak backward linkages. The majority of the inputs for grape production are imported and, despite 15 years in the industry, there is still limited participation of local companies. Equipment is imported from developed countries, wooden crates (treated for microorganisms) stakes and wires are imported from Chile. Fertilizers are brought from countries such as the US, Israel and Spain. The industry also imports a number of packing materials such as plastics and wrapping material from the US, China and Colombia among others. Local plastics providers have not yet developed the expertise to provide materials with exact specifications grape exporters require (Field Research, 2015). Table 13 highlights the key products (origin and size) that are imported by the largest grape exporters in the country. Firm interviews indicated that some of the locally available supplies are provided by Chilean representatives in Peru and thus do not appear in firm import statistics. These statistics indicates that there is potential for smaller, but specialized, local suppliers in Peru to explore input provision for the sector.
8 See Table 18 in the Appendix for a breakdown of the principal grading categories used in the global grape industry.

37
Table 13. Key Imported Inputs for Peru Grape Sector
Input Value (US$) Share Sector
Imports
Imported from
Chemical products (Insecticides, rodenticides, fungicides, herbicides, anti-sprouting products, plant-growth regulators, etc)
8,060,323 21% Spain, Israel, USA, China, Mexico, Chile, South Africa, Argentina, Japan
Plastics for packing (lids, caps, sacks and bags)
6,839,201 18% USA, Israel, Chile, Colombia, China, Israel, Mexico, Spain
Machinery and mechanical appliances 5,880,528 16% USA, Spain, Germany, Israel, Guatemala
Wood articles for packing (cases, boxes, crates, drums, pallets)
3,293,088 9% Chile
Rubber articles (conveyor belts, plates, sheets, strip) and clothing accessories (gloves, mittens and mitts)
2,636,858 7% Ecuador, Colombia, Korea, Thailand, Malaysia
Paper and paperboard (boxes, cartons, cases, bags)
2,102,379 6% Chile, Argentina
Base metal articles (stoppers, caps, lids) and packing accessories
1,550,171 4% Spain
Electrical machinery and equipment (boards, pannels, electrical capacitors, heaters).
1,074,804 3% USA, Australia, Israel, Italy, Chile
Structures and articles of iron or steel (pot scourers, springs, screws, bolts, nails, wire).
980,908 3% Chile, USA
Modified starches, glues, enzymes, gelatin and gelatin derivates
754,574 2% Colombia
Others 4,597,337 12% Total 37,770,171
Source: (Field Research, 2015).
6. More than half of the value generated in the Peruvian grape industry accrues to foreign actors. Table 14 shows that Peru captures around 35% of the value of the table grapes exported in 2013; however, based on the analysis above on inputs, some portion of the 10.6%, of value indicated should be discounted since the majority of them are imported. Domestic logistics costs clearly undermines competitiveness, as they account for up to 29% of the final cost; this is almost double that of other producers such as Chile (Field Research, 2015). In addition, other costs can be reduced such as labor costs (4.3%) could be halved with an increase in productivity. Price paid for the grapes can be pushed higher selling other type of grape varieties. With respect to intangible stages of the value chains (which are not broken out in Table 14 below), many of the large producers sell their grapes under their own brands, thus participating in downstream segments of the chain. However, effectively it is unclear how much additional value this provides to the producer, and the largest margins are captured by the importer in the destination market, in this case a supermarket in the Netherlands. Furthermore, no R&D is undertaken in the country and the royalties for new varieties being grown accumulate to US firms.

38
Table 14. Value Distribution in Table Grapes Exports of a Large Producer-Exporter from Peru to Holland, 2013
Source: (IESI, 2014a).
3.4 Grape Industry Institutionalization in Peru: An Assessment for Local Context for GVC Upgrading
There are two important points to stress regarding the local context in which the industry operates. First, there is limited overall industry institutionalization; that is, it requires more interaction between the public and educational institutions and the private sector. Currently, the industry has been mainly driven by the initiatives of the private sector alone. Second, efforts of the private sector’s industry association, PROVID, have been focused mainly on opening markets and gathering statistics and it has not been involved in laying the foundations for a well-institutionalized sector. Table 15 highlights the main industry stakeholders in Peru and describes the role each plays in shaping the industry dynamics at the local level.
ACTIVITIES IN THE VALUE CHAIN Price
US$/kg Cost
US$/kg % Value
Distribution
ABR
OA
D
(65%
)
Consumer Price in Holland 6.24
Retailer margin 2.0 32.0%
Importer price 4.24
Importer margin 1.53 24.5%
Cost of delivering goods in agreed location (DDP) 2.71
Import costs, including taxes and transport to warehouse 0.19 3.0%
Transport and insurance 0.34 5.4%
PERU
(
35%
)
FOB price 2.18
Cost of delivering goods in port of Peru (FOB) 0.17 2.7%
Pack house price 2.01
Production margin 0.50 8.0%
Post harvest and packing 0.43 6.9%
Indirect Costs 0.15 2.4%
Inputs 0.66 10.6%
Labor Costs 0.27 4.3%
TOTAL VALUE 6.24 100%

39
Table 15. Peru Grape Sector Stakeholders Analysis
Stakeholders Description Level of Importance
Power and influence
Large and Medium Grape Companies
These companies are relatively new with a focus on export. They use modern agriculture techniques and they are on a expansion phase.
High High
PROVID Industry association representing grape producers which was created in 2001, with 74 members.
High High
SENASA Servicio Nacional de Sanidad Agraria del Perú
SENASA is a technical group within the Ministry of Agriculture in charge of local SPS standards and ensuring that these meet the requirements of destination markets.
High High
Government of Peru – Ministry of Agriculture
The mandate of the Ministry of Agriculture is to support the competitiveness of agricultural products, increase the use of technology in crop production, facilitate access to new markets and promote the development of rural families.
High Low
Technical Educational Institutions
There are no technical education programs focused at the production level; some universities, including EASAN, are beginning to offer some related agro-business courses at the graduate level.
High Low
Prom-Peru Agency responsible for export promotion; primarily support SMEs. Orientation of foreign offices is not very commercial.
Medium Low
Source: Interviews, organizations’ websites.
Note: The level of importance describes the relevance of the actor in the operation of the value chain activities. Power and influence describes the level of control the actor has over the value chain operations and development. As noted above, the private sector has generally been well coordinated to date, through the industry association, PROVID, whose members account for 80% of Peru’s table grapes exports. The organization has played a key role in supporting the opening of new markets around the world as well as providing essential coordination and training for SENASA officials to ensure that the institution is in a position to support their market expansion. Now that all but one major market (Japan) is open to Peruvian grape exporters, however, the organization runs the risk of becoming obsolete if it does not adapt its objectives to meet the new phase of development in which the sector is embarking. For example, the country’s largest producer, El Pedregal, recently withdrew its membership (Field Research, 2015). In particular, efforts are required to drive coordination with other key industry stakeholders. SENASA is perhaps the most relevant government organization for the sector, as it is responsible for ensuring that exports meet the required SPS standards to gain access to their destination markets. However, the organization lacks sufficient numbers of qualified personnel, does not have the necessary equipment, and basic procedures take unnecessarily long time to complete (Field Research, 2015). Some of these problems are more extreme in Piura where offices still need to adapt to the northern expansion of the agro-sector. According to one firm, for example, SENASA’s Piura inspectors must still send samples to Lima for testing, as they do not have even basic equipment -- including microscopes -- in Piura. In other cases, bureaucratic delays and lack of resources, prevent government approval for critical international travel required to resolve SPS issues with import authorities and the companies themselves have to finance travel for SENASA officials to key markets.

40
While coordination between private sector actors and SENASA is generally high, there is little interaction between firms and other government institutions such as Ministry of Agriculture, Ministry of Foreign Trade, PromPeru, and educational institutions among others. Despite their importance in facilitating the continued growth of the sector, these other organizations to date have had little involvement. Educational institutions fulfill a key role in the industry, providing not only the skills required by the industry but also in supporting innovation in production and the adoption of new technologies. However, currently in Peru, there are no educational institutions of any type that prepare human capital for the sector and there are no skills certifications schemes for the industry workers (Field Research, 2015). The country has a deficit in human capital for the grape sector at the low, medium and high level of skills, yet educational institutions are not developing new curricula to support the development of modern agriculture with advanced techniques in new crops for the country. Due to the scarcity of qualified personnel, companies often need to hire from abroad, particularly from Argentina, Chile, Italy and Spain.
3.5 Advantages and Constraints for Upgrading To date, Peru’s entry into the table grape GVC has been very successful. The grape industry has being advancing at a rapid pace, contributing to export diversification and employment, particularly in rural areas. The country has many competitive advantages to produce and trade grapes globally. However, there are a number of constraints that can limit the future development of the sector. Some of those constraints are transversal to numerous Peruvian industries, while others are specific to the grape production. This section discusses the advantages and constraints of Peru’s current economic, social and institutional context for upgrading in the value chain.
Table 16. Summary of Key Advantages and Constraints for Industry Upgrading
Advantages Constraints Good climate for cultivating grapes Lack of skilled labor in all the stages of the
grape value chain. This erodes productivity.
Well financed modern agriculture to export grapes
Overdependence on red globe variety. Red globe is in oversupplied globally and prices decreased.
Low labor costs, especially rural employees No comprehensive industry strategy. Lack of holistic plan for the future that group all the industry stakeholders.
Access to a very large number of markets due to Free Trade Agreements and SPS regulations agreements
Weak transportation infrastructure to manage the increased grape exports
Bureaucracy delays export process eroding competitiveness
Good Climate. The country has a perfect climate to cultivate grapes. The dry coast with stable temperatures supported by expanding irrigation projects (see Box 3) creates ‘green house’ conditions. These conditions allow for both the rapid maturation of the vines, which come into production in Peru 60% faster than in other regions, as well as providing flexibility with respect to the harvesting season. This flexibility has allowed Peru to take advantage of the October-November low-season window between the harvests of other

41
major producers. Peruvian suppliers thus obtain higher prices for their grapes due to the global high demand and low supply. This has helped to attract Chilean investors to the sector looking to extend their combined production season. Well Financed Modern Agriculture. Traditional agriculture in Peru is based on small plots managed by poor farmers with no access to finance, technical assistance and who cannot meet the economies of scales required to export. Non-traditional agricultural crops and specifically grape production in Peru, however, has been commercially oriented since its inception two decades ago. Production has been driven by investors with the financial capital to introduce modern agricultural practices and techniques. Together with good climate, these practices have resulted in the consistent production of high quality grapes, and Peruvian producers have quickly gained a good reputation worldwide for their grapes and other non-traditional agricultural products. Camposol, for example, although a recent entrant into the grape sector is the world’s single largest producer of asparagus and one of the largest global producers of avocado. The company is traded on the Norwegian stock exchange, and is valued at (Camposol, 2015). Grape producers sells directly to the large buyers in the world such as Tesco, Wal- Mart, Carrefour, etc. Furthermore, the Peruvian producers trade their grapes with their own Peruvian brands displayed in the most important supermarkets of the world.
Low Labor Costs. Peru has low labor costs compared to most other grape exporting countries; for example, labor costs in Peru are approximately half those of Chile. In particular, many of the new cultivated areas around Piura have access to a large quantity of low cost labor. In the southern areas, however, especially in Ica, the labor costs have risen due to a greater labor demand. This has increased the importance of improving labor productivity through training as well as issues of labor certification to facilitate mobility. One firm noted that in Ica, laborers are starting to form work teams in order to jointly negotiate their fees. Producers would benefit greatly from a standardized certification system which would help them to recognize the skills levels of these different groups and establish pay levels appropriately. Access to Markets. Peru has signed numerous Free Trade Agreements with key countries. This, combined with the work of PROVID and SENASA to fulfil a number of SPS regulations, has facilitated the entrance of Peruvian grapes to international markets. Nowadays, the sector has a diverse market base, exporting grapes to over 70 countries, including the most sophisticated markets in Europe. This access has already generated positive spillovers for smaller producers to export to these markets as well as generating opportunities for the future export of other crops. Constraints Lack of skills of the labor force. Workers in rural areas are not prepared to produce, handle and manage these new types of crops. The labor advantages gained in cheaper labor costs are equalized by low productivity of the workers. This lack of skills affects all levels of operations, from farm workers to technicians and managers. Workers do not have experience working with grapes and the training has primarily been in-house on-the-job training. At the technician level, they learn in the field and from the supervisor’s instructions, while the managers are usually hired from aboard. The majority of the companies interviewed have the professional and managerial staff from Argentina, Chile, Italy, amongst others (Field Research, 2015). Formal training would have a major impact on productivity, boosting the industry competitiveness.

42
Overdependence on one ‘commodity’ variety. Peru’s dominant production of the Red Globe variety exposes the sector to high competition globally. During the last campaign the excess of production of Red Globe saturated the market, resulting in 25-30% reduction of prices; in 2013/2014, boxes of Red Globe were sold at US$16-17 per box, while during the previous years the prices fluctuated between US$22-23 per box. Today around 80% of the total exports are the Red Globe variety. This internal problem is undermines the seasonal competitive advantage that Peru possesses. The premium prices that Peru obtains for offering grapes in low season of grape world production are discounted due to the overproduction of Red Globe. Missing industry value chain strategy: The grape industry in Peru has thus far been successful; however, new challenges need to be addressed to ensure sustained growth. At the moment, there is no centralized and comprehensive table grape industry strategy regarding the country’s objectives for the medium and long term. Furthermore, there is little communication between the private sector and other key industry stakeholders, such as educational and training institutions, to align the main issues and work together to find solutions. In particular, as noted above, efforts need to be made to increase labor productivity through training, as well as strengthening backward linkages. The majority of the grape industry inputs, including basic inputs such as wires and poles for vine cultivation and wood boxes and plastic bags for packaging, continue to be imported, increasing cost of production. The local sector has not been able to provide some of the simple inputs for the industry. Weak Port and Road Infrastructure. The country’s two fruit-exporting ports are not fully prepared to receive the export volume, especially during the high season, when delays are common. Export volumes have increased considerably with the growth of the non-traditional agricultural exports, and the port sizes have not increased to meet this new demand. The road infrastructure has improved recently; however, the quality of the roads are not good, especially to transport fragile crops as are the grapes and firms complain that this occasionally leads to a decline in quality. These infrastructure problems make logistically challenging to move the fruit and erode some of the competitive advantages of being closer to the US. In addition to port infrastructure, the shipping services offered from Peruvian ports are not yet fully reliable. One firm mentioned that one shipment had taken 20 days longer than the predicted 45 days in transit to reach the destination port (Field Research, 2015). Given that the cold chain management is calculated based on estimated transport times, this type of unpredictable delays makes it difficult for firms to ensure grapes arrive in optimum condition to their final markets. Bureaucratic problems. One of the most pressing issues in the sector is the high level of bureaucratic procedures required to operate. These types of problems are usually related to essential government services. For example, one firm highlighted that opening its new packing plant took months to start operations, since inspectors were not “available” to approve them for operation. Similar delays are not uncommon in customs; any delay can affect the final quality of the grapes arriving in their destination. SENASA has also had difficulty meeting the demands of the agro-business export boom. The organization lacks modernization, budget and a proactive approach to support the industry growth. Grape companies associated in PROVID sometimes must fund SENASA officials to travel overseas to deal with phytosanitary issues. These problems are so urgent that they cannot wait for the internal bureaucracy to provide the funds for the trip.

43
4. Potential Upgrading Trajectories for the Grape Sector in Peru
4.1 Recommended Upgrading Trajectories Although Peru is currently benefiting from a flourishing table grape industry, it is also the correct moment to establish strategies to move the industry forward and to identify ways in which to leverage the success of the industry for the Peruvian economy. The recommended upgrading trajectories thus focus on making the sector more competitive, continue formalizing employment and enable it to capture more value while generating spillovers for the broader economy. While these set of recommendations are specifically designed for the table grape sector, many of them are applicable to the broad non-traditional agricultural crops that face similar experiences. Process Upgrading including Increased Labor Productivity, Technological Sophistication of Production and Improved Efficiency of SENASA: Three key areas for improving the efficiency of operations in the production of table grapes with respect to labor, quality and regulation can be identified. First, labor productivity needs to be improved considerably to avoid eroding competitive advantages of the country’s low cost labor. Training in production techniques such as at the pruning, canopy management and harvesting level can contribute significantly to improved labor productivity in grape production. Table 17 shows the different areas in which workers in New Zealand were offered training. After the training, the financial gains amounted US$4.078 per hectare for each trainee. The analysis indicated that annually there is a benefit of 5.7 times the cost of training workers (Neid et al., 2010). This type of training which also improves general agricultural knowledge can generate knowledge spillovers to the smallholder communities in which workers live. Table 17. Increase in Performance After Training- Vine in New Zealand
Activities Before Training
(scale 1-5)
After Training
(scale 1-5)
Average Change After
Training
Comments
Pruning 2.4 4.5 2.1 Trainees mostly supervise pruning
gangs but occasionally are hands on pruners as well.
Canopy Management
2.4 4.5 2.1 Trainees mostly supervise hand on canopy management such as shoot or bunch removal or do the tractor driving for leaf plucking or shoot trimming.
Pest & Disease Management
2.2 4.2 2.0 Trainees mostly apply agrichemicals or monitor for pest and disease.
Harvesting-Hand
2.7 4.9 2.2 Trainees mostly supervise hand harvesting.
Harvesting- Machine
2.1 4.3 2.0 Some of the most skilled or those with good machinery skills will drive harvesters or fruit receival bins.
Source: (Neid et al., 2010).
Second, as competition for the high quality segments continues to increase with new market entrants, increased technological upgrading in terms of post-harvest handling should be incorporated. In South Africa and Chile, leading firms are beginning to create specialized departments within their organizations focused on managing all aspects of post-harvest fruit quality – including improved understanding of behavior during shipping

44
periods of different lengths. Finally, the efficiency of SENASA and its ability to respond to potential SPS challenges needs to be improved to meet the growing agro-export sector. The organization requires regional laboratories outfitted with the appropriate technology to carry out basic analysis of common SPS issues for each specific region. Upgrading into Higher Value Varieties and R&D: In the short to medium term, Peruvian producers need to shift the varieties produced away from Red Globe grapes towards other higher value grape varieties, such as seedless grapes. Producers in California, Chile and South Africa have been steadily diversifying their varieties to create niche markets that are to some degree insulated from competition. Larger producers within the country have begun to do this through the licensing of varieties developed aboard and, indeed, several companies have begun to do so. The testing of the behavior of these licensed behavior is carried out with the support of the R&D organizations abroad. This helps to contribute to the development of capabilities in Peru for incremental innovation. The development of new varieties within Peru also offers a potential long term functional upgrading opportunity into R&D. The public private initiative in Chile for the development of four new varieties which will enter production in 2020, has already been underway for ten years. Nonetheless, in the long term, not only will this R&D contribute to diversification of local producers crops, but it could also constitute an export in and of itself. The Chileans have already had requests from abroad for the sale of this genetic material. Product Diversification in the Horticultural Value Chain: As discussed in earlier sections, Peru’s grape sector has thrived in a large part as a result of the strong development of commercial non-traditional agricultural operations. An important share of these producers have upgraded into grapes by learning through the production of asparagus, avocados, and citrus fruit amongst others. Similarly, the skills developed in this segment with a high investment, high value and labor-intensive crop can be parlayed into the production of other new crops. Berries, for example, offer one potential alternative. Chile has become important exporters of blueberries. In 2013, Chile’s blueberry exports accounted for approximately US$460 million, more than tripling exports in less than ten years and reaching almost one third of the country’s grape exports (UNComtrade, 2015). These fruits are high value products which must be harvested and handled almost exclusively by hand to avoid damage, and thus provide significant employment potential. If labor regulation remains the same, the tendency in the grape sector indicates that this will be formal employment. This is essential given the Peruvian government’s goal to reduce informality in the economy. As a result, these type of products offer an interesting opportunity not only for the large commercial operations to further diversify their production and utilize their labor force in current downtimes, but also for small producers to join the agro-export value chains. Functional Upgrading into Processing: In the medium to long term, functional upgrading into the production of grape juice and raisins offers Peru an opportunity to consolidate its participation in the grape value chain, increase sector employment and increase total exports. Most traditional grape producers have followed this trajectory. Spain, Argentina, the US and Chile have all established grape juice processing operations for the export market. The global market for these processed products is dynamic, and as highlighted in Section 2.3, is growing faster than the market for fresh grapes. Functional upgrading of this type, however, requires a shift into manufacturing activities. These new activities require a labor force with a new skill set, investments in new capital equipment, and sustained production of fresh grapes for processing. Currently, as the

45
quality of the grapes produced in Peru is high and top prices can be secured, few producers are inclined to sell their grapes for processing. Furthermore, processing will require expertise that is not yet available in the country. As this is a new sector for Peru with no grape juice and raisin production even for local consumption, this knowledge will need to be developed leveraging know-how from other strong local fruit sectors, such as passion fruit and mango, or acquired from abroad. With relatively lower capital requirements and technological sophistication, but strong global demand – particularly in the EU-15 where Peru’s products can enter virtually tariff free, upgrading first into raisin production may provide the most feasible mid-term. Strengthening Backward Linkages: Currently the majority of inputs for the sector are imported (see Table 13), offering opportunities to increase local procurement and capture greater value from the chain, although the overall size of the imports are still relatively small. Specifically, there are potential areas in which the country is beginning to develop local capabilities, such as in packaging including wooden crates and plastic bags and the poles used to support the vines. These important inputs can help to foster linkages to the emerging forestry and plastics industries in the country. This way, the success of the table grape industry will also have positive spillovers on others sectors of the Peruvian economy.

46
5. Bibliography Apoyo Consultoría. (2012). Contribución e Impactos de la Agricultura Moderna al Desarrollo del Perú. http://www.apoyoconsultoria.com/en/SiteAssets/Lists/JER_Jerarquia/EditForm/Ver estudio.pdf.
Araneda, Hernán. (2010). Human Capital and the National Strategy for Competitiveness: The Case of Chile: Fundación Chile- Innovum. http://www.slideshare.net/innovum/human-capital-and-the-national-innovation-strategy-for-competitiveness-the-case-of-chile.
Bamber, Penny and Karina Fernandez-Stark. (2013). Global Value Chains, Economic Upgrading and Gender: The Horticulture Industry. In C. Staritz & J. G. Reis (Eds.), Global Value Chains, Economic Upgrading and Gender: Case Studies of the Horticulture, Tourism, and Call Center Industries. Washington, D.C.: World Bank.
Barrientos, Stephanie and Margareet Visser. (2012). South African Horticulture: Opportunities and Challenges for Economic and Social Upgrading in Value Chains.: Capturing the Gains. Economic and Social Upgrading in Global Production Networks.
Bravo, Jaime. (2013). Uva de Mesa: Se Ratifica Liderazgo Exportador Mundial de Chile: ODEPA, Ministerio de Agricultura de Chile.
California Table Grape Comission. (2015). California Varieties. http://grapesfromcalifornia.com/docs/Variety_Chart.pdf.
Camposol. (2013). Annual Report 2013. http://www.camposol.com.pe/userfiles/cms/pagina/documento/camposol_memoria_anual_2013_en.pdf.
---. (2015). Fourth Quarter 2014 and Preliminary Full Year 2014 Results. http://hugin.info/138464/R/1896040/672608.pdf.
Chilealimentos. (2010). Estándares de Competencias Laborales, Sector Alimentos. Retrieved September 7, 2010, from http://www.chilealimentos.com/link.cgi/Servicios/capacitacion/estandar/?pos=20&j.
Consultora AgrariaSur. (2009). Evaluación de una Planta de Packing y Camaras de Frio para La Comercialización de Uva Moscatel de Alejandría Comsissioned bu ODEPA.
Cooke, James. (2010, January 12, 2010). Wal-Mart to cut produce supplier base. DC Velocity.
Cox, Stephen. (2007). "Tesco Nature’s Choice: An Example of a Private Scheme". Paper presented at the Presentation to Joint UNCTAD/WTO Informal Information Session on Private Standards .
Dolan, Catherine and John Humphrey. (2004). "Changing Governance Patterns in the Trade in Fresh Vegetables between Africa and the United Kingdom." Environment and Planning, 36: 491-509.
Early grape success (2015). Retrieved May 12, 2015, from http://www.grapaes.com/index.php?option=com_k2&view=item&id=118:early-grape-success

47
El Comercio. (2015). Envíos de frutas y hortalizas alcanzarían US$4.400 mlls al 2020.
FAO. (2006). Overview of standards: International Agreements, National Regulations and Private Standards: FAO. ftp://ftp.fao.org/docrep/fao/010/a1245e/a1245e02.pdf.
Fernandez-Stark, Karina and Penny Bamber. (2012). Inclusion of Small and Medium Producers in the Value Chain: Assessment of Five High-Value Agricultural Inclusive Business Projects in Latin America. Durham, N.C.: Duke CGGC. May.
Fernandez-Stark, Karina, Penny Bamber and Gary Gereffi. (2011a). Workforce Development in the Fruit and Vegetable Global Value Chain. In G. Gereffi, K. Fernandez-Stark & P. Psilos (Eds.), Skills for Upgrading: Workforce Development and Global Value Chains in Developing Countries. Durham: Center on Globalization Governance & Competitiveness and RTI International.
---. (2011b). Workforce Development in the Fruit and Vegetable Global Value Chain: Center on Globalization Governance & Competitiveness and RTI International.
Field Research. (2015). Peru Interview Series. Personal communication with K. Fernandez-Stark & P. Bamber. March 16-27.
Fresh Fruit Portal. (2013). Grapes from Chile: Fresh Fruit Portal.
---. (2014a). Peru’s table grape production expected to rise 15.8% next year. from http://www.freshfruitportal.com/2014/10/22/perus-table-grape-production-expected-to-rise-15-8-next-year/?country=peru.
---. (2014b). Peruvian Passion Fruit Exports Reach New Record. Fresh Fruit Portal. Retrieved June 2015, from http://www.freshfruitportal.com/2014/06/17/peruvian-passionfruit-exports-reach-new-record/?country=united states;.
Freshplaza. (2012). Peru: Passion Fruit Exports Increased 5%. Fresh Plaza. Retrieved June 2015, from http://www.freshplaza.com/article/101321/Peru-Passion-fruit-juice-exports-increased-5-procent.
Gereffi, Gary, Karina Fernandez-Stark, Penny Bamber, Phil Psilos, and Joe DeStefano. (2011). Meeting the Upgrading Challenge: Dynamic Workforces for Diversified Economies. In G. Gereffi, K. Fernandez-Stark & P. Psilos (Eds.), Skills for Upgrading: Workforce Development and Global Value Chains in Developing Countries. Durham, N.C.: Duke CGGC and RTI.
Gereffi, Gary and Joonkoo Lee. (2009). A Global Value Chain to Food Safety and Quality Stndards (Final report). February 4, 2009. http://www.cggc.duke.edu/pdfs/GlobalHealth/Gereffi_Lee_GVCFoodSafetyl_4Feb2009.pdf.
Global Food Safety Innitiative. (2015). Recognised Schemes. http://www.mygfsi.com/schemes-certification/recognised-schemes.html.
GlobalG.A.P. (2015a). Membership - Retail/Food Service. Retrieved May 12, 2015 from http://www1.globalgap.org/north-america/front_content.php?idart=2683.
---. (2015b). Producers / Suppliers - General. Retrieved May 12, 1976 from http://www1.globalgap.org/north-america/front_content.php?idcat=291.

48
GlobalGAP (2008). Private Food Standards Gain Favor - Walmart, McDonald's Adopt European Safety Guidelines. (March 11). Retrieved September 2010, from http://www.globalgap.org/cms/front_content.php?idcat=44&idart=377
Gulati, Ashok, Nicholas Minot, Chris Delgado, and Bora. Saswati. (2006). Growth in High-Value Agriculture in Asia and the Emergence of Vertical Links with Farmers. In J. Swinnen (Ed.), Global Supply Chains, Standards, and Poor Farmers. London: CABI Press.
Henson, S. and J. Humphrey. (2009). "The impacts of private food safety standards on the food chain and on public standard-setting processes." Joint FAO/WHO Food Standards Programme, Codex Alimentarius Commission, Thirty-second Session, FAO Headquarters, Rome, 29.
Humphrey, John. (2009). "Private Standards in Kenyan Horticulture: Did the Donors Respond Effectively to the Challenge?". Paper presented at the Towards Priority Actions for Market Development for African Farmers. Nairobi. May 13-15, 2009.
IESI. (2014a). Condiciones Laborales y Cadena de Valor en la Agroindustria de Exportación en la Región de Ica: Caso de Sociedad Agrícola Drokasa, Agrícola Chapi y Agrícola Don Ricardo. Lima: Instituto de Estudios Sindicales. https://http://www.iesiperu.org.pe/documentos/publicaciones/Agro Ica.pdf.
---. (2014b). Derechos laborales en el sector de la agroexportación: Instituto de Estudios Sindicales. https://http://www.iesiperu.org.pe/documentos/05. Agroexpor Ica (resumen)_ espanhol.pdf.
Información Agraria. (2013). El Despegue de la Uva Tropical en el Norte Peruano. Información Agraria (116).
Jaffee, Steve and Oliver Masakure. (2005). "Strategic Use of Private Standards to Enhance International Competitiveness: Vegetable Exports from Kenya and Elsewhere." Food Policy, 30(3): 316-333.
Jaffee, Steven, Spencer Henson and Luz Diaz Rios. (2011). MAKING THE GRADE: Smallholder Farmers, Emerging Standards, and Development Assistance Programs in Africa: World Bank. https://openknowledge.worldbank.org/bitstream/handle/10986/2823/623240SR0White0W110Making0the0Grade.pdf?sequence=1.
Khajehpour, Bijan. (2014). Growth in Iran's Non-Oil Exports Linked to Sanctions Relief. Retrieved June 14, 2015 from http://www.al-monitor.com/pulse/originals/2014/03/iran-sanctions-non-oil-exports.html
Kis, Viktória and Simon Field. (2009). Learning for Jobs OECD Reviews of Vocational Education and Training. Chile: A First Report: OECD. http://www.oecd.org/dataoecd/33/13/44167258.pdf.
Lee, Joonkoo, Gary Gereffi and Janet Beauvais. (2010). "Global Value Chains and Agrifoods Standards: Challenges and Possibilities for Smallholders in Developing Countries." Proceedings of National Academy of Sciences.
---. (2012). "Global value chains and agrifood standards: challenges and possibilities for smallholders in developing countries." Proceedings of the National Academy of Sciences, 109(31): 12326-12331.

49
López, Rodrigo. (2009). El Sector Frutícola Chileno y las Competencias Laborales: AGROCAP. http://www.fdf.cl/files/Rodrigo L%C3%B3pez (OTIC Agrocap) - Seminario Competencias Laborales FDF (18 Marzo CasaPiedra).pdf.
McKee, Greg and J.S. Isaacs. (2012). Grapes Profile. Retrieved May 12, 2015, 2014, from http://www.agmrc.org/commodities__products/fruits/grapes-profile/.
Meade, Birgit, Katherine Baldwin and Linda Calvin. (2010). Peru: An Emerging Exporter of Fruits and Vegetables: USDA.
Mencarelli, Fabio and Andrea Bellincontro. (2005). Grape: Post-Harvest Operations: FAO.
MINAGRI. (2014). Criterios para Priorizar Proyectos de Desarrollo de Variedades. Chile: Unidad de Investigación, Desarrollo e Innovación, Subsecretaría de Agricultura. http://www.minagri.gob.cl/wp-content/uploads/2014/03/Criterios-para-Priorizar-Proyectos-de-Desarrollo-de-Variedades-3.pdf.
Ministerio de Relaciones Exteriores. (2011). Perfil de Mercado de Uvas de Mesa en Estados Unidos. http://www.rree.gob.pe/promocioneconomica/Documents/Estudios_y_Perfiles/Frutos frescos/Perfil_de_Mercado-Uvas_de_Mesa_EEUU_2011.pdf.
Moreno, Carmiña. (2012). Recursos hídricos, agua potable y saneamiento y residuos sólidos. In Retos de Desarrollo del Perú 2012-2016. Lima: Banco Interamericano de Desarrollo.
Neid, Jeremy, Liz Maddock, Ruth Underwood, and Greg Dryden. (2010). Identifying and Reporting the Value Added From Training - Horticulture Sector. New Zealand: Agricultural Services Limited (ASL).
NPR (2013). The Cotton Candy Grape: A Sweet Spin On Designer Fruit. Retrieved May 12,2015, from http://www.npr.org/sections/thesalt/2013/08/05/209222126/the-cotton-candy-grape-a-sweet-spin-on-designer-fruit
Ntombela, Sifiso. (2010). Scenario Development to Support Strategic Planning in The South African Table Grape Industry. Stellenbosch University.
O’Brien, Tim M. and Alejandra Díaz Rodríguez. (2004). Mejorando la competitividad y el acceso a los mercados de exportaciones agrícolas por medio del desarrollo y aplicación de normas de inocuidad y calidad: El ejemplo del espárrago Peruano Instituto Interamericano de Cooperación para la Agricultura. http://infoagro.net/programas/Sanidad/pages/casos/capacitacion/esparrago_peru.pdf.
ODEPA. (2014). Catastro Frutícola: Región de Valparaíso. Santiago: Ministerio de Agricultura, Chile.
Organisation Internationale de la Vigne et du Vin. (2011). Vine and Wine Outlook 2010-2011: OIV.
Ouma, S. (2010). "Global Standards, Local Realities: Private Agrifood Governance and the Restructuring of the Kenyan Horticulture Industry." Economic Geography, 86(2): 197-222.
Palanciuc, Roman, Eugeniu Gudumac and Alexandru Belschi. (2011). Moldovan Table Grape Value Chain Study: DAI prepared for USAID.

50
Pekic, Vladimir. (2015). Peruvian Passion Fruit Exports up by Half. Agra-Net. Retrieved June 2015, from https://http://www.agra-net.net/agra/foodnews/beverages/fruit-juices/tropical/peruvian-passion-fruit-juice-exports-up-by-half-466722.htm
Portal Frutícula. (2012). Uvas de Chile. http://www.portalfruticola.com/wp-content/uploads/2012/11/uvas_chile_e.pdf.
---. (2014). El potencial de Perú como productor de uva de mesa. Retrieved 11 March 2015 from http://www.portalfruticola.com/noticias/2014/08/11/el-potencial-de-peru-como-productor-de-uva-de-mesa/?pais=peru.
Possingham, J.V., P.R. Clingeleffer and G.H. Kerridge. (1990). Breeding grapevines for troplical environments, pp. 169-177. http://www.vitis-vea.de/admin/volltext/e029444.pdf.
PROVID. (2014). Grape Industry in Peru. Peru.
Quicornac. (2015). About Us. Retrieved June 2015,
Reardon, Thomas, Spencer Henson and Julio Berdegué. (2007). "‘Proactive fast-tracking’diffusion of supermarkets in developing countries: implications for market institutions and trade." Journal of Economic Geography, 7(4): 399-431.
SATI. (2010). Statistical Booklet: South African Table Grape Industry. http://www.satgi.co.za/admin/upload/pdfs/SATI Booklet 2010(1).pdf.
Singh, Sukhpal. (2013). Governance and Upgrading in Export Grape Global Production Networks in India.
Strik, Bernadine C. (2011). Growing Table Grapes: Oregon State University.
Sun World. (2015). Agricola Don Ricardo Joins Sun World Licensee. Retrieved June 12,2015 from http://www.sun-world.com/about-us/news/agricola-don-ricardo-joins-sun-world-as-licensee.
SUNAT. (2014). "Restitución de Derechos Arancelarios - Drawback: Procedimiento General."
---. (2015a). Firm-Level Foreign Trade Database. Lima.
---. (2015b). Sector Agrario. Retrieved 10 April 2015 from http://orientacion.sunat.gob.pe/index.php?option=com_content&view=category&layout=blog&id=329&Itemid=542.
Supermarket News (2013). Top 25 Global Food Retailers 2013. Retrieved May 12, 2015, from http://supermarketnews.com/top-25-global-food-retailers-2013
TESCO. (2005). Natures's Choice. Retrieved May 12, 2015 from http://www.tesco.com/csr/g/g4.html.
The Consumer Goods Forum. (2015). Company's Database. Retrieved May 12, 2015 from http://www.theconsumergoodsforum.com/about-the-forum/our-members.
The World Bank. (2013). El futuro del riego en el Perú.

51
UCDavis (2008). Chilean President and Schwarzenegger Preside Over Signing of Landmark Agreements at UC Davis. Retrieved May 12, 2015, from http://news.ucdavis.edu/search/printable_news.lasso?id=8691&table=news
--- (2015). UC Davis opens Life Sciences Innovation Center in Chile. from http://news.ucdavis.edu/search/news_detail.lasso?id=11209
UNComtrade. (2015). United Nations Commodity Trade Statistics Database. In U. N. S. Division (Ed.).
USDA. (2009). Grape Report. Lima.
---. (2014). Raisins: World Market and Trade: United States Department of Agriculture. http://apps.fas.usda.gov/psdonline/circulars/Raisins.pdf.
---. (2015). Section 8e Table Grape Import Requirements. from http://www.ams.usda.gov/AMSv1.0/ams.fetchTemplateData.do?template=TemplateN&rightNav1=Table+Grapes&topNav=&leftNav=&page=8etablegrape&resultType=.
Wine Folly. (2012). Table Grapes vs. Wine Grapes.
WineSpectator. (2015). Ask Dr. Vinny. Retrieved April 30, 2015 from http://www.winespectator.com/drvinny/show/id/5045.
Zabadal, Thomas J. (2002). Growing Table Grapes in a Temperate Climate: Michigan State University.

52
6. Appendix Figure A. 1. Market Share of the Top 4 and Top 8 Largest U.S. Supermarkets, 1992-2013
Source: (USDA, 2014) Table 18. Example of Grape Quality Classifications
Classes
Extra class Class I Class II Quality Superior Good Satisfy minimum
requirements Bunches (shape, development and colouring)
Typical of the variety, allowing for the district in which they are grown
Typical of the variety, allowing for the district in which they are grown
Slight defects provided these do not impair the essential characteristics of the variety, allowing for the district in which they are grown
Defects No — Slight defects in shape, colouring and very slight sun-scorch affecting the skin only. — Defects should not affect the general appearance of the produce, the quality, the keeping quality, and presentation in the package.
Allowed provided that essential characteristics are retained in terms of quality, the keeping quality and presentation: — Defects in shape and colouring, — Slight sun-scorch affecting the skin only, — Slight bruising, — Slight skin defects.
Minimum requirements
— Sound, no rooting or deterioration, — Clean, practically free of any visible foreign matter, — Free from pests or damage caused by it, — Free of abnormal external moisture, — Free of any foreign smell and/or taste, — Able to withstand transport and handling in order to arrive in satisfactory condition at the place of destination, — Satisfactory sugar/acidity ratio levels.
Source: (Palanciuc et al., 2011)
0%
10%
20%
30%
40%
50%
60%
70%
Top 4 Top 8