perspectives of the trade in textiles after ... external policies policy department perspectives of...
TRANSCRIPT
JANUARY 2004
STUDY
Policy Department External Policies
PERSPECTIVES OF THE TRADE IN TEXTILES AFTER THE END OF THE QUOTA SYSTEM OF THE WTO AGREEMENT ON TEXTILES AND CLOTHING ON 1
JANUARY 2005
INTERNATIONAL TRADE
February 2005 EN
Directorate-General External Policies
Policy Department
PERSPECTIVES OF THE TRADE IN TEXTILES AFTER THE END OF
THE QUOTA SYSTEM OF THE WTO AGREEMENT ON TEXTILES AND CLOTHING ON 1 JANUARY 2005
STUDY
Abstract: With the end of the Agreement on Textiles and Clothing and the removal of all textiles and clothing quotas on 1 January 2005, the characteristics of global textile production patterns and trade flows will be substantially redesigned. This paper aims at evaluating the qualitative and quantitative impact of the removal of quotas by assessing the prospects for textile- and clothing-producing countries, as well as producers and consumers in the EU. The paper also takes account of linkages with other factors and it covers the impacts on employment and development. Several policy recommendations follow based on this analysis.
EP/ExPol/B/2004/09 01/02/2005 PE 381.357 EN
This study was requested by: the European Parliament's committee on International Trade (INTA) This paper is published in the following languages: English. Author: Centre for European Policy Studies, Brussels Responsible Official: Levente Csaszi DG External Policies, Policy Department ATR 08K060 Tel: +32 2 2831464 E-mail: [email protected] Manuscript completed, January 2005. Paper copies can be obtained through: Levente Csaszi Tel: +32 2 2831464 E-mail: [email protected] The opinions expressed in this document are the sole responsibility of the author and do not necessarily represent the official position of the European Parliament. Reproduction and translation for non-commercial purposes are authorized, provided the source is acknowledged and the publisher is given prior notice and sent a copy.
2

Contents 1. Introduction 1 1.1. The textiles and clothing production chain 1 1.2. The Agreement on Textiles and Clothing 2 1.3. Outline 3 2. A snapshot of the textile and clothing production and trade in the EU 4 2.1. Production and Employment 4 2.2. Global and European trade patterns 6 3. Textiles and Clothing quota and their effects 9 3.1. How do quotas work? 9 3.2. Analysis of textiles and clothing quota imposed by the EU in 2004 9 3.3. Inferring from the past: Consequences of the third stage of the ATC 12 3.4. Individual country gains and losses 14 4. The interlinkage of the quota removal and other factors 15 4.1. Scale factors 15 4.2. Case Studies: Industry and Policy-preparation – or the lack of it 18 4.3. The textile and clothing industries as a stepping stone for industrialisation 19 and development 5. Sector-specific losses vs. economy-wide gains 20 5.1. Contraction in production and employment 20 5.2. Benefits for consumers 22 6. Policy recommendations 23 7. Conclusions 26 References 27 Appendix I. Tables 29 Appendix II. Description on SIGL categories 30 Appendix III. The Finger-Kreinin Index 31
i
Executive Summary With the end of the Agreement on Textiles and Clothing (ATC) and the removal of all textiles and clothing quotas on 1 January 2005, the characteristics of global production patterns and trade flows will be substantially redesigned. As a major producer and consumer of both types of goods, the EU will also take part in this industrial and commercial reshuffling. The objective of this paper is to evaluate the qualitative and quantitative impact of the removal of quotas by assessing the prospects for textile- and clothing-producing countries and producers and consumers in the EU. Despite being widely perceived as a single industry, the textiles and clothing industries are part of a segmented production process that uses different capital-labour mixes in its different stages. Two direct implications directly result from these distinctions. First, different national factor endowments will be reflected in a country’s degree of specialisation in a specific element of the production chain. Secondly, a nationally segmented production can make trade policy highly discriminatory, as it will have heterogeneous effects across countries. A geographic dispersion of the stages of transformation emphasise in particular the importance of origin rules if preferential market access is granted to some countries. The textile and clothing industries have a traditional place in the EU’s industrial landscape. In 2002 they consisted of over 100,000, mainly small and medium enterprises which jointly employed more than 2 million people. However, the sector has constantly been downsized in the past decades, in terms of employment and production units, as a result of efficiency and productivity gains, as well as relocations of some production segments to lower-cost countries. In 2002, the EU as a whole imported textiles and clothing products worth €71 billion for an exported value of €43 billion. This masks an uneven development in the two sectors, the EU having a trade surplus in the former and a trade deficit in the latter. The EU’s main textile and clothing suppliers are located in Asia and in its vicinity and supply mainly clothing. The main destination countries also include two broad categories of countries: high-income countries and neighbouring countries, for both of which the export pattern is different. For the former group, clothing plays a prominent role, while for the latter exports are based on textiles. This strong regional dimension points to a trade dynamic based on outward finishing activities. An analysis of the quotas imposed by the EU in 2004 reveals that 59 quotas were binding, 19 of them even strongly. The most constrained countries were Macao, Pakistan, India and China. In terms of products, quota cover was much higher for clothing items. The analysis of a previous quota removal shows that the price of a product can drop dramatically even within a single year, which maps directly into increases in market shares, thereby underscoring the restrictive character of quotas. In the categories in which binding quotas were valid until the end of 2004, very strong price falls may thus be expected that will go along with strong increases in the restricted countries’ market shares. The analysis has also shown, that to some extent there will be a reshuffling among Asian suppliers of textiles and clothing to industrialised countries’ markets with countries like China or India simply substituting for others. This would mitigate adverse effects to other suppliers and the European industry.
ii
iii
In terms of gains and losses, the direction of the effects of the quota removal should be in line with the theoretical predictions and past observations. However, their eventual magnitude will be determined by a multitude of other scale factors such as the existence of a vertically-integrated production chain, a good infrastructure, a sound domestic regulatory framework and proximity to the final market. For the EU, sector specific losses will appear alongside economy-wide gains. The effects of the quota removal on the European industry will be asymmetric. While competition in the textile industry might increase for some specific sub-sectors, this might be offset by increasing export opportunities and the shift towards the production of technical textiles. Regarding clothing, it is clear that the ongoing adjustment process will accelerate. The pressure will be strongest in those segments (and countries) that have so far specialised in low value added production. In contrast to this, EU consumers will unambiguously benefit from the access to a larger variety of goods that will be available at lower prices. The now abolished quotas and the still existing tariffs have been protecting specific sub-sectors of the textile and clothing industry. Hence, one should not expect an impending crisis hitting the entire clothing industry, but rather specific crises resulting from surges in imports and/or falls in prices in certain clothing sub-sectors. This implies that blanket protection or aid to the sector as a whole would not be appropriate. Moreover, the industries and the governments had a decade to prepare for this event. Based on this analysis the following policy recommendations are made to European Parliament’s Committee on International Trade: • Implementation of a more effective ‘differential treatment’ for vulnerable
countries • Avoid the use of safeguard measures against previously restricted countries • Press for a better market access for EU producers • Use the additional tariff revenue for increased development assistance • Strengthen the domestic growth policies
4
1. Introduction With the removal of all textiles and clothing quotas on 1 January 2005, the characteristics of global production patterns and trade flows are likely to be substantially redesigned. As a major producer and consumer of both types of goods, the EU will also take part in this industrial and commercial reshuffling. The objective of this paper is to evaluate the qualitative and quantitative impact of the removal of quotas by assessing the prospects for textile- and clothing-producing countries and producers and consumers in the EU. We begin by introducing the production chain of those goods. 1.1. The textiles and clothing production chain Despite being widely perceived as a single industry, the textile and clothing industries are just two distinct and central elements in a supply chain that comprises a range of other individual stages. The activities incorporated in the supply chain include product design, possibly agricultural activities such as the production of raw materials, their transformation, and finally the distribution and marketing of the final product.1 At the start of the supply chain, raw materials are used for the production of fibres and yarns (spinning), which can be divided into natural (including cotton, wool, jute, silk, flax, sisal) or man-made (cellulosic fibres; synthetic fibres such as nylon and polyester; fibres from inorganic materials such as glass, metal or ceramic) fibres. These materials are used for producing the fabric (i.e. textiles), in a capital-intensive process, which nowadays relies heavily on advanced technology with automated processes (knitting and weaving). This is followed by a finishing process in which the fabric is given the characteristic properties required for the final product (dyeing, printing, etc.). There are important economies of scale in the textiles industry as production is often performed in bulk operations, performing spinning, weaving and finishing in a single production process. Textiles have been used traditionally to manufacture clothing, but serve increasingly as inputs for the production of non-clothing items, such as carpets and floor coverings, home textiles and industrial textiles. In the former case the fabric, after being cut, has to be assembled or sewn together. The assembly stage is generally very labour-intensive and requires few skills. It is barely responsive to technological progress, and “sewing techniques … similar to those that were used a century ago” (Audet, 2004: 10) combined with low initial investment requirements and low entry and exit costs, make this industry footloose.2. Parallel to this, the demand for non-clothing textiles, and in particular technical textiles, is growing fast and has overtaken textiles produced for clothing purposes (OECD, 2004). Technical textiles require more R&D and skilled labour input, and are less responsive to the vagaries of fashion and design. The final step of the supply chain is the product’s distribution. This is increasingly done by the retail sector, which accounts for the majority of textile and clothing imports into the EU. It is increasingly entangled with the manufacturing sector and makes more and more use of information technology to source its products globally, which increases its influence on the geographical production pattern.
1 More detailed accounts of the textiles and clothing supply chain may be found in OECD (2004), Nordas (2004) or relevant parts of the European Commission’s website (http://europa.eu.int/comm/enterprise/textile/index_en.htm). 2 However, a small segment of the clothing industry that is predominantly located in high-income countries is less footloose. It contrasts with our description by relying on innovation, high-skilled workers and high-quality inputs in order to produce qualitative and fashionable items.

5
However, it is important to keep in mind that the textiles and clothing industries are part of a segmented production process that uses different capital-labour mixes in its different stages. Two direct implications directly result from these distinctions. First, different national factor endowments will be reflected in a country’s degree of specialisation in a specific element of the production chain. Secondly, a nationally segmented production can make trade policy highly discriminatory, as it will have heterogeneous effects across countries. A geographic dispersion of the stages of transformation emphasise in particular the importance of origin rules if preferential market access is granted to some countries. 1.2. The Agreement on Textiles and Clothing The EU’s trade in textiles and clothing products, like that of other industrialised countries, has long been subject to a regime that circumvented GATT rules. The first system of quantitative restrictions was implemented in 1962 with the Long Term Agreement Regarding International Trade in Cotton Textiles, which gave way in 1974 to the broader Multifibre Arrangement (MFA) lasting until 1994. During that period, trade policy was negotiated bilaterally and trade flows were generally subject to quotas. The MFA’s rationale was to give countries the opportunity to temporarily shelter their markets from being disrupted and their local industries from potentially being threatened by more competitive imports. The MFA was clearly in breach of the GATT principle of non-discrimination, and the administration of quotas was counter to the GATT’s preference for custom tariffs. In the MFA’s final year, Austria, Canada, the EC, Norway and the US still applied quotas, unlike Japan and Switzerland. The Agreement on Textiles and Clothing (ATC), which was signed as a part of the Uruguay Round of trade negotiations, took effect in 1995. It was put in place to manage the progressive phasing out of all textiles and clothing quotas by the end of 2004. In a four-stage process, textiles and clothing trade was gradually subjected to WTO/GATT rules, both by integrating textiles and clothing categories directly (i.e. removing the quota and subjecting the category to WTO/GATT rules) and by loosening the existing quotas (i.e. gradually enlarging them). At any of the four stages, a minimum number of products that represented a certain share of a country’s imports covered by the ATC in 1990 had to be exempted from quotas. The shares associated with each stage are listed in Table 1.1. It was left to the restricting countries to decide which products they wanted to integrate at which stage. The sole requirement was to include products belonging to the four following groups: tops and yarns, fabrics, made-up textile products and clothing. Products could also have been integrated ahead of schedule. The ATC also stipulated that in parallel to the progressive integration of products, the quota growth rates for the remaining quotas, as agreed in the MFA (generally 6% yearly), had to be accelerated at each stage. These increases are also reported in Table 1.1. For small suppliers (defined in Art. 2.18 of the ATC), the growth factors were to be advanced by one stage. The ATC also included provisions for a special safeguard mechanism to be invoked in the eventuality of ‘serious damage or threat thereof’ to domestic producers during the transition period. The implementation of the ATC was supervised by the Textiles Monitoring Body (TMB). Table 1.1. The integration stages of the ATC
Stage Date Minimum amount to be integrated*
Annual increase of the existing quota growth rate
1 1.1.1995 16 16 2 1.1.1998 17 25 3 1.1.2002 18 27
6
4 1.1.2005 49 Full integration * As a percentage of 1990 imports covered by the ATC.
A striking practical feature of the quota removal was that countries tended to integrate categories for which quotas were not restrictive, and thus harmless, in the initial stages. Hence. “what could have been a gradual adjustment process [is turned] into a major shock at the beginning of 2005” (Mlachila & Yang, 2004: 4). Restricting countries simply increased the number of import categories covered by the ATC relative to the number covered by the MFA. These newly created quotas were then removed in the ATC’s first stages – this had of course no real effects but allowed the countries to comply fully with the ATC (Nordas, 2004). 1.3. Outline In the remainder of the paper we will analyse the effects on different agents directly or indirectly affected by the abolition of quotas. In the next section we will briefly describe the main features of the textile and clothing industry in the EU, as well as the major trends observed in terms of trade flows. Section 3 recalls the theoretical effects of a quota and analyses the nature of the textile and clothing quotas that were imposed by the EU until 2004. It identifies both the products and the countries affected by their incidence and examines the effects of a previous quota removal as a benchmark. A number of scale effects, which could magnify or mitigate the effects of the quota removal, are presented in section 4, together with three short case studies of China, India and Bangladesh. Section 5 analyses the perspectives of the quota removal on EU producers and consumers. Section 6 provides some policy recommendations, and Section 7 concludes.

7
2. A snapshot of the textile and clothing production and trade in the EU 2.1. Production and Employment The textile and clothing industries in Europe have a long tradition. They are well-established in the EU’s industrial landscape and consisted in 2002 of over 100,000 enterprises which jointly employed more than 2 million people, 55% of whom worked in the textile sector.1 Therefore it is not surprising that it is dominated by small- and medium-sized enterprises (SMEs), which employed an average of 19 people in 2003. The industries typically appear in regional clusters in which they are often the predominant activity and to whose cultural heritage they belong2. However, the sector has constantly been downsized in the past decades, in terms of employment and production units, as a result of efficiency and productivity gains, as well as relocations of some production segments to lower-cost countries. This has forced the remainder of the industry to modernise and adjust by shifting production towards high-quality and fashionable products, thereby making use of innovation, and information and communication technology (Stengg, 2001). Table 2.1. Characteristics of the EU Textiles and Clothing Industry in 1995 and 2002
Turnover (€ billion) Investment (€ billion) Employment (in thousands) Enterprises
T C T&C T C T&C T C T&C T C T&C 1995 119 65 184 6.1 1.2 7.4 1356 1193 2550 73062 59100 132162 2002 119 68 187 4.7 1.0 5.7 1105 902 2008 57462 45438 102900
% change 0.0 4.9 1.7 -24.1 -19.0 -23.2 -18.5 -24.4 -21.3 -21.4 -23.1 -22.1 Source: Euratex (2004); T=Textiles (incl. knitting), C=Clothing.
Table 2.1 displays the key figures about the textile and clothing industries in the EU for 1995 and 2002. Over this time span the turnover of the textile industry stayed constant, while that of the clothing industry expanded by 5%. At the same time employment and the number of companies in both industries fell by 20-25%. Both observations suggest that there were significant productivity gains in the two sectors. Despite of these gains, investment has receded, pointing towards a further downward adjustment of both sectors in the future. The corresponding figures for the individual EU Member States for the year 2002 are listed in Tables A.1 and A.2 of the Appendix3. Among both old and new EU members, Italy is the largest textile and clothing producer with a turnover of €78 billion and more than 600,000 people employed. Figure 2.1 shows the weight of the textiles and clothing industries in manufacturing of individual countries. At first sight, a clear intra-European north-south divide emerges. Indeed, in Spain, Italy, Greece and Portugal, the share of textiles and clothing in overall manufacturing employment is the highest, ranging from 9-24%. On the other hand it is much lower in Germany, Denmark and Sweden, where it only accounts for about 2.5%. The Portuguese case illustrates the central role of both industries in some countries, in terms of employment as well as of production. The data also reveal that it has the lowest productivity, measured as turnover per employee. The charts also reveal that the smaller the relative size of the textile and clothing industries, the stronger is the bias towards the capital-intensive textile industry. In general this bias is stronger in terms of turnover than in terms of employment, suggesting that there is a higher productivity and value added per employee in textile production. This is not the case for countries such as Denmark, Sweden
1 Unless otherwise mentioned, EU refers to the 15-member state constellation. 2 Examples of regional clusters include the regions of Prato (Italy), Kortrijk (Belgium) and Picardie (France). 3 Tables 2.1 and A.1 use data from different sources (Euratex and European Commission) which use slightly different classifications and hence do not coincide perfectly.

or the UK where the proportionate size of both industries is the same in terms of employment and turnover. Figure 2.1. Share of Textiles and Clothing in Manufacturing (as a percentage), 2002
Turnover
0
2
4
6
8
10
12
14
EU AT BE DE DK ES FI FR GR IE IT LU NL PT SE UK
Textiles Clothing
Employment
0
5
10
15
20
25
EU AT BE DE DK ES FI FR GR IE IT LU NL PT SE UK
Textiles Clothing Source: European Commission (2003). An international comparison reveals that the textiles and clothing industries play a smaller part in terms of employment in the US. However, they have witnessed a much stronger decline than the EU, as employment figures have dropped by nearly half between 1995 and 2002, chiefly in the clothing sector, as can be seen in Table 2.2. While employment has also dropped in India and China – mainly owing to restructuring and technological progress in the textiles industry – it still dwarfs that of other countries in size. We also notice that Morocco and Mexico have recorded increasing employment in both industries over the time span analysed. Table 2.2. Textile and Clothing Employment in other countries (in thousands)
1995 1998 2000 2002 Textile
United States 688 642 595 489 China 6730 5780 4829 4775* India 1579 1330 1289 Morocco 70 71 70 Mexico 187 240 269 317* EU-15 1356 1256 1190 1105
Clothing United States 814 639 497 358 China 1750 2117 2156 2027* India 264 279 331 Morocco 102 122 135 Mexico 476 740 760 681* EU-15 1193 1086 1001 902 * Values refer to 2001. Source: Nordas (2004), based on ILO and UNIDO data; Euratex (2004).
2.2. Global and European trade patterns Global trade in textiles and clothing has amounted to €120 billion and €164 billion respectively in 2003, after growing at a rate of 11% relative to the previous year. Both sectors combined amounted to a share of 7.3% in world manufacturing exports.1. Figure 2.2 shows
81 Based on WTO figures. The trade flows exclude the growth rate and the share include intra-EU trade.
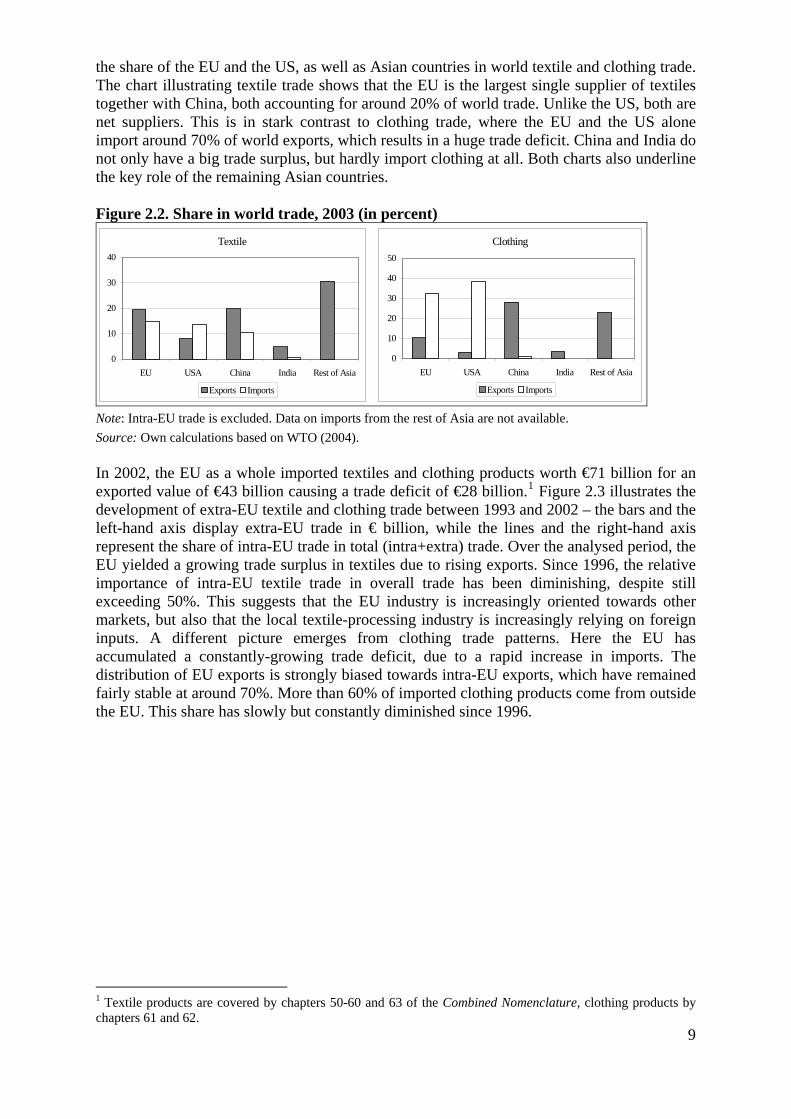
the share of the EU and the US, as well as Asian countries in world textile and clothing trade. The chart illustrating textile trade shows that the EU is the largest single supplier of textiles together with China, both accounting for around 20% of world trade. Unlike the US, both are net suppliers. This is in stark contrast to clothing trade, where the EU and the US alone import around 70% of world exports, which results in a huge trade deficit. China and India do not only have a big trade surplus, but hardly import clothing at all. Both charts also underline the key role of the remaining Asian countries. Figure 2.2. Share in world trade, 2003 (in percent)
Textile
0
10
20
30
40
EU USA China India Rest of Asia
Exports Imports
Clothing
0
10
20
30
40
50
EU USA China India Rest of Asia
Exports Imports
Note: Intra-EU trade is excluded. Data on imports from the rest of Asia are not available. Source: Own calculations based on WTO (2004). In 2002, the EU as a whole imported textiles and clothing products worth €71 billion for an exported value of €43 billion causing a trade deficit of €28 billion.1 Figure 2.3 illustrates the development of extra-EU textile and clothing trade between 1993 and 2002 – the bars and the left-hand axis display extra-EU trade in € billion, while the lines and the right-hand axis represent the share of intra-EU trade in total (intra+extra) trade. Over the analysed period, the EU yielded a growing trade surplus in textiles due to rising exports. Since 1996, the relative importance of intra-EU textile trade in overall trade has been diminishing, despite still exceeding 50%. This suggests that the EU industry is increasingly oriented towards other markets, but also that the local textile-processing industry is increasingly relying on foreign inputs. A different picture emerges from clothing trade patterns. Here the EU has accumulated a constantly-growing trade deficit, due to a rapid increase in imports. The distribution of EU exports is strongly biased towards intra-EU exports, which have remained fairly stable at around 70%. More than 60% of imported clothing products come from outside the EU. This share has slowly but constantly diminished since 1996.
9
1 Textile products are covered by chapters 50-60 and 63 of the Combined Nomenclature, clothing products by chapters 61 and 62.

Figure 2.3. Evolution of EU textile and clothing trade, 1993-2002 Textile
0
5
10
15
20
25
30
1993 1994 1995 1996 1997 1998 1999 2000 2001 2002
Extra
-EU
trad
e (€
bn)
50
55
60
65
70
Intra
trad
e (%
of t
otal
)
Exports Im ports Share of in tra exports Share of in tra im ports
C lothing
0
10
20
30
40
50
60
1993 1994 1995 1996 1997 1998 1999 2000 2001 2002
Extra
-EU
trad
e (€
bn)
20
40
60
80
Intra
trad
e (%
of t
otal
)
Exports Im ports Share of in tra exports Share of in tra im ports
Source: Comext (Eurostat). Figure 2.4 displays the 10 largest textile and clothing trading partners of the EU in 2002. The top 10 source countries accounted together for over 60% of extra-EU imports. China (€11 billion) and Turkey (€9 billion) were by far the largest suppliers. One half of these 10 countries are located in Asia, the other in the EU’s vicinity (Turkey, Morocco, Romania), and even included one of its new members in the case of Poland. Imports from all 10 countries were mainly composed of clothing. The top 10 destination countries accounted together for nearly 60% of extra-EU export and also included two broad categories of countries: high-income countries (the US, Switzerland and Japan) and neighbouring countries (some of which are new members). We also observe that the export pattern is different for them. Indeed for the former group, clothing plays a prominent role, while for the latter exports are based on textiles. In 2002, the EU sourced 14% of its textile imports and 10% of its clothing imports in the eight eastern European new members and Bulgaria and Romania. The equivalent figures for exports were 23% and 12%, respectively. This obvious regional dimension not only points to a trade dynamic based on outward finishing activities, but also to a high degree of integration between both regions. After enlargement the domestic focus of EU textile and clothing trade will thus be of increased importance.
10

Figure 2.4. Top 10 trading partners of the EU, 2002
Imports
0
2
4
6
8
10
China
Turkey
India
Roman
ia
Tunisi
a
Bangla
desh
Morocco
Poland
Hong K
ong
Indon
esia
€ bi
llion
s
Textile Clothing
Exports
0.00.51.01.52.02.53.03.5
USA
Switzerl
and
Poland
Romani
aJap
an
Tunisia
Turkey
Morocco
Czech R
ep.
Russia
€ bi
llion
s
Textile Clothing
Source: Comext (Eurostat).
11
12
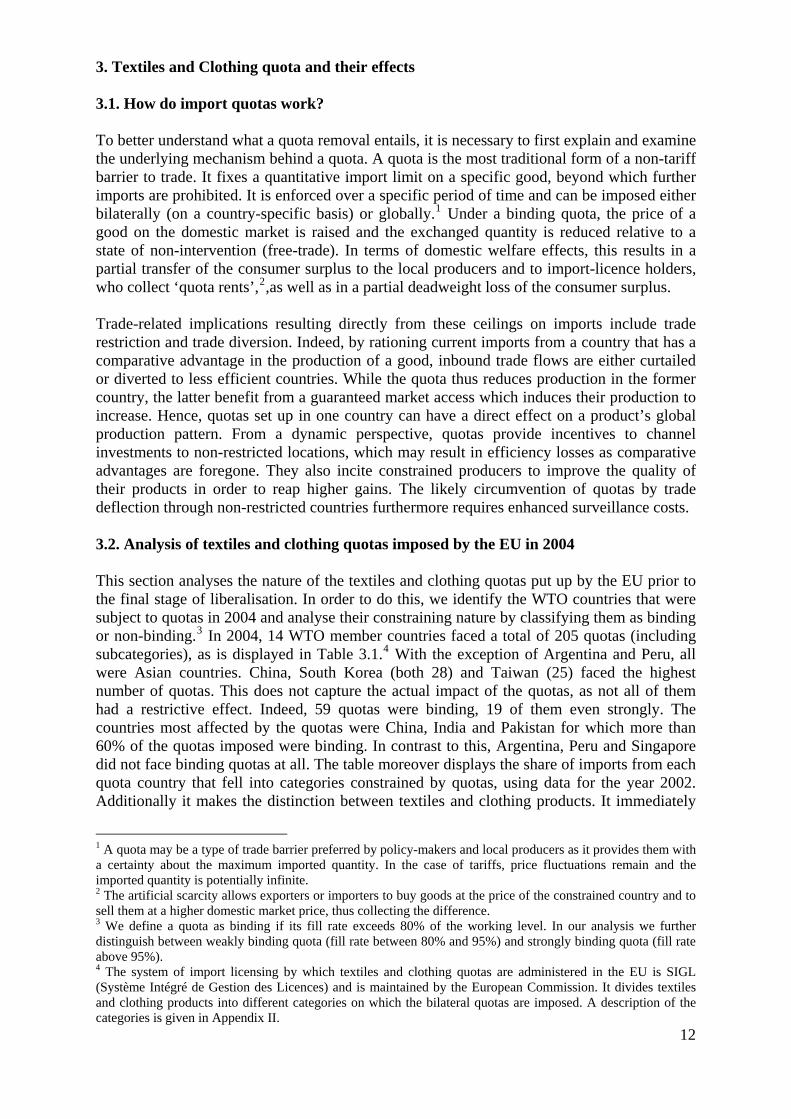
3. Textiles and Clothing quota and their effects 3.1. How do import quotas work? To better understand what a quota removal entails, it is necessary to first explain and examine the underlying mechanism behind a quota. A quota is the most traditional form of a non-tariff barrier to trade. It fixes a quantitative import limit on a specific good, beyond which further imports are prohibited. It is enforced over a specific period of time and can be imposed either bilaterally (on a country-specific basis) or globally.1 Under a binding quota, the price of a good on the domestic market is raised and the exchanged quantity is reduced relative to a state of non-intervention (free-trade). In terms of domestic welfare effects, this results in a partial transfer of the consumer surplus to the local producers and to import-licence holders, who collect ‘quota rents’,2,as well as in a partial deadweight loss of the consumer surplus. Trade-related implications resulting directly from these ceilings on imports include trade restriction and trade diversion. Indeed, by rationing current imports from a country that has a comparative advantage in the production of a good, inbound trade flows are either curtailed or diverted to less efficient countries. While the quota thus reduces production in the former country, the latter benefit from a guaranteed market access which induces their production to increase. Hence, quotas set up in one country can have a direct effect on a product’s global production pattern. From a dynamic perspective, quotas provide incentives to channel investments to non-restricted locations, which may result in efficiency losses as comparative advantages are foregone. They also incite constrained producers to improve the quality of their products in order to reap higher gains. The likely circumvention of quotas by trade deflection through non-restricted countries furthermore requires enhanced surveillance costs. 3.2. Analysis of textiles and clothing quotas imposed by the EU in 2004 This section analyses the nature of the textiles and clothing quotas put up by the EU prior to the final stage of liberalisation. In order to do this, we identify the WTO countries that were subject to quotas in 2004 and analyse their constraining nature by classifying them as binding or non-binding.3 In 2004, 14 WTO member countries faced a total of 205 quotas (including subcategories), as is displayed in Table 3.1.4 With the exception of Argentina and Peru, all were Asian countries. China, South Korea (both 28) and Taiwan (25) faced the highest number of quotas. This does not capture the actual impact of the quotas, as not all of them had a restrictive effect. Indeed, 59 quotas were binding, 19 of them even strongly. The countries most affected by the quotas were China, India and Pakistan for which more than 60% of the quotas imposed were binding. In contrast to this, Argentina, Peru and Singapore did not face binding quotas at all. The table moreover displays the share of imports from each quota country that fell into categories constrained by quotas, using data for the year 2002. Additionally it makes the distinction between textiles and clothing products. It immediately
1 A quota may be a type of trade barrier preferred by policy-makers and local producers as it provides them with a certainty about the maximum imported quantity. In the case of tariffs, price fluctuations remain and the imported quantity is potentially infinite. 2 The artificial scarcity allows exporters or importers to buy goods at the price of the constrained country and to sell them at a higher domestic market price, thus collecting the difference. 3 We define a quota as binding if its fill rate exceeds 80% of the working level. In our analysis we further distinguish between weakly binding quota (fill rate between 80% and 95%) and strongly binding quota (fill rate above 95%). 4 The system of import licensing by which textiles and clothing quotas are administered in the EU is SIGL (Système Intégré de Gestion des Licences) and is maintained by the European Commission. It divides textiles and clothing products into different categories on which the bilateral quotas are imposed. A description of the categories is given in Appendix II.
13
reveals that quotas were significantly more constraining for clothing than for textiles products. We further note that the number of quotas faced by a country do not necessarily mirror their general degree of constraint. For instance, 17% of imports of Chinese textiles and 41% of imports of Chinese clothing fell into categories restricted by quotas. For other countries these shares were much higher, despite a smaller absolute number of quotas, as in the case of Pakistan. On the whole, Macao, Pakistan, India and China were the most constrained, even though the former is of negligible size. It should be recalled at this point, that quotas, despite still being binding were constantly enlarged under the rules stipulated by the ATC. This brief analysis of textiles and clothing quota is only part of the overall quota story. Indeed, besides the EU, the US has also strongly relied on the use of quotas, which it also applied to countries like Bangladesh, that enjoy preferential market access to the EU. Beyond 2004, other non-WTO members will continue to face quotas or surveillance systems. Table 3.1. Country-specific effect of quotas, 2004
Share of imports falling under binding quotas
(in %) Country Number of Quotas*
Number of weakly binding quotas*
Number of strongly binding quotas*
Total number of
binding quotas* Textiles Clothing
Textiles and
Clothing Argentina 3 0 0 0 0 0 0 China 28 12 8 20 16.8 41.1 35.6 Hong Kong 19 2 1 3 0.0 25.4 24.6 India 17 8 1 9 18.1 58.5 40.9 Indonesia 12 2 1 3 0.0 42.9 31.0 Macao 14 4 2 6 0.0 71.2 71.1 Malaysia 10 1 0 1 0.0 18.2 14.3 Pakistan 14 5 4 9 61.3 56.5 59.5 Peru 2 0 0 0 0.0 0.0 0.0 Philippines 9 1 0 1 0.0 27.4 24.7 Singapore 8 0 0 0 0.0 0.0 0.0 South Korea 28 4 1 5 0.0 65.4 26.4 Taiwan 25 1 0 1 0.0 50.3 22.3 Thailand 16 2 1 3 0.0 49.7 37.2 TOTAL 205 42 19 61 * Number of quotas include subcategories.
Note: Columns 2-5 use data from 2004, columns 6-8 use data from 2002. Source: Own calculations based on Comext data; SIGL.
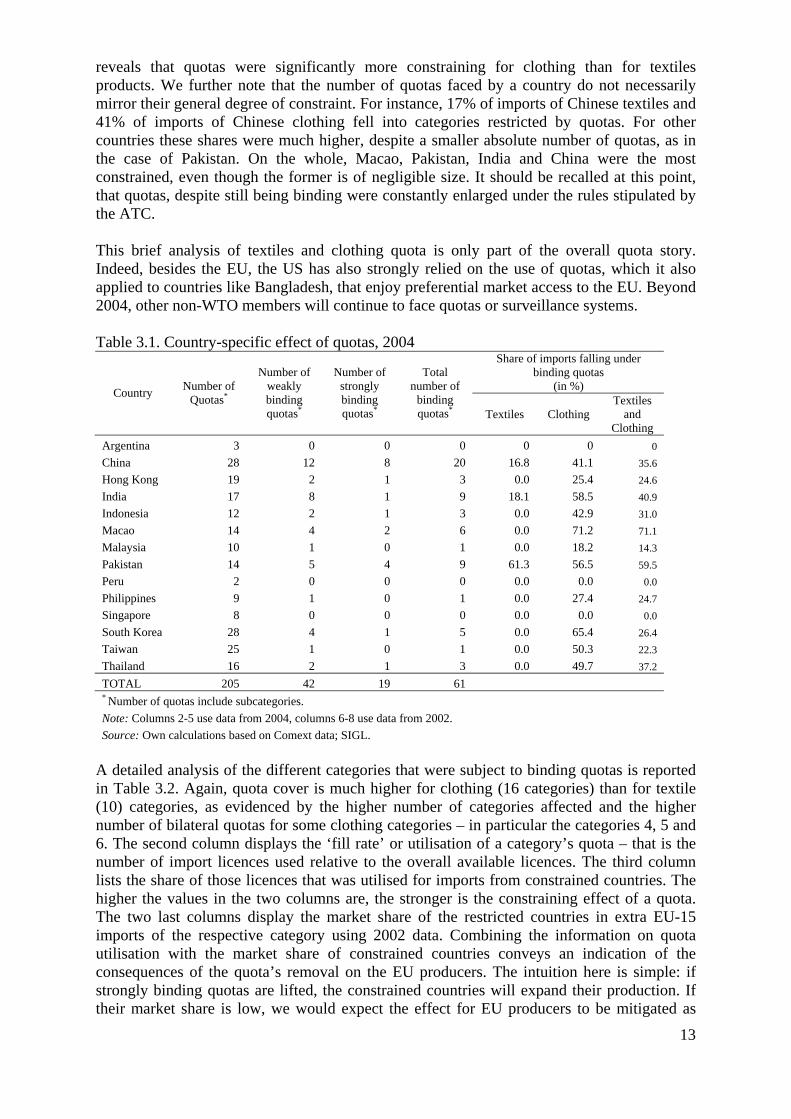
A detailed analysis of the different categories that were subject to binding quotas is reported in Table 3.2. Again, quota cover is much higher for clothing (16 categories) than for textile (10) categories, as evidenced by the higher number of categories affected and the higher number of bilateral quotas for some clothing categories – in particular the categories 4, 5 and 6. The second column displays the ‘fill rate’ or utilisation of a category’s quota – that is the number of import licences used relative to the overall available licences. The third column lists the share of those licences that was utilised for imports from constrained countries. The higher the values in the two columns are, the stronger is the constraining effect of a quota. The two last columns display the market share of the restricted countries in extra EU-15 imports of the respective category using 2002 data. Combining the information on quota utilisation with the market share of constrained countries conveys an indication of the consequences of the quota’s removal on the EU producers. The intuition here is simple: if strongly binding quotas are lifted, the constrained countries will expand their production. If their market share is low, we would expect the effect for EU producers to be mitigated as
14
expanded production of the restricted countries would partly be at the expense of other supplier countries. If the market share of restricted countries is high, the brunt of the quota removal will mainly be felt by EU producers. For instance, we would expect the competitive increase to be much higher for EU producers of category 5 (jerseys, pullovers, etc.) than for 15 (women’s or girl’s woven overcoats). Table 3.2. Product-specific effects of quotas, 2004
Category Textiles (T) or Clothing (C)
Fill rate
Import licences
from restricted
countries (as a % of total
licences)
Import licences from
strongly restricted
countries (as a % of total licences)
Number of countries affected
Market share of restricted countries (% of extra EU
imports)
Market share of strongly restricted
countries (% of extra EU
imports)
1 T 57.1 75.6 22.5 2 23.47 5.1 2 T 59.5 48.1 31.2 2 16.63 7.5
2A T 44.6 8.1 0.0 1 5.99 0.0 3 T 59.7 61.0 0.0 2 30.27 0.0 4 C 81.7 79.3 22.7 7 21.66 8.4 5 C 91.4 97.0 64.8 11 35.73 23.1 6 C 79.8 61.6 15.0 7 12.85 3.2
6A C 87.9 100.0 0.0 1 7 C 59.3 54.0 10.1 2 16.26 4.2 8 C 53.5 51.4 34.1 2 16.38 11.0 9 T 82.3 60.9 42.4 2 14.04 9.8
12 C 57.1 65.6 0.0 1 10.52 0.0 13 C 86.0 85.6 84.3 2 30.05 29.9 15 C 48.1 78.0 75.7 2 8.88 8.5 16 C 59.3 98.5 0.0 1 16.09 0.0 20 T 77.6 70.5 70.5 1 39.47 31.1
20/39 T 91.4 100.0 0.0 1 23 T 62.6 57.9 0.0 1 38.98 0.0 26 C 42.4 61.9 0.0 2 28.36 0.0 28 C 53.1 73.8 0.0 1 19.67 0.0 29 C 57.9 69.4 69.4 1 42.77 0.0 31 C 77.5 92.6 73.4 3 29.37 22.4 39 T 82.1 99.2 0.0 2 48.62 0.0 78 C 53.6 77.2 0.0 1 44.29 0.0 83 C 83.7 83.3 0.0 2 39.11 0.0
163 T 80.4 100.0 0.0 1 Note: Columns 3-6 use data from 2004, columns 7 and 8 use data from 2002. Source: Own calculations based on Comext; SIGL.
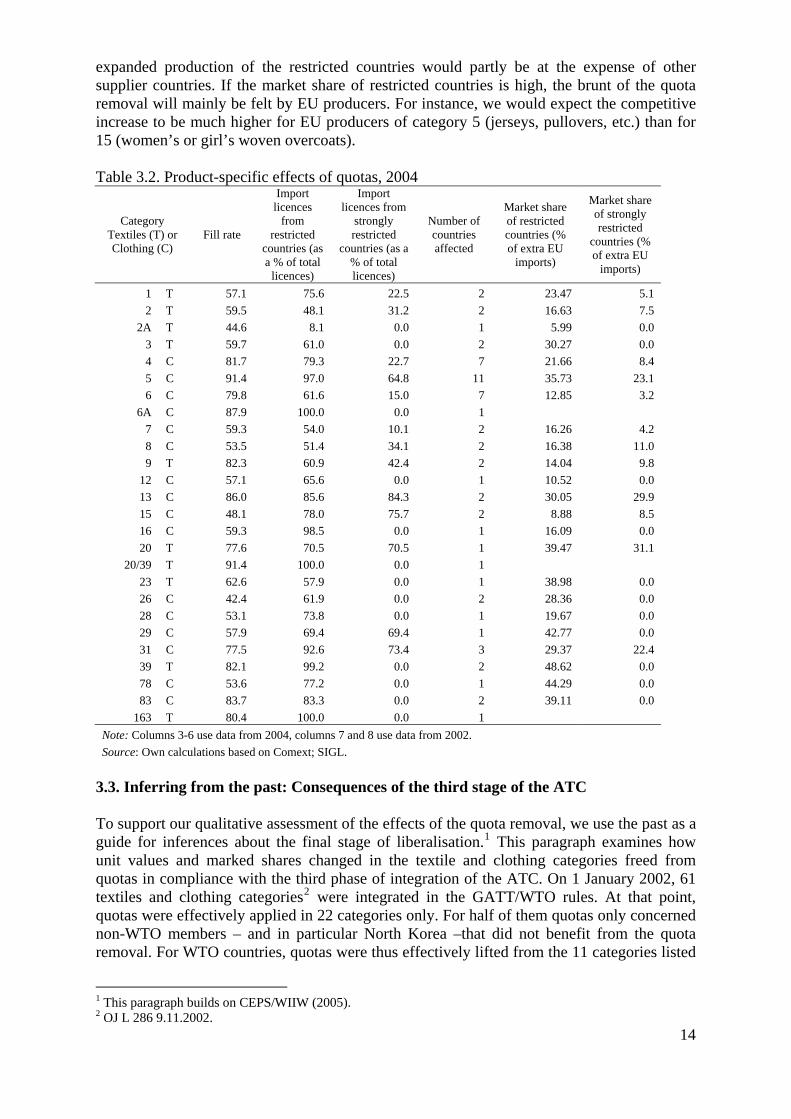
3.3. Inferring from the past: Consequences of the third stage of the ATC To support our qualitative assessment of the effects of the quota removal, we use the past as a guide for inferences about the final stage of liberalisation.1 This paragraph examines how unit values and marked shares changed in the textile and clothing categories freed from quotas in compliance with the third phase of integration of the ATC. On 1 January 2002, 61 textiles and clothing categories2 were integrated in the GATT/WTO rules. At that point, quotas were effectively applied in 22 categories only. For half of them quotas only concerned non-WTO members – and in particular North Korea –that did not benefit from the quota removal. For WTO countries, quotas were thus effectively lifted from the 11 categories listed
1 This paragraph builds on CEPS/WIIW (2005). 2 OJ L 286 9.11.2002.
15
in Table 3.3. Only six of them were affected by binding quotas. In each case, China was weakly restricted, while Macao was strongly restricted once. As already hinted at in the Introduction, our simple analysis confirms that binding quotas were backloaded to the final stages. Indeed, the number of integrated binding categories was much lower in 2002 than in 2005. The table also presents the quota’s fill rate and the market share of the restricted countries in extra-EU imports ahead of the quota abolition. It also reveals that five of the six binding quotas affected clothing products. Table 3.3. Product-specific effects of quotas, 2001
Category Textiles (T) or Clothing (C)
Fill rate
Market share of restricted
countries (% of extra EU imports)
Market share of strongly restricted
countries (% of extra EU imports)
Weakly restricted countries
Strongly restricted countries
10 C 50.3 44.2 0.0 China 18 C 27.1 38.5 0.0 China 21 C 54.4 21.6 1.0 China Macao 24 C 55.2 0.0 0.0 27 C 38.0 0.0 0.0 32 T 37.3 64.2 0.0 China 33 T 29.3 0.0 0.0 36 T 26.1 0.0 0.0 37 T 33.4 0.0 0.0 68 C 74.7 89.0 0.0 China 73 C 28.3 46.8 0.0 China
Source: Own calculations based on Comext; SIGL. Table 3.4 reports the percentage point change in unit values of imports belonging to the 11 categories between 2001 and 2002, according to their respective national or regional origin.1 Besides distinguishing among five regional groups,2 the table lists three selected Asian countries – China, as the country most affected by the incidence of quotas, and India and Bangladesh for comparison. Apart from one textile category (37), unit values of extra-EU imports dropped on average in all categories analysed. This is in conformity with our theoretical predictions and with an empirical analysis by Evans & Harrigan (2004) who find a significant positive effect of binding quotas on prices, which reflects both product-upgrading as well as the capture of quota rents. For the 11 categories analysed in the table, the signs and magnitudes vary according to the origin. The unit value drop of imports from Asia, and from China in particular, stands out though. The unit values of Chinese products in the categories 10 (gloves, mittens and mitts), 18 (singlets, vests, sleeping dresses) and 21 (parkas and anoraks) fell by around half, those of categories 32 (woven pile and chenille fabrics), 68 (babies’ garments and clothing accessories) and 73 (tracksuits) by around 40%. These products were previously constrained by weakly binding quotas. One also observes that prices of Chinese imports dropped in other categories – to a lesser but nonetheless considerable extent. This may indicate that quotas, albeit non-binding, exert a passive effect on prices and trade flows. Indeed, once a category is definitely subject to GATT/WTO rules, the risk of imposing a quota is removed and producers can set prices closer to production cost in order to capture market shares.
1 Unit values are used as a proxy for prices. As the different categories include a range of products, they are only an imperfect measure. They only have little informational content standing on their own and should thus be examined in cross-country comparison or analysed over time. 2 The five groups are: New Member States (NMS) and Candidate Countries (CC); Mediterranean countries (MED) and Commonwealth of Independent States (CIS); Asia (incl. China); Industrialised countries; Rest of the world (ROW).

16
Table 3.4. Change in Unit Values between 2001 and 2002 (in %) Category Extra EU NMS &
CC MED &
CIS Asia Industrialised countries ROW China India Bangladesh
10 -18.6 -8.0 7.1 -20.2 6.9 18.1 -48.3 4.3 -67.4 18 -20.8 -9.5 2.0 -32.2 0.0 -6.7 -55.4 -4.5 -20.3 21 -31.3 17.0 0.7 -37.0 -10.8 -11.6 -55.9 -20.9 -16.1 24 -8.9 -4.8 -5.9 -11.7 -20.9 33.2 -22.4 -7.3 -6.1 27 -11.2 0.5 6.1 -24.5 1.1 -2.1 -24.6 -2.7 -13.2 32 -18.7 3.6 -3.3 -33.9 -12.5 1.2 -41.8 98.7 33 -4.8 -2.0 -7.1 -6.5 -0.4 -6.9 -2.1 -1.8 54.1 36 -6.4 8.9 15.7 -10.2 9.0 -2.8 -9.7 15.5 37 89.7 2.6 3.2 123.7 -11.3 -9.0 -10.6 23.0 68 -22.0 6.5 -3.4 -29.6 -9.3 2.3 -40.8 -8.2 -6.2 73 -24.3 9.7 -2.5 -30.8 -20.9 -10.0 -41.1 3.8 -20.4
Source: Own calculations based on Comext data. Table 3.5 reports how market shares have changed after the quota removal. In the case of China, there is, as expected, a negative relationship between changes in unit values and market shares. The strength of this link varies according to the different categories. In some cases (categories 32 and 73), China’s market share nearly doubled, in another it even more than doubled (category 21). Table 3.5. Change in Market Share between 2001 and 2002 (in percentage points)
Category NMS & CC
MED & CIS Asia Industrialised
countries ROW China India Bangladesh
10 -0.3 -0.1 3.7 -2.3 -1.0 10.7 0.0 0.0 18 0.0 2.3 0.1 0.0 -2.4 5.1 -0.9 -0.5 21 -1.1 -1.8 4.0 -0.1 -1.0 27.9 -0.9 -2.2 24 -0.4 0.4 0.4 -0.1 -0.2 2.2 -1.4 0.4 27 -5.1 2.1 3.4 -0.3 -0.1 3.6 0.5 0.2 32 -5.4 -0.3 11.9 -1.0 -5.1 22.0 -0.3 0.0 33 0.9 -0.5 -1.3 0.9 -0.1 -0.5 -2.8 0.1 36 0.6 -2.6 6.1 -2.4 -1.6 7.3 -0.1 0.0 37 2.5 2.8 -5.9 1.7 -1.0 4.4 -0.2 0.0 68 -1.0 -0.3 2.3 0.0 -1.0 5.3 0.1 0.0 73 0.7 -3.3 5.3 0.0 -2.6 20.2 0.3 -1.5
Source: Own calculations based on Comext data. A striking fact that emerges from this analysis is that the magnitude of the increase in China’s market share is not entirely matched by an increase of the market share of Asian countries, which suggests that a large part of China’s market-share gains occur at the expense of other Asian countries and that the impact on non-Asian countries is partly mitigated by this reshuffling. In our tables, this is partly reflected in the market-share losses of India and Bangladesh. In the case of anoraks and parkas (category 21), for instance, the market share of Bangladesh plunged by half within one year. However, other regional groups also bear part of the burden of the quota removal, as Asia’s gains are the largest in categories in which China faced binding quotas. 3.4. Individual country gains and losses What inferences can be made from the analysis of the third phase of liberalisation with respect to the final stage? This analysis has shown that unit value changes – and drops in particular – can be dramatic even within a single year and that they map directly into changes in market shares, thereby underscoring the restrictive character of quotas. The following example gives an idea of the magnitude of the final ATC stage. In 2001, quotas were lifted from China in 6 categories, all of them weakly binding ones. In 2004 China still faced quotas
17
in 19 categories, 8 of which were strongly binding, which were lifted on 1 January 2005. In addition to this, constraints on other WTO member countries, such as India and Pakistan were also lifted. In the categories in which binding quotas were valid until the end of 2004, very strong price falls may thus be expected that will go along with strong increases in the restricted countries’ market shares. For restricted countries, the quota-system acted as a straitjacket, deterring them from extending their production to a level that would have matched the demand they faced for their products. Bidding quotas and constraints farewell, should thus allow them to step up their production and to increase their market share in previously restricting countries. The above quota analysis has identified that Pakistan, India, China, Indonesia and South Korea as the most constrained countries among the major textiles and clothing suppliers of the EU-15, but has also shown they were able to rapidly expand their market shares upon quota removal. Similar scenarios are likely to continue to occur following the final liberalisation. Analogously, countries that benefited from trade diversion due to the constraints imposed on others will see their market share in restricting countries shrink. Bangladesh, Mauritius, Hong Kong and Thailand are among them. To some extent there will be a reshuffling among Asian suppliers of textiles and clothing to industrialised countries’ markets with countries like China or India simply substituting for others. However, the analysis has also shown that countries in other geographic areas, such as the new EU Member States and other industrialised countries may well be hit. It has also offered an indication as of the order of magnitude for price falls and market share changes that may occur after 1 January 2005.
18
4. The interlinkage of the quota removal and other factors4.1. Scale factorsIn terms of gains and losses, the direction of the effects of the quota removal should be in line with the theoretical predictions and past observations contained in the previous section. However, a multitude of other factors will determine their eventual magnitude. These scale factors render it difficult to make quantitative predictions. Here, we list a few of them.Preferential trade systems, such as the Generalised System of Preferences (GSP) or the Africa Growth and Opportunity Act (AGOA), applied by the EU and the US respectively, confer preferential market access to products from their beneficiaries such as exemption from quotas and lower tariffs. These relative advantages granted by preferential treatments will of course be eroded once trade barriers for other countries will be reduced. As a result of a more even treatment of countries in terms of trade policy, production characteristics are gaining more relevance. Countries which own or can easily develop a vertically-integrated production structure will be in a privileged position relative to those that have specialised in a particular sub-activity of the production chain. The former will be able to benefit from economies of scale and to coordinate the individual stages of production more efficiently. As frequent border crossings of intermediary products generate long periods of custom clearances and tariff costs, a production chain located within a single country will speed up production and lower its costs. Vertical integration moreover facilitates compliance with and proof of rules of origin requirements. Clearly, this is a matter of large vs. small countries, in which least developed countries (LDCs) that lack vertically-integrated production facilities will be on the losing side. Highly specialised clothing-producing countries that were unable to develop backward linkages are relying on textile imports, as their local industry cannot meet domestic demand. A vertical specialisation index reported in Nordas (2004) confirms that for Asian countries, specialisation decreases with the size of a country. Unconstrained countries that have a similar production and export structure as constrained countries will be exposed to higher competition once quotas affecting the latter have been lifted. The higher the similarity between the exports of two countries, the higher is the overall substitutability of their products and the stronger they consequently compete. Trade policies effectively targeting one of the countries would thus inevitably have indirect implications for the other. Along with the assumption that a country’s export structure reflects its domestic industrial structure, we can make some conjectures as to the severity of the impact of the quota removal on the local industries. In Figure 4.1 we report the results of a similarity analysis performed in CEPS/WIIW (2005), in which the overlap of EU-15 imports from selected countries with EU-15 imports from China is computed for the year 2002, using the Finger-Kreinin Index.1 China is used as a benchmark, as it is the largest and most constrained source country. A first striking observation is that the similarity between Chinese and other countries’ exports is much higher for clothing than for textile products in general, which suggests that the different national clothing industries will be much more exposed to competition with China, while national specialisation seems to be higher in the textile sector. Surprisingly, the overlap between Chinese imports and imports from Bangladesh and Mauritius is relatively small. This observation suggests that both countries have specialised in exporting products that China could not supply to the EU due to quantitative limitations. If
1 The Finger-Kreinin index is presented in the Appendix III. The results on display here were obtained using tariff line data (8 digit level) for 1102 textile products and 439 clothing products. It is a static indicator that does not take into account greenfield investment and does not account for the (imperfect) substitutability of products with different tariff lines. Binding quotas furthermore distort the index relative to the ‘natural’ degree of overlap.

this is the case, we would expect the similarity index to rise strongly in the post-quota era.1 We also take note of the relatively high similarity between imports from China and from within the EU, which hints of an impending pressure on EU producers. Otherwise, the analysis does not reveal any striking regional disparities. Figure 4.1. Import-similarity with textiles and clothing from China, 2002
0
20
40
60
Czech R
ep.
Hunga
ry
Poland
Bulgari
a
Roman
iaRuss
ia
Morocco
Tunisi
a
Turkey
Bangla
desh
Hong K
ong
India
Indon
esia
Malaysi
a
Mauriti
us
Pakist
an
Philipp
ines
South
Korea
Sri Lan
ka
Taiwan
Thaila
nd
Vietna
mJap
an
Switzerl
and
USA
Extra E
U
Intra
EU
Sim
ilarit
y (%
)
TextilesClothing
Source: CEPS/WIIW (2005. Trade policy, and the quota system in particular, can exert and has exerted a significant influence on the direction of trade flows and the geographical production patterns of textiles and clothing. However, criteria, such as delivery time, quality and consumer preference play an increasingly important role. As seen in section 2, an emerging regional dimension in textiles and clothing trade is plain in both the EU and the US, where Mediterranean and Eastern European countries, and Mexico and the Caribbean respectively, play an increasingly important role. During the 1990s, advances in information technology have paved the way for new business strategies based on a rapid data exchange and that allows a better inventory management. Instead of filling stocks at the start of the season and clearing them at the end, electronic communication of point of sales information permits the holding of smaller inventories that are refilled on a more frequent basis in response to fluctuations in a product’s demand.2 To ensure this quick replenishment, the producer’s proximity to the market is a key factor, even if the importance of delivery time obviously varies for different clothing categories. Evans & Harrigan (2004) measure this ‘demand for timeliness’, using data on replenishment of different clothing items within a selling season. They test the hypothesis whether imports of products with a high reordering frequency have witnessed relatively higher growth rates from countries close to the final market – in their case the US.3 Their results corroborate this hypothesis and furthermore suggest that proximity to the US significantly reduces the impact of tariff protection. The corollary of this system of ‘lean
1 Mlachila & Yang (2004) confirm this low degree of similarity. However they find a much higher overlap (71.5%) for exports by both countries to the US, which imposes quotas against both. 2 The buying cycle of an importer from design to arrival in the warehouse lasts 13 months for seasonal collections and 4-6 months for basic items (Eurocommerce, 2004). Shortening these time spans would obviously allow to meet demand in a more suitable way.
19
3 They acknowledge that air transport can compensate for distance, but that it is only an imperfect substitute due to its high cost, rendering it gainful for light products only.
20
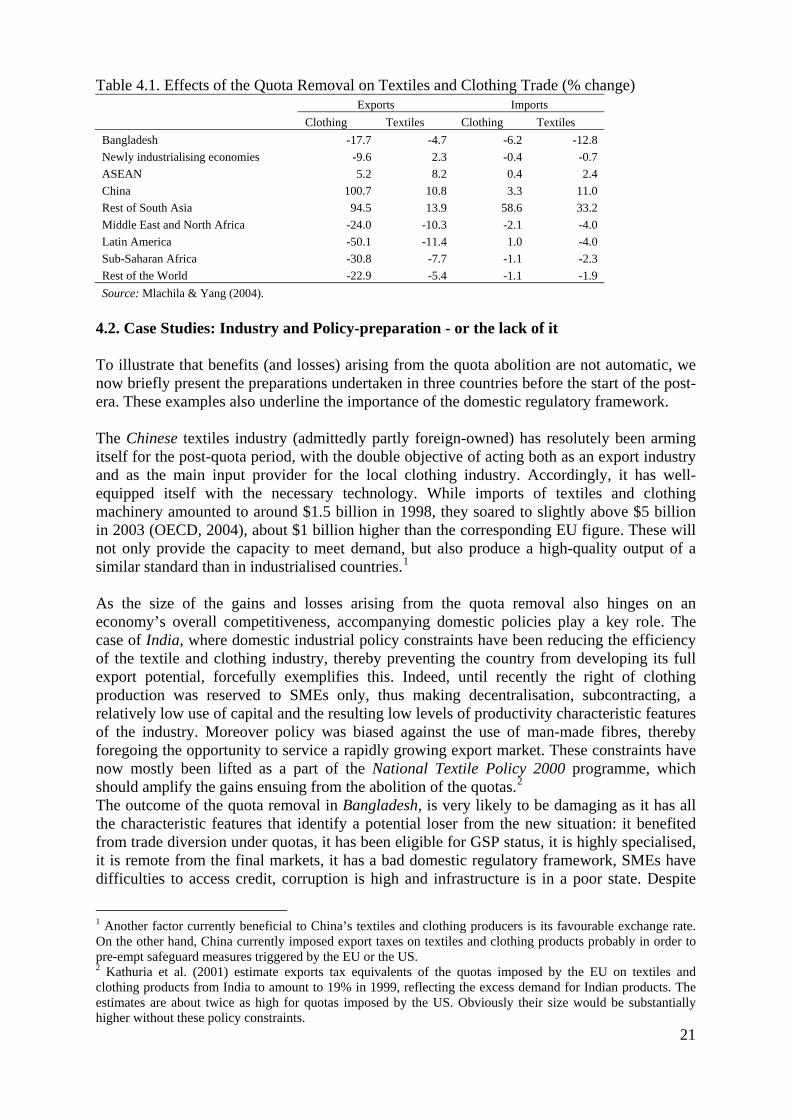
retailing’ is that there has to be both good communications and a good transport infrastructure to ensure the translation of proximity in rapidity of delivery and consequently well-trained work force. Producers have to be equipped with data processing programmes compatible with those of the retailers and depend on rapid and reliable telecommunication networks. Evans & Harrigan (2003) note that the importance of labour costs diminishes if a more proximate production can compensate for this by shorter delivery times. The consequences of the quota removal are difficult to quantify in a reliable way, as they heavily rest on the underlying model specifications. These include a mix of static and dynamic assumptions and scenarios concerning elasticity’s of substitution, the degree of wage rigidity, the degree of labour market rigidity, future investments, productivity growth and policy scenarios (e.g. application of safeguard measures). These assumptions often only imperfectly capture all the effects adding to the mere quota removal. Mlachila & Yang (2004) use a GTAP model to forecast the changes of textiles and clothing imports and exports upon quota removal. While the signs of the predicted changes are in line with our qualitative predictions, the magnitudes should be treated with caution as they vary with the underlying hypotheses. We reproduce their results in Table 4.1 below. Nordas (2004) also uses a GTAP model to forecast market share changes in EU and US textiles and clothing imports. Her results – which are not reported here –confirm that there is a more sizeable reshuffle among suppliers in the clothing than in the textile market that restricted countries will witness the largest increases and that regions which have been enjoying preferential trade schemes (Africa and the CEECs) will lose shares.
21
Table 4.1. Effects of the Quota Removal on Textiles and Clothing Trade (% change)
Exports Imports Clothing Textiles Clothing Textiles Bangladesh -17.7 -4.7 -6.2 -12.8 Newly industrialising economies -9.6 2.3 -0.4 -0.7 ASEAN 5.2 8.2 0.4 2.4 China 100.7 10.8 3.3 11.0 Rest of South Asia 94.5 13.9 58.6 33.2 Middle East and North Africa -24.0 -10.3 -2.1 -4.0 Latin America -50.1 -11.4 1.0 -4.0 Sub-Saharan Africa -30.8 -7.7 -1.1 -2.3 Rest of the World -22.9 -5.4 -1.1 -1.9 Source: Mlachila & Yang (2004).
4.2. Case Studies: Industry and Policy-preparation - or the lack of it To illustrate that benefits (and losses) arising from the quota abolition are not automatic, we now briefly present the preparations undertaken in three countries before the start of the post-era. These examples also underline the importance of the domestic regulatory framework. The Chinese textiles industry (admittedly partly foreign-owned) has resolutely been arming itself for the post-quota period, with the double objective of acting both as an export industry and as the main input provider for the local clothing industry. Accordingly, it has well-equipped itself with the necessary technology. While imports of textiles and clothing machinery amounted to around $1.5 billion in 1998, they soared to slightly above $5 billion in 2003 (OECD, 2004), about $1 billion higher than the corresponding EU figure. These will not only provide the capacity to meet demand, but also produce a high-quality output of a similar standard than in industrialised countries.1
As the size of the gains and losses arising from the quota removal also hinges on an economy’s overall competitiveness, accompanying domestic policies play a key role. The case of India, where domestic industrial policy constraints have been reducing the efficiency of the textile and clothing industry, thereby preventing the country from developing its full export potential, forcefully exemplifies this. Indeed, until recently the right of clothing production was reserved to SMEs only, thus making decentralisation, subcontracting, a relatively low use of capital and the resulting low levels of productivity characteristic features of the industry. Moreover policy was biased against the use of man-made fibres, thereby foregoing the opportunity to service a rapidly growing export market. These constraints have now mostly been lifted as a part of the National Textile Policy 2000 programme, which should amplify the gains ensuing from the abolition of the quotas.2
The outcome of the quota removal in Bangladesh, is very likely to be damaging as it has all the characteristic features that identify a potential loser from the new situation: it benefited from trade diversion under quotas, it has been eligible for GSP status, it is highly specialised, it is remote from the final markets, it has a bad domestic regulatory framework, SMEs have difficulties to access credit, corruption is high and infrastructure is in a poor state. Despite
1 Another factor currently beneficial to China’s textiles and clothing producers is its favourable exchange rate. On the other hand, China currently imposed export taxes on textiles and clothing products probably in order to pre-empt safeguard measures triggered by the EU or the US. 2 Kathuria et al. (2001) estimate exports tax equivalents of the quotas imposed by the EU on textiles and clothing products from India to amount to 19% in 1999, reflecting the excess demand for Indian products. The estimates are about twice as high for quotas imposed by the US. Obviously their size would be substantially higher without these policy constraints.

22
representing only 5% of the GDP, textile and clothing production in Bangladesh contributes strongly to employment and trade.1 More than 77% of merchandise exports from Bangladesh in 2002 were textiles and clothing products, of which 94% were exported to countries imposing quotas. This proportion is far higher than for China or India (75% and 40%, respectively). However, Bangladesh’s major problems rest on its low competitiveness. Policy impediments include restrictions on foreign direct investment (FDI) and textiles imports (which seems to reflect a general policy-bias in favour of the textile producers), as well as an inefficient quota allocation system resulting in a low productivity, foregone investment and technological spillover opportunities. Mlachila & Yang (2004) review different studies that estimate the effects of the quota removal on Bangladesh and make their own forecast. While these studies use different quantitative or qualitative methodologies they all predict deteriorations in the country’s GDP, employment, trade balance, both textiles and clothing imports, exports and output. One factor that may limit the immediate negative impact for Bangladesh is the risk perceived by importers of an application of safeguard and anti-dumping measures against China or other restricted countries. This risk would indeed encourage them to spread their ‘sourcing portfolio’, including countries free from that risk – such as Bangladesh. 4.3. The textile and clothing industries as a stepping stone for industrialisation and
development In many developing countries, the establishment of a textiles and clothing industry sheltered by the MFA was often seen to be a stepping stone towards industrialisation and participation in the global economy. These industries could draw upon the abundance of cheap, unskilled labour and thereby offer a labour market access to groups previously excluded, especially to women. At the same time, they were expected to develop backward and forward linkages, thereby developing an industrial network. This opportunity has now been removed together with the quota. The new situation will create strong adverse impacts on socio-economic relations and increase the gender imbalance in such countries. Workers in the textiles and clothing industry will have to cope with job losses or more precarious working conditions.2
1 The figures in this paragraph are taken from Mlachila & Yang (2004). 2 Due to their higher participation in the textiles and clothing industries, women will be the hardest hit, implying a strong deterioration of the gender balance –in Bangladesh for example these industries constitute 40% of the manufacturing sector employment, 90% of which are women (Mlachila & Yang, 2004). While the Philippines have now exempted the clothing industry from its minimum wage laws (IFCTU, 2004), some fear social turmoil in Bangladesh (Financial Times, 2004).

23
5. Sector-specific losses vs. economy-wide gains 5.1. Contraction in production and employment As noted in section 2, the textile and clothing industry has been receding in terms of employment and the number of enterprises. Gains in productivity, however, have allowed output and exports to increase. The labour adjustment witnessed over the past decades has partly been trade-related and is partly imputable to technological advances. While workers in the textile sector have mainly been affected by the latter phenomenon, clothing workers have suffered from relocation to low-wage countries at the borders of the EU or in Asia. The quota removal will certainly exacerbate this trend as production units in other countries will not be limited in their production by quotas anymore. In the EU this is likely to particularly hit countries in which the clothing industry still has a strong foothold and has not upgraded its production. This diagnosis is corroborated by the similarity index in section 4 which pointed towards a high overlap between intra-EU imports and imports from China. It leads us to expect continuously increasing competition, which will be stronger in the clothing sector where the degree of similarity is estimated at 55%, while it is at 39% for the textile sector. We have also seen, however, that extra-EU exports, particularly in textiles, have been rising over the past decade and that they occupy an increasing weight in total EU textile exports. As developing countries, particularly those in Asia, grow and their purchasing power increases, the demand for European high-quality or fashionable intermediary or final goods is also likely to rise and to open new opportunities in these markets for EU producers. Furthermore, the local demand for EU textile and clothing products is still high. One can broadly separate the nature of competition between goods into price – and quality-competition. An indicator attempting to do this is the Revealed Quality Elasticity (RQE) indicator.1 Its premise is that for products competing in quality, the price is only of secondary importance and one would expect a country with a relatively high (low) quality product, reflected by a higher (lower) unit value, to have a positive (negative) trade balance. Such a product would then be judged as quality elastic, as opposed to price elastic, where competition is determined by prices. Stengg (2001), Brenton et al. (2002) and CEPS/WIIW (2005) all apply the RQE indicator.2 Their results suggest that the quality aspect is much more relevant for the textiles sector than for the clothing sector, where competition is mainly determined by prices. They also imply that EU products generally have an advantage when competition is quality-driven, but that in the opposite case the EU can compete neither in textiles nor in clothing. Price falls linked to the quota removal would thus have a stronger competitive impact on the clothing industry than on textile producers, who can fend off stronger competition with high-quality products. While our analysis has suggested a further downsizing of the textile and clothing industry, we now turn to two studies that have attempted to assess the quantitative impact of the quota removal on the EU industry. Francois et al. (2000) estimate the number of jobs ‘saved’ by quota protection in the EU using a computable general equilibrium model. Their findings suggest that the quota system has maintained over 131,000 and 525,000 people in the textiles and clothing industries respectively, in their jobs. This came at a cost, however, as the price of protection per job was estimated to be above €28,000 and €41,000 in the two sectors,
1 For caveats of the RQE indicator, see Stengg (2001). 2 Using data for 2002, CEPS/WIIW (2005) apply the RQE indicator to 137 SIGL categories, 96 and 41 of which respectively comprise textile and clothing products. Slightly more than half of the textile categories were revealed as price elastic with EU countries charging higher prices. Where competition was quality-driven, the EU generally had a superior quality. Out of the 41 clothing categories, more than three-quarters were competing on prices, with the EU being disadvantaged each time. EU products had a quality advantage in six categories.
24
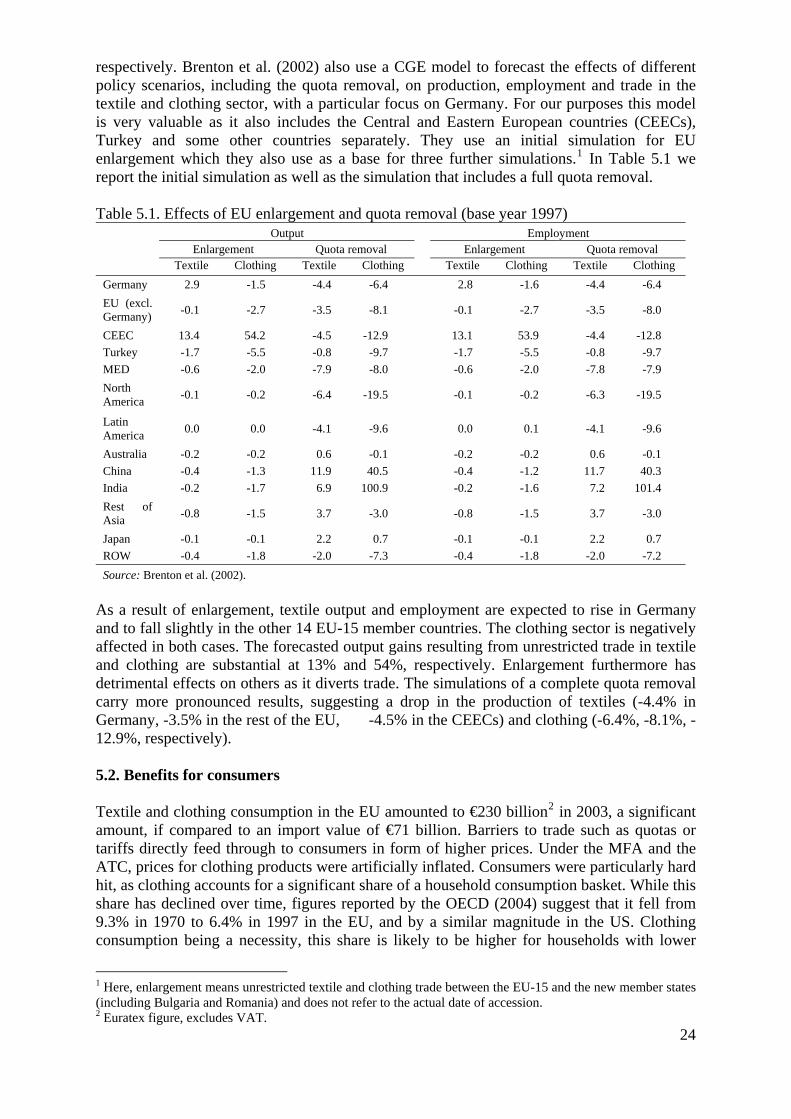
respectively. Brenton et al. (2002) also use a CGE model to forecast the effects of different policy scenarios, including the quota removal, on production, employment and trade in the textile and clothing sector, with a particular focus on Germany. For our purposes this model is very valuable as it also includes the Central and Eastern European countries (CEECs), Turkey and some other countries separately. They use an initial simulation for EU enlargement which they also use as a base for three further simulations.1 In Table 5.1 we report the initial simulation as well as the simulation that includes a full quota removal. Table 5.1. Effects of EU enlargement and quota removal (base year 1997)
Output Employment Enlargement Quota removal Enlargement Quota removal Textile Clothing Textile Clothing Textile Clothing Textile Clothing Germany 2.9 -1.5 -4.4 -6.4 2.8 -1.6 -4.4 -6.4 EU (excl. Germany) -0.1 -2.7 -3.5 -8.1 -0.1 -2.7 -3.5 -8.0
CEEC 13.4 54.2 -4.5 -12.9 13.1 53.9 -4.4 -12.8 Turkey -1.7 -5.5 -0.8 -9.7 -1.7 -5.5 -0.8 -9.7 MED -0.6 -2.0 -7.9 -8.0 -0.6 -2.0 -7.8 -7.9 North America -0.1 -0.2 -6.4 -19.5 -0.1 -0.2 -6.3 -19.5
Latin America 0.0 0.0 -4.1 -9.6 0.0 0.1 -4.1 -9.6
Australia -0.2 -0.2 0.6 -0.1 -0.2 -0.2 0.6 -0.1 China -0.4 -1.3 11.9 40.5 -0.4 -1.2 11.7 40.3 India -0.2 -1.7 6.9 100.9 -0.2 -1.6 7.2 101.4 Rest of Asia -0.8 -1.5 3.7 -3.0 -0.8 -1.5 3.7 -3.0
Japan -0.1 -0.1 2.2 0.7 -0.1 -0.1 2.2 0.7 ROW -0.4 -1.8 -2.0 -7.3 -0.4 -1.8 -2.0 -7.2 Source: Brenton et al. (2002).
As a result of enlargement, textile output and employment are expected to rise in Germany and to fall slightly in the other 14 EU-15 member countries. The clothing sector is negatively affected in both cases. The forecasted output gains resulting from unrestricted trade in textile and clothing are substantial at 13% and 54%, respectively. Enlargement furthermore has detrimental effects on others as it diverts trade. The simulations of a complete quota removal carry more pronounced results, suggesting a drop in the production of textiles (-4.4% in Germany, -3.5% in the rest of the EU, -4.5% in the CEECs) and clothing (-6.4%, -8.1%, -12.9%, respectively). 5.2. Benefits for consumers Textile and clothing consumption in the EU amounted to €230 billion2 in 2003, a significant amount, if compared to an import value of €71 billion. Barriers to trade such as quotas or tariffs directly feed through to consumers in form of higher prices. Under the MFA and the ATC, prices for clothing products were artificially inflated. Consumers were particularly hard hit, as clothing accounts for a significant share of a household consumption basket. While this share has declined over time, figures reported by the OECD (2004) suggest that it fell from 9.3% in 1970 to 6.4% in 1997 in the EU, and by a similar magnitude in the US. Clothing consumption being a necessity, this share is likely to be higher for households with lower
1 Here, enlargement means unrestricted textile and clothing trade between the EU-15 and the new member states (including Bulgaria and Romania) and does not refer to the actual date of accession. 2 Euratex figure, excludes VAT.

25
incomes. Inducing price falls by relaxing trade barriers will thus raise consumers’ real income and have distributional consequences by alleviating the expenditure burden of low-income households. As physical restrictions on goods imports will be lifted, consumers should furthermore face a broader choice of products. The more efficient production expected in the post-quota era should be reflected in the availability of higher quality products, which is also in the interest of consumers. Table 5.2. Annual welfare gains from ATC reforms in EU (base year 1997)
Quota
liberalisation UR Tariffs cuts Total ATC reforms Four person household
in € millions in € Austria 639 18 661 327 Belgium/Lux. 789 22 815 307 Denmark 494 14 511 386 Finland 350 10 362 281 France 4428 124 4581 312 Germany 6752 196 6999 341 Greece 211 5 217 83 Ireland 175 5 181 196 Italy 3356 83 3453 240 Netherlands 1101 32 1140 291 Portugal 230 5 235 94 Spain 1580 43 1633 166 Sweden 517 15 536 242 United Kingdom 3824 106 3956 268 EU 24446 677 25282 270 Source: François et al. (2000), as reproduced in OECD (2004).
François et al. (2000) compute the welfare gains accruing to EU countries following quota removal, Uruguay Round (UR) tariff liberalisation and a combination of the two. Overall annual welfare gains for the EU in the latter scenario amount to over €25 billion, or a welfare gain of €270 per four-person household. Their results are reported in Table 5.2. These gains are lowest in countries where the textiles and clothing industry still plays a prominent role (Greece, Portugal and Spain) and highest where the industry is the relatively smallest (Denmark, Germany and Austria).

26
6. Policy recommendations • Implementation of a more effective ‘differential treatment’ for vulnerable countries
The quota removal is predicted to have a negative impact on small developing countries. A way to alleviate this impact is to maintain the differential treatment in terms of market access enjoyed by the goods of some countries. In practice, such a policy generally takes the form of tariff preferences, more generous quotas or a combination of both. In order to guarantee that this preferential treatment only applies to goods manufactured in the beneficiary countries, origin rules have to be specified to preclude trade deflection. Yet, the aim of supporting certain countries by diverting trade towards them requires the rules to be designed in a sensible way. It must therefore both be conceivable for a country to comply with them and, conditional upon this, it must be simple to prove them. In order to obtain origin status, typically the final stages of the production chain have to be carried out inside a country. In the case of clothing, origin status is only awarded if the fabric is produced within the preferential area. This works clearly at the disadvantage of countries that do not have backward linkages and have a high degree of specialisation, i.e. which execute the final assembly-activities using imported inputs. As these clothing items are not eligible for tariff preferences, importers have less incentive to react to the preferential treatment offered, which results in the failure of the policy. As forcefully argued in Brenton and Manchin (2002), rules of origin (ROO) currently measure up unsatisfactorily to their objective, since only a small proportion of imports from eligible countries request preferential treatment. This is partly due to their restrictive nature and partly due to the high administrative costs associated with proving them. We suggest three possibilities how a more effective differential treatment might be achieved:
o Explore ways of making ROO more flexible for products that are particularly
important to developing countries which lack the necessary backward linkages. Simpler processing requirements, such as a single transformation rule1, or requirements on value-added2 might be considered.
o Make preferential trade more attractive by lowering the costs associated to it. Proving ROO currently generates high administrative costs, as it is lengthy to fill in all necessary documents and the substantial risk of being fined on suspicion of fraud is also dissuasive. Financial and technical assistance in support of more efficient customs procedures in developing countries could tackle this issue.
o Support the reform proposals of the GSP, and in particular the facilitation of the new graduation mechanism, which ensures that countries with a high share in imports of a certain good are not granted preferential tariffs. Regarding textiles and clothing, this should make sure that small suppliers such as Bangladesh still keep a comparative advantage (in terms of lower tariffs) vis-à-vis some Chinese products.
• Avoid the use of safeguard measures
A number of reasons why the EU should not impose safeguard measures against countries previously restricted, and in particular China, is listed below: o Implementing safeguard measures would undermine the credibility of the
multilateral trade system as they would be based on unilateral decisions. In the light
1 This recommendation is put forward by Brenton and Manchin (2002) and could take the form of a simple change of tariff level. 2 Value-added rules are already applied for certain goods by the EU and are integrally applied by other countries such as Canada.
27
of the ongoing Doha Development Round, this would be a severe blow. The ten year phasing-out period of the quotas should have been used by producers and governments to prepare the aftermath. An artificial extension of this fading-out does not seem appropriate.
o Safeguard measures could also lead to retaliatory actions by the countries affected. As the main suppliers of the EU – China and India in particular – are slowly opening up their markets to European producers and retailers, the latter would be harmed too.
o Consumers who benefit from lower prices would also be strongly hit by safeguard measures. The same applies for European importers that have already placed orders on products in the countries potentially facing safeguard measures and would not be able anymore to sell them.
o Finally, safeguard measures revive the risk of transhipment and the need of a costly monitoring system.
• Press for a better market access for EU producers
As many developing countries grow, the demand for high-quality textiles and fashionable clothing rises, thereby creating new opportunities for EU producers. However, they are often impeded by very high tariffs in some of those countries such as India. Multilateral negotiations currently under way should be used to press for lower tariffs everywhere.
• Use the additional tariff revenue for development assistance
China currently supplies €9 billion worth of clothing to the EU-15. Different quantitative studies (Brenton et al. (2002), Mlachila and Yang (2004)) have forecasted that imports from China may more than double in the long term. Assuming that this figure is correct and that all of this trade is diverted from countries that enjoyed free market access, this should lead to an additional tariff revenue of over €1 billion, applying the average EU clothing-import tariff of 12% (OECD, 2004). This money could be spent on development assistance in the countries adversely affected by the quota removal. For example, some of these funds could be spent on increased (re-)training of workers and technical assistance to the industry.
• Strengthening the domestic growth policies
Textile and clothing trade with the new member states accounts for a high share of extra-EU 15 trade. Following enlargement, this trade is internalised, which implies that trade policies can be no longer used. However, producers in the new member states should be concentrating on quality, tight delivery and other quality aspects, as wage rates are increasing rapidly along with the general strengthening of their economies. This means that strengthening the domestic growth policies that will allow them to ‘graduate’ from low wage clothing production to other higher value added activities will be crucial. Protection against low cost clothing imports would only keep them in a low wage level of development.
28
7. Conclusions This paper has analysed the constraining nature of the quota-system in place until the end of 2004, which had created a global production and trade pattern that is now about to change. The European Parliament was interested in particular in the following five issues. The medium and long-term effects on EU textile and clothing producers Within the analysed sector one has to distinguish between the two industries it incorporates, i.e. textiles and clothing. The former is relatively capital-intensive and increasingly incorporates R&D. While competition in the textile industry might increase for some specific sub-sectors, this might be offset by increasing export opportunities and the shift towards the production of technical textiles. Regarding clothing, it is clear that the ongoing adjustment process will accelerate. The pressure will be strongest in those segments (and countries) that have so far specialised in low value added production. The medium and long-term effects on EU consumers Here, an unambiguous answer can be given: EU consumers will benefit from the access to a larger variety of goods that will be available to them at lower prices. Winners among (non-EU) textile and clothing producing countries Among the winners we expect to see countries that were previously restricted by quotas. Vertically-integrated production chains, a good infrastructure, a sound domestic regulatory framework and proximity to the final market will magnify the effects. Losers among (non-EU) textile and clothing producing countries Some smaller less developed countries that have benefited from the shelter provided by the MFA and the quota-induced trade diversion will emerge as losers in the aftermath of the quota-system. The scale factors listed above will eventually determine the size of this adverse impact. Possible solutions for probable crisis The quotas that have now been abolished targeted specific sectors. Moreover, the remaining protection in the form of tariffs also varies greatly among sub-sectors. Hence, one should not expect an impending crisis hitting the entire clothing industry, but rather specific crises resulting from surges in imports and/or falls in prices in certain clothing sub-sectors. This implies that blanket protection or aid to the sector as a whole would not be appropriate. Moreover, the sector had a decade to prepare for this event.

29
References Audet, Denis (2004), Structural Adjustment in Textiles and Clothing in the Post-ATC Trading Environment, OECD Trade Policy Working Paper No.4 Brenton, Paul and Manchin, Miriam (2002), Making EU Trade Agreements Work: The Role of Rules of Origin, CEPS Working Paper No. 183, Centre for European Policy Studies, Brussels. Brenton, Paul, Christian Buelens (CEPS), Julia Egerer, Philip von Schöppenthau (EPPA) (2002), Die Auswirkungen der ATC-Liberalisierung auf die deutsche Textilwirtschaft, Project Report, Brussels CEPS and WIIW (2005), The textiles and clothing industry in an enlarged community and the outlook in the candidate states, Study commissioned by the European Commission (DG Enterprise). Euratex (2004) Key Figures 2003 – E.U. Textile & Clothing, June. Eurocommerce (2004), Importers’ Buying Cycles, Briefing Paper. European Commission (2003), Economic and Competitiveness Analysis of the European Textile and Clothing Sector, Commission Staff Working Paper, SEC(2003) 1345 European Commission (2005), SIGL (http://sigl.cec.eu.int). Evans, Carolyn and James Harrigan (2003), Distance, Time and Specialisation, NBER Working Paper 9729, National Bureau for Economic Research, Cambridge, MA. Evans, Carolyn and James Harrigan (2004), Tight Clothing: How the MFA affects Asian Apparel Exports, NBER Working Paper 10250, National Bureau for Economic Research, Cambridge, MA. Financial Times (2004), “Social upheaval feared when end of import quotas hits Bangladesh”, 24 July. François, J.F., H.H. Glisman and D. Spinanger (2000), The cost of EU protection in textiles and clothing, Kiel Institute for World Economics, Working Paper No 997. International Confederations of Free Trade Unions (2004), Disaster looms with the end of the quota system, IFCTU report. Kathuria, Sanjay, Will Martin and Anjali Bhardwaj (2001), Implications for South Asian Countries of Abolishing the Multifibre Arrangement, World Bank Working Paper 2721, The World Bank, Washington, DC. Mlachila, Montfort and Yongzheng Yang (2004), The End of Textiles Quota: A Case Study of the Impact on Bangladesh, IMF Working Paper WP/04/108, International Monetary Fund, Washington, DC. Nordas, Hildegunn Kyvik (2004), The Global Textile and Clothing Industry post the Agreement on Textiles and Clothing, World Trade Organisation, Geneva.

30
OECD (2004), A New World Map in Textiles and Clothing. Adjusting to change. Organisation for Economic Co-operation and Development. Paris. Stengg, Werner (2001), The textile and clothing industry in the EU – A survey, Enterprise Paper No 2, European Commission. WTO (2004), International Trade Statistics, World Trade Organisation, Geneva.
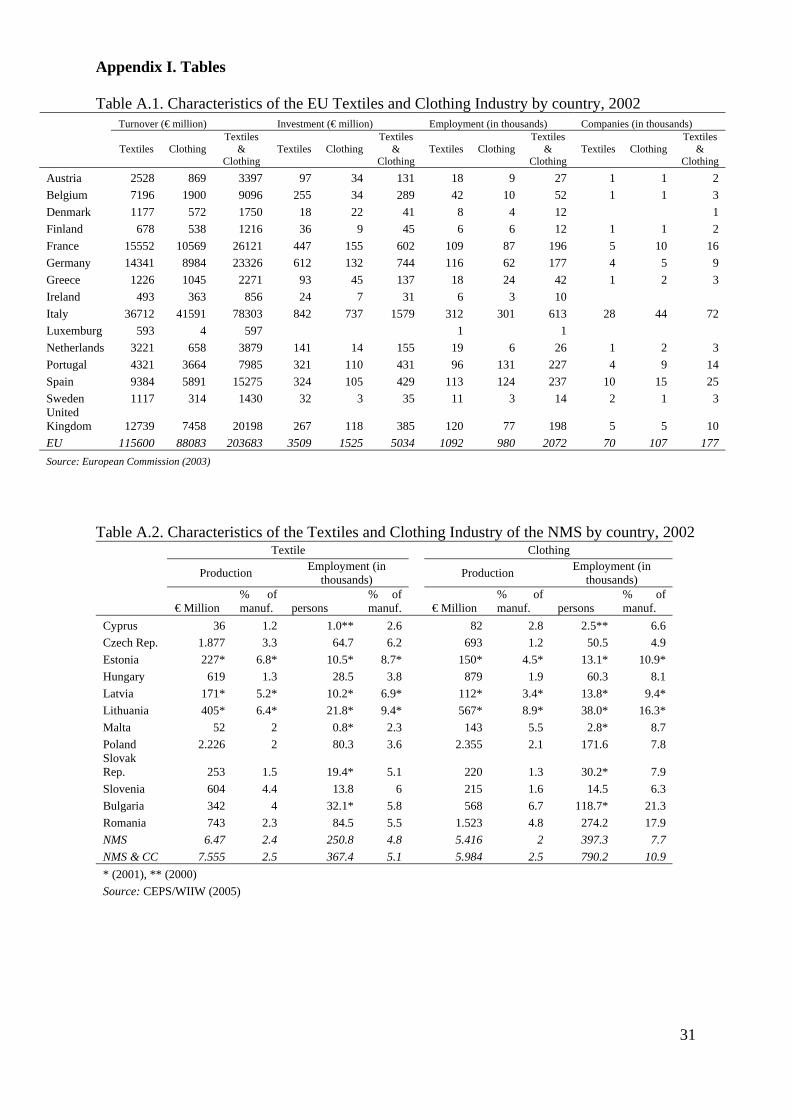
31
Appendix I. Tables Table A.1. Characteristics of the EU Textiles and Clothing Industry by country, 2002
Turnover (€ million) Investment (€ million) Employment (in thousands) Companies (in thousands)
Textiles Clothing
Textiles &
Clothing Textiles Clothing
Textiles &
Clothing Textiles Clothing
Textiles &
Clothing Textiles Clothing
Textiles &
Clothing Austria 2528 869 3397 97 34 131 18 9 27 1 1 2 Belgium 7196 1900 9096 255 34 289 42 10 52 1 1 3 Denmark 1177 572 1750 18 22 41 8 4 12 1 Finland 678 538 1216 36 9 45 6 6 12 1 1 2 France 15552 10569 26121 447 155 602 109 87 196 5 10 16 Germany 14341 8984 23326 612 132 744 116 62 177 4 5 9 Greece 1226 1045 2271 93 45 137 18 24 42 1 2 3 Ireland 493 363 856 24 7 31 6 3 10 Italy 36712 41591 78303 842 737 1579 312 301 613 28 44 72 Luxemburg 593 4 597 1 1 Netherlands 3221 658 3879 141 14 155 19 6 26 1 2 3 Portugal 4321 3664 7985 321 110 431 96 131 227 4 9 14 Spain 9384 5891 15275 324 105 429 113 124 237 10 15 25 Sweden 1117 314 1430 32 3 35 11 3 14 2 1 3 United Kingdom 12739 7458 20198 267 118 385 120 77 198 5 5 10 EU 115600 88083 203683 3509 1525 5034 1092 980 2072 70 107 177 Source: European Commission (2003)
Table A.2. Characteristics of the Textiles and Clothing Industry of the NMS by country, 2002
Textile Clothing
Production Employment (in thousands) Production Employment (in
thousands)
€ Million % of manuf. persons
% of manuf. € Million
% of manuf. persons
% of manuf.
Cyprus 36 1.2 1.0** 2.6 82 2.8 2.5** 6.6 Czech Rep. 1.877 3.3 64.7 6.2 693 1.2 50.5 4.9 Estonia 227* 6.8* 10.5* 8.7* 150* 4.5* 13.1* 10.9* Hungary 619 1.3 28.5 3.8 879 1.9 60.3 8.1 Latvia 171* 5.2* 10.2* 6.9* 112* 3.4* 13.8* 9.4* Lithuania 405* 6.4* 21.8* 9.4* 567* 8.9* 38.0* 16.3* Malta 52 2 0.8* 2.3 143 5.5 2.8* 8.7 Poland 2.226 2 80.3 3.6 2.355 2.1 171.6 7.8 Slovak Rep. 253 1.5 19.4* 5.1 220 1.3 30.2* 7.9 Slovenia 604 4.4 13.8 6 215 1.6 14.5 6.3 Bulgaria 342 4 32.1* 5.8 568 6.7 118.7* 21.3 Romania 743 2.3 84.5 5.5 1.523 4.8 274.2 17.9 NMS 6.47 2.4 250.8 4.8 5.416 2 397.3 7.7 NMS & CC 7.555 2.5 367.4 5.1 5.984 2.5 790.2 10.9 * (2001), ** (2000) Source: CEPS/WIIW (2005)
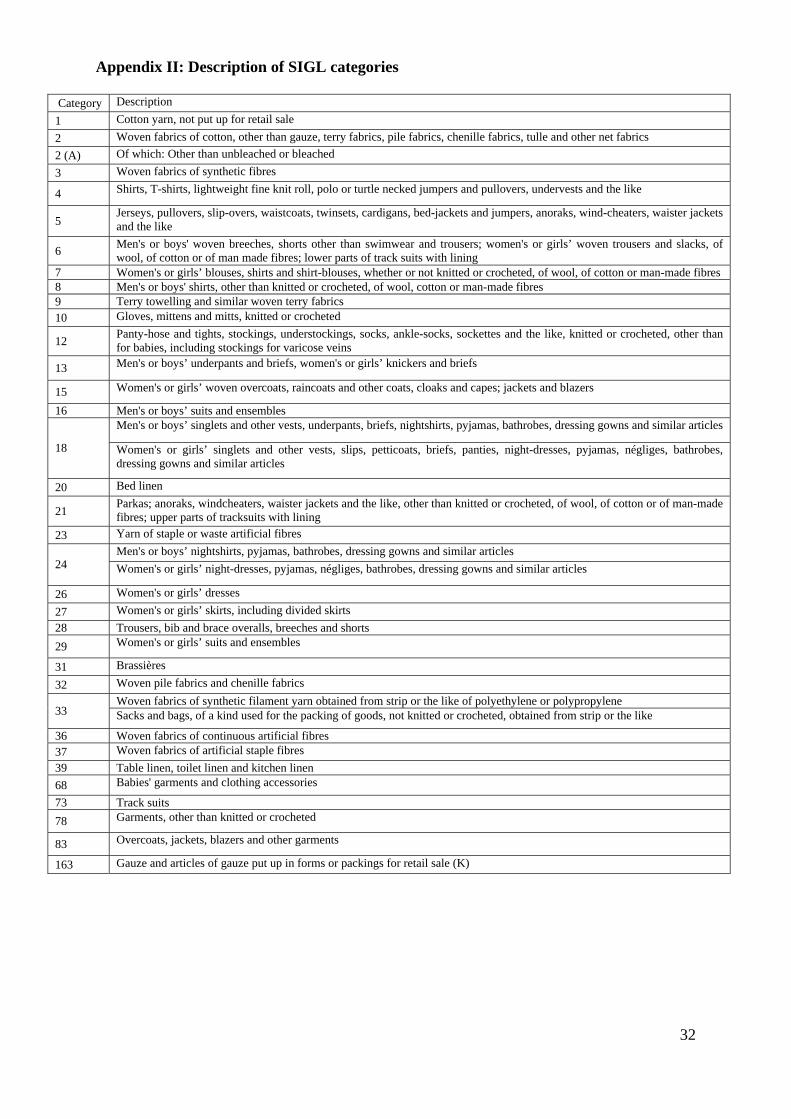
32
Appendix II: Description of SIGL categories
Category Description 1 Cotton yarn, not put up for retail sale 2 Woven fabrics of cotton, other than gauze, terry fabrics, pile fabrics, chenille fabrics, tulle and other net fabrics 2 (A) Of which: Other than unbleached or bleached 3 Woven fabrics of synthetic fibres
4 Shirts, T-shirts, lightweight fine knit roll, polo or turtle necked jumpers and pullovers, undervests and the like
5 Jerseys, pullovers, slip-overs, waistcoats, twinsets, cardigans, bed-jackets and jumpers, anoraks, wind-cheaters, waister jackets and the like
6 Men's or boys' woven breeches, shorts other than swimwear and trousers; women's or girls’ woven trousers and slacks, of wool, of cotton or of man made fibres; lower parts of track suits with lining
7 Women's or girls’ blouses, shirts and shirt-blouses, whether or not knitted or crocheted, of wool, of cotton or man-made fibres 8 Men's or boys' shirts, other than knitted or crocheted, of wool, cotton or man-made fibres 9 Terry towelling and similar woven terry fabrics 10 Gloves, mittens and mitts, knitted or crocheted
12 Panty-hose and tights, stockings, understockings, socks, ankle-socks, sockettes and the like, knitted or crocheted, other than for babies, including stockings for varicose veins
13 Men's or boys’ underpants and briefs, women's or girls’ knickers and briefs
15 Women's or girls’ woven overcoats, raincoats and other coats, cloaks and capes; jackets and blazers
16 Men's or boys’ suits and ensembles Men's or boys’ singlets and other vests, underpants, briefs, nightshirts, pyjamas, bathrobes, dressing gowns and similar articles
18 Women's or girls’ singlets and other vests, slips, petticoats, briefs, panties, night-dresses, pyjamas, négliges, bathrobes, dressing gowns and similar articles
20 Bed linen
21 Parkas; anoraks, windcheaters, waister jackets and the like, other than knitted or crocheted, of wool, of cotton or of man-made fibres; upper parts of tracksuits with lining
23 Yarn of staple or waste artificial fibres Men's or boys’ nightshirts, pyjamas, bathrobes, dressing gowns and similar articles
24 Women's or girls’ night-dresses, pyjamas, négliges, bathrobes, dressing gowns and similar articles
26 Women's or girls’ dresses 27 Women's or girls’ skirts, including divided skirts 28 Trousers, bib and brace overalls, breeches and shorts 29 Women's or girls’ suits and ensembles
31 Brassières 32 Woven pile fabrics and chenille fabrics
Woven fabrics of synthetic filament yarn obtained from strip or the like of polyethylene or polypropylene 33 Sacks and bags, of a kind used for the packing of goods, not knitted or crocheted, obtained from strip or the like
36 Woven fabrics of continuous artificial fibres 37 Woven fabrics of artificial staple fibres 39 Table linen, toilet linen and kitchen linen 68 Babies' garments and clothing accessories
73 Track suits 78 Garments, other than knitted or crocheted
83 Overcoats, jackets, blazers and other garments
163 Gauze and articles of gauze put up in forms or packings for retail sale (K)

Appendix III. The Finger-Kreinin Index As a measure of similarity between exports we apply the Finger and Kreinin (FK) Index. It measures the degree to which export patterns of two countries overlap, and is defined as follows:
( ) 100*iw,iw = cSn
ibcacab ∑
=1)()(Min)(
where Sab(c) is the similarity index of the exports patterns of two countries, a and b, to a third country, c. wac(i) represents the share of commodity i in total exports of country a to country c. Correspondingly, wbc(i) represents the share of commodity i in total exports of country b to country c. The FK index is the sum over the i commodities, of the smaller of the two values wac(i) and wbc(i). Note, that if countries are treated as a group (e.g. the EU) a and c may represent the same country group (intra-EU exports). Using the index we can thus analyse to what extent countries are direct competitors. Under the assumption that a country’s export structure allows us to infer the structure of the domestic industry, we can draw possible qualitative conclusions of the quota removal (e.g. a high similarity of Chinese and Turkish exports to the EU would suggest that upon quota removal, Turkish producers would be negatively affected, as they currently do not face quotas – unlike Chinese producers).
33