personality over time: methodological approaches to...
TRANSCRIPT

Personality Over Time: Methodological
Approaches to the Study of Short-Term and
Long-Term Development and Change
Jeremy C. Biesanz
University of Wisconsin-Madison
Stephen G. West
Oi-Man Kwok
Arizona State University
ABSTRACT Although theories of personality emphasize the integra-tive, enduring, and dynamic nature of personality, the current modalresearch design in personality ignores the dimension of time. We considera variety of recent methods of longitudinal data analysis to examine bothshort-term and long-term development and change in personality,including mean-level analyses both across and within individuals acrosstime, variance structures across time, and cycles and dynamic modelsacross time. These different longitudinal analyses can address classic aswell as new questions in the study of personality and its development. Wediscuss the linkages among different longitudinal analyses, measurementissues in temporal data, the spacing of assessments, and the levels ofgeneralization and potential insights afforded by different longitudinalanalyses.
Correspondence should be addressed to Jeremy C. Biesanz, Department of
Psychology, University of Wisconsin–Madison, 1202 West Johnson Street, Madison,
WI 53706-1696. E-mail: [email protected].
Jeremy C. Biesanz, Department of Psychology, University of Wisconsin—Madison,
Stephen G. West, Department of Psychology, Arizona State University, and Oi-Man
Kwok, Department of Psychology, Arizona State University.
We thank Avshalom Caspi, William Graziano, John Nesselroade, Daniel Ozer, and
three anonymous reviewers for their valuable comments on an earlier version of this
manuscript.
Journal of Personality 71:6, December 2003.
Blackwell Publishing 2003

The broad and influential theories of personality by Allport (1937),
Lewin (1935), and Murray (1938) all emphasize the integrative,distinctive, enduring, and dynamic nature of personality. To under-
stand these aspects of personality requires considering and examiningpersonality across time. Personality develops and changes both in the
long term as a function of maturational processes and in the shortterm, often as a function of major life events or life transitions.
However, the great majority of personality research has remainedfocused on measures collected at a single point in time. For instance,
among the 189 articles published in the 2000 and 2001 volumes ofthe Journal of Personality and the Journal of Personality andSocial Psychology: Personality Processes and Individual Differences,
143 (75.7%) examined personality measures at only one time point.Of note, only 31 articles (16.4%) collected three or more assessments.
These trends continue despite the development of new methodssuch as experience sampling, daily dairies, and on-line behavioral
sampling that potentially offer rich information about personalityfunctioning in the short run and the increasing number of longer term
studies in such areas as clinical, developmental, health, and preventionpsychology.
The area of longitudinal data analysis has experienced an
explosive growth during the past two decades. Many new techniqueshave been developed and tried out on longitudinal data sets in a
variety of substantive areas. However, many of the newer long-itudinal analyses that can potentially contribute to our under-
standing of the enduring and dynamic nature of personality require,at the very least, multiple assessments (Boker, Xu, Rotondo, &
King, 2002; West & Hepworth, 1991; Willett, Singer, & Martin,1998). Although the great majority of studies of personality over
time simply continue to report simple correlational or regressionanalyses of data collected at two time points, it is clear that there isincreasing interest in understanding personality across time. Recent
edited volumes and journal special issues have been devoted toconsidering fundamental questions about the temporal aspects of
personality such as the stability and coherence of personality (e.g.,Baumeister, 2001; Cervone & Shoda, 1999; Heatherton &Weinberger,
1994; West & Graziano, 1989; the present volume).The purpose of this article is to present several methods for
longitudinal data analysis that may be used or adapted to examinesome classic and new questions that arise in the study of personality
906 Biesanz et al.

and its development and change over time. Because of space
limitations, we limit our presentation to methods that are appro-priate for quantitative data. Longitudinal categorical data analysis
has also seen great advances (e.g., Collins, Hyatt, & Graham, 2000;Von Eye & Clogg, 1996), but such data are much less commonly
collected by personality researchers. Some of the examples we reportdo not utilize core personality variables but rather other variables
such as abilities that have been the focus of the initial application ofthese new techniques.
To provide a framework with which to conceptualize the diverseapproaches to personality data, we first review personality’s four-dimensional data box (Ozer, 1986). Second, to this point, personality
researchers have relied heavily on correlation, multiple regression,and structural equation modeling (see Roberts & DelVecchio, 2000
for an excellent summary of this work). We introduce alternatives tothe traditional analysis of correlational structures that appear to
hold promise for thinking about and analyzing the data ofpersonality. These approaches include mean structures across time,
both across individuals and within individuals, variance structuresover time, and cyclical and dynamic models across time. Third, wediscuss contrasts among these methodological approaches in
understanding of the nature of personality. Finally, we discusssome measurement and timing issues that can arise in exploring the
stability and coherence of personality. Data over time has thepotential to greatly increase our ability to answer questions about
personality, but it also involves more complex analyses.
Examining Personality: The Four Dimensional
Data Box
How should we think about the data of personality? A framework
that provides a useful starting point is Ozer’s (1986) simplification ofCattell’s (1966a) data box. In this approach, data are potentiallyorganized in terms of four dimensions: persons, situations, responses
(measures or constructs), and time. Figure 1 provides an illustrationof the full data box with two persons, two situations, four responses,
and four time points. Ozer has been one of the few theorists toexplicitly examine and argue for these four dimensions (see also
West, in press), but many other theorists and researchers haveimplicitly examined these four dimensions within their own research
Personality Over Time 907

(e.g., Bem, 1983; Epstein, 1980; Kelley, 1973; Shoda, Mischel, &
Wright, 1994; Snyder, 1983).As noted by Ozer (1986), the data box need not always be used in
its full form, but rather can be further simplified and adapted to
answer the specific questions raised by the researcher. As oneillustration, Runyan (1983), drawing on earlier work by Kluckhohn
and Murray (1953), noted that personality psychologists may seekany of three different levels of generalization with respect to the
persons dimension.
1. Characteristics that are true of all people (general humantendencies). In this case, the persons dimension is of little
interest and the data will be aggregated over this dimension.Any variability that is found between persons is ignored or is
ascribed to measurement error.2. Characteristics that are true of some people (individual
differences). In this case, the persons dimension is of centralinterest. Variability between persons is deemed to represent
meaningful differences between people.3. Characteristics that are true of a single individual. In this case,
each individual is of interest and the layer of the data boxcorresponding to that person will be sliced off and analyzedseparately in a within-person analysis.
R1
R2
R3
R4
Person 1
S1
S2
T1 T2 T3 T4
R1
R2
R3
R4
Person 2
S1
S2
T1 T2 T3 T4
Figure1The conceptual data box of personality comprising two persons, twosituations (S), four measures or constructs (R), and four time points (T).
908 Biesanz et al.

Consideration of the data box helps us understand the nature of
the data required to address these questions of appropriategeneralization. The difference between (1) and (2) hinges on the
conflicting interpretations of variability between persons as beingerror variance versus meaningful individual differences. These
interpretations can not be adequately addressed in a cross-sectionalstudy as distinguishing between them will require repeated
measurements over time. Further, the difference between (2) and(3) concerning the degree of uniqueness of individuals arises in the
contrasting perspectives of nomothetic versus idiographic approachesto personality (Allport, 1937; Lamiell, 1997; Magnusson &Torestad, 1993; West, 1983; Winter & Barenbaum, 1999). Once
again, the data box helps to clarify that extensive measurements overtime and across persons will be necessary to differentiate between
these two perspectives on generalization.Consideration of the data box also encourages us to think about
different types of data summaries that might be useful to personalityresearchers in describing behavior. Traditionally, researchers have
focused almost exclusively on correlational structure, correlating thebehavior of participants on two measures, in two situations, or attwo time points. Such correlations inform us about the rank order
consistency of the individuals on the measures, across situations, orover time. These correlations inform us about some important
questions facing personality researchers. However, other comple-mentary approaches allow us to address many other important
questions that have historically been neglected by personalityresearchers. Many of these questions are related to the level (mean
structure) and variability of personality constructs over time. Forexample:
1. How does the level of each personality construct (e.g., the Big
Five personality traits; moods) change over time as people age?Are there individual differences in these changes?
2. Do people’s profile across constructs (e.g., the Big Five)change over time? Are there individual differences in the
pattern of these changes?3. How variable is behavior over time? Are individual differ-
ences in the variability in how personality is expressedover time and across situations related to other importantoutcomes?
Personality Over Time 909

4. Are there meaningful and important rhythms (e.g., weekly
mood cycles) in how personality is expressed across time?
In general, the first two questions focus on long-term development,and the last two relate to short-term development. We examine how
these and other questions may be addressed, focusing on severalrecent methodological advances that appear to hold promise for
personality researchers. We also examine some of the design,measurement, and conceptual issues that may arise when theseapproaches are applied to the study of personality over time.
Questions of Mean Structure and Variability of Personality
Constructs
Mean changes across individuals: Individuals across time (Question 1)
One aspect of personality that is lost when viewed through the lensof correlational analysis is mean structure. For example, how does
the mean level of a personality construct change in the populationover the life course? Advances in quantitative methodology (e.g.,
Mehta & West, 2000; Meredith & Tisak, 1990; Raudenbush & Bryk,2002; Rogosa & Willett, 1985; Tisak & Tisak, 2000; Willett & Sayer,
1994) now provide flexible frameworks to address many corequestions about personality and its growth and development. Weconsider four approaches to examining questions of mean-level
changes across individuals: cross-sectional, longitudinal, acceleratedlongitudinal, and discontinuous designs.
Cross-sectional designs. One approach to assessing the first
question is through a large cross-sectional study taking advantageof the natural variation in age across participants. A particularly
good example of this approach is provided by studies by McCraeand Costa (1990) and McCrae et al. (1999) who examined mean
levels of the Big Five (Agreeableness, Extroversion, Neuroticism,Conscientiousness, and Openness to Experience) across the adultlifespan using the NEO measure. Using data collected in the United
States with the NEO-PI inventory, the results showed that theperiod from college age (18–21) to middle adulthood (40–49) and
older (501) was associated with declines in Neuroticism, Extraver-sion, and Openness as well as increases in Agreeableness and
Conscientiousness. This cross-sectional analysis of mean levels ofpersonality suggests that these systematic personality changes are a
910 Biesanz et al.
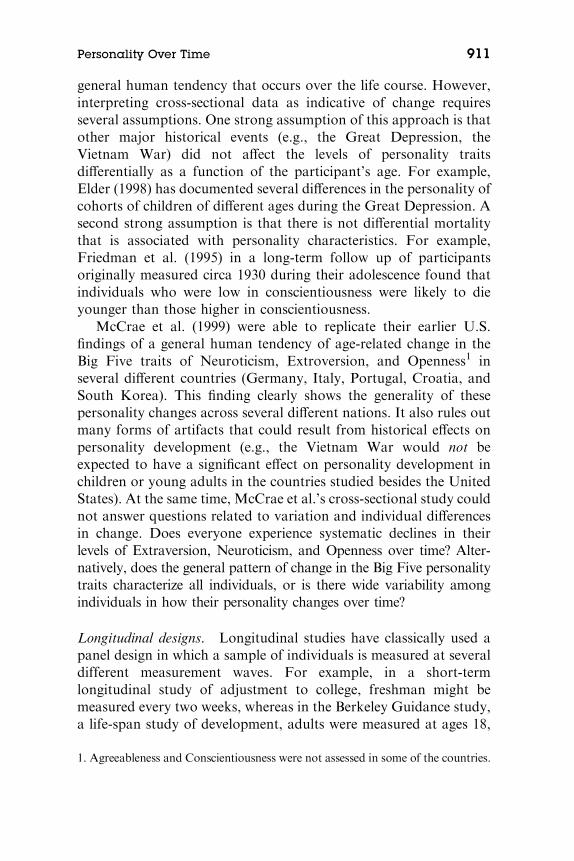
general human tendency that occurs over the life course. However,
interpreting cross-sectional data as indicative of change requiresseveral assumptions. One strong assumption of this approach is that
other major historical events (e.g., the Great Depression, theVietnam War) did not affect the levels of personality traits
differentially as a function of the participant’s age. For example,Elder (1998) has documented several differences in the personality of
cohorts of children of different ages during the Great Depression. Asecond strong assumption is that there is not differential mortality
that is associated with personality characteristics. For example,Friedman et al. (1995) in a long-term follow up of participantsoriginally measured circa 1930 during their adolescence found that
individuals who were low in conscientiousness were likely to dieyounger than those higher in conscientiousness.
McCrae et al. (1999) were able to replicate their earlier U.S.findings of a general human tendency of age-related change in the
Big Five traits of Neuroticism, Extroversion, and Openness1 inseveral different countries (Germany, Italy, Portugal, Croatia, and
South Korea). This finding clearly shows the generality of thesepersonality changes across several different nations. It also rules outmany forms of artifacts that could result from historical effects on
personality development (e.g., the Vietnam War would not beexpected to have a significant effect on personality development in
children or young adults in the countries studied besides the UnitedStates). At the same time, McCrae et al.’s cross-sectional study could
not answer questions related to variation and individual differencesin change. Does everyone experience systematic declines in their
levels of Extraversion, Neuroticism, and Openness over time? Alter-natively, does the general pattern of change in the Big Five personality
traits characterize all individuals, or is there wide variability amongindividuals in how their personality changes over time?
Longitudinal designs. Longitudinal studies have classically used apanel design in which a sample of individuals is measured at severaldifferent measurement waves. For example, in a short-term
longitudinal study of adjustment to college, freshman might bemeasured every two weeks, whereas in the Berkeley Guidance study,
a life-span study of development, adults were measured at ages 18,
1. Agreeableness and Conscientiousness were not assessed in some of the countries.
Personality Over Time 911

30, 40, and 50 years of age. Traditionally, repeated measures
analysis of variance (ANOVA, see e.g., Haan, Millsap, & Hartka,1986; Helson &Wink, 1992) has been used to study the mean level of
personality over age. This repeated measures approach offers fargreater statistical power than would characterize the analysis of
cross–sectional data with the same sample size. However, it does notdirectly address individual differences in change over time, often one
of the primary motivations for longitudinal data collection.When assessments are gathered on the same individuals over
repeated measurement periods, a variety of new models of growthcan used to study individual differences in change. Two closelyrelated approaches, hierarchical linear models (Raudenbush & Bryk,
2002) and latent growth curve models, (Meredith & Tisak, 1990;Willett & Sayer, 1994) can be used to answer questions about
individual differences in change over time. Mehta and West (2000)show that the two approaches produce identical results under most
circumstances and identify a few applications in which one approachmay be preferred.
Jones and Meredith (1996) reported analyses of longitudinal datathat nicely complement McCrae et al.’s (1999) cross-sectional study.Combining data from the Berkeley Guidance and the Oakland
Growth Studies, Jones and Meredith used the latent growth curveapproach to model personality change from age 18 to 60 on
measures of Self-Confidence (lack of neuroticism), CognitiveCommitment (openness), Dependability (conscientiousness), Out-
goingness (extraversion), Warmth (agreeableness), and Assertive-ness. Of importance, the results showed mean-level changes across
the lifespan on average across individuals for each measure—withthe exceptions of assertiveness and warmth. These broad average
trends, however, mask significant individual variability in person-ality change across the lifespan. For instance, the average personbecame more self-confident (less neurotic) over the course of his or
her lifespan, a result that replicates McCrae et al.’s earlier finding.Yet, there were large individual differences between individuals and
between two age-cohorts studied in the pattern of growth.Beyond finding individual variability in data, the new statis-
tical approaches permit examination of several possible explana-tions of growth and change. These potential explanations
are illustrated below with examples of hypotheses that might betested.
912 Biesanz et al.

1. Growth (or decline) may be related to stable background
variables. For example, adults whose parents divorced(dichotomous predictor) or who attended a large number of
religious services (continuous predictor) during their child-hood years may be less likely to show the typical decline in
neuroticism as they age.2. Growth in one series may be related to growth (or decline) in a
second series. For example, the rates of change of neuroticismand extroversion may be related. People who show large
increases in extroversion during their adult years may show acorrespondingly large decrease in neuroticism.
3. Even after the general growth trends in the data of both series
are accounted for, one variable may predict changes in anothervariable (Curran & Bollen, 2001). Such a model would be
particularly appropriate when applied to short-term long-itudinal studies in areas such as the relation of daily stress and
daily mood following a major negative event (e.g., caraccident). Even though stress would be expected to decrease
and positive mood would be expected to increase as time sincethe accident increases, unusually high levels of stress relative toone’s expected level might be expected to have a negative
relationship with the level of positive mood.
Duncan, Duncan, Strycker, Li, and Alpert (1999) and Singerand Willett (in press) present an introduction to these and
other analyses that can potentially account for variability in theseries.
We have illustrated the beauty and power of longitudinal designsby providing examples of the kinds of questions that they are
particularly adept at answering. However, an important downside oftraditional longitudinal studies is waiting for change to occur—42
years in the case of the data analyzed by Jones and Meredith (1996).A second downside is that, classically, many longitudinal studieshave focused on one cohort of individuals, potentially limiting
generalization of findings to a single age group. For example, theparticipants in the Oakland growth study were born in 192071 year.
Fortunately, when data are available as in Jones and Meredith’sstudy, data from different cohorts can be initially tested for cohort
effects and then combined in multiple cohort growth models (Mehta& West, 2000).
Personality Over Time 913
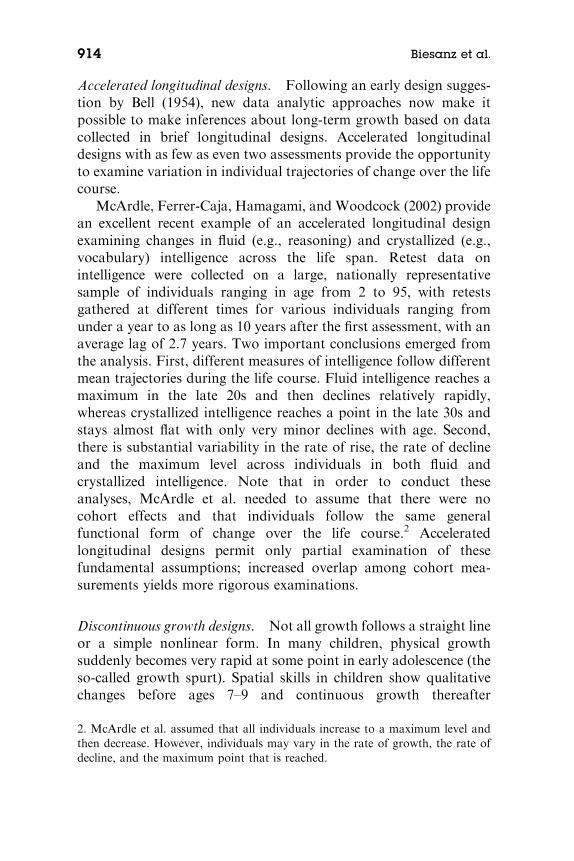
Accelerated longitudinal designs. Following an early design sugges-
tion by Bell (1954), new data analytic approaches now make itpossible to make inferences about long-term growth based on data
collected in brief longitudinal designs. Accelerated longitudinaldesigns with as few as even two assessments provide the opportunity
to examine variation in individual trajectories of change over the lifecourse.
McArdle, Ferrer-Caja, Hamagami, and Woodcock (2002) providean excellent recent example of an accelerated longitudinal design
examining changes in fluid (e.g., reasoning) and crystallized (e.g.,vocabulary) intelligence across the life span. Retest data onintelligence were collected on a large, nationally representative
sample of individuals ranging in age from 2 to 95, with retestsgathered at different times for various individuals ranging from
under a year to as long as 10 years after the first assessment, with anaverage lag of 2.7 years. Two important conclusions emerged from
the analysis. First, different measures of intelligence follow differentmean trajectories during the life course. Fluid intelligence reaches a
maximum in the late 20s and then declines relatively rapidly,whereas crystallized intelligence reaches a point in the late 30s andstays almost flat with only very minor declines with age. Second,
there is substantial variability in the rate of rise, the rate of declineand the maximum level across individuals in both fluid and
crystallized intelligence. Note that in order to conduct theseanalyses, McArdle et al. needed to assume that there were no
cohort effects and that individuals follow the same generalfunctional form of change over the life course.2 Accelerated
longitudinal designs permit only partial examination of thesefundamental assumptions; increased overlap among cohort mea-
surements yields more rigorous examinations.
Discontinuous growth designs. Not all growth follows a straight line
or a simple nonlinear form. In many children, physical growthsuddenly becomes very rapid at some point in early adolescence (the
so-called growth spurt). Spatial skills in children show qualitativechanges before ages 7–9 and continuous growth thereafter
2. McArdle et al. assumed that all individuals increase to a maximum level and
then decrease. However, individuals may vary in the rate of growth, the rate of
decline, and the maximum point that is reached.
914 Biesanz et al.

(Pellegrino & Kail, 1982). In the elderly, sudden rapid declines in
cognitive functioning just before death are not uncommon. Sometheorists like Piaget have models that can be interpreted as
DV
Age
Mean
1
3
2
A. Abrupt shift in growth rates but not mean level at a common age.
DV
Age
Mean
13
2
B. Abrupt shift in both growth rates and mean levels at a common age.
DV
Age
Mean
1
3
2
C. Abrupt shift in growth rates at varying ages.
Figure2Illustration of possible discontinuities in growth rates and mean
levels as a function of age.
Personality Over Time 915

proposing not only a striking change in the rate of growth but also
an abrupt discontinuous shift in level as a child passes from onestage of development into another. These discontinuities in both the
rate and level of growth can be represented using piecewise growthmodels (Cudeck, 1996; Cudeck & Klebe, 2002). Each segment of the
growth process can be represented in the form of a simple linear ornonlinear trajectory with the two segments (a) joined at a point
termed a knot if there is only an abrupt shift in the rate of growth or(b) separated at the point of change if there is both an abrupt shift in
the level or form of growth or decline. Illustrations of these twotypes of piecewise growth are illustrated in the first two panels ofFigure 2.
An important consideration in the application of these models iswhether the point at which the growth process should change is
clearly known. For example, the rate of increase in the developmentof reading skills or peer interaction skills might be hypothesized to
shift abruptly at the point of initial entrance to school. As well,personality studies initiated before 9/11/01 could examine potential
discontinuities on constructs such as relationship measures asso-ciated with that historic event. In contrast, the point of onset of theadolescent growth spurt or the point of the hypothesized shift from
concrete to formal operations in thinking will vary across childrenand will not be known in advance. Both cases may be accom-
modated: The point of transition may be a fixed point, or it mayvary across participants and be estimated from the data. The third
panel of Figure 2 illustrates this latter case. When the transitionpoint varies across participants, it may potentially be predicted from
other characteristics of the participant. Such piecewise models offeran important tool to understand development in which both
qualitative and quantitative changes occur.
Mean changes within individuals: Profiles across time (Question 2)A second research tradition in personality has been to focus oncoherence—within-person consistency—and to use persons as the
central unit of analysis (Caspi & Bem, 1990). This person-centeredresearch approach focuses on the organization and temporal
stability of attributes within single individuals (Magnusson &Torestad, 1993). One notable and influential exemplar is Block’s
(1971) Lives Through Time, which explicitly examined person-centered coherence. Block correlated a set of attributes within a
916 Biesanz et al.

person over time (i.e., Q-correlation; see Stephenson, 1952), yielding
an index of the consistency/coherence of the set of attributes.Individuals’ Q-sorts, determined by judges, showed considerable
Q-correlational stability from childhood to young adulthood (seealso Ozer & Gjerde, 1989). Estimates of the temporal stability
of a set of attributes within an individual have demonstratedsubstantial coherence within individuals across diverse contexts
(e.g., Biesanz & West, 2000; Colvin, 1993; Shoda, Mischel, &Wright, 1994).
Yet correlational studies of coherence ignore all informationabout level (mean structure). Embedded within the level data are thepotential answers to such questions as Do certain constructs within
individuals change more than others over time? For example, what isthe profile of change of the facets of the Big Five personality traits as
people age or experience important life transitions? To address thisquestion, Nasby and Read (1997) sought to determine the potential
change in Dodge Morgan’s profile on the Jackson PRF and onfacets of the Big Five measures of personality as a function of
Morgan’s solo circumnavigation of the world in a sailboat. We areunaware of empirical or methodological papers comparing trajec-tories of the profile of personality attributes, but adapting latent
growth curve models to this purpose is straightforward.To more clearly illustrate this approach, consider a set of
attributes within an individual such as trait adjectives that areassessed over time. Each assessment provides a snapshot of the
organization and patterning of the set of attributes at a single timepoint within that individual. However, when examined across time,
we can ask whether the patterning of the set of attributes is stable orwhether there exists meaningful change in the patterning of the
assessed attributes across time. Figure 3 presents a hypotheticalexample of the trajectories among attributes within an individual.Note that such an analysis shifts the focus of the data analysis from
the person measured on a specific construct, as in standard latentgrowth curve models, to the construct measured within a single
individual.To illustrate, we present an analysis of data from a single 21-year-
old female undergraduate who self-reported her level on 59 traitadjectives selected from Goldberg (1992) (for details of the data
collection procedures, see Biesanz & West, 2000; Biesanz, West, &Graziano, 1998). The first assessment was in the middle of the fall
Personality Over Time 917
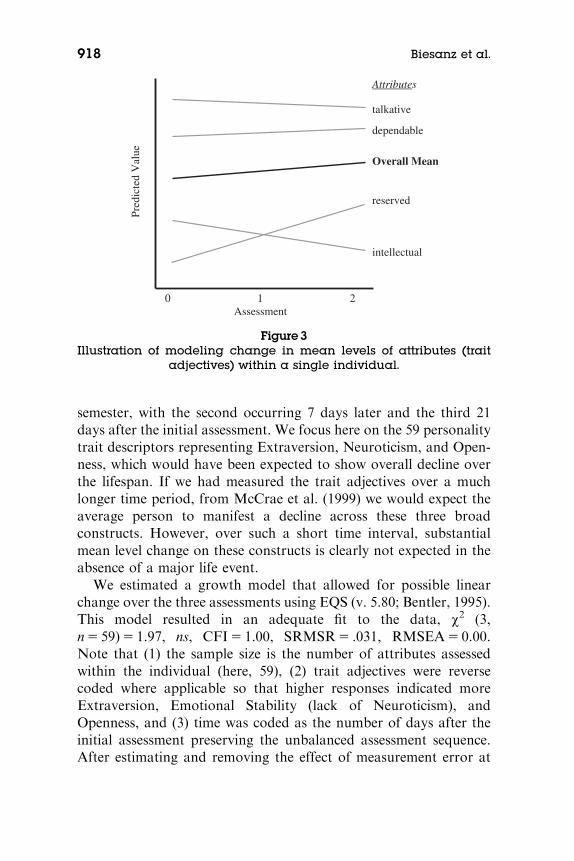
semester, with the second occurring 7 days later and the third 21days after the initial assessment. We focus here on the 59 personality
trait descriptors representing Extraversion, Neuroticism, and Open-ness, which would have been expected to show overall decline over
the lifespan. If we had measured the trait adjectives over a muchlonger time period, from McCrae et al. (1999) we would expect the
average person to manifest a decline across these three broadconstructs. However, over such a short time interval, substantial
mean level change on these constructs is clearly not expected in theabsence of a major life event.
We estimated a growth model that allowed for possible linearchange over the three assessments using EQS (v. 5.80; Bentler, 1995).This model resulted in an adequate fit to the data, w2 (3,
n5 59)5 1.97, ns, CFI5 1.00, SRMSR5 .031, RMSEA5 0.00.Note that (1) the sample size is the number of attributes assessed
within the individual (here, 59), (2) trait adjectives were reversecoded where applicable so that higher responses indicated more
Extraversion, Emotional Stability (lack of Neuroticism), andOpenness, and (3) time was coded as the number of days after the
initial assessment preserving the unbalanced assessment sequence.After estimating and removing the effect of measurement error at
0 1 2 Assessment
Pred
icte
d V
alue
talkative
dependable
Overall Mean
reserved
intellectual
Attributes
Figure3Illustration of modeling change in mean levels of attributes (trait
adjectives) within a single individual.
918 Biesanz et al.

each assessment—constrained to be equal across the three assess-
ments—we found that the mean level ðmminitialÞ was 4.41 on a 0(extremely inaccurate) to 8 (extremely accurate) scale across the 59
trait adjectives at the initial assessment and that there was significantvariability across the level of attributes at the initial assessment,
ss2initial ¼ 1:83; po:001. This estimate reflects the variance across thetrait adjectives at the first assessment after removing assessment-
specific effects. This variance estimate reflects both variance amongtrait adjectives—which are all coded in the more socially desirable
direction—and mean-level differences across the three broad traitsof Extraversion, Emotional Stability, and Openness for thisparticular individual.
Of more importance, there was no significant linear mean changeacross assessments, mmslope ¼ 0:005, ns, and no significant variability
in the slopes of the 59 trait adjectives over time, ss2slope ¼ 0:0002, ns.The lack of significant variance in the slopes of the trait adjectives
indicates that there was no differential change in the profile of theratings over time on the set of trait adjectives. Similar findings were
also obtained with data from the six other individuals from thesample who were studied. These nonsignificant results presumablystemmed from the very short time intervals between assessment
periods so that little reliable change in profiles would be expected tooccur.
The interpretation of profile analyses depends very strongly on theattributes that are selected and measured. If the selected attributes are
expected to be changing in the same downward direction, then thedata for the average person should show a negative mean downward
trend over a sufficiently long period of time. This was the rationale forour selection of trait adjectives in the present example. In the absence
of such specific selection of attributes, the overall mean trend would ingeneral not be predictable. More complex nonlinear forms of changeover time could also potentially be examined if more than three
measurement waves are included.Of particular importance in such analyses are measures of
variance across attributes in the trend components (slopes). Highcoherence implies that the variance should be low, whereas low
coherence implies that variance should be high because eachattribute is changing at a different rate over time. Given that
variance of the trend components becomes the key indicator ofcoherence, researchers are encouraged to sample personality
Personality Over Time 919

attributes broadly within their domain of interest. For example,
using a random sample or stratified random sample of personalitytrait adjectives may produce a better understanding of changes in
general coherence over time than the use of Goldberg’s (1992) traitadjectives, each of which is focused primarily on a single dimension
of the Big Five.To this point, we have emphasized that these analyses should be
conducted on a single individual. However, the same analysis can beconducted separately on each individual in the sample and the
resulting mean and variance of the rate of change of the attributescomputed. The results for each person in the sample can be comparedand summarized through meta-analytic procedures (see Busk &
Serlin, 1992 and West & Hepworth, 1991 for meta-analyticapproaches to single cases; see Adams, Gurevitch, & Rosenberg,
1997 for meta-analysis of variances). Additional questions can also beraised. For example, if variances of the rate of change differ across
individuals, are there stable individual differences (e.g., gender) thatpredict these differences in the variance of the rate of change?
Such analyses offer the promise of providing an important newperspective on coherence, but they come at a cost. They place aheavy burden on our current measures of personality attributes. An
important underlying assumption of these analyses is that eachattribute is measured on the same interval level scale of measure-
ment. Measures of physical growth (e.g., length of fingers, toes,arms, trunk, etc.) clearly meet this assumption so that studies of the
coherence of physical growth could currently be conducted.However, our typical measures of trait adjectives, moods, and other
personality measures have not been shown to meet this assumption.Careful measurement work (e.g., perhaps using IRT approaches)
will be necessary for the optimal application of these procedures.
Variance structures across time (Question 3)
Correlational analysis may overlook another important componentof personality data collected over time. Conceptually, the mean
structure of the data can be considered to be independent of thevariance structure.3 If repeated measures are collected over time on
3. Technically, this is true in many statistical distributions, but not all. The
independence of means and variances characterizes the normal distribution,
which underlies the statistical models presented here. In some other statistical
920 Biesanz et al.

the same set of individuals, each person may differ in the amount of
variability he or she displays on personality constructs such as atrait, self-concept, or mood. Returning to the data box, this
intraindividual variability may reflect in part the aggregation ofdata over situations. For example, individuals high in extraversion
may enter a much wider variety of social situations than theirintroverted peers (Diener, Larsen, & Emmons, 1984). In this case,
variability in personality attributes over time can be considered toreflect, in part, variability in the situational choices that each person
makes. However, we can also slice off a single situation from thedata box and study variability over time within the single situation.Even when the role of the situation is controlled, different
individuals may display different levels of variability over time.Fiske and Rice (1955) provide an extensive review of support for
individual differences in stable intraindividual variability overtimeacross many different domains of behavior including physical motor
skills (Allport & Vernon, 1933), heart rate (Herrington, 1942), andspelling nonsense syllables (Thorndike, 1931). Many early person-
ality theorists and researchers hypothesized that such variabilityrepresents important individual differences (Cattell, 1966b; Dodge,1924; Murray, 1938).
More recently, researchers have moved from simply documentingthese stable individual differences in intraindividual variability and
have begun to explore its structure and predictive validity. To citetwo examples, Eizenman, Nesselroade, Featherman, and Rowe
(1997) collected daily measures of locus of control in an elderlypopulation. The amount of within-person variability predicted
mortality five years later. Butler, Hokanson, and Flynn (1994)measured self-esteem on a daily basis and computed measures of the
mean and variability of self-esteem. They found that the variabilitywas far better than the mean level in predicting proneness todepression. Other examples of using intraindividual variability of
measures to predict important outcomes can be found in studies byKernis, Grannemann, and Barclay (1989, 1992) for excuse making
and tendency to experience anger and hostility, Chen, Aggen,Nesselroade, and Baltes (2001) for memory, and Lang, Nesselroade
and Featherman (1997) for perceptions of social self-efficacy and
distributions, there is a relationship between the mean and variance (e.g., the
binomial distribution used to model dichotomous data).
Personality Over Time 921

relationship availability. Given the relative paucity of research to
date, our understanding of intraindividual variability remains muchless complete than that of correlational structures. For example,
does variability on one construct relate to variability on a secondconstruct? More generally, are there structures across individuals in
terms of intraindividual variability over different domains? How dothese structures compare to the more familiar structures based on
correlational data such as the Big Five? As the research to dateindicates, intraindividual variability in personality may be of
particular importance to our understanding of the self.Two difficulties have hindered progress towards answering
questions about intraindividual variability over time. First, gather-
ing estimates of intraindividual variability requires more intensiveand expensive data collection procedures. Second, estimates of vari-
ability are less reliable than mean estimates, meaning that moremeasurements will need to be collected to get precise estimates of
intraindividual variability. In large samples, the standard error ofthe mean is s=
ffiffiffi
np
, whereas the standard error of the variance is
approximately 1.4s2=ffiffiffi
np
(Kendall & Stewart, 1977) where n is thenumber of assessments of a person. The recent development ofbeeper, diary, and other methods of event sampling for measuring
personality attributes on a within-day, daily, or weekly basis hasgreatly increased the availability of such data and has helped
overcome these difficulties. Examination of within-subject varia-bility can now serve as a useful complement to examination of
correlational and mean structures.
Cycles and dynamic models across time (Question 4)Although raw variability in behavior across time within a given
domain appears to be a stable individual difference and is linked toimportant outcomes, it can also be fruitful to attempt to model and
understand the origins and patterning of regular changes acrosstime. Human activity tends to follow daily, weekly, monthly, andyearly patterns (cycles), and these cycles may be associated with
important personality-related processes. To cite two examples,Armeli, Carney, Tennen, Affleck, and O’Neil (2000) found in a
community study that daily stress tended to be highest in the middleof the work week, whereas alcohol consumption tended to be highest
on Friday and Saturdays. Anderson and Revelle (1994) foundindividual differences in within-day variation in arousal cycles and
922 Biesanz et al.
that such within-day variation in arousal was related to performance
on cognitive tasks. In terms of the data box, the first finding mayreflect entry into situations (bars, parties) associated with alcohol
consumption on weekends. In contrast, the cycle of daily activationpresumably reflects internal bodily rhythms, and that would be
expected to occur even if the individual remained in the same situation.In one of the most extensive studies of daily cycles, Brown and
Moskowitz (1998) examined daily cycles in interpersonal behavior.Participants completed a form measuring interpersonal agency and
communion (Wiggins, 1991) over the course of 20 days after everysocial interaction that lasted more than 5 minutes. Althoughindividuals manifested substantial relative consistency in their
behavior on both interpersonal agency and communion, there werepredictable patterns in variation of the behavioral reports. Inter-
personal agentic and communal behaviors fit a weekly cyclicalpattern of variation. More interestingly, the amount of within-day
interpersonal behavioral variability was predicted by the trait ofextraversion. Extraverted individuals also engaged in a higher mean
level of social activities than introverted individuals. In turn, this ledto more within-day variability in agentic and communal behaviors.Thus, Brown and Moskowitz (1998) found that the individual-
difference variable of extraversion is related not just to stabledifferences among individuals in their mean levels of behavior, but
also to their variability in behavior over time (see also Biesanz &West, 2000).
Methods of detecting regular cycles in temporal data aredescribed by Larsen (1990) and West and Hepworth (1991).
Of particular value are spectral analyses that determine the period(s)at which consistent fluctuations in the series tend to occur.
Period is defined as 1/time. For example, if data were collected ona daily basis and there were a weekly cycle, a very strongrelationship between the fluctuations in the series would be found
at a period of (1/7 days)5 .142 in the results. Such regularrelationships are easily seen in spectral density plots in the form of
a high spike in the plot at the point corresponding to the cycle (seeWest & Hepworth, 1991, p. 622, Figure 2, for an example). This
approach can be extended to examine the relationships between thecycles in two series, a technique known as cross spectral analysis.
For example, Armeli et al. (2000) find a negative relationshipbetween the weekly stress cycle (highest on Wednesday, lowest on
Personality Over Time 923

Saturday) and the weekly drinking cycle (highest on Saturday,
lowest on Monday). Given that a very large number of observationsover time are collected, as when on-line recording techniques are
used (e.g., speech, movement), irregular cyclic relationships thatcome and go between two series can also be detected through
algorithms that divide the series into segments and search for localrelationships (Boker, Xu, Rotondo, & King, 2002). For example, in
dyadic conversations, there may be segments in which the speech ofone participant is highly related to the nonverbal cues of the second
participant and periods in which speech and nonverbal cues are notclosely coordinated.
Given appreciable differences between individuals in their regular
cycles (e.g., there are large individual differences in daily activitycycles with some people being more active in the morning and others
in the evening), cycles should be modeled separately for eachindividual participant. Typically, at least 50 (preferably 100)
regularly spaced observations are needed for such analyses. Suchcycles can be modeled by using dummy variables or combinations of
sine and cosine functions to represent the cycle (see West & Hepworth,1991). In cases in which the same cycle can be assumed to characterizeeach of the participants in the sample (e.g., a weekly stress cycle that is
common to all participants), multilevel analysis can be used to modelthe cycle with fewer observations per participant, but more
participants. As we will consider in more depth in a later section,the multilevel analysis ‘‘borrows strength’’ from the replication of
the same cycle across participants. Nonetheless, a minimum of twotimes the length of the cycle (e.g., 14 observations for a weekly cycle)
are needed to be able to detect the cycle.One of the more exciting recent methodological developments is
to model change over time and intraindividual variability simulta-neously. A promising start has been provided in the form of a simpledynamic model patterned after a damped linear oscillator. Boker
and Nesselroade (Boker, 2001; Boker, 2002; Boker & Nesselroade,2002) argue eloquently, using simulated data, that it may be possible
to capture and model intraindividual variability with as few as threeassessments per individual. Once again, a trade-off must be made
between being able to model each person separately, which requirescollecting a large number of observations on each individual,
versus assuming a common process that characterizes all indivi-duals, which greatly reduces the number of observations per person.
924 Biesanz et al.

Such models offer the promise of being able to represent dynamic
theoretical processes such as self-regulation. Although the practicalempirical limitations remain to be determined, the clear promise of
such techniques warrants substantial consideration and empiricalinvestigation.
Measurement, Design, and Conceptual Issues in Examining
Time
We now turn to a number of practical and conceptual issues thatmay arise in examining questions of long- and short-term develop-
ment and change. First, we consider measurement issues associatedwith examining personality across time. We then turn to practicalissues associated with gathering data across time. Finally, we explore
several conceptual linkages among different methods for examiningquestions of development and change.
Some measurement issuesMoving beyond correlational analyses to the examination of mean
and variance structures brings to the forefront a number of differentmeasurement issues. What types of data are required to examine
mean and variance structures? How do we provide individualassessments from latent variable models? We consider thesequestions below and discuss several specific measurement issues
that may arise.
The scale of measurement. The use of self-reports and reports of
knowledgeable informants dominate measurement in most areas ofpersonality research. These choices have been supported in much
of the research to date: Self- and other-reports on standard ratingscales often show at least moderate convergence if some aggregation
has taken place, and these reports often predict important real-worldcriteria (Funder & West, 1993). Similarly, informant reports showsubstantial convergence with systematic behavioral observation,
again if aggregation has taken place (Moskowitz & Schwartz, 1982;Moskowitz, 1986). Such measurement choices are well justified when
the focus of the research question is on correlational structure. Asdetailed by Roberts and DelVecchio (2000), a variety of important
questions about the rank order stability of individuals across timehave been answered using these measures. However, when we turn
Personality Over Time 925

to questions about mean and variance structures over time, such
measurement techniques will not always be adequate.Consider the trait ‘‘physically active.’’ If a pedometer or other
measure of physical movement is attached to each participant andphysical activity is measured over a few days, a high correlation will
be obtained between the behavioral measure and self- or informantreports on a standard rating scale of physical activity (e.g., 0 to 10
scale). Suppose these same measurements are taken on a group ofparticipants when they are 30 and again when they are 60 years of
age. At each age, the correlations between the behavioral, self-, andother-reports will be high. In addition, the stability, as representedby the correlation between any of the measures of physical activity
taken at age 30 and any of the measures of physical activity taken atage 60, will be at least moderate in magnitude. Such correlations are
often buttressed by explicit or implicit instructions to raters to ratethe target person in comparison to others of his or her gender and
age. However, the level of each participant on the physical measureof activity is likely to be substantially lower at age 60 than age 30.
Current measurement using self- and informant reports preservesrank order, but not level stability. When we wish to reachconclusions about changes in mean level or variance over time, we
need to be confident that change is in the personality of theparticipant, not in our assessment instrument. Estimating growth
and decline trajectories requires at least an interval level ofmeasurement (Stevens, 1951).
Fiske (1972) in Measuring the Concepts of Personality noted thisproblem and forcefully advocated for the use of behavioral measures
in personality. Unfortunately, the practical limitations of collectingsufficient behavioral data to provide adequately reliable measures of
most personality constructs are too severe. More can be done withthe use of careful observer instructions and the use of carefullyanchored points on the rating scale to improve measurement. It may
also be possible to collect both rating and behavioral measures in arandom subset of the sample and to link the two measures,
preserving the interval level of measurement. Finally, modernmeasurement theory such as item response theory can be used to
construct interval level measurement scales that can be equatedacross age (see Embretson & Reise, 2000). Khoo and West
(in press) review a number of approaches that can help preserveinterval level measurement and avoid the interpretational problems
926 Biesanz et al.

that result from attempting to measure growth with a ‘‘rubber
ruler.’’
Latent variables–Providing estimates for individuals. The power ofrecent advances in quantitative methodology often derives from the
ability to separate the measurement of the construct of interest fromwhat is considered measurement error within the overall model.
The cost is that the construct of interest must be modeled as alatent variable (see Bollen, 2002); we do not have direct measures of
the latent construct (true scores) on such measures as growth,change, variability, or mean levels for specific individuals. However,
in some applications, it may be desirable to estimate how mucheach specific individual changes on a given construct over a periodof time.
As we have seen previously in our discussion of modeling cycles,researchers must once again make a choice between using only data
from a single individual and combining data from the entire group andthe individual. One method to compute factor scores is to use
Bartlett’s (1937) estimate, which considers each individual separatelyand ignores the information available in the mean and variance of
latent scores across individuals. Consequently, Bartlett’s estimates ofthe value of factor scores are unbiased for each individual, but thevariability of these factor score estimates across individuals is greater
than the true latent variability. A second class of approaches (Lindley& Smith, 1972; Tucker, 1971), known as empirical Bayes estimates (or
factor regression estimates), combines information from the model forthe entire sample with information from the individual subject. Such
empirical Bayes factor score estimates are attenuated (‘‘shrunken’’)toward the mean of the sample, and estimates have less variability
than the true latent variability. If the assumptions underlying both theoverall model and for borrowing strength (see Tukey, 1986/1961, p.
277) from other individuals are met, however, predictive accuracy canbe enhanced through the use of empirical Bayes methods. A third classof estimates (McDonald, 1981) attenuates the Bartlett’s estimates just
enough to produce estimates that are as variable as the latentconstruct. Note that these latter two methods, which attenuate
individual scores, may not be appropriate for specific individuals whoare the a priori focus of attention (i.e., Runyan’s (1983) third level of
generalization). Biesanz, Curran, and Bollen (2002) present a detaileddiscussion of factor score estimates and recommendations for when
Personality Over Time 927

each approach should be used, focusing on the context of latent
growth curve models.
Issues associated with timeIncluding time as a feature within a study raises a number of
conceptual and practical issues for the study of personalitydevelopment. We consider several of these issues in turn below.
The number of assessments. Our survey of the 2000–2001 volumes
of the Journal of Personality and Social Psychology and the Journalof Personality showed that when data are collected over time, themodal number of assessments collected across time is still two. This
is insufficient to examine many of the questions raised within thepresent manuscript. For example, estimating the variability in simple
linear change across individuals generally requires at least 3assessments. Four or more assessments are required to model the
form of change over time and to examine predictors of rates ofchange. A bare minimum of 50, and likely substantially more,
observations are needed to model cycles in behavior and relation-ships between cycles in single individuals. These requirements can be
reduced by assuming that a common growth or cyclical processcharacterizes all individuals in the sample, an assumption that mayor may not be reasonable depending on the research context.
The spacing of assessments. Our focus on the number of assess-
ments is immaterial if they are not collected at the right times. Thereare two aspects to this issue. First, in approaches such as latent
growth curve analysis, the use of unequally spaced intervalsprecludes answering some, but not all, questions of possible interest.
From an analytic standpoint, traditional designs, in whichmeasurement waves are equally spaced and data are complete,
permit testing of the widest variety of statistical models, typicallywith the greatest statistical power. On the other hand, if measure-ment waves are not equally spaced, it is more difficult to interpret
analyses in which a measurement in one series predicts ameasurement in a second series at a later point in time (e.g., a
lagged relationship; see Curran & Bollen, 2001). Yet designs withmultiple cohorts that overlap substantially (e.g., cohort 1 is
measured at ages 20, 30, 40, and 50 and cohort 2 is measured atages 30, 40, 50, and 60 so that three measurement ages of 30, 40, and
928 Biesanz et al.

50 overlap) permit strong tests of cohort effects and historical-
normative influences. Nonetheless, new analytic models are versa-tile, and many important questions can be answered even with data
that are not well structured relative to the traditional guidelines. Forexample, measures may be collected at different intervals and at
different ages on each participant (18, 40, 45, 50 for participant 1;20, 30, 40, 50 for participant 2). Data may be missing from one or
more measurement periods4 (e.g., 20, 30, M, 50 for participant 1; 20,M, M, 50 for participant 2, where M indicates data are missing).
Second, the phenomenon of interest must have sufficient time totake place during the full observational period. The profile examplepresented earlier illustrates this problem since all three assessments
were collected within a one month time period. Clearly, not enoughtime had elapsed to capture the expected slow decline in the level of
personality traits. Long intervals between assessments afford thegreatest opportunity to detect all monotonic forms of long-term
growth and decline. On the other hand, when assessments are spacedsubstantially apart in time, a real danger exists of missing important
information about within-person variability, cycles, and othernonmonotonic patterns of change. Consequently, Nesselroade(2000) has proposed combining long-term assessments with short
‘‘bursts’’ of assessments that occur more frequently. The strongbenefits of such data collection designs include the ability to
combine the optimal information about long-term growth withinformation about within-individual variability and cycles and
answer new questions. For example, are individuals who aremore variable over short periods of time more likely to change
meaningfully over longer periods of time? Does an increase inwithin-person variability predict a qualitative change in the rate of
growth?
4. Technically, data are assumed to be missing at random (MAR). MAR means
that attrition may be related to the subject’s level on measured variables, but not
to the participant’s level on the missing outcome variable. For example, in a
sample of alcohol abusers, if participants were more likely to miss measurement
of the amount of alcohol consumption following a heavy binge drinking period,
this would violate MAR, and missing data techniques could yield biased results.
Schafer and Graham (2002) present an extensive introduction to missing data,
and Little and Schenker (1995) discuss special problems of missing data in
longitudinal studies.
Personality Over Time 929

The metric of time. Once assessments are gathered, how should
time be scaled? Typically, age or some other simple metric (e.g.,grade level) is used by default in developmental studies, but there
may be other more fruitful choices for the metric of time, dependingon the specific research question. The two issues are determining (1)
the origin of time and (2) the units of time. Considering first theorigin, age in years sets the origin at birth. However, some
phenomena cannot be measured until later in life. For example, inobservational studies of the development of vocabulary, the first
year of life generally will not yield utterances codable as words byoutside observers for any child in the sample. From the perspectiveof growth modeling, it is far more sensible to set the origin at 12
months and to model the nonlinear increase in children’s vocabularyfrom that point in time (i.e., time5 age in months –12). Alter-
natively, if the focus of the study is on a major life transition (e.g.,recovery from a serious accident; children’s adjustment following the
divorce of their parents), then centering each individual’s origin tocoincide with the transition may be a logical choice. For certain
statistical models such as latent growth curve models, placing eachindividual on the exact same metric with the same age-based orevent-based origin may be necessary to provide unbiased estimates
of some effects of interest (Mehta & West, 2000).The second and more controversial issue is to use alternatives to
the actual spacing in time. For example, von Eye, Kreppner, Spiel,and Weßels (1995) have suggested using the subjective experience of
elapsed time in some research contexts, and Brim and Ryff (1980)have proposed considering time as an ordinal sequence of normative
life events. Such suggestions may offer conceptual advantages if theymore adequately represent the ‘‘true’’ metric of time for each
individual participant. For example, the growth in the new metricmay take a much simpler form (e.g., linear) than in the originalmetric of time. Unfortunately, these alternative metrics may also
introduce complications in interpreting many of the statisticalmodels. While physicists have provided us with a scale of time that
has clear equal interval properties, there is no guarantee that thesubjective measure of time will achieve these same measurement
properties.
Natural confounding of time and situation. One of the challenges ofexamining time as a feature of personality development is that time
930 Biesanz et al.

is naturally confounded with situations. This confounding occurs at
a number of different levels. As we observed with the Berkeleylongitudinal studies, observing a single cohort over a long period of
time naturally confounds age with cultural and historical trends.Age is also naturally confounded with important normative
developmental tasks such as going to school, going to work,marriage, and raising one’s own children. At the more molecular
level of daily and weekly cycles, most individuals have a structure orroutine such as moving from family to work roles that occurs
regularly both within days and within weeks. In terms of the databox, such confounding can be viewed as having incomplete data. Wedo not normally observe 10-year-olds in an office setting nor do we
often observe 50-year-olds in a school setting. Instead, as individualsprogress through their lives, some situations may be continually
present and then come and go (e.g., visits to one’s parents home),whereas other situations may fall out of people’s lives, being
replaced by new situations (e.g., school to work).Fully disentangling time from changes in situations is neither
possible nor desirable. Attempting to do so runs the risk ofdiscarding the core features of people’s lives. What then are thealternatives? The use of multiple cohorts helps minimize the impact
of historical and cultural trends in addition to providing insight intothe specific impact of particular events. Examining how variations in
normative timing impacts development can potentially shed lightinto the role of normative life transitions (Caspi, Bem, & Elder,
1989). Time series analyses and other assessment-intensive statisticalmodels can incorporate data on systematic changes in social roles.
Beyond the role of normative situations is the interplay that comesfrom individuals choosing situations that, in turn, may powerfully
affect the individual’s development. Only some children choose toaffiliate with deviant peers, but continued affiliation with deviantpeers then greatly increases the risk of subsequent delinquent
behaviors. From the standpoint of the data box, this is a problem ofunderstanding the determinants of situational selection, an area in
which far too little is known.
Linkages among methodsTo this point, we have examined different analyses for exploring
personality development in isolation. We now consider the potentiallinkages among several combinations of these models and how one
Personality Over Time 931

analysis may shed light on or present difficulties in the interpretation
of another.
Mean-level and profile analyses across time. Individual differencesin mean level changes strongly imply that personality reorganizes
across time. Unless the association among rates of changeacross constructs is perfect, between-persons variance in growth
rates provides indirect evidence that the relative patterning ofconstructs within individuals is changing. However, the exact
nature of potential reorganization will be unclear from mean-levelanalyses. Considering changes in a particular construct over timeacross individuals in conjunction with changes in constructs within
an individual over time is required to fully understand howpersonality changes over time both nomothetically and idiographi-
cally. Although models that estimate both levels of changesimultaneously are not currently practical, it is possible to estimate
each type of model of change and compare their results, thusproviding a greater understanding of how personality is changing
over time.
Mean-level and intraindividual variability analyses across time. Bothconceptually and mathematically, mean and variance structurescan usefully be considered to be independent (see footnote 3).
Increases in variance may provide a signal of the onset of a dynamicprocess that only later becomes evident in the mean structure. As
mentioned earlier, Butler et al. (1994) found that high variability inself-esteem ratings was associated with proneness to later depres-
sion. Sharp improvements in skilled individual performance areoften predicted by a period of highly variable performance.
Speculatively, increases in intraindividual variance may be leadingindicators of qualitative changes in the level or slope of growth or
decline.Strong between-person differences in intraindividual variability
(e.g., some individuals are much more variable on a given construct
over time than others) may have implications for person-centeredanalyses. When constructs such as life events and mood are
repeatedly assessed as in a diary study, it is possible to model therelationship between mood and self-esteem separately within
individuals and then predict that relationship in hierarchical linearand growth models (e.g., Kenny, Kashy, & Bolger, 1998; Reis &
932 Biesanz et al.

Gable, 2000). We will obtain more precise estimates of the
relationship between the two constructs for individuals who arehighly temporally variable compared to individuals who are less
temporally variable on the independent variable (IV) in the analysis.Consequently, many statistical models that use empirical Bayes
estimation will give greater weight to those individuals who are moretemporally variable on the IV. This feature may present interpreta-
tional problems if intraindividual variability is related to therelationship between the two constructs.
DISCUSSION: Methods and Models
In this article we have considered a number of new methods for the
study of personality in both the short and long term. Whiletraditional correlational methods have served the field by providing
answers to some key questions, other important questions have goneunaddressed. The examination of mean structures, variance
structures, and cyclic patterns provides a nice complement to theinformation that can be gleaned from the analysis of correlational
structures. Developmental theorists like Cairns (2000), Magnusson(1998; 2000) and Nesselroade and McArdle (1997) have repeatedlycalled for a stronger convergence between theoretical models and the
methods that are chosen to address them. It is clear from our reviewof recent publications in personality psychology that the lack of
breadth of methodologies in current use in personality must bynecessity limit the variety of theoretical models of development and
change that are under consideration. Given the recent developmentof a variety of quantitative methodologies for examining personality
across time, methodological resources are now currently available toexamine more nuanced questions concerning the functioning of
individuals over time.Any one analysis considers only a few aspects of the data box and
thus presents only an abbreviated and condensed aspect of
personality. Each analytic perspective on the data box provides uswith a new piece of the overall puzzle of personality (Funder, 2001).
The challenge of the puzzle is for theorists and researchers torecognize that each piece we obtain reflects only a partial view of
reality. The pieces will not nicely ‘‘fit’’ together and combineadditively with other pieces. No one methodology or analysis can
Personality Over Time 933

adequately represent the full range of models of personality across
time.To illustrate, consider the four questions we posed in the
introduction with regard to examining personality over time. Itmay be possible for a single study to collect sufficient data to
examine individual differences in mean-level changes on constructsover time, profile changes across time, individual differences in the
variability across time, and meaningful and important rhythms inhow personality is expressed over time. As well, sufficient data
collection would permit determining if changes are related acrossconstructs (across individuals). Returning to the generalizationsthat, as Runyan (1983) noted, personality psychologists seek to
make, some of these analyses across time provide information aboutcharacteristics that are true for each individual. Other analyses can
provide information that is true of some people and inform us ofpotentially meaningful individual differences. And some analyses
can provide us with information that characterizes single persons.Deciding when each of these approaches will be most valuable, and
integrating the results of these different analyses into a coherentpicture of personality to compare against theoretical models remainsthe challenge.
REFERENCES
Adams, D. C., Gurevitch, J., & Rosenberg, M. S. (1997). Resampling tests for
meta-analysis of ecological data. Ecology, 78, 1277–1283.
Allport, G. W. (1937). Personality: A psychological interpretation. New York:
Holt.
Allport, G. W., & Vernon, P. E. (1933). Studies in expressive movement. New
York: Macmillan.
Anderson, K. J., & Revelle, W. (1994). Impulsivity and time of day: Is rate of
change in arousal a function of impulsivity? Journal of Personality and Social
Psychology, 67, 334–344.
Armeli, S., Carney, M. A., Tennen, H., Affleck, G., & O’Neil, T. (2000).
Stress and alcohol use: A daily process examination of the stressor-
vulnerability model. Journal of Personality and Social Psychology, 78,
979–994.
Bartlett, M. S. (1937). The statistical conception of mental factors. British Journal
of Psychology, 28, 97–104.
Baumeister, R. F. (Ed.) (2001). Target article: \Personality development across
the life course: The argument for change and continuity. Psychological Inquiry,
12 (2).
934 Biesanz et al.

Bell, R. Q. (1954). An experimental test of the accelerated longitudinal approach.
Child Development, 25, 281–286.
Bem, D. J. (1983). Toward a response style theory of persons in situations. In
M. M. Page (Ed.), Nebraska symposium on motivation 1982: Personality-
current theory and research (pp. 201–231). Lincoln, NE: University of Nebraska
Press.
Bentler, P. M. (1995). EQS structural equations program manual. Encino, CA:
Multivariate Software.
Biesanz, J. C., Curran, P. J., & Bollen, K. A. (2002). Estimating individual
trajectories in latent growth curve models. Unpublished manuscript.
Biesanz, J. C., & West, S. G. (2000). Personality coherence: Moderating self-other
profile agreement and profile consensus. Journal of Personality and Social
Psychology, 79, 425–437.
Biesanz, J. C., West, S. G., & Graziano, W. G. (1998). Moderators of self-other
agreement: Reconsidering temporal stability in personality. Journal of
Personality and Social Psychology, 75, 467–477.
Block, J. (1971). Lives through time. Berkeley, CA: Bancroft.
Boker, S. M. (2001). Differential structural modeling of intraindividual
variability. In L. M. Collins & A. G. Sayer (Eds.), New methods for the
analysis of change (pp. 3–28). Washington, DC: American Psychological
Association.
Boker, S. M. (2002). Consequences of continuity: The hunt for intrinsic properties
within parameters of dynamics in psychological processes. Multivariate
Behavioral Research, 37, 405–422.
Boker, S. M., & Nesselroade, J. R. (2002). A method for modeling the intrinsic
dynamics of intraindividual variability: Recovering the parameters of
simulated oscillators in multi-wave panel data. Multivariate Behavioral
Research, 37, 127–160.
Boker, S. M., Xu, M., Rotondo, J. L., & King, K. (2002). Windowed
cross-correlation and peak picking for the analysis of variability in the
association between behavioral time series. Psychological Methods, 7 (3),
338–355.
Bollen, K. A. (2002). Latent variables in psychology and the social sciences.
Annual Review of Psychology, 53, 605–634.
Brim, O. G. Jr., & Ryff, C. D. (1980). On the properties of life events. In P. B.
Baltes & O. G. Brim Jr. (Eds.), Life-Span development and behavior, (Vol. 3,
pp. 367–388). New York: Academic Press.
Brown, K. W., & Moskowitz, D. S. (1998). Dynamic stability of behavior:
The rhythms of our interpersonal lives. Journal of Personality, 66,
105–134.
Busk, P. L., & Serlin, R. C. (1992). Meta-analysis for single-case research. In
T. R. Kratochwill & J. R. Levin (Eds.), Single-case research design and
analysis: New directions for psychology and education (pp. 187–212). Hillsdale,
NJ: Lawrence Erlbaum Associates.
Butler, A. C., Hokanson, J. E., & Flynn, H. A. (1994). A comparison of self-
esteem lability and low trait self-esteem as vulnerability factors for depression.
Journal of Personality and Social Psychology, 66, 166–177.
Personality Over Time 935

Cairns, R. B. (2000). Developmental science: Three audacious implications.
In L. R. Bergman, R. B. Cairns, L.-G. Nilsson, & L. Nyystedt (Eds.),
Developmental science and the holistic approach (pp. 49–62). Mahwah, NJ:
Lawrence Erlbaum Associates.
Caspi, A., & Bem, D. J. (1990). Personality continuity and change across the life
course. In L. A. Pervin (Ed.), Handbook of personality: Theory and research
(pp. 549–575). New York: Guilford Press.
Caspi, A., Bem, D. J., & Elder, G. H. Jr. (1989). Continuities and consequences
of interactional styles across the life course. Journal of Personality, 57,
375–406.
Cattell, R. B. (1966a). The data box: Its ordering of total resources in terms of
possible relational systems. In R. B. Cattell (Ed.), Handbook of multivariate
experimental psychology (pp. 67–128). Chicago: Rand McNally.
Cattell, R. B. (1966b). Patterns of change: Measurement in relation to state-
dimension, trait change, lability, and process concepts. In R. B. Cattell (Ed.),
Handbook of multivariate experimental psychology (pp. 355–402). Chicago:
Rand McNally.
Cervone, D. & Shoda, Y. (Eds.) (1999). The coherence of personality: Social-
cognitive bases of consistency, variability, and organization. New York:
Guilford Press.
Chen, L. S., Aggen, S. H., Nesselroade, J. R., & Baltes, P. B. (2001). Short-term
fluctuations in elderly people’s sensiomotor functioning predict text and
spatial memory performance: The MacArthur successful aging studies. Journal
of Gerontology, 47, 100–116.
Collins, L. M., Hyatt, S. L., & Graham, J. W. (2000). Latent transition analysis
as a way of testing models of stage-sequential change in longitudinal data.
In T. D. Little, K. U. Schnabel, & J. Baumert (Eds.),Modeling longitudinal and
multilevel data (pp. 147–162). Mahwah, NJ: Erlbaum.
Colvin, C. R. (1993). Childhood antecedents of young-adult judgability. Journal
of Personality, 61, 611–635.
Cudeck, R. (1996). Mixed-effects models in the study of individual differences
with repeated measures data. Multivariate Behavioral Research, 31, 371–403.
Cudeck, R., & Klebe, K. J. (2002). Multiphase mixed-effects models for repeated
measures data. Psychological Methods, 7, 41–63.
Curran, P. J., & Bollen, K. A. (2001). The best of both worlds: Combining
autoregressive and latent curve models. In L. M. Collins & A. G. Sayer (Eds.),
New methods for the analysis of change (pp. 105–136). Washington, DC:
American Psychological Association.
Diener, E., Larsen, R. J., & Emmons, R. A. (1984). Person� situation interactions:
Choice of situations and congruence response models. Journal of Personality
and Social Psychology, 47, 580–592.
Dodge, R. (1924). Problems of human variability. Science, 59, 263–270.
Duncan, T. E., Duncan, S. C., Strycker, L. A., Li, F., & Alpert, A. (1999). An
introduction to latent variable growth curve modeling. Mahwah, NJ: Lawrence
Erlbaum Associates.
Eizenman, D. R., Nesselroade, J. R., Featherman, D. L., & Rowe, J. W.
(1997). Intraindividual variability in perceived control in an older sample:
936 Biesanz et al.

The MacArthur successful aging studies. Psychology of Aging, 12,
489–502.
Elder, G. H., Jr. (1998). Children of the Great Depression: Social change in life
experience (25th anniversary edn.). Boulder, CO: Westview Press.
Epstein, S. (1980). The stability of behavior: II. Implications for psychological
research. American Psychologist, 35, 790–806.
Embretson, S. E., & Reise, S. P. (2000). Item response theory for psychologists.
Mahwah, NJ: Lawrence Erlbaum Associates.
Fiske, D. W. (1972). Measuring the concepts of personality. Chicago, IL: Aldine
Publishing.
Fiske, D. W., & Rice, L. (1955). Intraindividual response variability. Psycholo-
gical Bulletin, 52, 217–250.
Friedman, H. S., Tucker, J. S., Schwartz, J. E., Martin, L. R., Tomlinson-Keasey,
C., Wingard, D. L., & Criqui, M. H. (1995). Childhood conscientiousness and
longevity: Health behaviors and the cause of death. Journal of Personality and
Social Psychology, 68, 696–703.
Funder, D. C. (2001). The Personality Puzzle (2nd ed.). New York: Norton.
Funder, D. C., & West, S. G. (Eds.) (1993). Viewpoints on personality:
Consensus, self-other agreement, and accuracy in personality judgment
[Special issue]. Journal of Personality, 64 (4).
Goldberg, L. R. (1992). The development of markers for the big-five factor
structure. Psychological Assessment, 4, 26–42.
Haan, N., Millsap, R., & Hartka, E. (1986). As time goes by: Change and stability
in personality over fifty years. Psychology and Aging, 1, 220–232.
Heatherton, T. F. & Weinberger, J. L. (Eds.) (1994). Can personality change?
Washington DC: American Psychological Association.
Helson, R., & Wink, P. (1992). Personality change in women from the early 40s to
the early 50s. Psychology and Aging, 7 (1), 46–55.
Herrington, L. P. (1942). The relation of physiological and social indices of
activity level. In Q. McNemar & M. A. Merrill (Eds.), Studies in personality
(pp. 125–146). New York: McGraw-Hill.
Jones, C. J., & Meredith, W. (1996). Patterns of personality change across the life
span. Psychology and Aging, 11, 57–65.
Kelley, H. H. (1973). The processes of causal attribution. American Psychologist,
28, 107–128.
Kendall, M. G., & Stuart, A. (1977). The advanced theory of statistics (Vol. 1),
New York: Macmillan.
Kenny, D. A., Kashy, D., & Bolger, N. (1998). Data analysis in
social psychology. In D. Gilbert, S. Fiske, & G. Lindzey (Eds.),
Handbook of social psychology (4th ed., pp. 233–265). New York: McGraw-
Hill.
Kernis, M. H., Grannemann, B. D., & Barclay, L. C. (1989). Stability and level of
self-esteem as predictors of anger arousal and hostility. Journal of Personality
and Social Psychology, 56, 1013–1023.
Kernis, M. H., Grannemann, B. D., & Barclay, L. C. (1992). Stability of self-
esteem: Assessment, correlates, and excuse making. Journal of Personality, 60,
621–644.
Personality Over Time 937

Khoo, S.-T., & West, S. G. (2002, in press). Longitudinal methods. In M.
Eid & E. Diener (Eds.), Handbook of psychological measurement: A multi-
method perspective. Washington, DC: American Psychological Association.
Kluckhohn, C., & Murray, H. A. (1953). Personality formation: The determi-
nants. In C. Kluckhohn, H. A. Murray, & D. Schneider (Eds.), Personality in
nature, society, and culture (pp. 53–67). New York: Knopf.
Lamiell, J. T. (1997). Individuals and the differences between them. In R. Hogan,
J. Johnson, & S. Briggs (Eds.), Handbook of Personality Psychology (pp.
117–141). San Diego, CA: Academic.
Lang, F. R., Featherman, D. L., & Nesselroade, J. R. (1997). Social self-efficacy
and short-term variability in social relationships: The MacArthur successful
aging studies. Psychology and Aging, 12, 657–666.
Larsen, R. J. (1990). Spectral analysis of psychological data. In A. Von Eye (Ed.),
Statistical methods in longitudinal research, Volume II: Time series and
categorical longitudinal data (pp. 319–349). Boston: Academic Press.
Lewin, K. (1935). A dynamic theory of personality. New York: McGraw-Hill.
Lindley, D. V., & Smith, A. F. M. (1972). Bayes estimates for the linear
model. Journal of the Royal Statistical Society. Series B (Methodological), 34,
1–41.
Little, R. J. A., & Schenker, N. (1995). Missing Data. In G. Arminger, C. C.
Clogg, & M. E. Sobel (Eds.), Handbook of Statistical Modeling for the Social
and Behavioral Sciences (pp. 39–75). New York: Plenum.
Magnusson, D. (1998). The logic and implications of a person-oriented approach.
In R. B. Cairns, L. R. Bergman, & J. Kagan (Eds.), Methods and models for
studying the individual: Essays in honor of Marian Radke-Yarrow (pp. 33–62).
Thousand Oaks, CA: Sage.
Magnusson, D. (2000). The individual as the organizing principle in psychological
inquiry: A holistic approach. In L. R. Bergman, R. B. Cairns, L.-G. Nilsson, &
L. Nyystedt (Eds.), Developmental science and the holistic approach (pp.
49–62). Mahwah, NJ: Lawrence Erlbaum Associates.
Magnusson, D., & Torestad, B. (1993). A holistic view of personality: A model
revisited. Annual Review of Psychology, 44, 427–452.
McArdle, J. J., Ferrer-Caja, E., Hamagami, F., & Woodcock, R. W. (2002).
Comparative longitudinal structural analyses of the growth and decline of
multiple intellectual abilities over the life span. Developmental Psychology, 38,
115–142.
McCrae, R. R., & Costa, P. T., Jr. (1990). Personality in adulthood. New York:
Guilford.
McCrae, R. R., Costa, P. T., Jr., de Lima, M. P., Simoes, A., Ostendorf, F.,
Angleitner, A., Marusic, I., Bratko, D., Caprara, G. V., Barbaranelli, C.,
Chae, J.-H., & Peidmont, R. L. (1999). Age differences in personality across
the adult life span: Parallels in five cultures. Developmental Psychology, 35,
466–477.
McDonald, R. P. (1981). Constrained least squares estimators of oblique
common factors. Psychometrika, 46, 337–341.
Mehta, P., & West, S. G. (2000). Putting the individual back in individual growth
curves. Psychological Methods, 5, 23–43.
938 Biesanz et al.

Meredith, W., & Tisak, J. (1990). Latent curve analysis. Psychometrika, 55,
107–122.
Moskowitz, D. S. (1986). Comparison of self-reports, reports by knowledgeable
informants, and behavioral observation data. Journal of Personality, 54,
294–317.
Moskowitz, D. S., & Schwartz, J. C. (1982). Validity comparison of behavior
counts and ratings by knowledgeable informants. Journal of Personality and
Social Psychology, 42, 518–528.
Murray, H. A. (1938). Explorations in personality. New York: Oxford University
Press.
Nasby, W., & Read, N. W. (1997). The life voyage of a solo circumnavigator:
Integrating theoretical and methodological perspectives. Journal of Person-
ality, 65, 785–1068.
Nesselroade, J. R. (2000, August). Longitudinal design and modeling in the short
run. Paper presented at the annual meeting of the American Psychological
Association, Washington, DC.
Nesselroade, J. R., & McArdle, J. J. (1997). On the mismatching of levels of
abstraction in mathematical-statistical model fitting. In M. D. Franzen &
H. W. Reese (Eds.), Life-span developmental psychology: Biological and
neuropsychological mechanisms (pp. 23–49). Hillsdale, NJ: Lawrence Erlbaum
Associates.
Ozer, D. J. (1986). Consistency in personality: A methodological framework.
Berlin: Springer-Verlag.
Ozer, D. J., & Gjerde, P. F. (1989). Patterns of personality consistency and
change from childhood through adolescence. Journal of Personality, 57,
483–508.
Pellegrino, J. W., & Kail, R. V. (1982). Process analysis of spatial aptitude. In
R. J. Sternberg (Ed.), Advances in the study of human intelligence (Vol. 1).
Hillsdale, NJ: Erlbaum.
Raudenbush, S. W., & Bryk, A. S. (2002). Hierarchical Linear Models:
Applications and Data Analysis Methods (2nd ed.). Thousand Oaks, CA: Sage
Publications.
Reis, H. T., & Gable, S. L. (2000). Event sampling and other methods for
studying daily experience. In H. T. Reis & C. M. Judd (Eds.), Handbook of
Research Methods in Social and Personality Psychology (pp. 190–222). New
York: Cambridge University Press.
Roberts, B. W., & DelVecchio, W. F. (2000). The rank-order consistency of
personality from childhood to old age: A quantitative review of longitudinal
studies. Psychological Bulletin, 126, 3–25.
Rogosa, D. R., & Willett, J. B. (1985). Understanding correlates of change by
modeling individual differences in growth. Psychometrika, 50, 203–228.
Runyan, W. (1983). Idiographic goals and the study of lives. Journal of
Personality, 51, 413–437.
Schafer, J. L., & Graham, J. W. (2002). Missing data: Our view of the state of the
art. Psychological Methods, 7, 147–177.
Shoda, Y., Mischel, W., & Wright, J. C. (1994). Intraindividual stability in
the organization and patterning of behavior: Incorporating psychological
Personality Over Time 939

situations into the idiographic analysis of personality. Journal of Personality
and Social Psychology, 67, 674–687.
Singer, J. D., & Willett, J. B. (2003). Applied Longitudinal Data Analysis:
Modeling Change and Event Occurrence. New York: Oxford University
Press.
Snyder, M. (1983). The influence of individuals on situations: Implications for
understanding the links between personality and social behavior. Journal of
Personality, 51, 497–516.
Stevens, S. S. (1951). Mathematics, measurement, and psychophysics. In S. S.
Stevens (Ed.), Handbook of experimental psychology (pp. 1–49). New York:
Wiley.
Stevenson, W. (1952). Some observations of the Q technique. Psychological
Bulletin, 49, 483–498.
Thorndike, E. L. (1931). Human learning. New York: Appleton-Century-Crofts.
Tisak, J., & Tisak, M. S. (2000). Permanency and ephemerality of psychological
measures with application to organizational commitment. Psychological
Methods, 5, 175–198.
Tucker, L. R. (1971). Relations of factor score estimates to their use.
Psychometrika, 36, 427–436.
Tukey, J. W. (1986). Data analysis and behavioral science or learning to bear the
quantitative man’s burden by shunning badmandments. In L. V. Jones (Ed.),
The collected works of John W. Tukey: Vol. III, Philosophy and principles of
data analysis: 1949–1964 (pp. 187–390). Monterey, CA: Wadsworth & Brooks
(original unpublished work 1961).
von Eye, A. & Clogg, C. C. (Eds.) (1996). Categorical variables in developmental
research. Boston: Academic Press.
von Eye, A., Kreppner, K., Spiel, C., & We-Sels, H. (1995). Life events’ spacing
and order in individual development. In T. A. Kindermann & J. Valsiner
(Eds.), Development of person-context relations (pp. 147–164). Hillsdale, NJ:
Lawrence Erlbaum Associates.
West, S. G. (Ed.) (1983). Personality and prediction: Nomothetic and idiographic
approaches [Special Issue]. Journal of Personality, 51 (3).
West, S. G. (in press). Towards finding the person in the data of personality.
Journal of Personality.
West, S. G., & Graziano, W. G. (Eds.) (1989). Long-term stability and change in
personality [Special Issue]. Journal of Personality, 57 (2).
West, S. G., & Hepworth, J. T. (1991). Statistical issues in the study of temporal
data: Daily experiences. Journal of Personality, 59, 609–662.
Wiggins, J. S. (1991). Agency and communion as conceptual coordinates
for understanding and measurement of interpersonal behavior. In W. Grove
& D. Cicchetti (Eds.), Thinking clearly about psychology: Essays in honor
of Paul E. Meehl (Vol. 2, pp. 89–113). Minneapolis: University of
Minnesota Press.
Willett, J. B., & Sayer, A. G. (1994). Using covariance structure analysis to detect
correlates and predictors of individual change over time. Psychological
Bulletin, 116, 363–381.
940 Biesanz et al.

Willett, J. B., Singer, J. D., & Martin, N. C. (1998). The design and analysis of
longitudinal studies of development and psychopathology in context:
Statistical models and methodological recommendations. Development and
Psychopathology, 10, 395–426.
Winter, D. G., & Barenbaum, N. B. (1999). History of modern personality theory
and research. In L. A. Pervin & O. P. John (Eds.), Handbook of personality:
Theory and research (2nd ed., pp. 3–30). New York: Guilford Press.
Personality Over Time 941

942