permeable pavement hydrologic modeling - etouches · permeable pavement hydrologic modeling robin...
TRANSCRIPT

4/20/2012
1
Permeable Pavement
Hydrologic Modeling
Robin Kirschbaum, PE, LEED AP
Alice Lancaster, PE
April 25, 2012
Presentation Overview
Overview of Hydrologic Modeling
Performance Standards
Modeling Guidelines, Tools, Concepts
Permeable Pavement Types
Applications Flow Control
Water Quality Treatment
Slope Considerations
Peak Flow Reduction
Advanced Tools
Hydrologic Modeling
Q: What is hydrologic modeling?
A: Use of mathematical equations to estimate runoff based on: weather patterns
landuse
soil
topography
Source: http://www.und.nodak.edu/
4/20/2012
2
Hydrologic Modeling
Q: Why do we use hydrologic models?
A1: Characterize hydrologic conditions Predeveloped
Current
Post-project
A2: Design mitigation
A3: It’s fun!
Source: http://www.und.nodak.edu/
Hydrologic Modeling
Q: When does hydrologic
modeling enter into your
project?
A: Start to finish
preliminary design (sizing)
final design (optimization)
demonstrate requirements met
(permit submittals) Source: http://www.und.nodak.edu/
Performance Standards
Flow Control Non Exempt Receiving Water-
Ecology requirement to match the flow duration to predeveloped condition (typically forest)
Combined Sewer or Capacity Constrained Basins-
Local requirements are typically peak-control based
Water Quality Infiltrate 91 percent of runoff file through soils meeting
Ecology treatment requirements
Wetland Protection Ecology guideline to maintain wetland hydroperiod
Volume I App 1-D, Guide sheet 2
4/20/2012
3
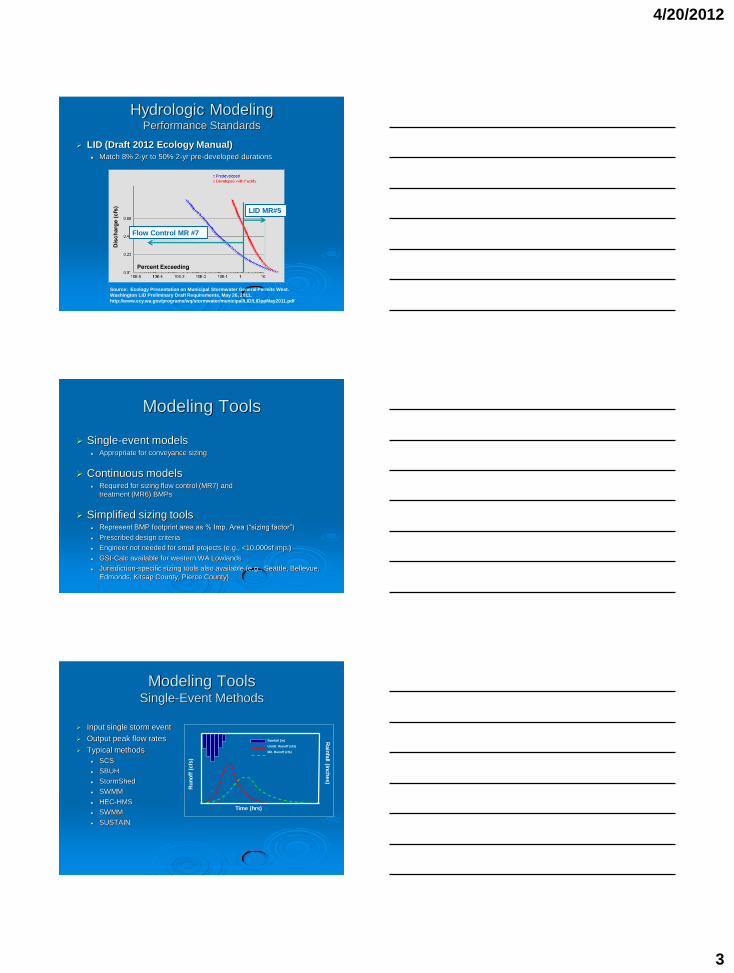
Hydrologic Modeling Performance Standards
LID (Draft 2012 Ecology Manual)
Match 8% 2-yr to 50% 2-yr pre-developed durations
Source: Ecology Presentation on Municipal Stormwater General Permits West.
Washington LID Preliminary Draft Requirements, May 26, 2011.
http://www.ecy.wa.gov/programs/wq/stormwater/municipal/LID/LIDppMay2011.pdf
Flow Control MR #7
LID MR#5
Modeling Tools
Single-event models Appropriate for conveyance sizing
Continuous models Required for sizing flow control (MR7) and
treatment (MR6) BMPs
Simplified sizing tools Represent BMP footprint area as % Imp. Area (“sizing factor”)
Prescribed design criteria
Engineer not needed for small projects (e.g., <10,000sf imp.)
GSI-Calc available for western WA Lowlands
Jurisdiction-specific sizing tools also available (e.g., Seattle, Bellevue,
Edmonds, Kitsap County, Pierce County)
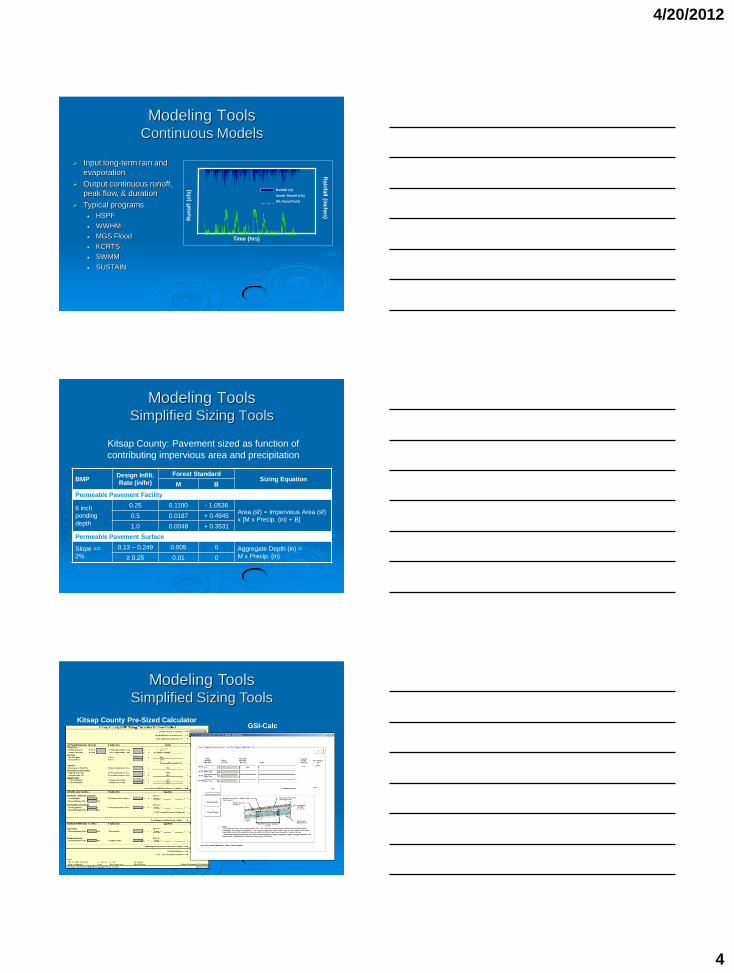
Modeling Tools Single-Event Methods
Input single storm event
Output peak flow rates
Typical methods
SCS
SBUH
StormShed
SWMM
HEC-HMS
SWMM
SUSTAIN
Ru
no
ff (
cfs
)
Rain
fall (in
ch
es)
Rainfall (in)
Unmit. Runoff (cfs)
Mit. Runoff (cfs)
Time (hrs)
4/20/2012
4
Modeling Tools Continuous Models
Input long-term rain and
evaporation
Output continuous runoff,
peak flow, & duration
Typical programs
HSPF
WWHM
MGS Flood
KCRTS
SWMM
SUSTAIN
Time (hrs)
Ru
no
ff (
cfs
)
Rain
fall (in
ch
es)
Rainfall (in)
Unmit. Runoff (cfs)
Mit. Runoff (cfs)
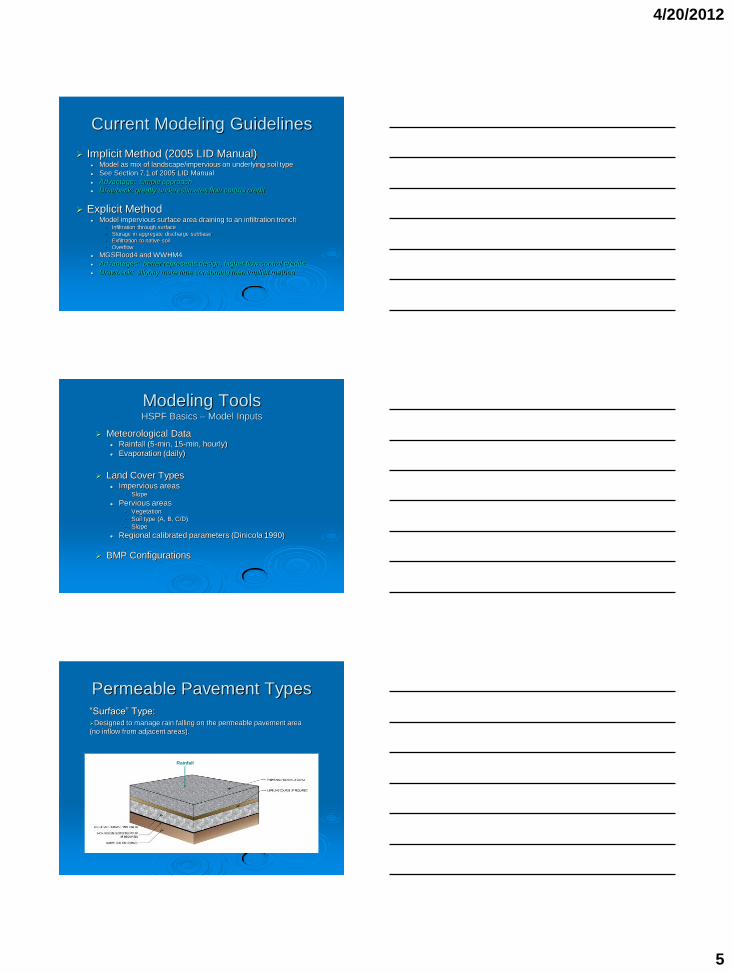
Modeling Tools Simplified Sizing Tools
Kitsap County: Pavement sized as function of
contributing impervious area and precipitation
BMP Design Infilt.
Rate (in/hr)
Forest Standard Sizing Equation
M B
Permeable Pavement Facility
6 inch
ponding
depth
0.25 0.1100 - 1.0536 Area (sf) = Impervious Area (sf)
x [M x Precip. (in) + B] 0.5 0.0187 + 0.4945
1.0 0.0048 + 0.3531
Permeable Pavement Surface
Slope <=
2%
0.13 – 0.249 0.005 0 Aggregate Depth (in) =
M x Precip. (in) ≥ 0.25 0.01 0
Kitsap County Pre-Sized Calculator GSI-Calc
Modeling Tools Simplified Sizing Tools
4/20/2012
5
Current Modeling Guidelines
Implicit Method (2005 LID Manual) Model as mix of landscape/impervious on underlying soil type
See Section 7.1 of 2005 LID Manual
Advantage: simple approach
Drawback: greatly underestimates flow control credit
Explicit Method Model impervious surface area draining to an infiltration trench
• Infiltration through surface
• Storage in aggregate discharge subbase
• Exfiltration to native soil
• Overflow
MGSFlood4 and WWHM4
Advantages: better represents design, higher flow control credits
Drawback: slightly more time consuming than implicit method
Modeling Tools HSPF Basics – Model Inputs
Meteorological Data Rainfall (5-min, 15-min, hourly)
Evaporation (daily)
Land Cover Types Impervious areas
• Slope
Pervious areas • Vegetation
• Soil type (A, B, C/D)
• Slope
Regional calibrated parameters (Dinicola 1990)
BMP Configurations
Permeable Pavement Types “Surface” Type: Designed to manage rain falling on the permeable pavement area
(no inflow from adjacent areas).
Rainfall
4/20/2012
6
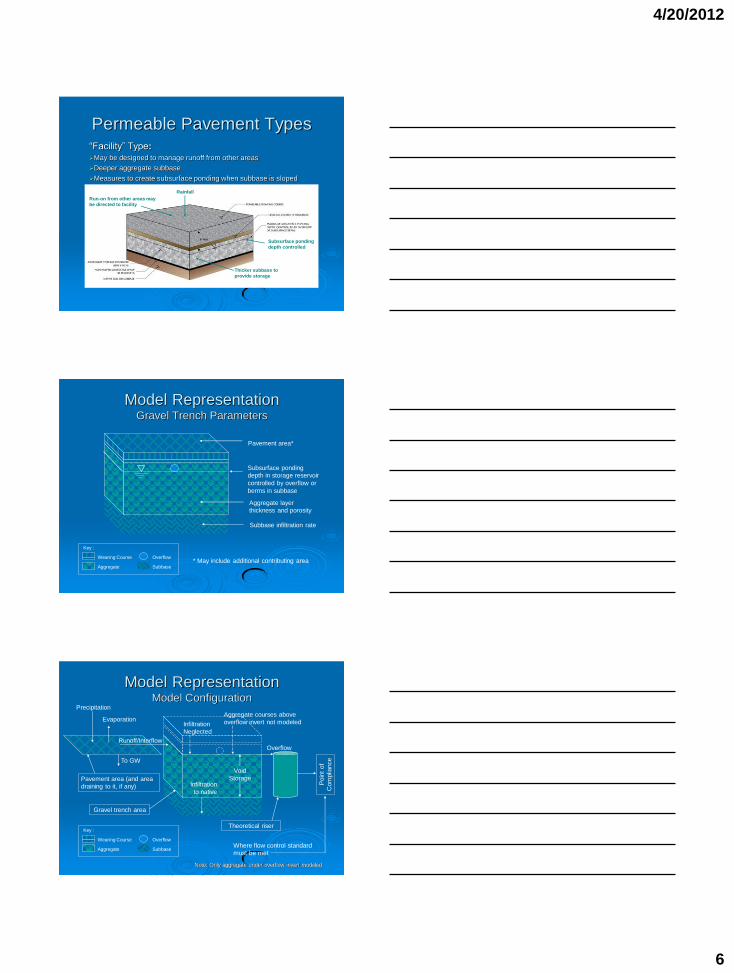
Permeable Pavement Types “Facility” Type: May be designed to manage runoff from other areas
Deeper aggregate subbase
Measures to create subsurface ponding when subbase is sloped
Run-on from other areas may
be directed to facility
Thicker subbase to
provide storage
Rainfall
Subsurface ponding
depth controlled
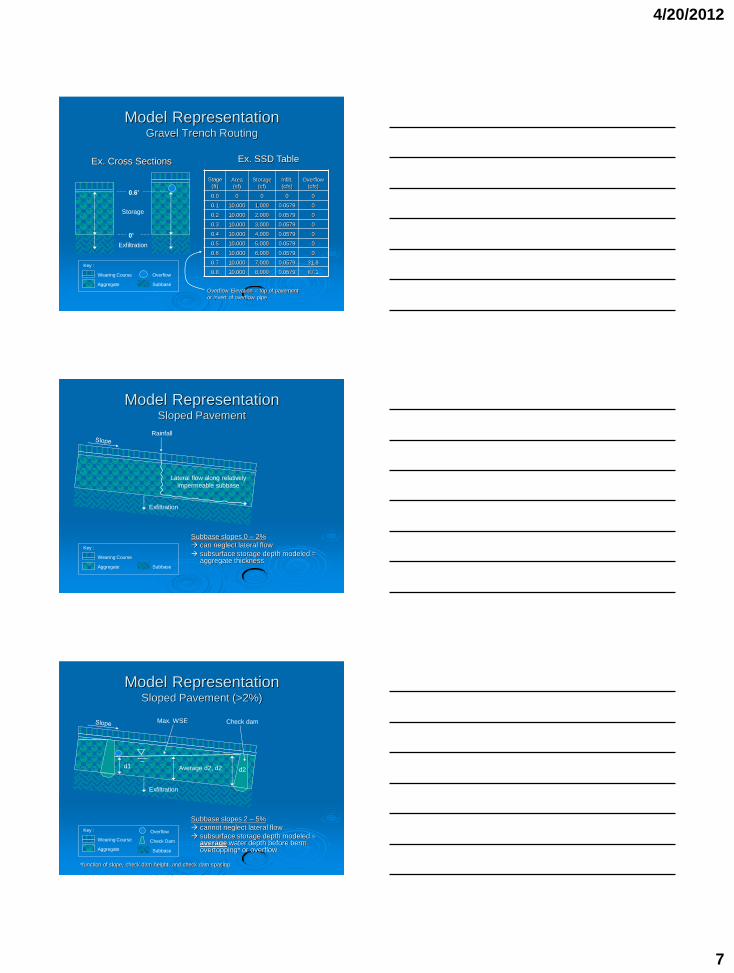
Model Representation Gravel Trench Parameters
Subbase infiltration rate
Wearing Course Overflow
Subbase Aggregate
Key :
Aggregate layer
thickness and porosity
Subsurface ponding
depth in storage reservoir
controlled by overflow or
berms in subbase
Pavement area*
* May include additional contributing area
Model Representation Model Configuration
Wearing Course Overflow
Subbase Aggregate
Key :
Pavement area (and area
draining to it, if any)
Precipitation
Evaporation Infiltration
Neglected
Gravel trench area
Aggregate courses above
overflow invert not modeled
Theoretical riser
Poin
t of
Com
plia
nce
Void
Storage
Overflow
Note: Only aggregate under overflow invert modeled
Runoff/Interflow
To GW
Where flow control standard
must be met
Infiltration
to native
4/20/2012
7
Model Representation Gravel Trench Routing
Stage
(ft) Area
(sf)
Storage
(cf)
Infilt.
(cfs)
Overflow
(cfs)
0.0 0 0 0 0
0.1 10,000 1,000 0.0579 0
0.2 10,000 2,000 0.0579 0
0.3 10,000 3,000 0.0579 0
0.4 10,000 4,000 0.0579 0
0.5 10,000 5,000 0.0579 0
0.6 10,000 6,000 0.0579 0
0.7 10,000 7,000 0.0579 31.8
0.8 10,000 8,000 0.0579 87.1
Ex. SSD Table
0’
Ex. Cross Sections
0.6’
Exfiltration
Storage
Wearing Course Overflow
Subbase Aggregate
Key :
Overflow Elevation = top of pavement
or invert of overflow pipe
Model Representation Sloped Pavement
Exfiltration
Wearing Course
Subbase Aggregate
Key :
Subbase slopes 0 – 2%
can neglect lateral flow
subsurface storage depth modeled = aggregate thickness
Rainfall
Lateral flow along relatively
impermeable subbase
Model Representation Sloped Pavement (>2%)
Exfiltration
Wearing Course Check Dam
Subbase Aggregate
Key :
Check dam Max. WSE
d1 d2 Average d2, d2
Overflow
Subbase slopes 2 – 5%
cannot neglect lateral flow
subsurface storage depth modeled = average water depth before berm overtopping* or overflow
*function of slope, check dam height, and check dam spacing

4/20/2012
8
Model Representation Underlying Soil
Minimum Correction Factor
Permeable
Pavement Surface
Permeable
Pavement Facility
Not Receiving Run-on 2 2
Receiving Run-on from
Area < twice facility size
NA 2
Receiving Run-on from
Area > twice facility size
NA 4
Design Infiltration Rate Requires Correction
Treatment credits when 91% influent infiltrated
through soils meeting Ecology requirements
Ecology Approved Correction Factors for Kitsap County
Applications
Duration Control (Creek Protection)
Water Quality Treatment
Sloped Design Consideration
Peak Flow Reduction
Flow Control in Creek Basin WWHM4 Example – Explicit Method
Site in King County
Soil is till (0.25 inch/hour design infiltration rate)
Permeable pavement facility is 10,000 sf
Receiving run-on from 5,000 sf of additional area
Design goal = Ecology forest duration standard
Size aggregate depth (ave. subsurface ponding depth)
SIZING FOR FLOW CONTROL GOAL →
May NEED TO BE THICKER TO SATISFY OTHER
DESIGN GOALS (EX. LOADING)
4/20/2012
9
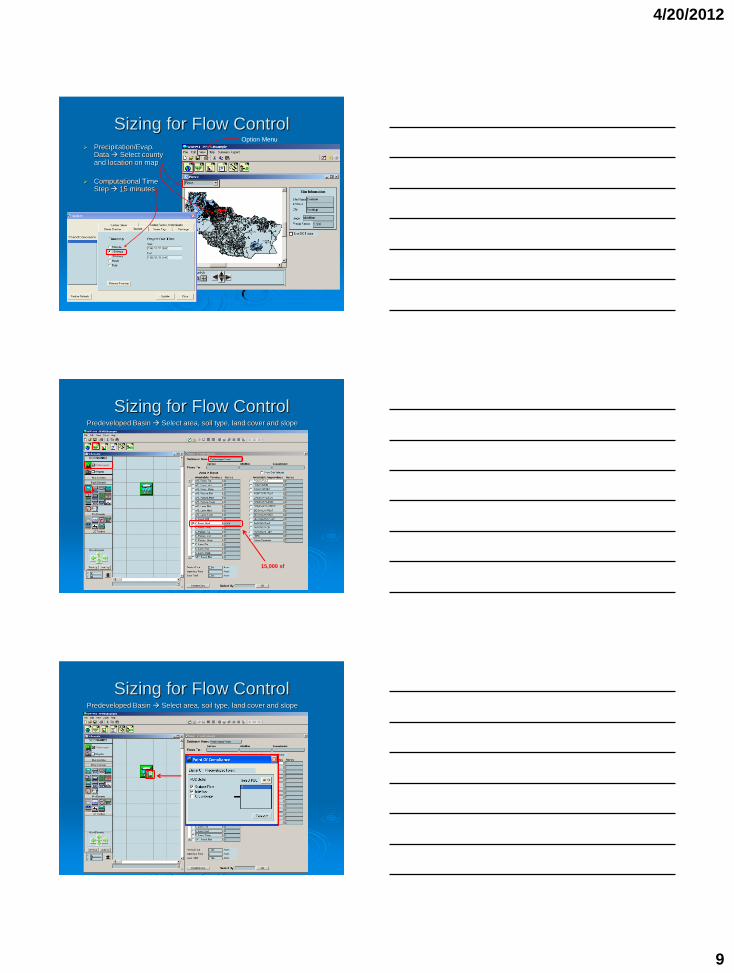
Precipitation/Evap. Data Select county and location on map
Computational Time Step 15 minutes
Option Menu
Sizing for Flow Control
Predeveloped Basin Select area, soil type, land cover and slope
Sizing for Flow Control
15,000 sf
Predeveloped Basin Select area, soil type, land cover and slope
Sizing for Flow Control
4/20/2012
10
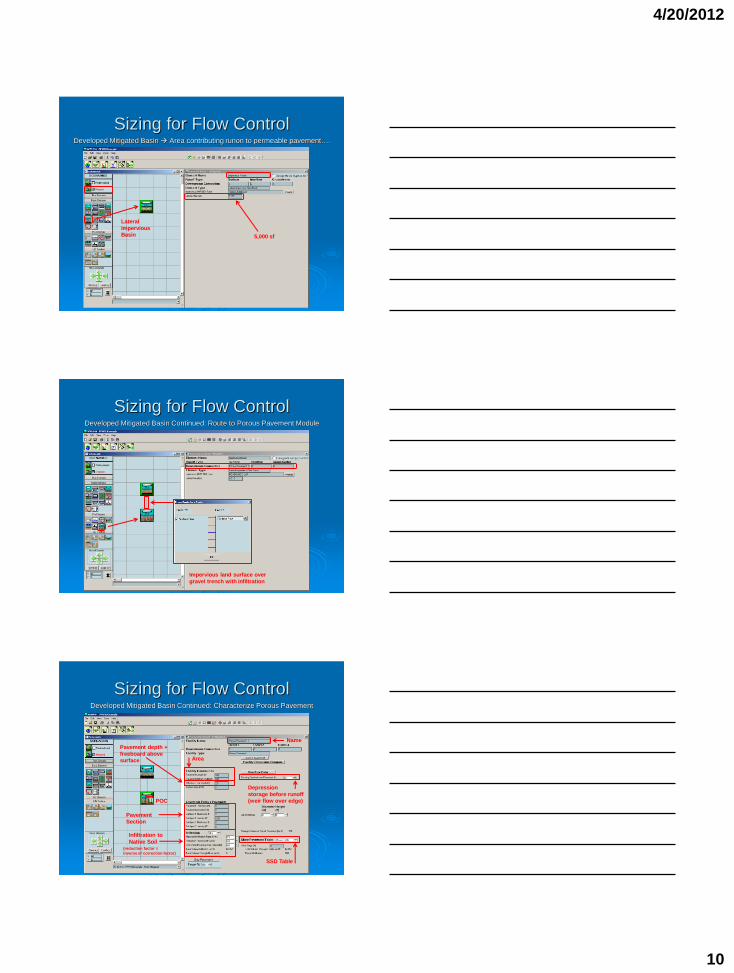
Sizing for Flow Control Developed Mitigated Basin Area contributing runon to permeable pavement….
5,000 sf
Lateral
Impervious Basin
Sizing for Flow Control Developed Mitigated Basin Continued: Route to Porous Pavement Module
Impervious land surface over
gravel trench with infiltration
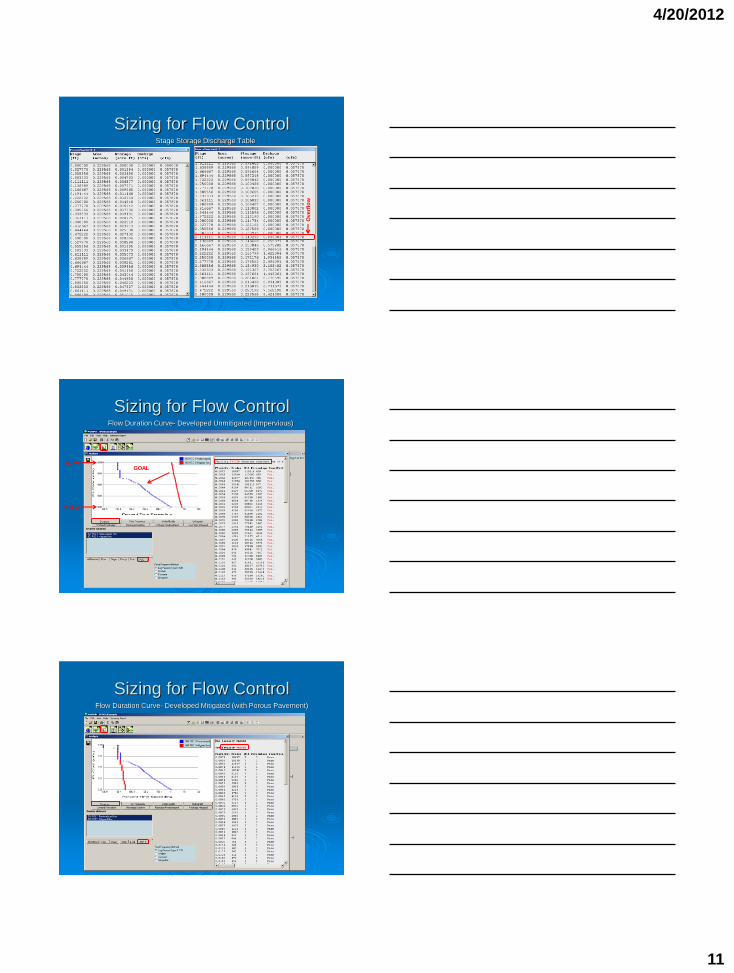
Sizing for Flow Control Developed Mitigated Basin Continued: Characterize Porous Pavement
Area
Pavement
Section
Infiltration to
Native Soil
SSD Table
Name
POC
Pavement depth +
freeboard above surface
Depression
storage before runoff (weir flow over edge)
(reduction factor =
inverse of correction factor)
4/20/2012
11
Stage Storage Discharge Table
Sizing for Flow Control
Overf
low
Flow Duration Curve- Developed Unmitigated (Impervious)
Sizing for Flow Control
50-yr
½ 2-yr
GOAL
Flow Duration Curve- Developed Mitigated (with Porous Pavement)
Sizing for Flow Control
4/20/2012
12
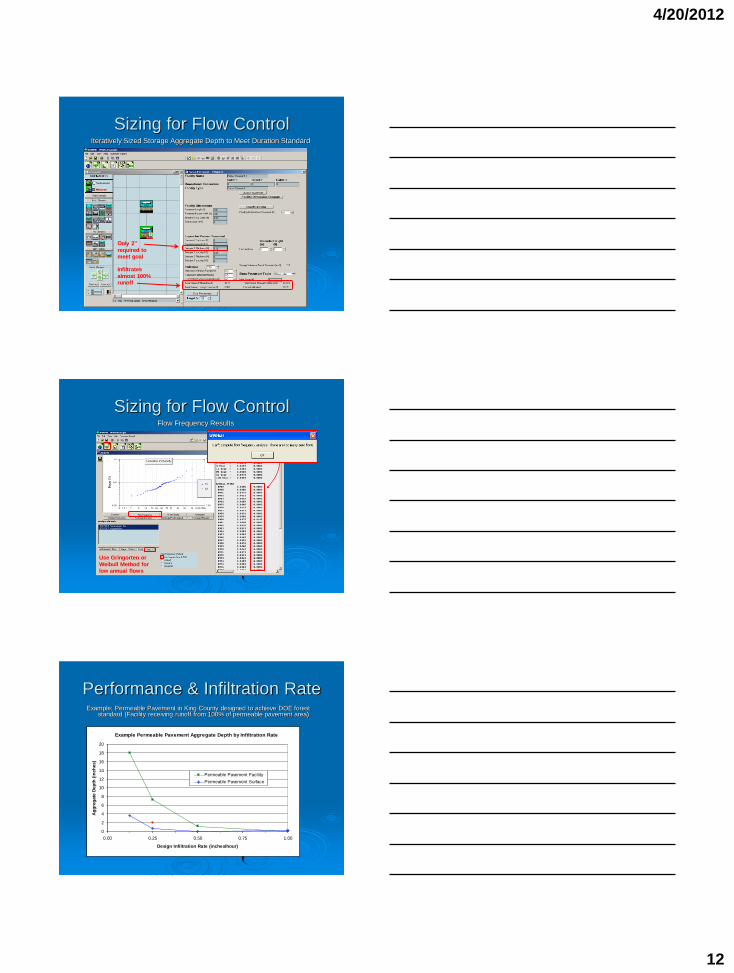
Iteratively Sized Storage Aggregate Depth to Meet Duration Standard
Sizing for Flow Control
Infiltrates
almost 100% runoff
Only 2”
required to meet goal
Flow Frequency Results
Sizing for Flow Control
Use Gringorten or
Weibull Method for low annual flows
Performance & Infiltration Rate Example: Permeable Pavement in King County designed to achieve DOE forest
standard (Facility receiving runoff from 100% of permeable pavement area)
0
2
4
6
8
10
12
14
16
18
20
0.00 0.25 0.50 0.75 1.00
Design Infiltration Rate (inches/hour)
Ag
gre
gate
Dep
th (
inch
es)
Permeable Pavement Facility
Permeable Pavement Surface
Example Permeable Pavement Aggregate Depth by Infiltration Rate
4/20/2012
13
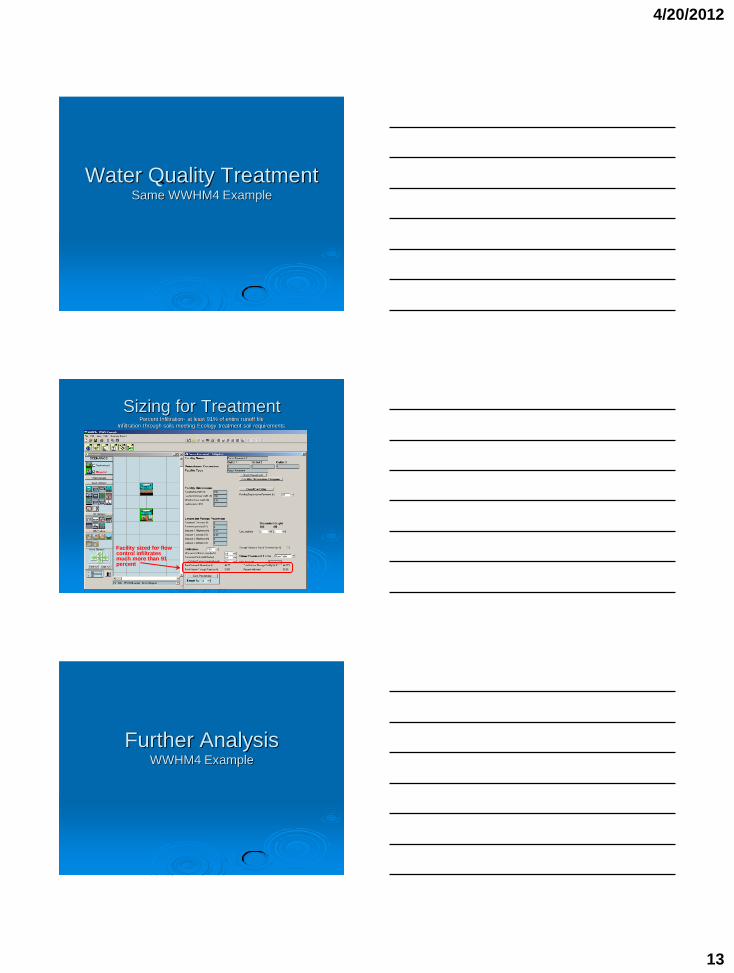
Water Quality Treatment Same WWHM4 Example
Sizing for Treatment Percent Infiltration- at least 91% of entire runoff file
Infiltration through soils meeting Ecology treatment soil requirements
Facility sized for flow control infiltrates much more than 91 percent
Further Analysis WWHM4 Example
4/20/2012
14
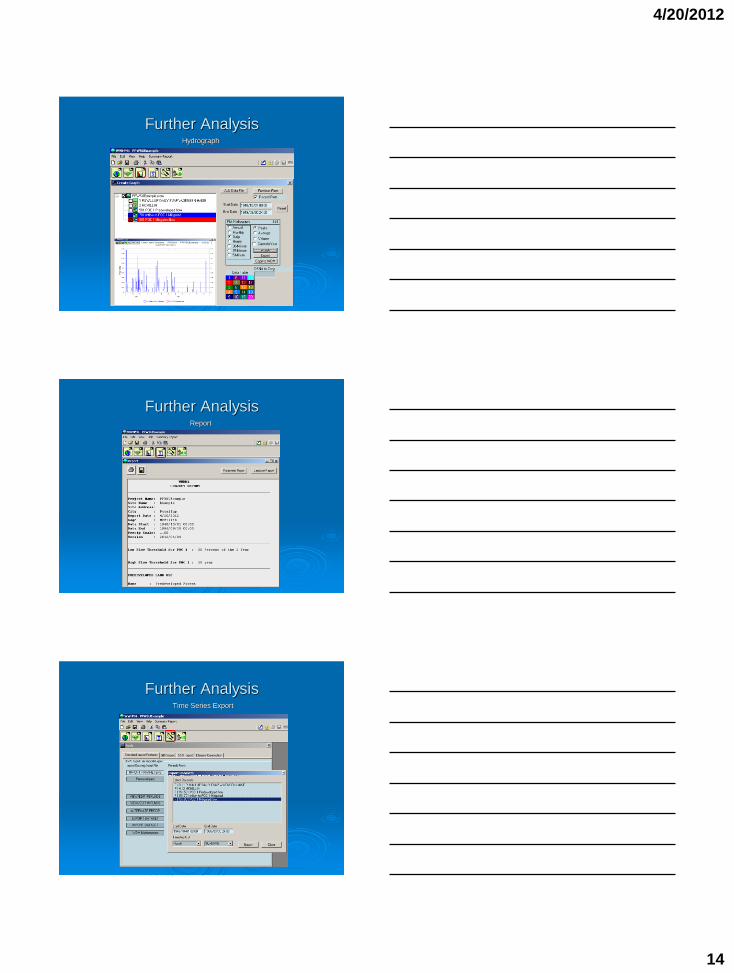
Hydrograph
Further Analysis
Report
Further Analysis
Time Series Export
Further Analysis
4/20/2012
15
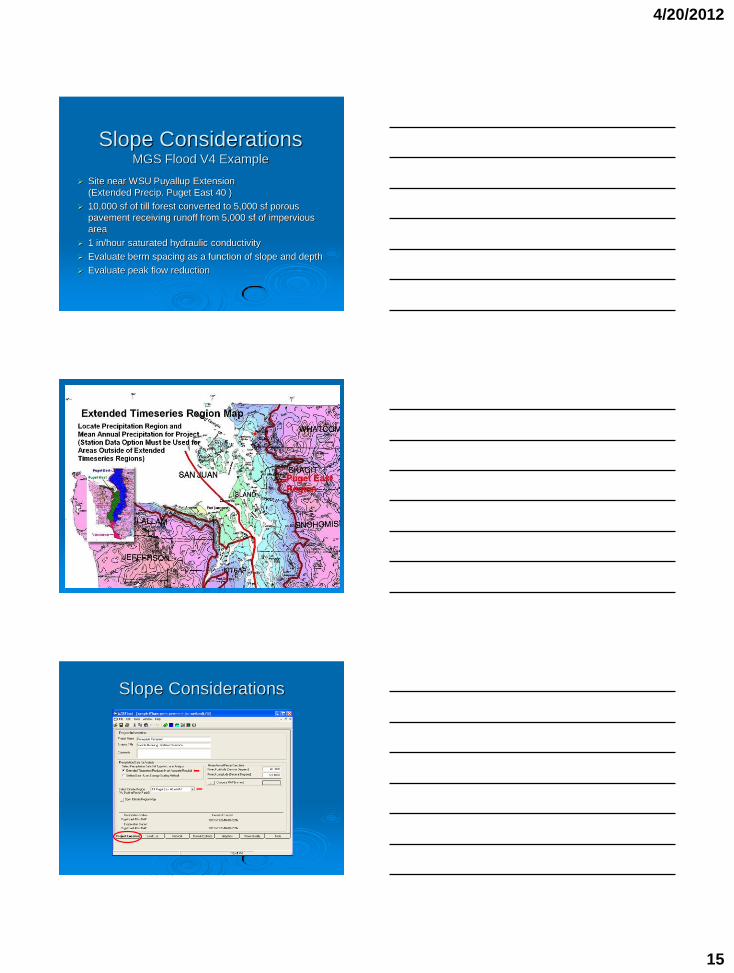
Slope Considerations MGS Flood V4 Example
Site near WSU Puyallup Extension
(Extended Precip. Puget East 40 )
10,000 sf of till forest converted to 5,000 sf porous
pavement receiving runoff from 5,000 sf of impervious
area
1 in/hour saturated hydraulic conductivity
Evaluate berm spacing as a function of slope and depth
Evaluate peak flow reduction
Slope Considerations
4/20/2012
16
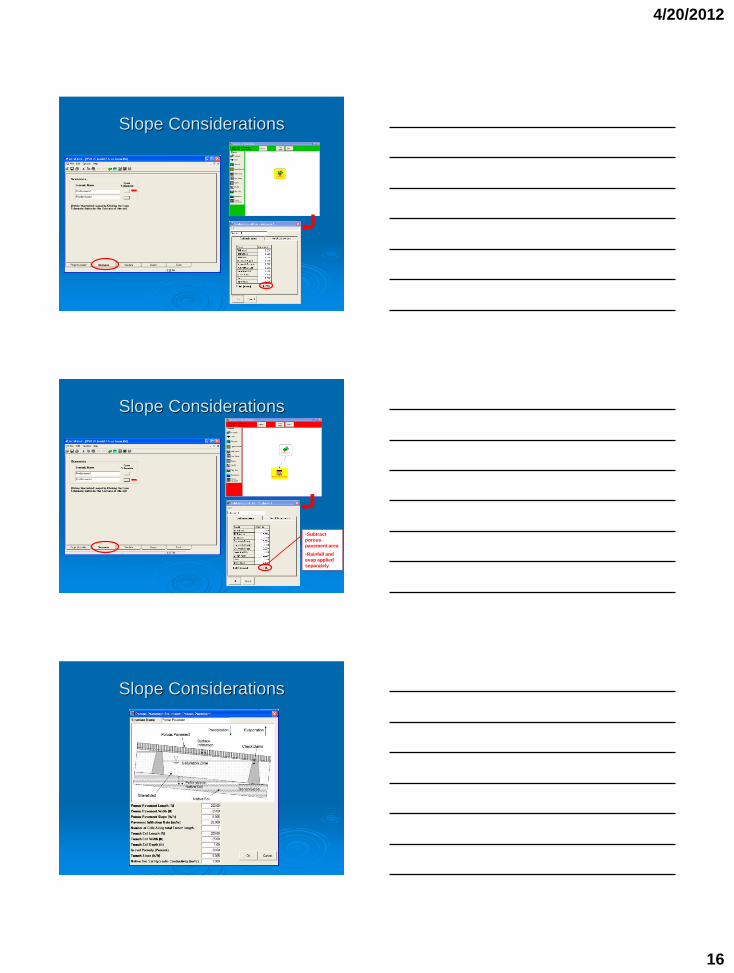
Slope Considerations
Slope Considerations
•Subtract
porous
pavement area
•Rainfall and
evap applied
separately
Slope Considerations
4/20/2012
17
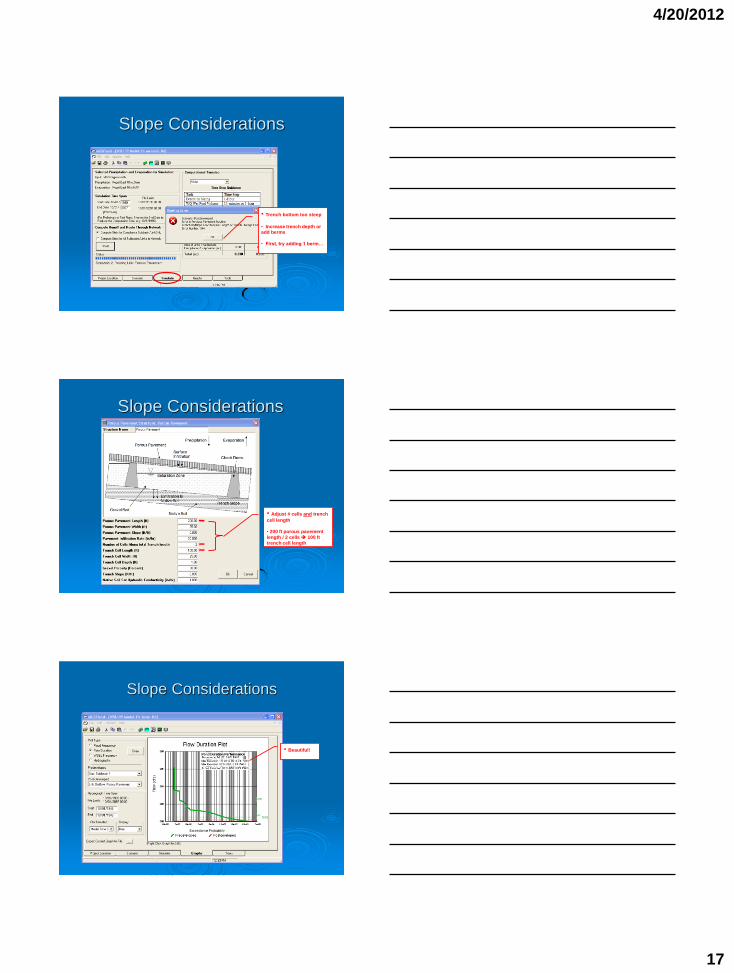
Slope Considerations
• Trench bottom too steep
• Increase trench depth or add berms
• First, try adding 1 berm…
Slope Considerations
• Adjust # cells and trench
cell length
• 200 ft porous pavement
length / 2 cells 100 ft
trench cell length
Slope Considerations
• Beautiful!
4/20/2012
18
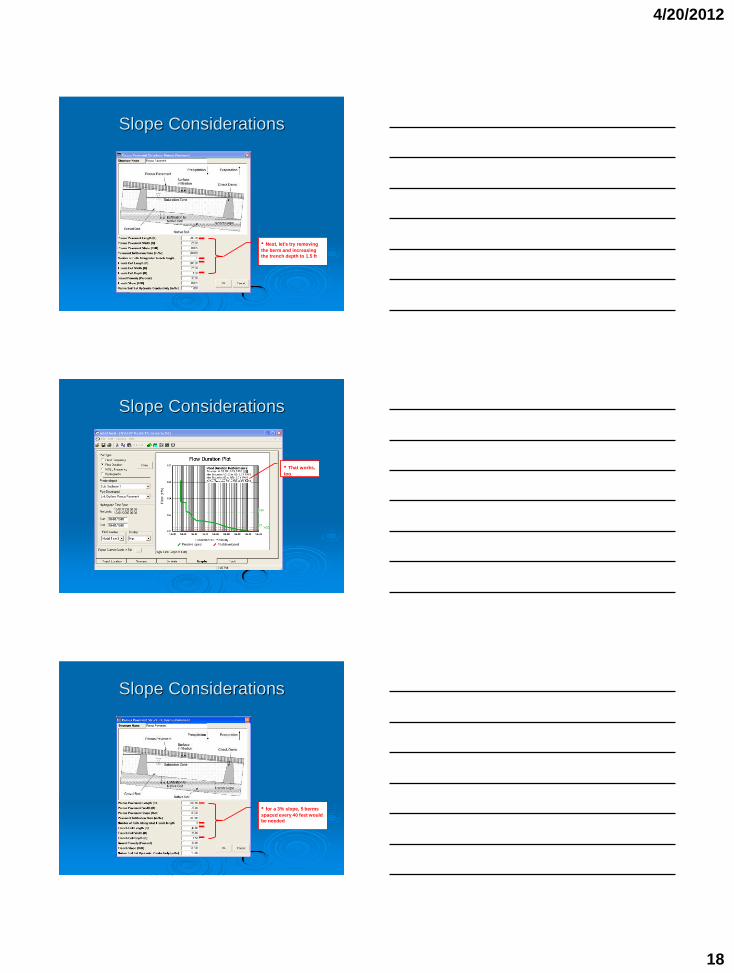
Slope Considerations
• Next, let’s try removing
the berm and increasing
the trench depth to 1.5 ft
Slope Considerations
• That works,
too
Slope Considerations
• for a 3% slope, 5 berms
spaced every 40 feet would
be needed

4/20/2012
19
Peak Flow Reduction
Draw Hydrographs
Output Report

4/20/2012
20
Resources LID Technical Guidance Manual http://www.pierce.wsu.edu/Water_Quality/LID/LID_manual2005.pdf
(Draft 2012 Manual does not yet have modeling section developed)
WWHM http://www.clearcreeksolutions.com/
MGSFlood http://www.mgsengr.com/MGSFlood.html
HSPF http://water.usgs.gov/software/HSPF/
WDMUtils http://www.epa.gov/waterscience/basins/b3webdwn.htm
Questions and Answers
???
Contact Information
Alice Lancaster, PE [email protected]
Robin Kirschbaum, PE, LEED [email protected]