performance report primergy bx922 s2 - fujitsu · sap sd ... white paper performance report...
TRANSCRIPT

WHITE PAPER PERFORMANCE REPORT PRIMERGY BX922 S2
© Fujitsu Technology Solutions 2010-2011 Page 1 (45)
WHITE PAPER FUJITSU PRIMERGY SERVERS PERFORMANCE REPORT PRIMERGY BX922 S2
This document contains a summary of all the benchmarks executed for the PRIMERGY BX922 S2.
The PRIMERGY BX922 S2 performance data is compared with the data of other PRIMERGY models and discussed. In addition to the benchmark results, an explanation has been included for each benchmark and for the benchmark environment.
Version
2.0a
2011-12-21
Contents
Document history ................................... 2
Technical data ........................................ 4
SPECcpu2006 ........................................ 5
SPECjbb2005 ....................................... 14
StorageBench ....................................... 17
OLTP-2 ................................................. 21
SAP SD ................................................ 28
vServCon .............................................. 31
VMmark V1 ........................................... 39
STREAM ............................................... 42
Literature .............................................. 44
Contact ................................................. 45
WHITE PAPER PERFORMANCE REPORT PRIMERGY BX922 S2 VERSION: 2.0A 2011-12-21
Page 2 (45) © Fujitsu Technology Solutions 2010-2011
Document history
Version 1.0
First report version with the benchmark sections
SPECcpu2006 Measurements with Xeon E5507, X5570, L5630, E5620, E5630, E5640, L5640, X5650, X5660, X5670 and X5680
SPECjbb2005 Measurements with Xeon X5570 and X5680
StorageBench Measurements with Onboard SATA Controller
SAP SD Certification number 2010008
Version 1.0a
Updated benchmark chapters:
SAP SD Benchmark comparison revised
Version 1.1
New benchmark chapters:
vServCon Measurements with Xeon E5507, L5609, L5630, E5620, E5630, E5640, X5667, X5677, L5640, X5650, X5660, X5670, X5680
VMmark V1 Measurements with Xeon X5677 and X5680
Updated benchmark chapters:
SPECcpu2006 Measurements with Xeon E5503, E5506, E5507, L5609, E5620, E5630, X5667, X5677, X5650, X5660 and X5670
Version 1.2
Updated benchmark chapters:
SPECcpu2006 Measurements with Xeon L5640, X5650 and X5670
Version 1.3
New benchmark chapters:
OLTP-2 Results for Xeon E5503, E5506, E5507, E5620, E5630, E5640, L5609, L5630, L5640, X5650, X5660, X5667, X5670, X5677, X5680
Updated Benchmark chapters:
SPECcpu2006 Measurements with Xeon E5506
Version 2.0
New benchmark chapters:
STREAM Measurements with Xeon E5603, E5606, E5607, E5645, E5649, X5647, X5675, X5687 and X5690

WHITE PAPER PERFORMANCE REPORT PRIMERGY BX922 S2 VERSION: 2.0A 2011-12-21
© Fujitsu Technology Solutions 2010-2011 Page 3 (45)
Updated benchmark chapters:
SPECcpu2006 Measurements with Xeon E5603, E5606, E5607, E5645, E5649, X5647, X5675, X5687 and X5690 (Intel C++/Fortran-Compiler 12.0)
SPECjbb2005 Measurement with Xeon X5690
OLTP-2 New results for Xeon 55xx and 56xx processor series
vServCon New results for Xeon 55xx and 56xx processor series
Version 2.0a
Minor corrections

WHITE PAPER PERFORMANCE REPORT PRIMERGY BX922 S2 VERSION: 2.0A 2011-12-21
Page 4 (45) © Fujitsu Technology Solutions 2010-2011
Technical data
The PRIMERGY BX922 S2 dual socket server blades have an Intel 5520 chip set, two Intel Xeon Series 5500 or 5600 processors (Dual-Core, Quad-Core or Hexa-Core), 12 DIMM slots for up to 192 GB DDR3-SDRAM, two 2-channel GBit LAN controllers and an onboard controller for a 2.5” SATA hard disk or up to two SSDs.
Detailed technical information is available in the
data sheet PRIMERGY BX400 S1 data sheet PRIMERGY BX900 S1 data sheet PRIMERGY BX922 S2
WHITE PAPER PERFORMANCE REPORT PRIMERGY BX922 S2 VERSION: 2.0A 2011-12-21
© Fujitsu Technology Solutions 2010-2011 Page 5 (45)
SPECcpu2006
Benchmark description
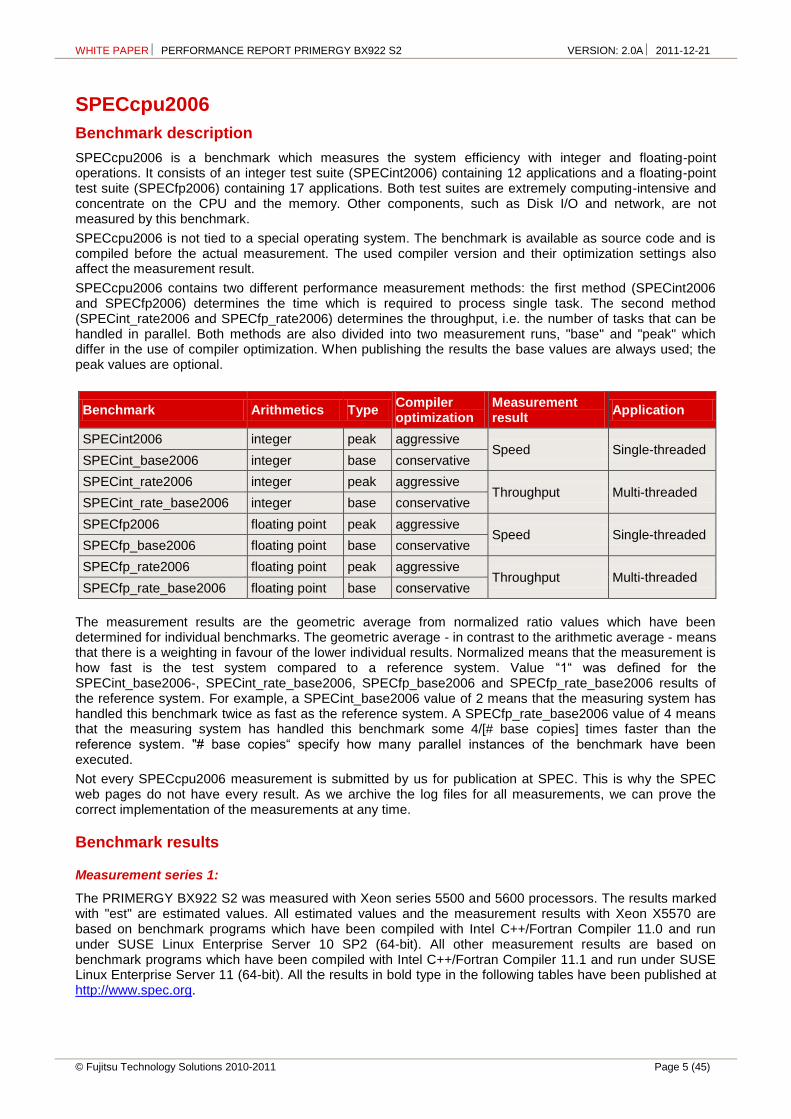
SPECcpu2006 is a benchmark which measures the system efficiency with integer and floating-point operations. It consists of an integer test suite (SPECint2006) containing 12 applications and a floating-point test suite (SPECfp2006) containing 17 applications. Both test suites are extremely computing-intensive and concentrate on the CPU and the memory. Other components, such as Disk I/O and network, are not measured by this benchmark.
SPECcpu2006 is not tied to a special operating system. The benchmark is available as source code and is compiled before the actual measurement. The used compiler version and their optimization settings also affect the measurement result.
SPECcpu2006 contains two different performance measurement methods: the first method (SPECint2006 and SPECfp2006) determines the time which is required to process single task. The second method (SPECint_rate2006 and SPECfp_rate2006) determines the throughput, i.e. the number of tasks that can be handled in parallel. Both methods are also divided into two measurement runs, "base" and "peak" which differ in the use of compiler optimization. When publishing the results the base values are always used; the peak values are optional.
Benchmark Arithmetics Type Compiler optimization
Measurement result
Application
SPECint2006 integer peak aggressive Speed Single-threaded
SPECint_base2006 integer base conservative
SPECint_rate2006 integer peak aggressive Throughput Multi-threaded
SPECint_rate_base2006 integer base conservative
SPECfp2006 floating point peak aggressive Speed Single-threaded
SPECfp_base2006 floating point base conservative
SPECfp_rate2006 floating point peak aggressive Throughput Multi-threaded
SPECfp_rate_base2006 floating point base conservative
The measurement results are the geometric average from normalized ratio values which have been determined for individual benchmarks. The geometric average - in contrast to the arithmetic average - means that there is a weighting in favour of the lower individual results. Normalized means that the measurement is how fast is the test system compared to a reference system. Value “1“ was defined for the SPECint_base2006-, SPECint_rate_base2006, SPECfp_base2006 and SPECfp_rate_base2006 results of the reference system. For example, a SPECint_base2006 value of 2 means that the measuring system has handled this benchmark twice as fast as the reference system. A SPECfp_rate_base2006 value of 4 means that the measuring system has handled this benchmark some 4/[# base copies] times faster than the reference system. "# base copies“ specify how many parallel instances of the benchmark have been executed.
Not every SPECcpu2006 measurement is submitted by us for publication at SPEC. This is why the SPEC web pages do not have every result. As we archive the log files for all measurements, we can prove the correct implementation of the measurements at any time.
Benchmark results
Measurement series 1:
The PRIMERGY BX922 S2 was measured with Xeon series 5500 and 5600 processors. The results marked with "est" are estimated values. All estimated values and the measurement results with Xeon X5570 are based on benchmark programs which have been compiled with Intel C++/Fortran Compiler 11.0 and run under SUSE Linux Enterprise Server 10 SP2 (64-bit). All other measurement results are based on benchmark programs which have been compiled with Intel C++/Fortran Compiler 11.1 and run under SUSE Linux Enterprise Server 11 (64-bit). All the results in bold type in the following tables have been published at http://www.spec.org.

WHITE PAPER PERFORMANCE REPORT PRIMERGY BX922 S2 VERSION: 2.0A 2011-12-21
Page 6 (45) © Fujitsu Technology Solutions 2010-2011
Processor Cores GHz L3 cache QPI
speed TDP
SPECint_base2006 2 chips
SPECint2006 2 chips
Xeon E5502 2 1.87 4 MB 4.80 GT/s 80 Watt 17.9 (est.) 19.9 (est.)
Xeon E5503 2 2 4 MB 4.80 GT/s 80 Watt 20.8 22.4
Xeon E5506 4 2.13 4 MB 4.80 GT/s 80 Watt 22.0 23.9
Xeon E5507 4 2.27 4 MB 4.80 GT/s 80 Watt 23.1 25.1
Xeon L5520 4 2.27 8 MB 5.86 GT/s 60 Watt 24.2 (est.) 26.9 (est.)
Xeon E5520 4 2.27 8 MB 5.86 GT/s 80 Watt 24.2 (est.) 26.9 (est.)
Xeon E5540 4 2.53 8 MB 5.86 GT/s 80 Watt 26.5 (est.) 29.6 (est.)
Xeon X5550 4 2.67 8 MB 6.40 GT/s 95 Watt 29.2 (est.) 32.6 (est.)
Xeon X5570 4 2.93 8 MB 6.40 GT/s 95 Watt 31.3 (est.) 35.0 (est.)
Xeon L5609 4 1.87 12 MB 4.80 GT/s 40 Watt 21.3 22.7
Xeon L5630 4 2.13 12 MB 5.86 GT/s 40 Watt 26.0 28.0
Xeon E5620 4 2.40 12 MB 5.86 GT/s 80 Watt 29.5 31.8
Xeon E5630 4 2.53 12 MB 5.86 GT/s 80 Watt 30.7 33.1
Xeon E5640 4 2.67 12 MB 5.86 GT/s 80 Watt 32.0 34.6
Xeon X5667 4 3.07 12 MB 6.40 GT/s 95 Watt 37.8 40.8
Xeon X5677 4 3.47 12 MB 6.40 GT/s 130 Watt 40.1 43.4
Xeon L5640 6 2.27 12 MB 5.86 GT/s 60 Watt 30.4 33.0
Xeon X5650 6 2.67 12 MB 6.40 GT/s 95 Watt 34.3 36.9
Xeon X5660 6 2.80 12 MB 6.40 GT/s 95 Watt 35.5 38.3
Xeon X5670 6 2.93 12 MB 6.40 GT/s 95 Watt 36.5 39.4
Xeon X5680 6 3.33 12 MB 6.40 GT/s 130 Watt 39.0 42.3
Processor Cores GHz L3 cache QPI
speed TDP
SPECint_rate_base2006 SPECint_rate2006
1 chip 2 chips 1 chip 2 chips
Xeon E5502 2 1.87 4 MB 4.80 GT/s 80 Watt 33.4 (est.) 66.0 (est.) 36.0 (est.) 71.0 (est.)
Xeon E5503 2 2 4 MB 4.80 GT/s 80 Watt 37.1 72.7 40.2 79.0
Xeon E5506 4 2.13 4 MB 4.80 GT/s 80 Watt 71.1 139 76.1 148
Xeon E5507 4 2.27 4 MB 4.80 GT/s 80 Watt 74.2 144 79.2 154
Xeon L5520 4 2.27 8 MB 5.86 GT/s 60 Watt 96.0 (est.) 185 (est.) 103 (est.) 200 (est.)
Xeon E5520 4 2.27 8 MB 5.86 GT/s 80 Watt 96.0 (est.) 187 (est.) 103 (est.) 201 (est.)
Xeon E5540 4 2.53 8 MB 5.86 GT/s 80 Watt 103 (est.) 200 (est.) 111 (est.) 216 (est.)
Xeon X5550 4 2.67 8 MB 6.40 GT/s 95 Watt 113 (est.) 224 (est.) 122 (est.) 241 (est.)
Xeon X5570 4 2.93 8 MB 6.40 GT/s 95 Watt 121 (est.) 238 130 (est.) 257
Xeon L5609 4 1.87 12 MB 4.80 GT/s 40 Watt 69.9 135 75.7 146
Xeon L5630 4 2.13 12 MB 5.86 GT/s 40 Watt 93.6 177 99.0 186
Xeon E5620 4 2.40 12 MB 5.86 GT/s 80 Watt 107 210 114 224
Xeon E5630 4 2.53 12 MB 5.86 GT/s 80 Watt 112 217 118 231
Xeon E5640 4 2.67 12 MB 5.86 GT/s 80 Watt 116 226 122 238
Xeon X5667 4 3.07 12 MB 6.40 GT/s 95 Watt 137 268 145 284
Xeon X5677 4 3.47 12 MB 6.40 GT/s 130 Watt 145 283 153 301
Xeon L5640 6 2.27 12 MB 5.86 GT/s 60 Watt 144 275 154 295
Xeon X5650 6 2.67 12 MB 6.40 GT/s 95 Watt 165 322 175 344
Xeon X5660 6 2.80 12 MB 6.40 GT/s 95 Watt 170 330 180 353
Xeon X5670 6 2.93 12 MB 6.40 GT/s 95 Watt 174 337 185 362
Xeon X5680 6 3.33 12 MB 6.40 GT/s 130 Watt 181 354 192 381

WHITE PAPER PERFORMANCE REPORT PRIMERGY BX922 S2 VERSION: 2.0A 2011-12-21
© Fujitsu Technology Solutions 2010-2011 Page 7 (45)
Processor Cores GHz L3 cache QPI
speed TDP
SPECfp_base2006 2 chips
SPECfp2006 2 chips
Xeon E5502 2 1.87 4 MB 4.80 GT/s 80 Watt 21.9 (est.) 23.2 (est.)
Xeon E5503 2 2 4 MB 4.80 GT/s 80 Watt 24.2 26.0
Xeon E5506 4 2.13 4 MB 4.80 GT/s 80 Watt 26.1 28.1
Xeon E5507 4 2.27 4 MB 4.80 GT/s 80 Watt 27.3 29.2
Xeon L5520 4 2.27 8 MB 5.86 GT/s 60 Watt 29.8 (est.) 31.6 (est.)
Xeon E5520 4 2.27 8 MB 5.86 GT/s 80 Watt 29.8 (est.) 31.6 (est.)
Xeon E5540 4 2.53 8 MB 5.86 GT/s 80 Watt 32.3 (est.) 34.3 (est.)
Xeon X5550 4 2.67 8 MB 6.40 GT/s 95 Watt 35.3 (est.) 37.7 (est.)
Xeon X5570 4 2.93 8 MB 6.40 GT/s 95 Watt 37.1 (est.) 39.7 (est.)
Xeon L5609 4 1.87 12 MB 4.80 GT/s 40 Watt 25.7 27.6
Xeon L5630 4 2.13 12 MB 5.86 GT/s 40 Watt 30.4 32.8
Xeon E5620 4 2.40 12 MB 5.86 GT/s 80 Watt 34.6 37.2
Xeon E5630 4 2.53 12 MB 5.86 GT/s 80 Watt 35.4 38.1
Xeon E5640 4 2.67 12 MB 5.86 GT/s 80 Watt 36.6 39.3
Xeon X5667 4 3.07 12 MB 6.40 GT/s 95 Watt 43.2 46.5
Xeon X5677 4 3.47 12 MB 6.40 GT/s 130 Watt 45.3 48.8
Xeon L5640 6 2.27 12 MB 5.86 GT/s 60 Watt 36.1 39.1
Xeon X5650 6 2.67 12 MB 6.40 GT/s 95 Watt 40.3 43.2
Xeon X5660 6 2.80 12 MB 6.40 GT/s 95 Watt 41.3 44.3
Xeon X5670 6 2.93 12 MB 6.40 GT/s 95 Watt 42.1 45.3
Xeon X5680 6 3.33 12 MB 6.40 GT/s 130 Watt 44.3 47.9
Processor Cores GHz L3 cache QPI
speed TDP
SPECfp_rate_base2006 SPECfp_rate2006
1 chip 2 chips 1 chip 2 chips
Xeon E5502 2 1.87 4 MB 4.80 GT/s 80 Watt 35.0 (est.) 67.8 (est.) 36.3 (est.) 70.7 (est.)
Xeon E5503 2 2 4 MB 4.80 GT/s 80 Watt 37.5 72.4 38.8 75.1
Xeon E5506 4 2.13 4 MB 4.80 GT/s 80 Watt 60.6 117 62.3 120
Xeon E5507 4 2.27 4 MB 4.80 GT/s 80 Watt 62.3 120 64.2 123
Xeon L5520 4 2.27 8 MB 5.86 GT/s 60 Watt 80.2 (est.) 152 (est.) 82.9 (est.) 158 (est.)
Xeon E5520 4 2.27 8 MB 5.86 GT/s 80 Watt 80.2 (est.) 154 (est.) 82.9 (est.) 160 (est.)
Xeon E5540 4 2.53 8 MB 5.86 GT/s 80 Watt 84.4 (est.) 162 (est.) 87.3 (est.) 168 (est.)
Xeon X5550 4 2.67 8 MB 6.40 GT/s 95 Watt 93.7 (est.) 183 (est.) 97.3 (est.) 190 (est.)
Xeon X5570 4 2.93 8 MB 6.40 GT/s 95 Watt 97.8 (est.) 191 102 (est.) 199
Xeon L5609 4 1.87 12 MB 4.80 GT/s 40 Watt 63.2 116 65.4 120
Xeon L5630 4 2.13 12 MB 5.86 GT/s 40 Watt 73.4 133 75.8 137
Xeon E5620 4 2.40 12 MB 5.86 GT/s 80 Watt 84.6 164 87.8 170
Xeon E5630 4 2.53 12 MB 5.86 GT/s 80 Watt 86.9 166 90.2 173
Xeon E5640 4 2.67 12 MB 5.86 GT/s 80 Watt 88.9 171 91.9 176
Xeon X5667 4 3.07 12 MB 6.40 GT/s 95 Watt 106 203 110 211
Xeon X5677 4 3.47 12 MB 6.40 GT/s 130 Watt 110 214 114 222
Xeon L5640 6 2.27 12 MB 5.86 GT/s 60 Watt 107 198 110 205
Xeon X5650 6 2.67 12 MB 6.40 GT/s 95 Watt 119 233 124 240
Xeon X5660 6 2.80 12 MB 6.40 GT/s 95 Watt 121 237 125 244
Xeon X5670 6 2.93 12 MB 6.40 GT/s 95 Watt 123 241 128 249
Xeon X5680 6 3.33 12 MB 6.40 GT/s 130 Watt 127 248 131 256
WHITE PAPER PERFORMANCE REPORT PRIMERGY BX922 S2 VERSION: 2.0A 2011-12-21
Page 8 (45) © Fujitsu Technology Solutions 2010-2011
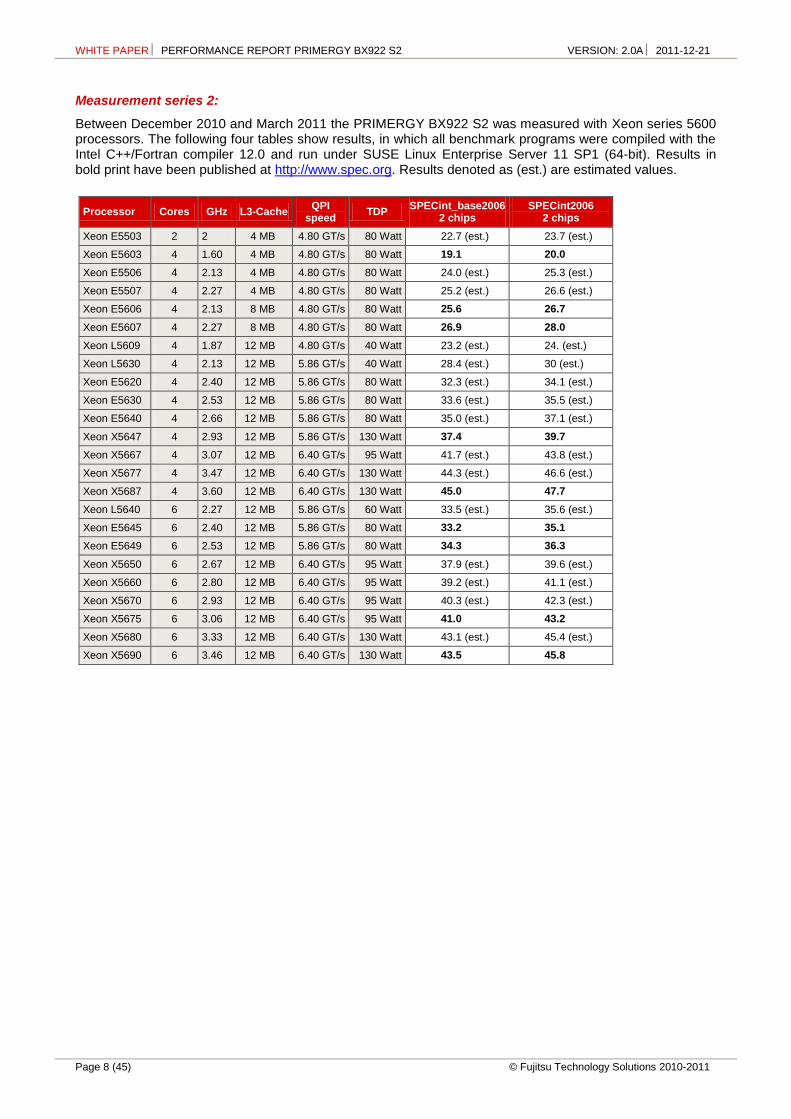
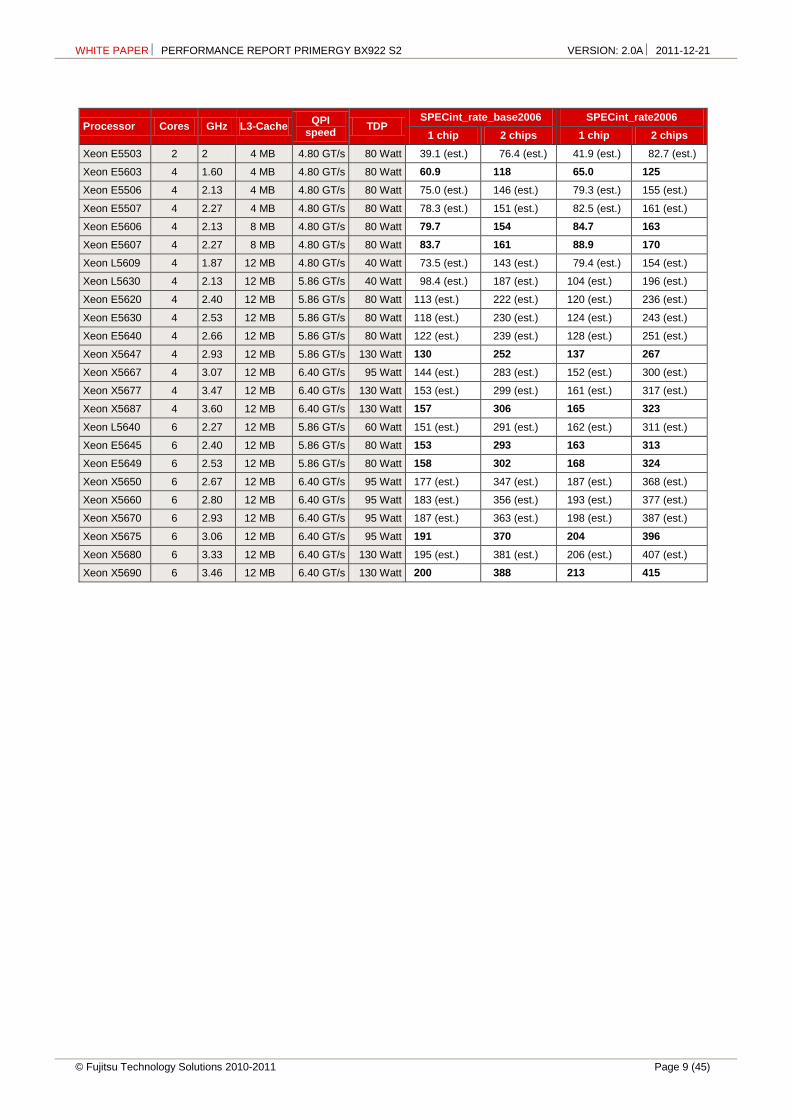
Measurement series 2:
Between December 2010 and March 2011 the PRIMERGY BX922 S2 was measured with Xeon series 5600 processors. The following four tables show results, in which all benchmark programs were compiled with the Intel C++/Fortran compiler 12.0 and run under SUSE Linux Enterprise Server 11 SP1 (64-bit). Results in bold print have been published at http://www.spec.org. Results denoted as (est.) are estimated values.
Processor Cores GHz L3-Cache QPI
speed TDP
SPECint_base2006 2 chips
SPECint2006 2 chips
Xeon E5503 2 2 4 MB 4.80 GT/s 80 Watt 22.7 (est.) 23.7 (est.)
Xeon E5603 4 1.60 4 MB 4.80 GT/s 80 Watt 19.1 20.0
Xeon E5506 4 2.13 4 MB 4.80 GT/s 80 Watt 24.0 (est.) 25.3 (est.)
Xeon E5507 4 2.27 4 MB 4.80 GT/s 80 Watt 25.2 (est.) 26.6 (est.)
Xeon E5606 4 2.13 8 MB 4.80 GT/s 80 Watt 25.6 26.7
Xeon E5607 4 2.27 8 MB 4.80 GT/s 80 Watt 26.9 28.0
Xeon L5609 4 1.87 12 MB 4.80 GT/s 40 Watt 23.2 (est.) 24. (est.)
Xeon L5630 4 2.13 12 MB 5.86 GT/s 40 Watt 28.4 (est.) 30 (est.)
Xeon E5620 4 2.40 12 MB 5.86 GT/s 80 Watt 32.3 (est.) 34.1 (est.)
Xeon E5630 4 2.53 12 MB 5.86 GT/s 80 Watt 33.6 (est.) 35.5 (est.)
Xeon E5640 4 2.66 12 MB 5.86 GT/s 80 Watt 35.0 (est.) 37.1 (est.)
Xeon X5647 4 2.93 12 MB 5.86 GT/s 130 Watt 37.4 39.7
Xeon X5667 4 3.07 12 MB 6.40 GT/s 95 Watt 41.7 (est.) 43.8 (est.)
Xeon X5677 4 3.47 12 MB 6.40 GT/s 130 Watt 44.3 (est.) 46.6 (est.)
Xeon X5687 4 3.60 12 MB 6.40 GT/s 130 Watt 45.0 47.7
Xeon L5640 6 2.27 12 MB 5.86 GT/s 60 Watt 33.5 (est.) 35.6 (est.)
Xeon E5645 6 2.40 12 MB 5.86 GT/s 80 Watt 33.2 35.1
Xeon E5649 6 2.53 12 MB 5.86 GT/s 80 Watt 34.3 36.3
Xeon X5650 6 2.67 12 MB 6.40 GT/s 95 Watt 37.9 (est.) 39.6 (est.)
Xeon X5660 6 2.80 12 MB 6.40 GT/s 95 Watt 39.2 (est.) 41.1 (est.)
Xeon X5670 6 2.93 12 MB 6.40 GT/s 95 Watt 40.3 (est.) 42.3 (est.)
Xeon X5675 6 3.06 12 MB 6.40 GT/s 95 Watt 41.0 43.2
Xeon X5680 6 3.33 12 MB 6.40 GT/s 130 Watt 43.1 (est.) 45.4 (est.)
Xeon X5690 6 3.46 12 MB 6.40 GT/s 130 Watt 43.5 45.8
WHITE PAPER PERFORMANCE REPORT PRIMERGY BX922 S2 VERSION: 2.0A 2011-12-21
© Fujitsu Technology Solutions 2010-2011 Page 9 (45)
Processor Cores GHz L3-Cache QPI
speed TDP
SPECint_rate_base2006 SPECint_rate2006
1 chip 2 chips 1 chip 2 chips
Xeon E5503 2 2 4 MB 4.80 GT/s 80 Watt 39.1 (est.) 76.4 (est.) 41.9 (est.) 82.7 (est.)
Xeon E5603 4 1.60 4 MB 4.80 GT/s 80 Watt 60.9 118 65.0 125
Xeon E5506 4 2.13 4 MB 4.80 GT/s 80 Watt 75.0 (est.) 146 (est.) 79.3 (est.) 155 (est.)
Xeon E5507 4 2.27 4 MB 4.80 GT/s 80 Watt 78.3 (est.) 151 (est.) 82.5 (est.) 161 (est.)
Xeon E5606 4 2.13 8 MB 4.80 GT/s 80 Watt 79.7 154 84.7 163
Xeon E5607 4 2.27 8 MB 4.80 GT/s 80 Watt 83.7 161 88.9 170
Xeon L5609 4 1.87 12 MB 4.80 GT/s 40 Watt 73.5 (est.) 143 (est.) 79.4 (est.) 154 (est.)
Xeon L5630 4 2.13 12 MB 5.86 GT/s 40 Watt 98.4 (est.) 187 (est.) 104 (est.) 196 (est.)
Xeon E5620 4 2.40 12 MB 5.86 GT/s 80 Watt 113 (est.) 222 (est.) 120 (est.) 236 (est.)
Xeon E5630 4 2.53 12 MB 5.86 GT/s 80 Watt 118 (est.) 230 (est.) 124 (est.) 243 (est.)
Xeon E5640 4 2.66 12 MB 5.86 GT/s 80 Watt 122 (est.) 239 (est.) 128 (est.) 251 (est.)
Xeon X5647 4 2.93 12 MB 5.86 GT/s 130 Watt 130 252 137 267
Xeon X5667 4 3.07 12 MB 6.40 GT/s 95 Watt 144 (est.) 283 (est.) 152 (est.) 300 (est.)
Xeon X5677 4 3.47 12 MB 6.40 GT/s 130 Watt 153 (est.) 299 (est.) 161 (est.) 317 (est.)
Xeon X5687 4 3.60 12 MB 6.40 GT/s 130 Watt 157 306 165 323
Xeon L5640 6 2.27 12 MB 5.86 GT/s 60 Watt 151 (est.) 291 (est.) 162 (est.) 311 (est.)
Xeon E5645 6 2.40 12 MB 5.86 GT/s 80 Watt 153 293 163 313
Xeon E5649 6 2.53 12 MB 5.86 GT/s 80 Watt 158 302 168 324
Xeon X5650 6 2.67 12 MB 6.40 GT/s 95 Watt 177 (est.) 347 (est.) 187 (est.) 368 (est.)
Xeon X5660 6 2.80 12 MB 6.40 GT/s 95 Watt 183 (est.) 356 (est.) 193 (est.) 377 (est.)
Xeon X5670 6 2.93 12 MB 6.40 GT/s 95 Watt 187 (est.) 363 (est.) 198 (est.) 387 (est.)
Xeon X5675 6 3.06 12 MB 6.40 GT/s 95 Watt 191 370 204 396
Xeon X5680 6 3.33 12 MB 6.40 GT/s 130 Watt 195 (est.) 381 (est.) 206 (est.) 407 (est.)
Xeon X5690 6 3.46 12 MB 6.40 GT/s 130 Watt 200 388 213 415

WHITE PAPER PERFORMANCE REPORT PRIMERGY BX922 S2 VERSION: 2.0A 2011-12-21
Page 10 (45) © Fujitsu Technology Solutions 2010-2011
Processor Cores GHz L3-Cache QPI
speed TDP
SPECfp_base2006 2 chips
SPECfp2006 2 chips
Xeon E5503 2 2 4 MB 4.80 GT/s 80 Watt 33.0 (est.) 34.2 (est.)
Xeon E5603 4 1.60 4 MB 4.80 GT/s 80 Watt 29.5 31.3
Xeon E5506 4 2.13 4 MB 4.80 GT/s 80 Watt 35.6 (est.) 37.0 (est.)
Xeon E5507 4 2.27 4 MB 4.80 GT/s 80 Watt 37.2 (est.) 38.4 (est.)
Xeon E5606 4 2.13 8 MB 4.80 GT/s 80 Watt 36.7 39.0
Xeon E5607 4 2.27 8 MB 4.80 GT/s 80 Watt 38.2 40.4
Xeon L5609 4 1.87 12 MB 4.80 GT/s 40 Watt 35.1 (est.) 36.3 (est.)
Xeon L5630 4 2.13 12 MB 5.86 GT/s 40 Watt 40.6 (est.) 43.2 (est.)
Xeon E5620 4 2.40 12 MB 5.86 GT/s 80 Watt 46.2 (est.) 49 (est.)
Xeon E5630 4 2.53 12 MB 5.86 GT/s 80 Watt 47.3 (est.) 50.2 (est.)
Xeon E5640 4 2.66 12 MB 5.86 GT/s 80 Watt 48.2 (est.) 51.5 (est.)
Xeon X5647 4 2.93 12 MB 5.86 GT/s 130 Watt 51.5 54.8
Xeon X5667 4 3.07 12 MB 6.40 GT/s 95 Watt 58.2 (est.) 62.2 (est.)
Xeon X5677 4 3.47 12 MB 6.40 GT/s 130 Watt 61.0 (est.) 65.3 (est.)
Xeon X5687 4 3.60 12 MB 6.40 GT/s 130 Watt 61.7 65.5
Xeon L5640 6 2.27 12 MB 5.86 GT/s 60 Watt 48.3 (est.) 51.5 (est.)
Xeon E5645 6 2.40 12 MB 5.86 GT/s 80 Watt 47.4 50.8
Xeon E5649 6 2.53 12 MB 5.86 GT/s 80 Watt 49.0 52.3
Xeon X5650 6 2.67 12 MB 6.40 GT/s 95 Watt 54.3 (est.) 57.8 (est.)
Xeon X5660 6 2.80 12 MB 6.40 GT/s 95 Watt 55.6 (est.) 59.3 (est.)
Xeon X5670 6 2.93 12 MB 6.40 GT/s 95 Watt 56.7 (est.) 60.6 (est.)
Xeon X5675 6 3.06 12 MB 6.40 GT/s 95 Watt 57.6 60.9
Xeon X5680 6 3.33 12 MB 6.40 GT/s 130 Watt 59.7 (est.) 64.1 (est.)
Xeon X5690 6 3.46 12 MB 6.40 GT/s 130 Watt 60.7 64.0

WHITE PAPER PERFORMANCE REPORT PRIMERGY BX922 S2 VERSION: 2.0A 2011-12-21
© Fujitsu Technology Solutions 2010-2011 Page 11 (45)
Processor Cores GHz L3-Cache QPI
speed TDP
SPECfp_rate_base2006 SPECfp_rate2006
1 chip 2 chips 1 chip 2 chips
Xeon E5503 2 2 4 MB 4.80 GT/s 80 Watt 40.1 (est.) 75.5 (est.) 41.5 (est.) 80.1 (est.)
Xeon E5603 4 1.60 4 MB 4.80 GT/s 80 Watt 58.8 107 60.9 113
Xeon E5506 4 2.13 4 MB 4.80 GT/s 80 Watt 64.8 (est.) 122 (est.) 66.6 (est.) 128 (est.)
Xeon E5507 4 2.27 4 MB 4.80 GT/s 80 Watt 66.6 (est.) 125 (est.) 68.7 (est.) 131 (est.)
Xeon E5606 4 2.13 8 MB 4.80 GT/s 80 Watt 70.8 127 73.5 134
Xeon E5607 4 2.27 8 MB 4.80 GT/s 80 Watt 73.1 131 75.8 138
Xeon L5609 4 1.87 12 MB 4.80 GT/s 40 Watt 67.7 (est.) 124 (est.) 69.5 (est.) 128 (est.)
Xeon L5630 4 2.13 12 MB 5.86 GT/s 40 Watt 78.7 (est.) 142 (est.) 80.5 (est.) 146 (est.)
Xeon E5620 4 2.40 12 MB 5.86 GT/s 80 Watt 90.7 (est.) 176 (est.) 93.2 (est.) 182 (est.)
Xeon E5630 4 2.53 12 MB 5.86 GT/s 80 Watt 93.2 (est.) 178 (est.) 95.8 (est.) 185 (est.)
Xeon E5640 4 2.66 12 MB 5.86 GT/s 80 Watt 95.3 (est.) 183 (est.) 97.6 (est.) 188 (est.)
Xeon X5647 4 2.93 12 MB 5.86 GT/s 130 Watt 99.0 190 102 196
Xeon X5667 4 3.07 12 MB 6.40 GT/s 95 Watt 114 (est.) 213 (est.) 116 (est.) 220 (est.)
Xeon X5677 4 3.47 12 MB 6.40 GT/s 130 Watt 117 (est.) 225 (est.) 120 (est.) 232 (est.)
Xeon X5687 4 3.60 12 MB 6.40 GT/s 130 Watt 119 231 122 238
Xeon L5640 6 2.27 12 MB 5.86 GT/s 60 Watt 113 (est.) 205 (est.) 116 (est.) 214 (est.)
Xeon E5645 6 2.40 12 MB 5.86 GT/s 80 Watt 114 211 117 217
Xeon E5649 6 2.53 12 MB 5.86 GT/s 80 Watt 116 215 119 221
Xeon X5650 6 2.67 12 MB 6.40 GT/s 95 Watt 127 (est.) 245 (est.) 131 (est.) 251 (est.)
Xeon X5660 6 2.80 12 MB 6.40 GT/s 95 Watt 129 (est.) 249 (est.) 132 (est.) 255 (est.)
Xeon X5670 6 2.93 12 MB 6.40 GT/s 95 Watt 131 (est.) 253 (est.) 135 (est.) 260 (est.)
Xeon X5675 6 3.06 12 MB 6.40 GT/s 95 Watt 133 259 137 267
Xeon X5680 6 3.33 12 MB 6.40 GT/s 130 Watt 135 (est.) 260 (est.) 138 (est.) 267 (est.)
Xeon X5690 6 3.46 12 MB 6.40 GT/s 130 Watt 137 267 141 274

WHITE PAPER PERFORMANCE REPORT PRIMERGY BX922 S2 VERSION: 2.0A 2011-12-21
Page 12 (45) © Fujitsu Technology Solutions 2010-2011
The throughput with two processors both with the integer as well as the floating-point test suite is almost twice as large as that with one processor.
SPECfp_rate_base2006
SPECfp_rate2006
0
50
100
150
200
250
300
1 x Xeon X5690 2 x Xeon X5690
137
267
141
274
SPECint_rate_base2006
SPECint_rate2006
0
50
100
150
200
250
300
350
400
450
1 x Xeon X5690 2 x Xeon X5690
200
388
213
415
SPECcpu2006: integer performance PRIMERGY BX922 S2 (2 sockets vs. 1 socket)
SPECcpu2006: floating-point performance
PRIMERGY BX922 S2 (2 sockets vs. 1 socket)
WHITE PAPER PERFORMANCE REPORT PRIMERGY BX922 S2 VERSION: 2.0A 2011-12-21
© Fujitsu Technology Solutions 2010-2011 Page 13 (45)
Benchmark environment
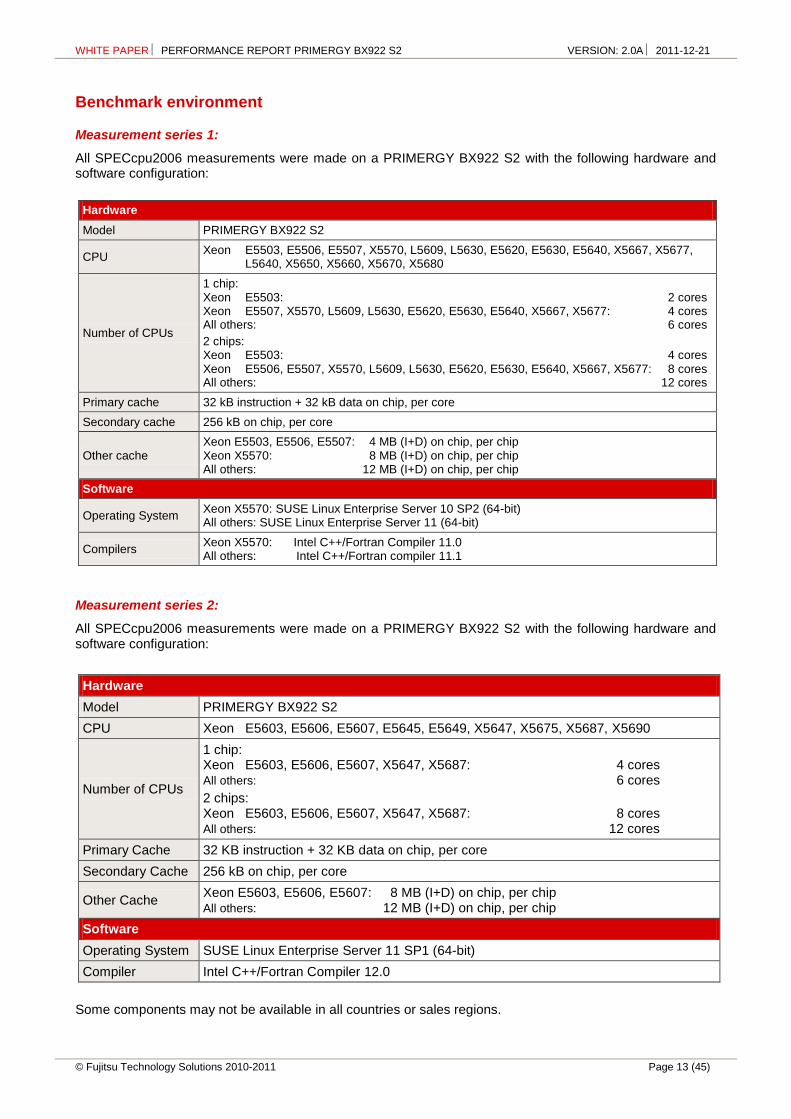
Measurement series 1:
All SPECcpu2006 measurements were made on a PRIMERGY BX922 S2 with the following hardware and software configuration:
Hardware
Model PRIMERGY BX922 S2
CPU Xeon E5503, E5506, E5507, X5570, L5609, L5630, E5620, E5630, E5640, X5667, X5677,
L5640, X5650, X5660, X5670, X5680
Number of CPUs
1 chip: Xeon E5503: 2 cores Xeon E5507, X5570, L5609, L5630, E5620, E5630, E5640, X5667, X5677: 4 cores All others: 6 cores
2 chips: Xeon E5503: 4 cores Xeon E5506, E5507, X5570, L5609, L5630, E5620, E5630, E5640, X5667, X5677: 8 cores All others: 12 cores
Primary cache 32 kB instruction + 32 kB data on chip, per core
Secondary cache 256 kB on chip, per core
Other cache Xeon E5503, E5506, E5507: 4 MB (I+D) on chip, per chip Xeon X5570: 8 MB (I+D) on chip, per chip All others: 12 MB (I+D) on chip, per chip
Software
Operating System Xeon X5570: SUSE Linux Enterprise Server 10 SP2 (64-bit) All others: SUSE Linux Enterprise Server 11 (64-bit)
Compilers Xeon X5570: Intel C++/Fortran Compiler 11.0 All others: Intel C++/Fortran compiler 11.1
Measurement series 2:
All SPECcpu2006 measurements were made on a PRIMERGY BX922 S2 with the following hardware and software configuration:
Hardware
Model PRIMERGY BX922 S2
CPU Xeon E5603, E5606, E5607, E5645, E5649, X5647, X5675, X5687, X5690
Number of CPUs
1 chip: Xeon E5603, E5606, E5607, X5647, X5687: 4 cores All others: 6 cores
2 chips: Xeon E5603, E5606, E5607, X5647, X5687: 8 cores All others: 12 cores
Primary Cache 32 KB instruction + 32 KB data on chip, per core
Secondary Cache 256 kB on chip, per core
Other Cache Xeon E5603, E5606, E5607: 8 MB (I+D) on chip, per chip All others: 12 MB (I+D) on chip, per chip
Software
Operating System SUSE Linux Enterprise Server 11 SP1 (64-bit)
Compiler Intel C++/Fortran Compiler 12.0
Some components may not be available in all countries or sales regions.

WHITE PAPER PERFORMANCE REPORT PRIMERGY BX922 S2 VERSION: 2.0A 2011-12-21
Page 14 (45) © Fujitsu Technology Solutions 2010-2011
SPECjbb2005
Benchmark description
SPECjbb2005 is a Java Business Benchmark that focuses on the performance of Java Server platforms. SPECjbb2005 is essentially a modernized version of SPECjbb2000 with the main differences being:
The transactions have become more complex in order to cover a greater functional scope. The working set of the benchmark has been enlarged to the extent that the total system load has
increased. SPECjbb2000 allows only one active Java Virtual Machine (JVM) instance whereas SPECjbb2005
permits several instances, which in turn achieves greater closeness to reality, particularly with large systems.
On the software side SPECjbb2005 primarily measures the performance of the JVM used with its just-in-time compiler as well as their thread and garbage collection implementation. Some aspects of the operating system used also play a role. As far as hardware is concerned, it measures the efficiency of the CPUs and caches, the memory subsystem, and the scalability of shared memory systems (SMP). Disk and network I/O are irrelevant.
SPECjbb2005 emulates a 3-tier client/server system that is typical for modern business process applications with the emphasis on the middle-tier system:
Clients generate the load, consisting of driver threads, which on the basis of the TPC-C benchmark generate OLTP accesses to a database without thinking times.
The middle-tier system implements the business processes and the updating of the database. The database takes on the data management and is emulated by Java objects that are in the
memory. Transaction logging is implemented on an XML basis.
The major advantage of this benchmark is that it includes all three tiers that run together on a single host. The performance of the middle-tier is measured. This avoids large-scale hardware installations and enables a direct comparison of the SPECjbb2005 results from different systems. Client and database emulation are also written in Java.
SPECjbb2005 only needs the operating system as well as a Java Virtual Machine with J2SE 5.0 features.
The scaling unit is a warehouse with approx. 25 MB Java objects. Precisely one Java thread per warehouse executes the operations on these objects. The business operations are assumed by TPC-C:
New Order Entry Payment Order Status Inquiry Delivery Stock Level Supervision Customer Report
However, these are the only features that SPECjbb2005 and TPC-C have in common. The results of the two benchmarks are not comparable.
SPECjbb2005 has two performance metrics:
bops (business operations per second) is the overall rate of all business operations performed per second.
bops/JVM is the ratio of the first metrics and the number of active JVM instances.
When comparing different SPECjbb2005 results it is necessary to state both metrics.
The following rules, according to which a compliant benchmark run has to be performed, are the basis for these metrics:
A compliant benchmark run consists of a sequence of measuring points with an increasing number of warehouses (and thus of threads) with the number in each case being increased by one warehouse. The run is started at one warehouse up through 2*MaxWh, but not less than 8 warehouses. MaxWh is the number of warehouses with the highest operation rate per second the benchmark expects. Per default, the benchmark equates MaxWh with the number of CPUs visible by the operating system.
The metric bops is the arithmetic average of all measured operation rates with MaxWh warehouses up to 2*MaxWh warehouses.

WHITE PAPER PERFORMANCE REPORT PRIMERGY BX922 S2 VERSION: 2.0A 2011-12-21
© Fujitsu Technology Solutions 2010-2011 Page 15 (45)
Benchmark results
Measurement 1
In February 2010, the PRIMERGY BX922 S2 with two Xeon X5570 processors was measured with a memory configuration of 24 GB PC3-10600R DDR3-SDRAM. The measurement was performed using Windows Server 2008 R2 Enterprise. Four J9 VM instances from IBM were used as JVM.
The following result was obtained:
SPECjbb2005 bops = 632425
SPECjbb2005 bops/JVM = 158106
The PRIMERGY BX922 S2 obtained the best result of all Intel-based 2-socket servers.1
Measurement 2
In March 2010, the PRIMERGY BX922 S2 with two Xeon X5680 processors was measured with a memory configuration of 48 GB PC3-10600R DDR3-SDRAM. The same operating system and the same JVM were used as for the Xeon X5570 measurement. Six and not four JVM instances were used.
The following result was obtained:
SPECjbb2005 bops = 927872
SPECjbb2005 bops/JVM = 154645
Measurement 2
In December 2010, the PRIMERGY BX922 S2 with two Xeon X5690 processors was measured. The measurement was performed using Windows Server 2008 Enterprise x64 Edition SP2. The configuration otherwise corresponded to the measurement of March 2010.
The following result was obtained:
SPECjbb2005 bops = 943801
SPECjbb2005 bops/JVM = 157300
1 The above comparison values for competitor products are dated 25th February 2010. The comparison presented is
based on SPECjbb2005 results for Intel-based servers with 2 processors. Current SPECjbb2005 results can be seen at http://www.spec.org/jbb2005/results.
0
200000
400000
600000
800000
1000000
1 2 3 4 5 6 7 8
warehouses
2 x Xeon X5690
2 x Xeon X5680
2 x Xeon X5570
632425
927872 943801
0
200000
400000
600000
800000
1000000
2 x Xeon X5570 2 x Xeon X5680 2 x Xeon X5690
SPECjbb2005 bops: PRIMERGY BX922 S2 SPECjbb2005 bops: PRIMERGY BX922 S2
WHITE PAPER PERFORMANCE REPORT PRIMERGY BX922 S2 VERSION: 2.0A 2011-12-21
Page 16 (45) © Fujitsu Technology Solutions 2010-2011
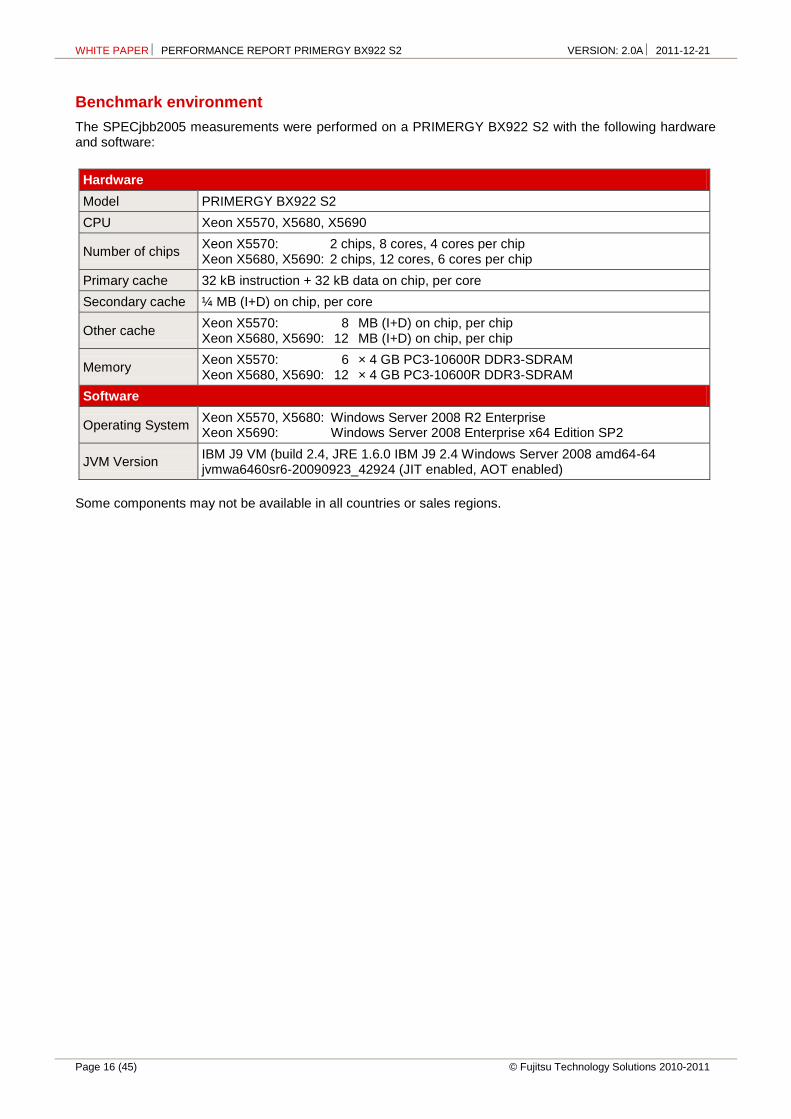
Benchmark environment
The SPECjbb2005 measurements were performed on a PRIMERGY BX922 S2 with the following hardware and software:
Hardware
Model PRIMERGY BX922 S2
CPU Xeon X5570, X5680, X5690
Number of chips Xeon X5570: 2 chips, 8 cores, 4 cores per chip Xeon X5680, X5690: 2 chips, 12 cores, 6 cores per chip
Primary cache 32 kB instruction + 32 kB data on chip, per core
Secondary cache ¼ MB (I+D) on chip, per core
Other cache Xeon X5570: 8 MB (I+D) on chip, per chip Xeon X5680, X5690: 12 MB (I+D) on chip, per chip
Memory Xeon X5570: 6 × 4 GB PC3-10600R DDR3-SDRAM Xeon X5680, X5690: 12 × 4 GB PC3-10600R DDR3-SDRAM
Software
Operating System Xeon X5570, X5680: Windows Server 2008 R2 Enterprise Xeon X5690: Windows Server 2008 Enterprise x64 Edition SP2
JVM Version IBM J9 VM (build 2.4, JRE 1.6.0 IBM J9 2.4 Windows Server 2008 amd64-64 jvmwa6460sr6-20090923_42924 (JIT enabled, AOT enabled)
Some components may not be available in all countries or sales regions.
WHITE PAPER PERFORMANCE REPORT PRIMERGY BX922 S2 VERSION: 2.0A 2011-12-21
© Fujitsu Technology Solutions 2010-2011 Page 17 (45)
StorageBench
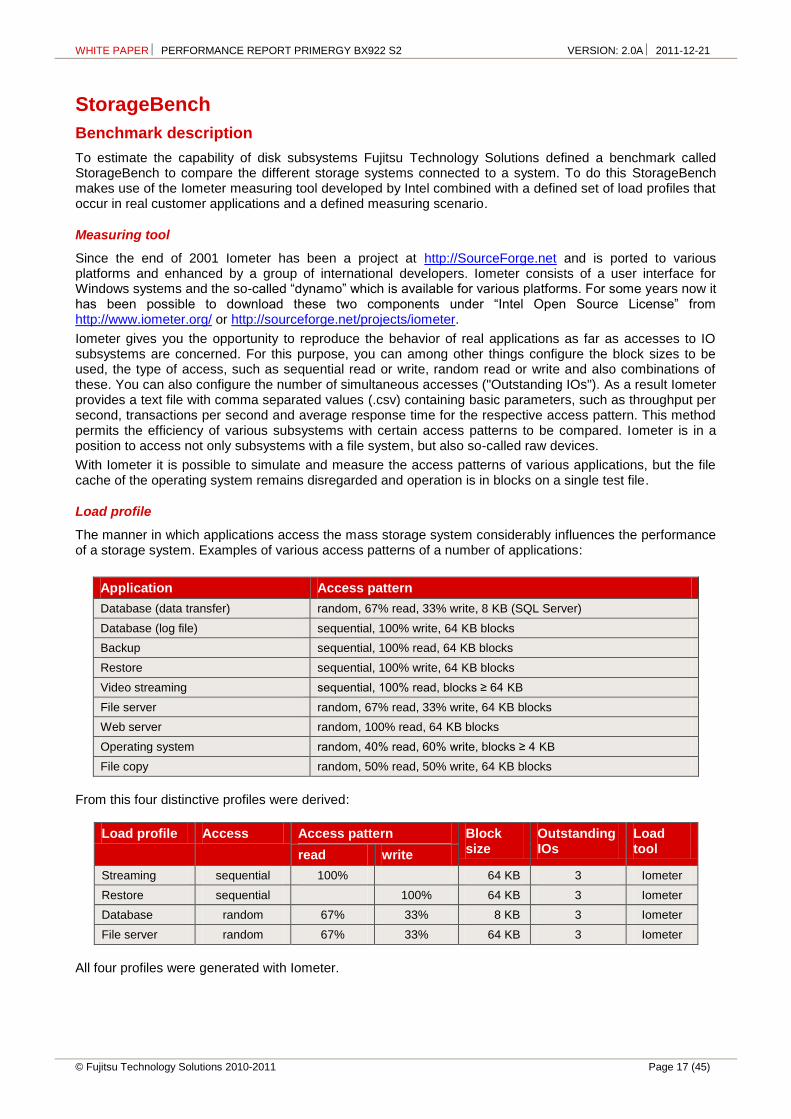
Benchmark description
To estimate the capability of disk subsystems Fujitsu Technology Solutions defined a benchmark called StorageBench to compare the different storage systems connected to a system. To do this StorageBench makes use of the Iometer measuring tool developed by Intel combined with a defined set of load profiles that occur in real customer applications and a defined measuring scenario.
Measuring tool
Since the end of 2001 Iometer has been a project at http://SourceForge.net and is ported to various platforms and enhanced by a group of international developers. Iometer consists of a user interface for Windows systems and the so-called “dynamo” which is available for various platforms. For some years now it has been possible to download these two components under “Intel Open Source License” from http://www.iometer.org/ or http://sourceforge.net/projects/iometer.
Iometer gives you the opportunity to reproduce the behavior of real applications as far as accesses to IO subsystems are concerned. For this purpose, you can among other things configure the block sizes to be used, the type of access, such as sequential read or write, random read or write and also combinations of these. You can also configure the number of simultaneous accesses ("Outstanding IOs"). As a result Iometer provides a text file with comma separated values (.csv) containing basic parameters, such as throughput per second, transactions per second and average response time for the respective access pattern. This method permits the efficiency of various subsystems with certain access patterns to be compared. Iometer is in a position to access not only subsystems with a file system, but also so-called raw devices.
With Iometer it is possible to simulate and measure the access patterns of various applications, but the file cache of the operating system remains disregarded and operation is in blocks on a single test file.
Load profile
The manner in which applications access the mass storage system considerably influences the performance of a storage system. Examples of various access patterns of a number of applications:
Application Access pattern
Database (data transfer) random, 67% read, 33% write, 8 KB (SQL Server)
Database (log file) sequential, 100% write, 64 KB blocks
Backup sequential, 100% read, 64 KB blocks
Restore sequential, 100% write, 64 KB blocks
Video streaming sequential, 100% read, blocks ≥ 64 KB
File server random, 67% read, 33% write, 64 KB blocks
Web server random, 100% read, 64 KB blocks
Operating system random, 40% read, 60% write, blocks ≥ 4 KB
File copy random, 50% read, 50% write, 64 KB blocks
From this four distinctive profiles were derived:
Load profile Access Access pattern Block size
Outstanding IOs
Load tool read write
Streaming sequential 100% 64 KB 3 Iometer
Restore sequential 100% 64 KB 3 Iometer
Database random 67% 33% 8 KB 3 Iometer
File server random 67% 33% 64 KB 3 Iometer
All four profiles were generated with Iometer.
WHITE PAPER PERFORMANCE REPORT PRIMERGY BX922 S2 VERSION: 2.0A 2011-12-21
Page 18 (45) © Fujitsu Technology Solutions 2010-2011
Measurement scenario
In order to obtain comparable measurement results it is important to perform all the measurements in identical, reproducible environments. This is why StorageBench is based, in addition to the load profile described above, on the following regulations:
Since real-life customer configurations work only in exceptional situations with raw devices, performance measurements of internal disks are always conducted on disks containing file systems. NTFS is used for Windows and ext3 for Linux, even if higher performance could possibly be achieved with other file systems or raw devices.
Hard disks are among the most error-prone components of a computer system. This is why RAID controllers are used in server systems in order to prevent data loss through hard disk failure. Here several hard disks are put together to form a “Redundant Array of Independent Disks”, known as RAID in short – with the data being spread over several hard disks in such a way that all the data is retained even if one hard disk fails – except with RAID 0. The most usual methods of organizing hard disks in arrays are the RAID levels RAID 0, RAID 1, RAID 5, RAID 6, RAID 10, RAID 50 and RAID 60. Information about the basics of various RAID arrays is to be found in the paper Performance Report - Modular RAID for PRIMERGY. Depending on the number of disks and the installed controller, the possible RAID configurations are used for the StorageBench analyses of the PRIMERGY servers. For systems with two hard disks we use RAID 1 and RAID 0, for three and more hard disks we also use RAID 1E and RAID 5 and, where applicable, further RAID levels – provided that the controller supports these RAID levels.
Regardless of the size of the hard disk, a measurement file with the size of 32 GB is always used for the measurement.
In the evaluation of the efficiency of I/O subsystems, processor performance and memory configuration do not play a significant role in today’s systems - a possible bottleneck usually affects the hard disks and the RAID controller, and not CPU and memory. Therefore, various configuration alternatives with CPU and memory need not be analyzed under StorageBench.
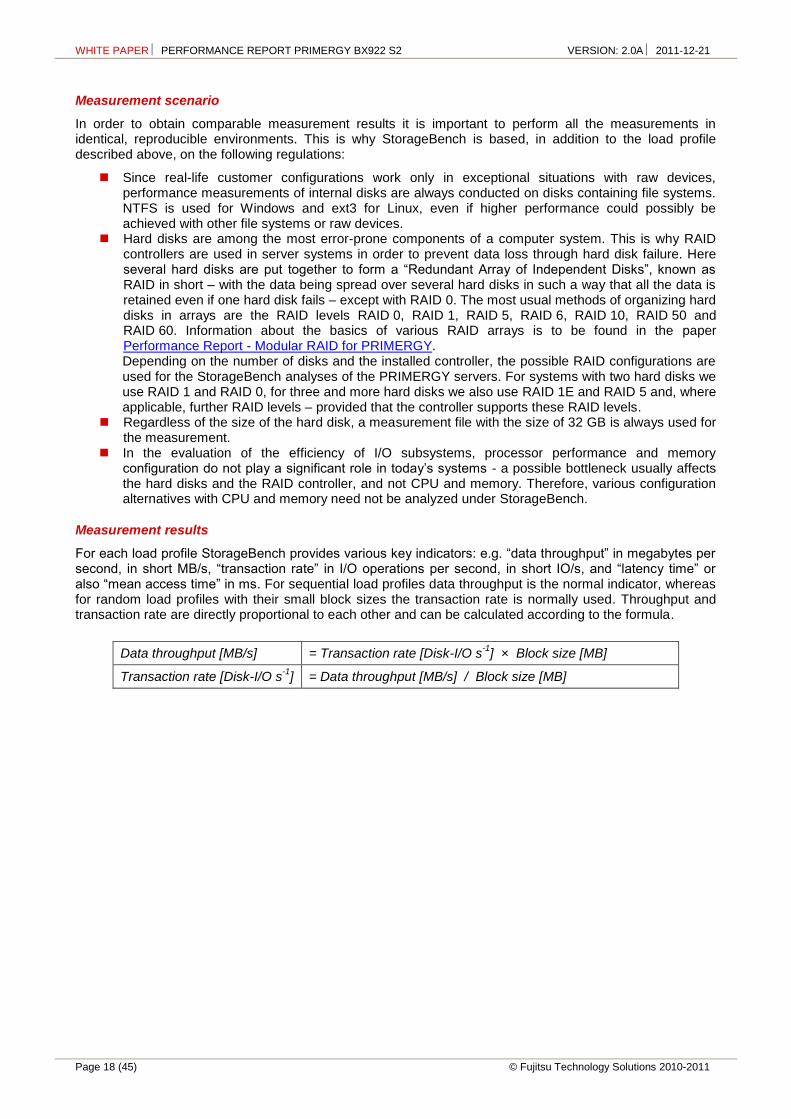
Measurement results
For each load profile StorageBench provides various key indicators: e.g. “data throughput” in megabytes per second, in short MB/s, “transaction rate” in I/O operations per second, in short IO/s, and “latency time” or also “mean access time” in ms. For sequential load profiles data throughput is the normal indicator, whereas for random load profiles with their small block sizes the transaction rate is normally used. Throughput and transaction rate are directly proportional to each other and can be calculated according to the formula.
Data throughput [MB/s] = Transaction rate [Disk-I/O s-1
] × Block size [MB]
Transaction rate [Disk-I/O s-1
] = Data throughput [MB/s] / Block size [MB]
WHITE PAPER PERFORMANCE REPORT PRIMERGY BX922 S2 VERSION: 2.0A 2011-12-21
© Fujitsu Technology Solutions 2010-2011 Page 19 (45)
Benchmark results
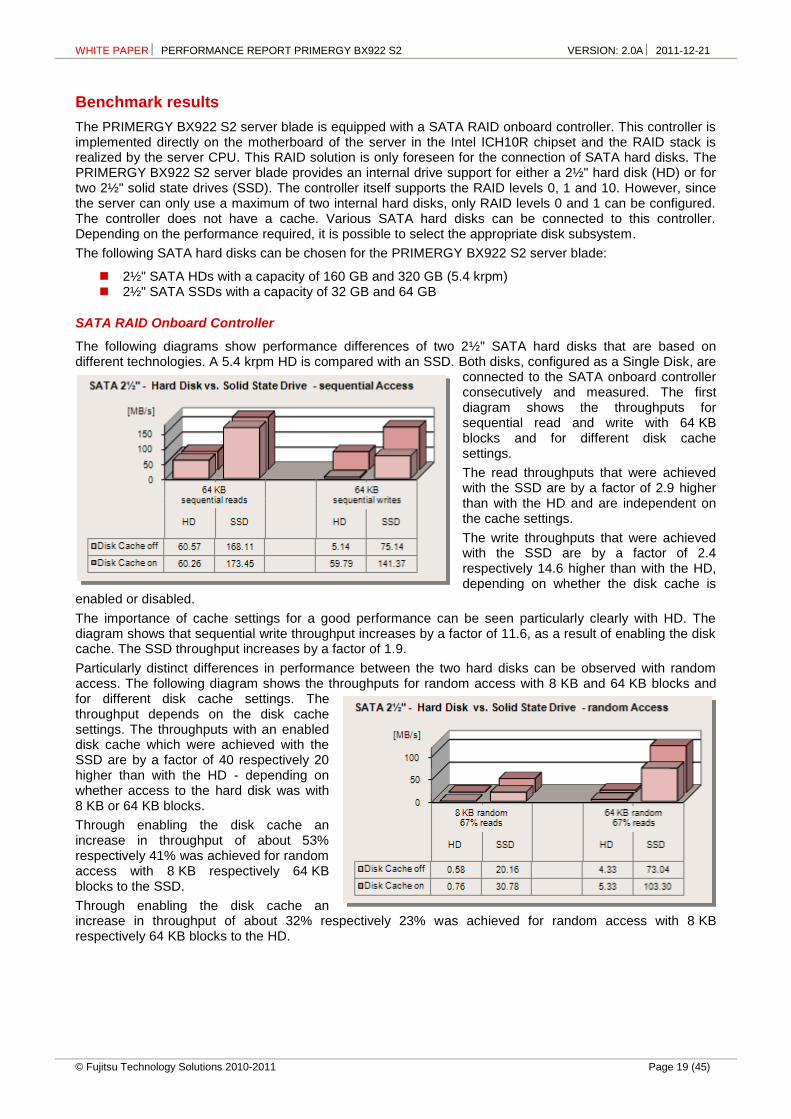
The PRIMERGY BX922 S2 server blade is equipped with a SATA RAID onboard controller. This controller is implemented directly on the motherboard of the server in the Intel ICH10R chipset and the RAID stack is realized by the server CPU. This RAID solution is only foreseen for the connection of SATA hard disks. The PRIMERGY BX922 S2 server blade provides an internal drive support for either a 2½" hard disk (HD) or for two 2½" solid state drives (SSD). The controller itself supports the RAID levels 0, 1 and 10. However, since the server can only use a maximum of two internal hard disks, only RAID levels 0 and 1 can be configured. The controller does not have a cache. Various SATA hard disks can be connected to this controller. Depending on the performance required, it is possible to select the appropriate disk subsystem.
The following SATA hard disks can be chosen for the PRIMERGY BX922 S2 server blade:
2½" SATA HDs with a capacity of 160 GB and 320 GB (5.4 krpm) 2½" SATA SSDs with a capacity of 32 GB and 64 GB
SATA RAID Onboard Controller
The following diagrams show performance differences of two 2½" SATA hard disks that are based on different technologies. A 5.4 krpm HD is compared with an SSD. Both disks, configured as a Single Disk, are
connected to the SATA onboard controller consecutively and measured. The first diagram shows the throughputs for sequential read and write with 64 KB blocks and for different disk cache settings.
The read throughputs that were achieved with the SSD are by a factor of 2.9 higher than with the HD and are independent on the cache settings.
The write throughputs that were achieved with the SSD are by a factor of 2.4 respectively 14.6 higher than with the HD, depending on whether the disk cache is
enabled or disabled.
The importance of cache settings for a good performance can be seen particularly clearly with HD. The diagram shows that sequential write throughput increases by a factor of 11.6, as a result of enabling the disk cache. The SSD throughput increases by a factor of 1.9.
Particularly distinct differences in performance between the two hard disks can be observed with random access. The following diagram shows the throughputs for random access with 8 KB and 64 KB blocks and for different disk cache settings. The throughput depends on the disk cache settings. The throughputs with an enabled disk cache which were achieved with the SSD are by a factor of 40 respectively 20 higher than with the HD - depending on whether access to the hard disk was with 8 KB or 64 KB blocks.
Through enabling the disk cache an increase in throughput of about 53% respectively 41% was achieved for random access with 8 KB respectively 64 KB blocks to the SSD.
Through enabling the disk cache an increase in throughput of about 32% respectively 23% was achieved for random access with 8 KB respectively 64 KB blocks to the HD.
WHITE PAPER PERFORMANCE REPORT PRIMERGY BX922 S2 VERSION: 2.0A 2011-12-21
Page 20 (45) © Fujitsu Technology Solutions 2010-2011
Conclusion
With the onboard SATA RAID controller the PRIMERGY BX922 S2 server blade offers the user both good and low-cost solution options to fulfill its requirements.
The PRIMERGY BX922 S2 server blade offers a choice between two 2½" SATA solid state drives (SSDs) or one 2½" 5.4 krpm SATA hard disk (HD). The SSDs supply considerably higher throughputs, shorter latency periods and a higher number of IOs per second than the HDs. On the other hand, the HDs offer higher storage capacities, which are also substantially lower-priced per GB. Depending on the required performance and objective, a decision has to be made as to which hard disk type is to be used.
For maximum performance it is advisable to enable the disk cache. Depending on the disk type and access pattern used, the increase in performance is 11.6-fold. When the disk cache is enabled we recommend the use of a UPS.
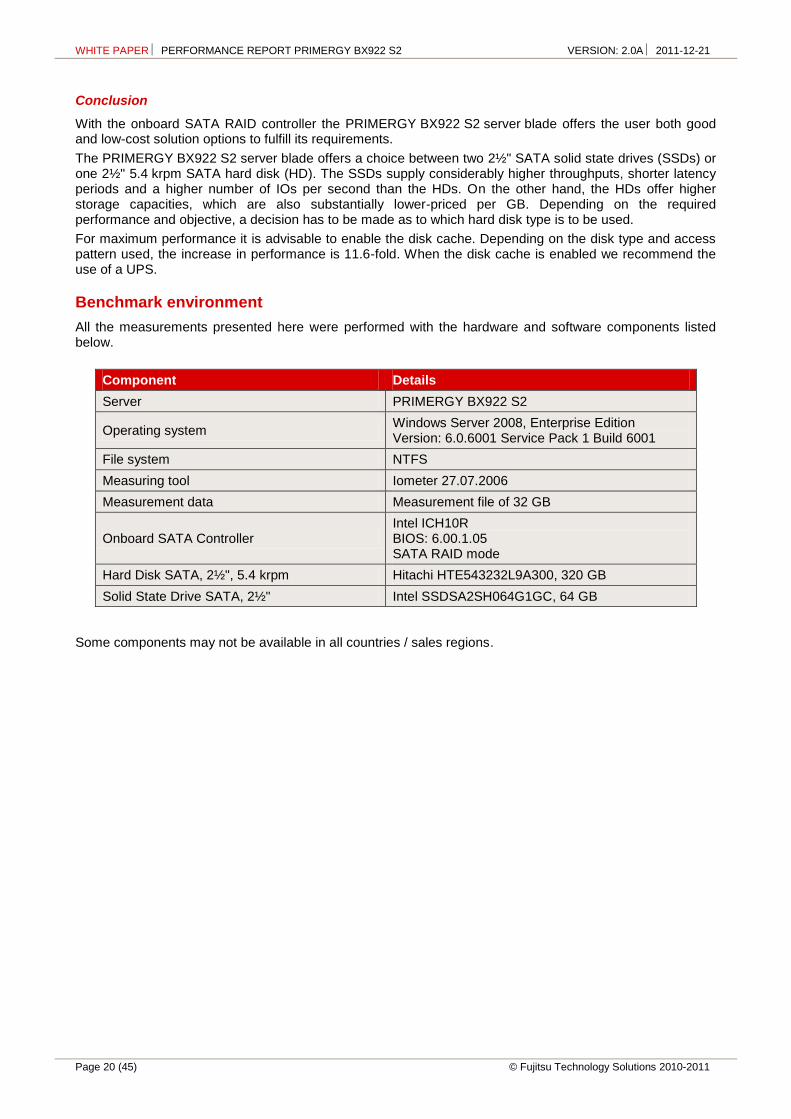
Benchmark environment
All the measurements presented here were performed with the hardware and software components listed below.
Component Details
Server PRIMERGY BX922 S2
Operating system Windows Server 2008, Enterprise Edition Version: 6.0.6001 Service Pack 1 Build 6001
File system NTFS
Measuring tool Iometer 27.07.2006
Measurement data Measurement file of 32 GB
Onboard SATA Controller Intel ICH10R BIOS: 6.00.1.05 SATA RAID mode
Hard Disk SATA, 2½", 5.4 krpm Hitachi HTE543232L9A300, 320 GB
Solid State Drive SATA, 2½" Intel SSDSA2SH064G1GC, 64 GB
Some components may not be available in all countries / sales regions.

WHITE PAPER PERFORMANCE REPORT PRIMERGY BX922 S2 VERSION: 2.0A 2011-12-21
© Fujitsu Technology Solutions 2010-2011 Page 21 (45)
OLTP-2
Benchmark description
OLTP stands for Online Transaction Processing. The OLTP-2 benchmark is based on the typical application scenario of a database solution. In OLTP-2 database access is simulated and the number of transactions achieved per second (tps) determined as the unit of measurement for the system.
In contrast to benchmarks such as SPECint and TPC-E, which were standardized by independent bodies and for which adherence to the respective rules and regulations are monitored, OLTP-2 is an internal benchmark of Fujitsu. OLTP-2 is based on the well-known database benchmark TPC-E. OLTP-2 was designed in such a way that a wide range of configurations can be measured to present the scaling of a system with regard to the CPU and memory configuration.
Even if the two benchmarks OLTP-2 and TPC-E simulate similar application scenarios using the same load profiles, the results cannot be compared or even treated as equal, as the two benchmarks use different methods to simulate user load. OLTP-2 values are typically similar to TPC-E values. A direct comparison, or even referring to the OLTP-2 result as TPC-E, is not permitted, especially because there is no price-performance calculation.
Further information can be found in the document Benchmark Overview OLTP-2.
Benchmark results
The OLTP-2 values for the Intel Xeon 55xx and 56xx processor series were determined by way of example on a PRIMERGY RX300 S6 with memory configurations of 48 GB, 72 GB, 96 GB, 144 GB and 192 GB.
The following table gives you an overview of the processors considered and their properties:
Processor #Cores/ Chip
L3 Cache Processor
Frequency
QPI
Speed HT TM TDP
55
00
E5503 2 4 MB 2.00 GHz 4.8 GT/s - - 80 W
E5506 4 4 MB 2.13 GHz 4.8 GT/s - - 80 W
E5507 4 4 MB 2.27 GHz 4.8 GT/s - - 80 W
56
00
Se
rie
s
4 C
ore
s E5603 4 4 MB 1.60 GHz 4.8 GT/s - - 80 W
E5606 4 8 MB 2.13 GHz 4.8 GT/s - - 80 W
E5607 4 8 MB 2.27 GHz 4.8 GT/s - - 80 W
L5609 4 12 MB 1.87 GHz 4.8 GT/s - - 40 W
4 C
ore
s,
HT
, T
M
L5630 4 12 MB 2.13 GHz 5.86 GT/s 40 W
E5620 4 12 MB 2.40 GHz 5.86 GT/s 80 W
E5630 4 12 MB 2.53 GHz 5.86 GT/s 80 W
E5640 4 12 MB 2.67 GHz 5.86 GT/s 80 W
X5647 4 12 MB 2.93 GHz 5.86 GT/s 130 W
X5667 4 12 MB 3.07 GHz 6.4 GT/s 95 W
X5672 4 12 MB 3.20 GHz 6.4 GT/s 95 W
X5677 4 12 MB 3.46 GHz 6.4 GT/s 130 W
X5687 4 12 MB 3.60 GHz 6.4 GT/s 130 W
6 C
ore
s,
HT
, T
M
L5640 6 12 MB 2.27 GHz 5.86 GT/s 60 W
E5645 6 12 MB 2.40 GHz 5.86 GT/s 80 W
E5649 6 12 MB 2.53 GHz 5.86 GT/s 80 W
X5650 6 12 MB 2.67 GHz 6.4 GT/s 95 W
X5660 6 12 MB 2.80 GHz 6.4 GT/s 95 W
X5670 6 12 MB 2.93 GHz 6.4 GT/s 95 W
X5675 6 12 MB 3.06 GHz 6.4 GT/s 95 W
X5680 6 12 MB 3.33 GHz 6.4 GT/s 130 W
X5690 6 12 MB 3.46 GHz 6.4 GT/s 130 W
QPI = Quick Path Interconnect, GT = Gigatransfer, HT = Hyper-Threading, TM = Turbo Mode, TDP = Thermal Design Power

WHITE PAPER PERFORMANCE REPORT PRIMERGY BX922 S2 VERSION: 2.0A 2011-12-21
Page 22 (45) © Fujitsu Technology Solutions 2010-2011
Database performance greatly depends on the configuration options with CPU, memory and on the connectivity of an adequate disk subsystem for the database. The configuration options of the systems that support the Intel Xeon processors of the 55xx und 56xx series vary, as can be seen in the following table.
Processor TX200 S6 TX300 S6 RX200 S6 RX300 S6 BX620 S6 BX920 S2 BX922 S2 BX924 S2
55
00
E5503
E5506
E5507
56
00
Se
rie
s
4 C
ore
s E5603
E5606
E5607
L5609
4 C
ore
s,
HT
, T
M
L5630
E5620
E5630
E5640
X5647
X5667
X5672
X5677
X5687
6 C
ore
s,
HT
, T
M
L5640
E5645
E5649
X5650
X5660
X5670
X5675
X5680
X5690
Max. Memory TX200 S6 TX300 S6 RX200 S6 RX300 S6 BX620 S6 BX920 S2 BX922 S2 BX924 S2
1 CPU 48 GB 96 GB 96 GB 96 GB 96 GB 96 GB 96 GB 96 GB 144 GB
*)
2 CPUs 96 GB 192 GB 192 GB 192 GB 192 GB 144 GB 192 GB 192 GB 288 GB
*)
*) Special release for 16 GB dual-rank memory modules

WHITE PAPER PERFORMANCE REPORT PRIMERGY BX922 S2 VERSION: 2.0A 2011-12-21
© Fujitsu Technology Solutions 2010-2011 Page 23 (45)
In the following scaling considerations for CPU and memory we assume that the disk subsystem has been adequately chosen and is not a bottleneck.
The OLTP-2 values determined are based on a PRIMERGY RX300 S6, the operating system Microsoft Windows Server 2008 R2 Enterprise and the database SQL Server 2008 R2 Enterprise x64 Edition. Further information about the system configuration can be found in the section Benchmark environment.
A guideline in the database environment for selecting main memory is that sufficient quantity is more important than the speed of the memory accesses. For this reason the maximum configuration with 16 GB modules, the maximum configuration with 8 GB modules and a reduced configuration with 8 GB modules were considered in the measurements. The timing depends on both the processor type and on the type and number of memory modules used. Further information about memory performance can be found in the White Paper Memory performance of Xeon 5600 (Westmere-EP)-based systems.
The following diagram shows the OLTP-2 transaction rates that can be achieved with one and two processors of the Intel Xeon 5600 and 5500 series and various memory configurations.
It is evident that a wide performance range is covered by the variety of released processors. If you compare the OLTP-2 value of the processor with the lowest performance (Xeon E5503) at maximum memory configuration and the processor with the highest performance (Xeon X5690), the result is a 5.4-fold increase in performance.
Based on the results achieved the processors can be divided into different performance groups:
The Xeon E5503 as the processor with two cores only makes the start.
The next performance group of processors achieves a performance that is almost twice as high in the OLTP-2 scenario. These are the processors with four cores without Hyper-Threading (Xeon E5506, Xeon E5507, Xeon E5603, Xeon E5606, Xeon E5607 and Xeon L5609). Under the OLTP-2 load, doubling the number of cores almost results in twice the performance.
A further increase in performance is achieved by the processors with four cores, which support both Hyper-Threading and the turbo mode. (Xeon L5630, Xeon E5620, Xeon E5630, Xeon E5640 and Xeon X5647). Doubling the logical processor cores through Hyper-Threading in particular leads to better results under the OLTP-2 load. In comparison with the previously mentioned processors, the 4-core processors Xeon X5667, Xeon X5672, Xeon X5677 and Xeon X5687 also have Hyper-Threading and turbo mode, but there are more possible turbo-mode levels and also a higher QPI speed, 6.4 GT/s compared with 5.86 GT/s. This enables them to almost achieve the throughputs of the 6-core processors (Xeon E5649 and Xeon E5645) with lower clock frequency, fewer turbo-mode levels and a lower QPI speed.
At the upper end of the performance scale are the 6-core processors Xeon X5650, Xeon X5660, Xeon X5670, Xeon X5675, Xeon X5680 and Xeon X5690, which also have a QPI speed of 6.4 GT/s. In almost all these series of measurements with two CPUs from the upper end of the performance range it can be seen that under the OLTP-2 load a configuration with memory of 96 GB (12 × 8 GB DIMMs) and the resulting memory access of 1333 MHz was more favorable than a configuration with 144 GB (18 × 8 GB DIMMs) with memory access of only 800 MHz.

WHITE PAPER PERFORMANCE REPORT PRIMERGY BX922 S2 VERSION: 2.0A 2011-12-21
Page 24 (45) © Fujitsu Technology Solutions 2010-2011
0 100 200 300 400 500 600 700 800 900 1000 1100 1200 1300
E5503-2Core
E5506-4Core
E5507-4Core
E5603-4Core
E5606-4Core
E5607-4Core
L5609-4Core
L5630-4Core
E5620-4Core
E5630-4Core
E5640-4Core
X5647-4Core
X5667-4Core
X5672-4Core
X5677-4Core
X5687-4Core
L5640-6Core
E5645-6Core
E5649-6Core
X5650-6Core
X5660-6Core
X5670-6Core
X5675-6Core
X5680-6Core
X5690-6Core
OLTP-2 tps2CPUs-192GB 2CPUs-144GB 2CPUs-96GB 1CPU-96GB 1CPU-72GB 1CPU-48GB
tps

WHITE PAPER PERFORMANCE REPORT PRIMERGY BX922 S2 VERSION: 2.0A 2011-12-21
© Fujitsu Technology Solutions 2010-2011 Page 25 (45)
If you compare the maximum achievable OLTP-2 values of the current system generation with the values that were achieved on the predecessor systems, the result is an increase of about 50%.
0
100
200
300
400
500
600
700
800
900
1000
1100
1200
1300
1400
+ ~ 50%
tps
Current System TX200 S6 TX300 S6 RX200 S6 RX300 S6 BX620 S6 BX920 S2 BX922 S2 BX924 S2
Predecessor System TX200 S5 TX300 S5 RX200 S5 RX300 S5 BX620 S5 BX920 S1 - -
2 × X5570
96 GB RAM
2 × W5590
96 GB RAM
2 × X5670
96 GB RAM
2 × X5690
96 GB RAM
Current System Predecessor System
Maximum OLTP-2 tps
Comparison of system generations
WHITE PAPER PERFORMANCE REPORT PRIMERGY BX922 S2 VERSION: 2.0A 2011-12-21
Page 26 (45) © Fujitsu Technology Solutions 2010-2011
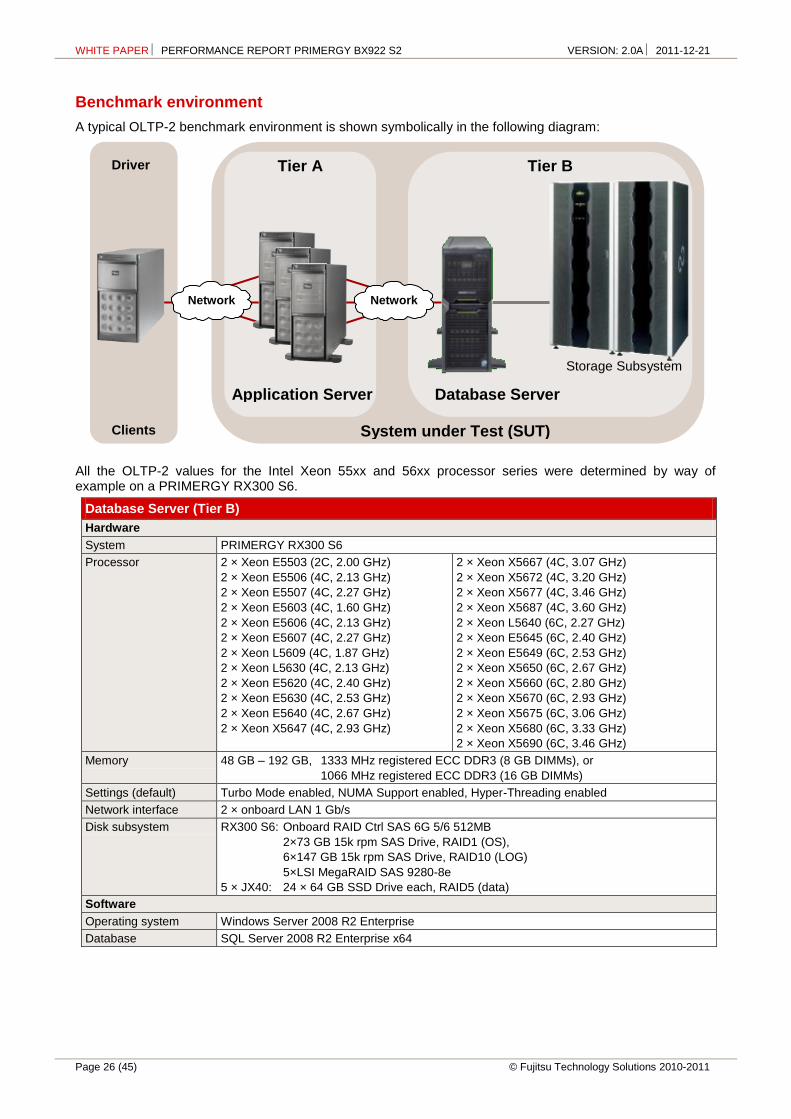
Benchmark environment
A typical OLTP-2 benchmark environment is shown symbolically in the following diagram:
All the OLTP-2 values for the Intel Xeon 55xx and 56xx processor series were determined by way of example on a PRIMERGY RX300 S6.
Database Server (Tier B)
Hardware
System PRIMERGY RX300 S6
Processor 2 × Xeon E5503 (2C, 2.00 GHz)
2 × Xeon E5506 (4C, 2.13 GHz)
2 × Xeon E5507 (4C, 2.27 GHz)
2 × Xeon E5603 (4C, 1.60 GHz)
2 × Xeon E5606 (4C, 2.13 GHz)
2 × Xeon E5607 (4C, 2.27 GHz)
2 × Xeon L5609 (4C, 1.87 GHz)
2 × Xeon L5630 (4C, 2.13 GHz)
2 × Xeon E5620 (4C, 2.40 GHz)
2 × Xeon E5630 (4C, 2.53 GHz)
2 × Xeon E5640 (4C, 2.67 GHz)
2 × Xeon X5647 (4C, 2.93 GHz)
2 × Xeon X5667 (4C, 3.07 GHz)
2 × Xeon X5672 (4C, 3.20 GHz)
2 × Xeon X5677 (4C, 3.46 GHz)
2 × Xeon X5687 (4C, 3.60 GHz)
2 × Xeon L5640 (6C, 2.27 GHz)
2 × Xeon E5645 (6C, 2.40 GHz)
2 × Xeon E5649 (6C, 2.53 GHz)
2 × Xeon X5650 (6C, 2.67 GHz)
2 × Xeon X5660 (6C, 2.80 GHz)
2 × Xeon X5670 (6C, 2.93 GHz)
2 × Xeon X5675 (6C, 3.06 GHz)
2 × Xeon X5680 (6C, 3.33 GHz)
2 × Xeon X5690 (6C, 3.46 GHz)
Memory 48 GB – 192 GB, 1333 MHz registered ECC DDR3 (8 GB DIMMs), or
1066 MHz registered ECC DDR3 (16 GB DIMMs)
Settings (default) Turbo Mode enabled, NUMA Support enabled, Hyper-Threading enabled
Network interface 2 × onboard LAN 1 Gb/s
Disk subsystem RX300 S6: Onboard RAID Ctrl SAS 6G 5/6 512MB
2×73 GB 15k rpm SAS Drive, RAID1 (OS),
6×147 GB 15k rpm SAS Drive, RAID10 (LOG)
5×LSI MegaRAID SAS 9280-8e
5 × JX40: 24 × 64 GB SSD Drive each, RAID5 (data)
Software
Operating system Windows Server 2008 R2 Enterprise
Database SQL Server 2008 R2 Enterprise x64
Application Server
Tier A Tier B
Network
Network
Clients
Database Server
Storage Subsystem
System under Test (SUT)
Driver

WHITE PAPER PERFORMANCE REPORT PRIMERGY BX922 S2 VERSION: 2.0A 2011-12-21
© Fujitsu Technology Solutions 2010-2011 Page 27 (45)
Application Server (Tier A)
Hardware
System PRIMERGY RX200 S6
Processor 1 × Xeon E5640 (6C, 2.66 GHz)
Memory 12 GB, 1333 MHz registered ECC DDR3
Network interface 2 × onboard LAN 1 Gb/s, 2 × Dual Port LAN 1Gb/s
Disk subsystem 1 × 73 GB 15k rpm SAS Drive
Software
Operating system Windows Server 2008 R2 Standard
Clients
Hardware
System PRIMERGY RX200 S5
Processor 2 × Xeon X5570 (4C, 2.93 GHz)
Memory 24 GB, 1333 MHz registered ECC DDR3
Network interface 2 × onboard LAN 1 Gb/s
Disk subsystem 1 × 73 GB 15k rpm SAS Drive
Software
Operating system Windows Server 2008 R2 Standard
OLTP-2 software EGen version 1.12.0
Some components may not be available in all countries / sales regions.

WHITE PAPER PERFORMANCE REPORT PRIMERGY BX922 S2 VERSION: 2.0A 2011-12-21
Page 28 (45) © Fujitsu Technology Solutions 2010-2011
SAP SD
Benchmark description
The SAP application software consists of modules used to manage all standard business processes. Modules for ERP (Enterprise Resource Planning) exist, such as Assemble-to-Order (ATO), Financial Accounting (FI), Human Resources (HR), Materials Management (MM), Production Planning (PP) and Sales and Distribution (SD), as well as for SCM (Supply Chain Management), Retail, Banking, Utilities, BI (Business Intelligence), CRM (Customer Relation Management) or PLM (Product Lifecycle Management).
The application software is always based on a database so that - in addition to the hardware - a SAP configuration also consists of the software components operating system and database as well as the SAP software itself.
SAP AG has developed the SAP Standard Application Benchmarks in order to verify the performance, stability and scalability of an SAP application system. These benchmarks (of which the SD Benchmark is the most important and most widely used) analyze the performance of the entire system and thus provide a means to measure the integration quality for each component.
The benchmark differentiates a two-tier and a three-tier configuration. In the two-tier configuration, the SAP application and the database are installed on one server. In a three-tier configuration, each component in the SAP application can be distributed over several servers and an additional server handles the database.
A complete specification for the benchmark developed by SAP AG, Walldorf, Germany, is in Internet: http://www.sap.com/benchmark.
Benchmark results
SAP uses the certification number 2010008 to document that the PRIMERGY BX922 S2, equipped with two Xeon X5680 processors (with SAP Enhancement Package 4 for SAP ERP 6.0 and SQL Server 2008 under Windows Server 2008 R2 Enterprise), obtained the following result on 19th March 2010:
Certification number 2010008
Number of SAP SD benchmark users 4910
Average dialog response time 0.99 seconds
Throughput Fully processed order line items/hour Dialog steps/hour SAPS
536,000 1,608,000 26,800
Average database request time (dialog/update) 0.024 sec / 0.045 sec
CPU utilization of central server 99%
Operating system, central server Windows Server 2008 R2 Enterprise
RDBMS SQL Server 2008
SAP Business Suite software SAP enhancement package 4 for SAP ERP 6.0
Configuration Central Server
PRIMERGY BX922 S2 2 processors / 12 cores / 24 threads Xeon X5680 72 GB main memory

WHITE PAPER PERFORMANCE REPORT PRIMERGY BX922 S2 VERSION: 2.0A 2011-12-21
© Fujitsu Technology Solutions 2010-2011 Page 29 (45)
The PRIMERGY BX922 S2 obtained the best 2 processor, two-tier SAP SD Standard Application Benchmark result on SAP enhancement package 4 for SAP ERP 6.0 (as of April 8, 2010)
2
2 Competitive benchmark results stated above reflect results published as of April 8, 2010. The comparison presented
above is based on the best performing 2-socket servers currently shipping by HP, Sun and Fujitsu. The latest SAP SD 2-tier results can be found at http://www.sap.com/solutions/benchmark/sd2tier.epx .
3800
4705
4860
4910
0 1000 2000 3000 4000 5000
Number of Benchmark Users
Fujitsu PRIMERGY BX922 S22 x Xeon X5680
2 processors/12 cores/24 threads72 GB RAMWindows Server 2008 R2 EnterpriseSQL Server 2008
SAP enhancement package 4 for SAP ERP 6.0Certification number: 2010008
Fujitsu PRIMERGY TX300 S6 / RX300 S6
2 x Xeon X56802 processors/12 cores/24 threads88 GB RAMWindows Server 2008 R2 Enterprise
SQL Server 2008SAP enhancement package 4 for SAP ERP 6.0Certification number: 2010007
HP ProLiant BL460c G62 x Xeon X56702 processors/12 cores/24 threads96 GB RAM
Windows Server 2008 Enterprise EditionSQL Server 2008SAP enhancement package 4 for SAP ERP 6.0
Certification number: 2010009
Sun Fire X42702 x Xeon X5570
2 processors/8 cores/16 threads48 GB RAMSolaris 10Oracle 10g
SAP enhancement package 4 for SAP ERP 6.0 (Unicode)Certification number: 2009033
Two-Tier SAP SD results on SAP enhancement package 4 for SAP ERP 6.0 for 2 processor servers: PRIMERGY BX922 S2 vs. other 2-socket servers

WHITE PAPER PERFORMANCE REPORT PRIMERGY BX922 S2 VERSION: 2.0A 2011-12-21
Page 30 (45) © Fujitsu Technology Solutions 2010-2011
Benchmark environment
System Under Test (SUT)
Hardware
Server PRIMERGY BX922 S2
Processor 2 x Xeon X5680
Memory 9 x 8 GB PC3-10600R DDR3-SDRAM
Disk subsystem
PRIMERGY BX922 S2: 1 x LSI MegaRAID SAS 1064E controller 2 x 2.5” SAS disks, 73 GB, 15 krpm 1 x FC Mezzanine Card 8 Gbit/s 2-port
1 x PRIMERGY SX940 S1: 1 x RAID 5/6 SAS based on LSI MegaRAID 512MB 1 x RAID Contr BBU Upgrade for RAID 5/6 V16 2 x SSD SATA 3G 64GB SLC HOT PLUG 2.5" EP 1 x Fibre Channel Mezzanine Card 2 x 8 Gb Emulex (MC-FC82E), PCIe x4 1 x FibreCAT CX3-40F
Software
Operating system Windows Server 2008 R2 Enterprise
Database SQL Server 2008 Enterprise x64 Edition
SAP Business Suite software SAP enhancement package 4 for SAP ERP 6.0 (Unicode)
Load generator
Hardware
Model PRIMERGY RX600 S2
Processor 4 x Xeon 7040, 3 GHz, 4 MB L2 cache
Memory 8 GB PC2-3200 DDR2-SDRAM
Software
Operating system SUSE Linux Enterprise Server 11
Some components may not be available in all countries / sales regions.
2-tier environment
System Under Test
Load generator

WHITE PAPER PERFORMANCE REPORT PRIMERGY BX922 S2 VERSION: 2.0A 2011-12-21
© Fujitsu Technology Solutions 2010-2011 Page 31 (45)
vServCon
Benchmark description
vServCon is a benchmark used by Fujitsu Technology Solutions to compare server configurations with hypervisor with regard to their suitability for server consolidation. This allows both the comparison of systems, processors and I/O technologies as well as the comparison of hypervisors, virtualization forms and additional drivers for virtual machines.
vServCon is not a new benchmark in the true sense of the word. It is more a framework that combines already established benchmarks (or in modified form) as workloads in order to reproduce the load of a consolidated and virtualized server environment. Three proven benchmarks are used which cover the application scenarios database, application server and web server.
Each of the three application scenarios is allocated to a dedicated virtual machine (VM). Add to these a fourth machine, the so-called idle VM. These four VMs make up a "tile". Depending on the performance capability of the underlying server hardware, you may as part of a measurement also have to start several identical tiles in parallel in order to achieve a maximum performance score.
Each of the three vServCon application scenarios provides a specific benchmark result in the form of application-specific transaction rates for the respective VM. In order to derive a normalized score, the individual benchmark results for one tile are put in relation to the respective results of a reference system. The resulting relative performance values are then suitably weighted and finally added up for all VMs and tiles. The outcome is a score for this tile number.
Starting as a rule with one tile, this procedure is performed for an increasing number of tiles until no further significant increase in this vServCon score occurs. The final vServCon score is then the maximum of the vServCon scores for all tile numbers. This score thus reflects the maximum total throughput that can be achieved by running the mix defined in vServCon that consists of numerous VMs up to the possible full utilization of CPU resources. This is why the measurement environment for vServCon measurements is designed in such a way that only the CPU is the limiting factor and that no limitations occur as a result of other resources.
The progression of the vServCon scores for the tile numbers provides useful information about the scaling behavior of the "System under Test".
Moreover, vServCon also documents the total CPU load of the host (VMs and all other CPU activities) and, if possible, electrical power consumption.
A detailed description of vServCon is in the document: Benchmark Overview vServCon.
Application scenario Benchmark No. of logical CPU cores Memory
Database Sysbench (adapted) 2 1.5 GB
Java application server SPECjbb (adapted, with 50% - 60% load) 2 2 GB
Web server WebBench 1 1.5 GB
System Under Test
… …
Tile n
Tile 3
Tile 2
Tile 1
Database VM
Web VM
Idle VM
Java VM
Database VM
Web VM
Idle VM
Java VM
Database VM
Web VM
Idle VM
Java VM Database
VM Web VM
Idle VM
Java VM

WHITE PAPER PERFORMANCE REPORT PRIMERGY BX922 S2 VERSION: 2.0A 2011-12-21
Page 32 (45) © Fujitsu Technology Solutions 2010-2011
Benchmark results
The current generation of PRIMERGY dual-socket systems is based on Intel Xeon series 5600 (or 5500) processors.
The configuration options of these systems vary, as can be seen in the following table.
Processor TX300 S6 RX200 S6 RX300 S6 BX620 S6 BX920 S2 BX922 S2 BX924 S2
5500 E5507
56
00
Se
rie
s
4 C
E5607
L5609
4 C
ore
s,
HT
, T
M
L5630
E5620
E5630
E5640
X5647
X5667
X5672
X5677
X5687
6 C
ore
s,
HT
, T
M
L5640
E5645
E5649
X5650
X5660
X5670
X5675
X5680
X5690
HT = Hyper-Threading, TM = Turbo Mode
The current generation of PRIMERGY dual-socket systems is very suitable for application virtualization thanks to the progress made in processor technology. Compared with a system based on the previous processor generation an approximate 50% higher virtualization performance can be achieved (measured in vServCon score) as 6-Core processors are also available. On the basis of the previously described vServCon profile almost optimal utilization of the CPU system resources is possible with 27 real application VMs (equivalent to nine tiles) if the system is fully assembled with two such processors.
WHITE PAPER PERFORMANCE REPORT PRIMERGY BX922 S2 VERSION: 2.0A 2011-12-21
© Fujitsu Technology Solutions 2010-2011 Page 33 (45)
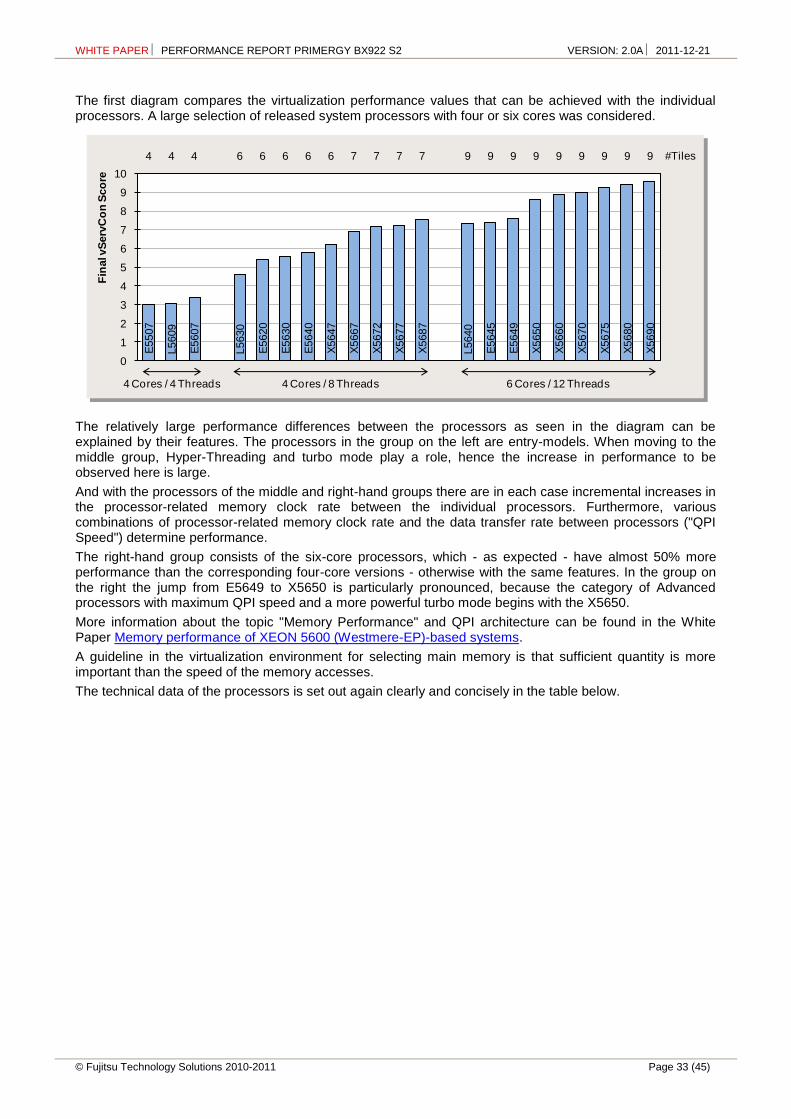
The first diagram compares the virtualization performance values that can be achieved with the individual processors. A large selection of released system processors with four or six cores was considered.
The relatively large performance differences between the processors as seen in the diagram can be explained by their features. The processors in the group on the left are entry-models. When moving to the middle group, Hyper-Threading and turbo mode play a role, hence the increase in performance to be observed here is large.
And with the processors of the middle and right-hand groups there are in each case incremental increases in the processor-related memory clock rate between the individual processors. Furthermore, various combinations of processor-related memory clock rate and the data transfer rate between processors ("QPI Speed") determine performance.
The right-hand group consists of the six-core processors, which - as expected - have almost 50% more performance than the corresponding four-core versions - otherwise with the same features. In the group on the right the jump from E5649 to X5650 is particularly pronounced, because the category of Advanced processors with maximum QPI speed and a more powerful turbo mode begins with the X5650.
More information about the topic "Memory Performance" and QPI architecture can be found in the White Paper Memory performance of XEON 5600 (Westmere-EP)-based systems.
A guideline in the virtualization environment for selecting main memory is that sufficient quantity is more important than the speed of the memory accesses.
The technical data of the processors is set out again clearly and concisely in the table below.
E5507
L5609
E5607
L5630
E5620
E5630
E5640
X5647
X5667
X5672
X5677
X5687
L5640
E5645
E5649
X5650
X5660
X5670
X5675
X5680
X5690
4 4 4 6 6 6 6 6 7 7 7 7 9 9 9 9 9 9 9 9 9
0
1
2
3
4
5
6
7
8
9
10
Fin
al v
Serv
Co
n S
co
re
#Tiles
4 Cores / 4 Threads 6 Cores / 12 Threads4 Cores / 8 Threads

WHITE PAPER PERFORMANCE REPORT PRIMERGY BX922 S2 VERSION: 2.0A 2011-12-21
Page 34 (45) © Fujitsu Technology Solutions 2010-2011
Processor #Cores/ Chip
L3 Cache Prozessor-frequenz
QPI
Speed HT TM TDP
#Tiles Score
5500 E5507 4 4 MB 2.27 GHz 4.8 GT/s - - 80 W 4 3.02
56
00
Se
rie
s
4 C
E5607 4 8 MB 2.27 GHz 4.8 GT/s - - 80 W 4 3.39
L5609 4 12 MB 1.87 GHz 4.8 GT/s - - 40 W 4 3.06
4 C
ore
s,
HT
, T
M
L5630 4 12 MB 2.13 GHz 5.86 GT/s 40 W 6 4.61
E5620 4 12 MB 2.40 GHz 5.86 GT/s 80 W 6 5.40
E5630 4 12 MB 2.53 GHz 5.86 GT/s 80 W 6 5.56
E5640 4 12 MB 2.67 GHz 5.86 GT/s 80 W 6 5.79
X5647 4 12 MB 2.93 GHz 5.86 GT/s 130 W 6 6.23
X5667 4 12 MB 3.07 GHz 6.4 GT/s 95 W 7 6.93
X5672 4 12 MB 3.20 GHz 6.4 GT/s 95 W 7 7.20
X5677 4 12 MB 3.46 GHz 6.4 GT/s 130 W 7 7.24
X5687 4 12 MB 3.60 GHz 6.4 GT/s 130 W 7 7.57
6 C
ore
s,
HT
, T
M
L5640 6 12 MB 2.27 GHz 5.86 GT/s 60 W 9 7.36
E5645 6 12 MB 2.40 GHz 5.86 GT/s 80 W 9 7.40
E5649 6 12 MB 2.53 GHz 5.86 GT/s 80 W 9 7.60
X5650 6 12 MB 2.67 GHz 6.4 GT/s 95 W 9 8.63
X5660 6 12 MB 2.80 GHz 6.4 GT/s 95 W 9 8.87
X5670 6 12 MB 2.93 GHz 6.4 GT/s 95 W 9 9.02
X5675 6 12 MB 3.06 GHz 6.4 GT/s 95 W 9 9.29
X5680 6 12 MB 3.33 GHz 6.4 GT/s 130 W 9 9.41
X5690 6 12 MB 3.46 GHz 6.4 GT/s 130 W 9 9.61
QPI = QuickPath Interconnect, GT = Gigatransfer, HT = Hyper-Threading, TM = Turbo Mode, TDP = Thermal Design Power
The next diagram illustrates the virtualization performance for increasing numbers of VMs based on the Xeon E5620 (4-core) and E5649 (6-core) processors. The respective CPU loads of the host have also been entered. The number of tiles with optimal CPU load is typically at about 90%; beyond that you have overload, which is where virtualization performance no longer increases, or sinks again.
In addition to the increased number of physical cores, Hyper-Threading is an additional reason for the high number of VMs that can be operated. As is known, a physical processor core is consequently divided into two logical cores so that the number of cores available for the hypervisor is doubled. This standard feature thus generally increases the virtualization performance of a system.
The scaling curves for the number of tiles as seen in the previous diagram are specifically for systems with Hyper-Threading. 12 physical and thus 24 logical cores are available with the Xeon E5649 processor; approximately four of them are used per tile (see Benchmark description). This means that a parallel use of the same physical cores by several VMs is avoided up to a maximum of about three tiles. That is why the performance curve in this range scales almost ideal. For the quantities above the growth is flatter up to CPU full utilization.
2.1
8
3.8
4
4.4
7
5.0
1
5.3
0
5.4
0
2.1
2
4.2
3
5.6
9
6.3
7
7.0
8
7.3
4
7.4
5
7.5
5
7.6
0
0%
10%
20%
30%
40%
50%
60%
70%
80%
90%
100%
E5620 E5649
0
1
2
3
4
5
6
7
8
1 2 3 4 5 6 1 2 3 4 5 6 7 8 9
CP
U u
tilizati
on
vS
erv
Co
n S
co
re
# Tiles
vServCon Score (left axis) CPU utilization of host (right axis)
WHITE PAPER PERFORMANCE REPORT PRIMERGY BX922 S2 VERSION: 2.0A 2011-12-21
© Fujitsu Technology Solutions 2010-2011 Page 35 (45)
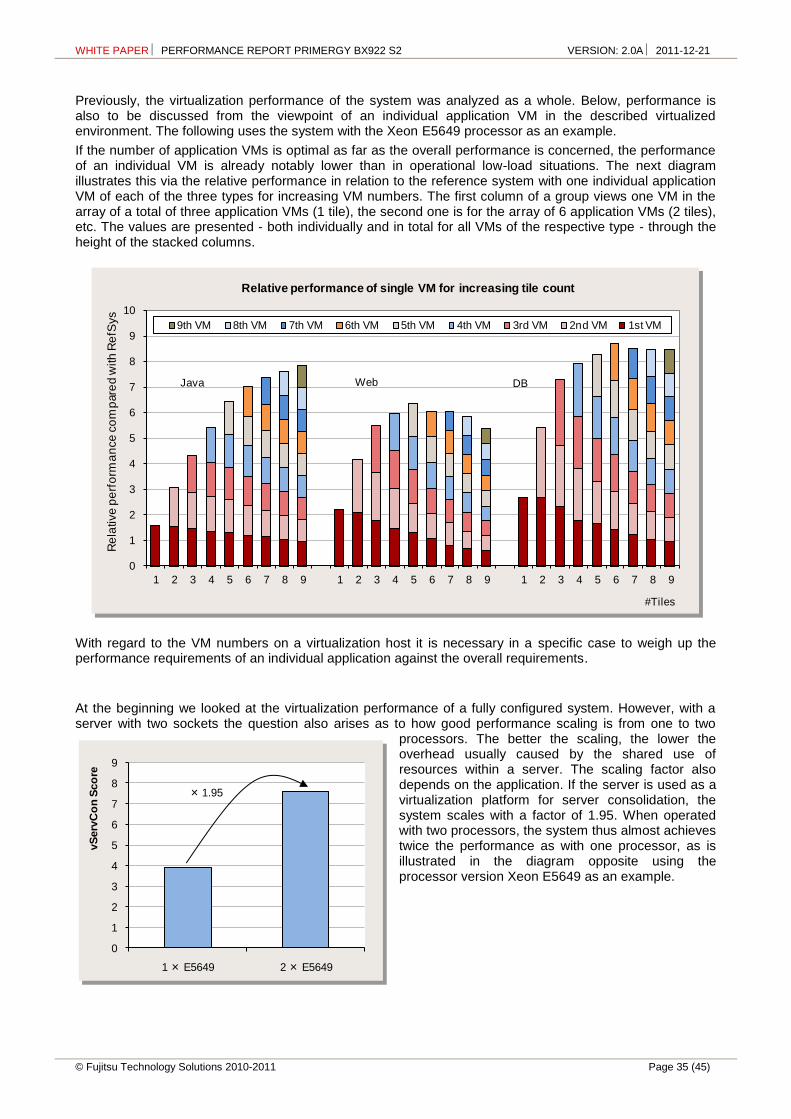
Previously, the virtualization performance of the system was analyzed as a whole. Below, performance is also to be discussed from the viewpoint of an individual application VM in the described virtualized environment. The following uses the system with the Xeon E5649 processor as an example.
If the number of application VMs is optimal as far as the overall performance is concerned, the performance of an individual VM is already notably lower than in operational low-load situations. The next diagram illustrates this via the relative performance in relation to the reference system with one individual application VM of each of the three types for increasing VM numbers. The first column of a group views one VM in the array of a total of three application VMs (1 tile), the second one is for the array of 6 application VMs (2 tiles), etc. The values are presented - both individually and in total for all VMs of the respective type - through the height of the stacked columns.
With regard to the VM numbers on a virtualization host it is necessary in a specific case to weigh up the performance requirements of an individual application against the overall requirements.
At the beginning we looked at the virtualization performance of a fully configured system. However, with a server with two sockets the question also arises as to how good performance scaling is from one to two
processors. The better the scaling, the lower the overhead usually caused by the shared use of resources within a server. The scaling factor also depends on the application. If the server is used as a virtualization platform for server consolidation, the system scales with a factor of 1.95. When operated with two processors, the system thus almost achieves twice the performance as with one processor, as is illustrated in the diagram opposite using the processor version Xeon E5649 as an example.
0
1
2
3
4
5
6
7
8
9
10
1 2 3 4 5 6 7 8 9 1 2 3 4 5 6 7 8 9 1 2 3 4 5 6 7 8 9
Re
lative
pe
rfo
rma
nce
co
mp
are
d w
ith
Re
fSys
Relative performance of single VM for increasing tile count
9th VM 8th VM 7th VM 6th VM 5th VM 4th VM 3rd VM 2nd VM 1st VM
Web DBJava
#Tiles
0
1
2
3
4
5
6
7
8
9
1 × E5649 2 × E5649
× 1.95
vS
erv
Co
n S
co
re

WHITE PAPER PERFORMANCE REPORT PRIMERGY BX922 S2 VERSION: 2.0A 2011-12-21
Page 36 (45) © Fujitsu Technology Solutions 2010-2011
The virtualization-relevant progress in processor technology since 2008 has an effect on the one hand on an individual VM and, on the other hand, on the possible maximum number of VMs up to CPU full utilization. The following comparison shows the proportions for both types of improvements. Three systems are compared with approximately the same processor frequency: a system from 2008 with 2 × Xeon E5420, a system from 2009 with 2 × Xeon E5540 and a current system with 2 × Xeon E5649.
2011 TX300 S6 RX200 S6 RX300 S6 BX620 S6 BX920 S2 BX922 S2 BX924 S2
2009 TX300 S5 RX200 S5 RX300 S5 BX620 S5 BX920 S1 - -
2008 TX300 S4 RX200 S4 RX300 S4 BX620 S4 - - -
The clearest performance improvements arose from 2008 to 2009 with the introduction of the Xeon 5500 processor generation (e. g. via the feature “Extended Page Tables” (EPT)
3). One sees an increase of the
vServCon score by a factor of 1.30 with a few VMs (one tile).
With full utilization of the systems with VMs there was an increase by a factor of 2.02. The one reason was the performance increase that could be achieved for an individual VM (see score for a few VMs). The other reason was that more VMs were possible with total optimum (via Hyper-Threading). However, it can be seen that the optimum was "bought" with a triple number of VMs with a reduced performance of the individual VM.
Where exactly is the technology progress between 2009 and 2011? The performance for an individual VM in low-load situations has basically remained the same for the processors compared here with the same clock frequency but with different cache size and speed of memory connection. The decisive progress is in the higher number of physical cores and – associated with it – in the increased values of pure performance (factor 1.47 in the diagram) and performance per Watt at full load. Electrical power consumption at full load is almost identical for the processors from 2009 and 2011 that are being compared, because the parameter used as the conventional guideline here, TDP (Thermal Design Power), is in both cases 80 W. This is why the performance per Watt has also increased by about a factor of 1.47.
We must explicitly point out that the increased virtualization performance as seen in the score cannot be completely deemed as an improvement for one individual VM. More than approximately 30% to 50% increased throughput compared to an identically clocked processor of the Xeon 5400 generation from 2008 is not possible here. Performance increases in the virtualization environment since 2009 are mainly achieved by increased VM numbers due to the increased number of available logical or physical cores.
3 EPT accelerates memory virtualization via hardware support for the mapping between host and guest memory addresses.
0
1
2
3
4
5
6
7
8
9
2008E5420
2.5 GHz4C
2009E5540
2.53 GHz4C
2011E5649
2.53 GHz6C
2008E5420
2.5 GHz4C
2009E5540
2.53 GHz4C
2011E5649
2.53 GHz6C
Overall OptimumFew VMs
×1.30
×2.02
vS
erv
Co
n S
co
re
×1.47
YearCPU
Frequency#Cores

WHITE PAPER PERFORMANCE REPORT PRIMERGY BX922 S2 VERSION: 2.0A 2011-12-21
© Fujitsu Technology Solutions 2010-2011 Page 37 (45)
Benchmark environment
The measurements were made with the environment described below:
All the vServCon scores for the Intel Xeon 55xx and 56xx processor series were determined by way of example on a PRIMERGY TX300 S6.
SUT hardware
Model PRIMERGY TX300 S6
Processor 1 chip: Xeon E5649 (6C, 2.53 GHz)
2 chips: Xeon E5507 (4C, 2.27 GHz)
Xeon L5609 (4C, 1.87 GHz)
Xeon E5607 (4C, 2.27 GHz)
Xeon L5630 (4C, 2.13 GHz)
Xeon E5620 (4C, 2.40 GHz)
Xeon E5630 (4C, 2.53 GHz)
Xeon E5640 (4C, 2.67 GHz)
Xeon X5647 (4C, 2.93 GHz)
Xeon X5667 (4C, 3.07 GHz)
Xeon X5672 (4C, 3.20 GHz)
2 chips: Xeon X5677 (4C, 3.47 GHz)
Xeon X5687 (4C, 3.60 GHz)
Xeon L5640 (6C, 2.27 GHz)
Xeon E5645 (6C, 2.40 GHz)
Xeon E5649 (6C, 2.53 GHz)
Xeon X5650 (6C, 2.67 GHz)
Xeon X5660 (6C, 2.80 GHz)
Xeon X5670 (6C, 2.93 GHz)
Xeon X5675 (6C, 3.07 GHz)
Xeon X5680 (6C, 3.33 GHz)
Xeon X5690 (6C, 3.46 GHz)
Memory 96 GB (a PC3-10600R each, 8 GB, in DIMM-1A until DIMM-1F and in DIMM-2A until DIMM-2F)
Network interface 2 × 1-GBit LAN; one for load (via 2 LAN adapters), one for control.
Disk subsystem No internal hard disks were used, but FibreCAT CX500 storage systems. One 50 GB LUN per tile for the ”virtual disk files“ of the VMs. Each LUN is a RAID 0 array consisting of 5 Seagate ST373454 disks (15 krpm).
Storage connection Via FC controller Qlogic QLE 2462
SUT software
Operating system Hypervisor VMware ESX Server
Version Version 4.0 U1; Build 236512
BIOS Version 6.00 R1.08..2619.N1; deviations from default:
Adjacent Cache Line Prefetch: Disabled; Hardware Prefetch: Disabled
DCU Streamer Prefetch: Disabled; Data Reuse Optimization: Disabled
SUT: virtualization-specific details
ESX settings Default
General details Described in the Benchmark Overview vServCon.
Multiple
1Gb or 10Gb networks
Load generators
Server Storage System
System under Test (SUT)
Framework controller

WHITE PAPER PERFORMANCE REPORT PRIMERGY BX922 S2 VERSION: 2.0A 2011-12-21
Page 38 (45) © Fujitsu Technology Solutions 2010-2011
Load generator hardware
Model 17 × PRIMERGY BX920 S1 server blades (PRIMERGY BX900 chassis)
Processor 2 × Xeon X5570, 2.93 GHz each
Memory 12 GB
Network interface 3 × 1 Gbit LAN each
Operating system Windows Server 2008 R2 Enterprise with Hyper-V
Load generator VMs (per tile 3 load generator VMs on various server blades)
Processor 1 logical CPU
Memory 512 MB
Network interface 2 × 1 Gbit LAN each
Operating system Windows Server 2003 Enterprise
Some components may not be available in all countries or sales regions.

WHITE PAPER PERFORMANCE REPORT PRIMERGY BX922 S2 VERSION: 2.0A 2011-12-21
© Fujitsu Technology Solutions 2010-2011 Page 39 (45)
VMmark V1
Benchmark description
This section is based on VMmark benchmark version 1.1.1, referred to hereinafter in short as VMmark V1. VMmark V1 is a benchmark developed by VMware to compare server configurations with hypervisor solutions from VMware regarding their suitability for server consolidation.
In addition to the software for load generation, the benchmark consists of a defined load profile and binding regulations. For a long time VMmark V1 was the only established virtualization benchmark which enabled a multivendor comparison. Benchmark results achieved with VMmark V1 could be submitted to VMware and were published on their Internet site after a successful review process. Today, VMmark V1 is only available for academic use and has been replaced by VMmark V2.
For a benchmark like VMmark V1 to fulfil its objective, it must map the real world of a data center regarding server consolidation; in other words it must consider existing servers with those application scenarios that are normally virtualized. These servers have weak utilization levels and the aim is thus to consolidate as many of them as possible as VMs. Therefore, such a benchmark must assess for a virtualization host both the suitably determined overall throughput across the various application VMs as well as the number of efficiently operable VMs.
The following solution concept has been established for these two objectives: a representative group of application scenarios is selected in the benchmark. They are started simultaneously as VMs on a virtualization host when making a measurement. Each of these VMs is operated with a suitable load tool at a defined lower load level. Such a group of VMs is known as a "tile".
A tile in VMmark V1 consists of six VMs; five of them are allocated to the selected application scenarios on a dedicated basis. A sixth is added, the so-called standby VM. VMmark V1 mandatorily allocates to each VM certain resources with regard to logical processors, memory and hard disk space. The table describes these six VMs and the load tools used to measure them.
Depending on the performance capability of the underlying server hardware, you will - as part of a measurement - mostly have to start several identical tiles in parallel in order to achieve a maximum overall performance.
Each of the five VMmark V1 application scenarios provides a specific result for each VM. In order to derive a score the individual results are appropriately summarized for all VMs. The outcome is the VMmark V1 score for this tile number, that is why - in addition to the actual score - the number of tiles is always specified, e.g. "12.34@5 tiles".
A detailed description of VMmark V1 is available in the document Benchmark Overview VMmark V1.
Application scenario Load tool
Database server Sysbench
File server Dbench (modified)
Java application server SPECjbb2005 (modified)
Mail server Loadsim 2003
Web server SPECweb2005 (modified)
Standby server -
System Under Test
Tile n
Tile 3
Tile 2
Tile 1
Database VM
Java VM
Mail VM
File server VM
Web VM
Standby VM
Database VM
Java VM
Mail VM
File server VM
Web VM
Standby VM
Database VM
Java VM
Mail VM
File server VM
Web VM
Standby VM
Database VM
Java VM
Mail VM
File server VM
Web VM
Standby VM
… …

WHITE PAPER PERFORMANCE REPORT PRIMERGY BX922 S2 VERSION: 2.0A 2011-12-21
Page 40 (45) © Fujitsu Technology Solutions 2010-2011
Benchmark results
On 6th April 2010 Fujitsu achieved a VMmark V1 score of "32.89@24 tiles" in a system configuration with a total of 12 processor cores with a PRIMERGY BX922 S2 and VMware ESX 4.0 Update 1. A configuration with two 4-core CPUs (8 processor cores) achieved the VMmark V1 score of "27.99@18 tiles" on 4th May 2010.
These scores as well as the detailed results and configuration data can be seen at http://www.vmware.com/products/vmmark/v1/results.html.
With the score of "27.99@18 tiles" the PRIMERGY BX922 S2 is from the VMmark V1 viewpoint the most powerful blade server with eight cores and is at the same time second in the VMmark V1 ranking for servers of the eight-core category (valid as of benchmark results publication date), neck-and-neck with the PRIMERGY RX300 S6 in first place.
The main prerequisites in attaining this result were the processor, the frequency-optimized 4-core processor Xeon X5677 and the hypervisor version which optimally uses the processor features. These features include the extended page tables (EPT)
4, Hyper-Threading and the fast memory connection within this processor.
All this has a particularly positive effect during virtualization.
A memory configuration of 96 GB (12 × 8 GB), which was configured with maximal performance - i.e. with a speed of 1333 MHz, was required to operate the 18 tiles.
The PRIMERGY BX922 S2 is also able to maintain its position in the 12-core category. With a VMmark V1 score of "32.89@24 tiles" it is the best half-height blade server and is also second in the VMmark V1 ranking for servers of the 12-core category (valid as of benchmark results publication date).
On account of the requirements made by the benchmark the memory had to be extended to 144 GB (18 × 8 GB) when operating 24 tiles. As a result of the system architecture it is then reduced to the speed of 800 MHz.
All VMs, their application data, the host operating system as well as additionally required data were on a powerful fibre channel disk subsystem from ETERNUS DX80 systems with a total of 44 LUNs (18 tiles) or 56 LUNs (24 tiles).
All the components used were optimally attuned to each other.
4 EPT accelerates memory virtualization via hardware support for the mapping between host and guest memory addresses.

WHITE PAPER PERFORMANCE REPORT PRIMERGY BX922 S2 VERSION: 2.0A 2011-12-21
© Fujitsu Technology Solutions 2010-2011 Page 41 (45)
Benchmark environment
The measurement set-up is symbolically illustrated below:
SUT hardware
Model PRIMERGY BX922 S2
Processor 18 tiles: 2 × Xeon X5677 (4-core, 3.46 GHz) 24 tiles: 2 × Xeon X5680 (6-core, 3.33 GHz)
Memory 18 tiles: 96 GB (12 × 8 GB per DIMM), 1333 MHz registered ECC DDR3 24 tiles: 144 GB (18 × 8 GB per DIMM), 1333 MHz registered ECC DDR3
Network interface 2 × integrated Intel 82576EB dual port 1GbE adapter
Disk subsystem No internal hard disks were used. 18 tiles: 9 ETERNUS DX80 storage systems: a total of 196 hard disks in several RAID-0 arrays. 24 tiles: 15 ETERNUS DX80 storage systems: a total of 340 hard disks in several RAID-0 arrays.
Storage connection 1 × dual-channel MC-FC82E (Emulex LPe12002 based)
SUT software
Operating system Hypervisor VMware ESX Server
ESX version VMware ESX v4.0 Update 1; Build 244038 / 236512
BIOS version Rev 3C20.2861
Load generator hardware
Model 18 tiles: 18 × server blade PRIMERGY BX620 S4 24 tiles: 24 × server blade PRIMERGY BX620 S4
Processor 2 × Intel Xeon 5130, 2 GHz
Memory 3 GB
Network interface 1 × 1 GBit LAN each
Operating system Microsoft Windows Server 2003 R2 Enterprise, updated with SP2 and KB955839
Details
See disclosure http://www.vmware.com/files/pdf/vmmark/VMmark-Fujitsu-2010-05-04-BX922S2.pdf http://www.vmware.com/files/pdf/vmmark/VMmark-Fujitsu-2010-04-06-BX922S2.pdf
Some components may not be available in all countries or sales regions.
Multiple
1Gb or 10Gb networks
Load Generators,
incl. Prime Client
Server Storage System
System under Test (SUT)
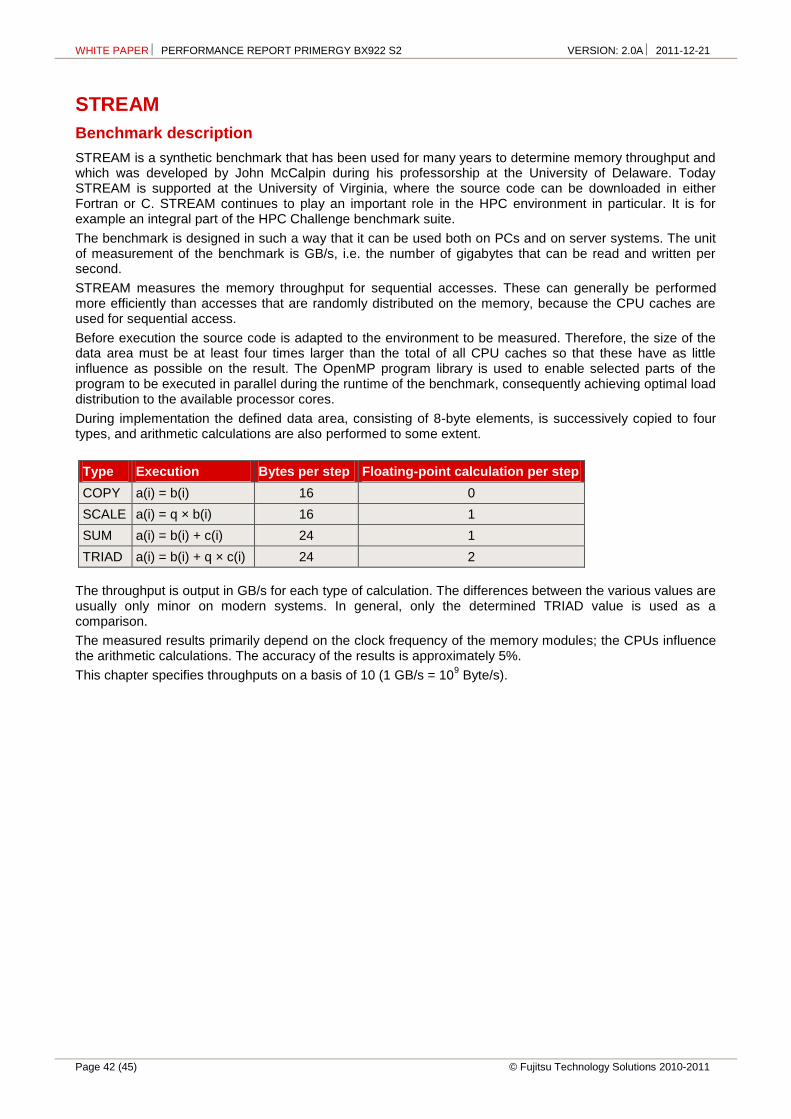
WHITE PAPER PERFORMANCE REPORT PRIMERGY BX922 S2 VERSION: 2.0A 2011-12-21
Page 42 (45) © Fujitsu Technology Solutions 2010-2011
STREAM
Benchmark description
STREAM is a synthetic benchmark that has been used for many years to determine memory throughput and which was developed by John McCalpin during his professorship at the University of Delaware. Today STREAM is supported at the University of Virginia, where the source code can be downloaded in either Fortran or C. STREAM continues to play an important role in the HPC environment in particular. It is for example an integral part of the HPC Challenge benchmark suite.
The benchmark is designed in such a way that it can be used both on PCs and on server systems. The unit of measurement of the benchmark is GB/s, i.e. the number of gigabytes that can be read and written per second.
STREAM measures the memory throughput for sequential accesses. These can generally be performed more efficiently than accesses that are randomly distributed on the memory, because the CPU caches are used for sequential access.
Before execution the source code is adapted to the environment to be measured. Therefore, the size of the data area must be at least four times larger than the total of all CPU caches so that these have as little influence as possible on the result. The OpenMP program library is used to enable selected parts of the program to be executed in parallel during the runtime of the benchmark, consequently achieving optimal load distribution to the available processor cores.
During implementation the defined data area, consisting of 8-byte elements, is successively copied to four types, and arithmetic calculations are also performed to some extent.
Type Execution Bytes per step Floating-point calculation per step
COPY a(i) = b(i) 16 0
SCALE a(i) = q × b(i) 16 1
SUM a(i) = b(i) + c(i) 24 1
TRIAD a(i) = b(i) + q × c(i) 24 2
The throughput is output in GB/s for each type of calculation. The differences between the various values are usually only minor on modern systems. In general, only the determined TRIAD value is used as a comparison.
The measured results primarily depend on the clock frequency of the memory modules; the CPUs influence the arithmetic calculations. The accuracy of the results is approximately 5%.
This chapter specifies throughputs on a basis of 10 (1 GB/s = 109 Byte/s).

WHITE PAPER PERFORMANCE REPORT PRIMERGY BX922 S2 VERSION: 2.0A 2011-12-21
© Fujitsu Technology Solutions 2010-2011 Page 43 (45)
Benchmark results
The PRIMERGY BX922 S2 was measured with processors from the Xeon 5600 series. The benchmark was compiled using the Intel C compiler 12.0 and performed under SUSE Linux Enterprise Server 11 SP1 (64-bit).
The data area consisted of 40 million elements, which is equivalent to about 305 MB.
Processor Cores GHz L3 cache Memory timing TDP TRIAD [GB/s]
Xeon E5603 4 1.60 4 MB 1067 MHz 80 Watt 27.9
Xeon E5606 4 2.13 8 MB 1067 MHz 80 Watt 27.9
Xeon E5607 4 2.27 8 MB 1067 MHz 80 Watt 27.9
Xeon X5647 4 2.93 12 MB 1067 MHz 130 Watt 34.5
Xeon E5645 6 2.40 12 MB 1333 MHz 80 Watt 36.7
Xeon E5649 6 2.53 12 MB 1333 MHz 80 Watt 36.6
Xeon X5675 6 3.07 12 MB 1333 MHz 95 Watt 41.1
Xeon X5690 6 3.47 12 MB 1333 MHz 130 Watt 39.9
Xeon X5687 4 3.60 12 MB 1333 MHz 130 Watt 41.7
The results clearly show the difference between the processors with a maximum memory frequency of 1067 MHz and those with 1333 MHz. Thanks to the clock frequency and the larger L3 cache the Xeon X5647 achieves performance advantages over the other processors with a 1067 MHz memory frequency. Since the capacity limit of the memory controller is already reached with 4 threads per CPU, processors with 6 cores do not offer any better memory throughput than processors with 4 cores.
Benchmark environment
All STREAM measurements were based on a PRIMERGY BX922 S2 with the following hardware and software configuration:
Hardware
Model PRIMERGY BX922 S2
CPU Xeon E5603, E5606, E5607, E5645, E5649, X5647, X5675, X5687, X5690
Number of cores
2 chips:
Xeon E5603, E5606, E5607, X5647, X5687: 8 cores All others: 12 cores
Primary cache 32 kB instruction + 32 kB data on chip, per core
Secondary cache 256 kB on chip, per core
Other cache Xeon E5603: 4 MB (I+D) on chip, per chip Xeon E5606, E5607: 8 MB (I+D) on chip, per chip All others: 12 MB (I+D) on chip, per chip
Memory 12 × 4 GB PC3-10600R DDR3-SDRAM
Software
Operating system SUSE Linux Enterprise Server 11 SP1 (64-bit)
Compiler Intel C Compiler 12.0
Benchmark Stream.c Version 5.9
Some components may not be available in all countries or sales regions.
SPECcpu2006: floating-point performance PRIMERGY TX200 S6 vs. predecessor

WHITE PAPER PERFORMANCE REPORT PRIMERGY BX922 S2 VERSION: 2.0A 2011-12-21
Page 44 (45) © Fujitsu Technology Solutions 2010-2011
Literature
PRIMERGY systems
http://ts.fujitsu.com/primergy
PRIMERGY BX400 S1
Data sheet http://docs.ts.fujitsu.com/dl.aspx?id=fab1fbb5-5d63-4b2d-816d-3def6c7cb6da
Performance Report PRIMERGY BX400 S1 http://docs.ts.fujitsu.com/dl.aspx?id=8816cb7a-14d3-4448-b96f-9f443273d128
PRIMERGY BX900 S1
Data sheet http://docs.ts.fujitsu.com/dl.aspx?id=0a5dcae5-f5a2-42dc-9039-7f887182bc5e
Performance Report PRIMERGY BX900 S1 http://docs.ts.fujitsu.com/dl.aspx?id=04568070-5767-4e66-9549-67008849b53c
PRIMERGY BX922 S2
Data sheet http:/docs.ts.fujitsu.com/dl.aspx?id=cb2281f2-b794-422b-aa87-a62dfeb7914c
Memory performance of Xeon 5600 (Westmere EP)-based systems http://docs.ts.fujitsu.com/dl.aspx?id=f622cc5b-c6f4-41c5-ae86-a642b4d5d255
RAID Controller Performance http://docs.ts.fujitsu.com/dl.aspx?id=ada7c1bf-74e3-4953-b783-839cdeec790b
Single Disk Performance http://docs.ts.fujitsu.com/dl.aspx?id=0e30cb69-44db-4cd5-92a7-d38bacec6a99
PRIMERGY Performance
http://ts.fujitsu.com/products/standard_servers/primergy_bov.html
OLTP-2
Benchmark Overview OLTP-2 http://docs.ts.fujitsu.com/dl.aspx?id=e6f7a4c9-aff6-4598-b199-836053214d3f
SAP SD
http://www.sap.com/benchmark
Benchmark overview SAP SD http://docs.ts.fujitsu.com/dl.aspx?id=0a1e69a6-e366-4fd1-a1a6-0dd93148ea10
SPECcpu2006
http://www.spec.org/osg/cpu2006
Benchmark overview SPECcpu2006 http://docs.ts.fujitsu.com/dl.aspx?id=1a427c16-12bf-41b0-9ca3-4cc360ef14ce
SPECjbb2005
http://www.spec.org/jbb2005
Benchmark overview SPECjbb2005 http://docs.ts.fujitsu.com/dl.aspx?id=5411e8f9-8c56-4ee9-9b3b-98981ab3e820
StorageBench
Performance Report - Modular RAID for PRIMERGY http://docs.ts.fujitsu.com/dl.aspx?id=8f6d5779-2405-4cdd-8268-1f948ba050e6
iometer http://www.iometer.org

WHITE PAPER PERFORMANCE REPORT PRIMERGY BX922 S2 VERSION: 2.0A 2011-12-21
© Fujitsu Technology Solutions 2010-2011 Page 45 (45)
STREAM
http://www.cs.virginia.edu/stream/
VMmark V1
Benchmark Overview VMmark V1 http://docs.ts.fujitsu.com/dl.aspx?id=5cbc7fe2-e493-479d-b52a-f88dc46efe21
VMmark V1 http://www.vmware.com/products/vmmark/v1/overview.html
VMmark V1 Results http://www.vmware.com/products/vmmark/v1/results.html
vServCon
Benchmark Overview vServCon http://docs.ts.fujitsu.com/dl.aspx?id=b953d1f3-6f98-4b93-95f5-8c8ba3db4e59
Contact
FUJITSU Technology Solutions
Website: http://ts.fujitsu.com
PRIMERGY Product Marketing
mailto:[email protected]
PRIMERGY performance and benchmarks
mailto:[email protected]
All rights reserved, including intellectual property rights. Technical data subject to modifications and delivery subject to availability. Any liability that the data and illustrations are complete, actual or correct is excluded. Designations may be trademarks and/or copyrights of the respective manufacturer, the use of which by third parties for their own purposes may infringe the rights of such owner. For further information see http://ts.fujitsu.com/terms_of_use.html
2011-12-21 WW EN Copyright © Fujitsu Technology Solutions GmbH 2010-2011