performance optimization and cloud applications
TRANSCRIPT

Lessons LearnedOn Performance Optimization
Christopher BennageAzureCAT patterns & practicesMicrosoft


Latency & Load

Practical Goals• Understand the capacity limits in our system• Achieve linear increases in capacity when scaling out• Keep latency within acceptable tolerances as load increases• Keep latency predictable regardless of load


Synchronous I/O


Defining the Test• Increase load over 10 minute period• Maintained maximum load for 5 minutes• Limited maximum load to avoid failed requests• Started with a load of 1 request/second• Increased load every minute by 400 requests/second• Latency has a minimum of 2 seconds

0:150:30
0:451:00
1:151:30
1:452:00
2:152:30
2:453:00
3:153:30
3:454:00
4:154:30
4:455:00
5:155:30
5:456:00
6:156:30
6:457:00
7:157:30
7:458:00
8:158:30
8:459:00
9:159:30
9:4510:00
10:1510:30
10:4511:00
11:1511:30
11:4512:00
12:1512:30
12:4513:00
13:1513:30
13:4514:00
14:1514:30
14:4515:00
0
500
1000
1500
2000
2500
3000
3500
4000
4500
0
1
2
3
4
5
6
7
8
9
10
AsynchronousLoadThroughputLatency

0:150:30
0:451:00
1:151:30
1:452:00
2:152:30
2:453:00
3:153:30
3:454:00
4:154:30
4:455:00
5:155:30
5:456:00
6:156:30
6:457:00
7:157:30
7:458:00
8:158:30
8:459:00
9:159:30
9:4510:00
10:1510:30
10:4511:00
11:1511:30
11:4512:00
12:1512:30
12:4513:00
13:1513:30
13:4514:00
14:1514:30
14:4515:00
0
500
1000
1500
2000
2500
3000
3500
4000
4500
0
1
2
3
4
5
6
7
8
9
10Synchronous
LoadThroughputLatency

0:150:30
0:451:00
1:151:30
1:452:00
2:152:30
2:453:00
3:153:30
3:454:00
4:154:30
4:455:00
5:155:30
5:456:00
6:156:30
6:457:00
7:157:30
7:458:00
8:158:30
8:459:00
9:159:30
9:4510:00
10:1510:30
10:4511:00
11:1511:30
11:4512:00
12:1512:30
12:4513:00
13:1513:30
13:4514:00
14:1514:30
14:4515:00
0
500
1000
1500
2000
2500
3000
3500
4000
4500
0
10
20
30
40
50
60
70
80
90
100Synchronous
adjusted scalesLoadThroughputLatency

Why would you do the bad?

Serial Message Processing


Improper Instantiation

0:00 0:15 0:30 0:45 1:00 1:15 1:30 1:45 2:00 2:15 2:30 2:45 3:00 3:15 3:30 3:45 4:00 4:15 4:30 4:45 5:00 5:15 5:30 5:45 6:00 6:15 6:30 6:45 7:00 7:15 7:30 7:45 8:00 8:15 8:30 8:45 9:00 9:15 9:30 9:45 10:000
100
200
300
400
500
600
0
0.2
0.4
0.6
0.8
1
1.2
1.4
1.6
1.8
2Instance Per Request
LoadPassedFailedLatency
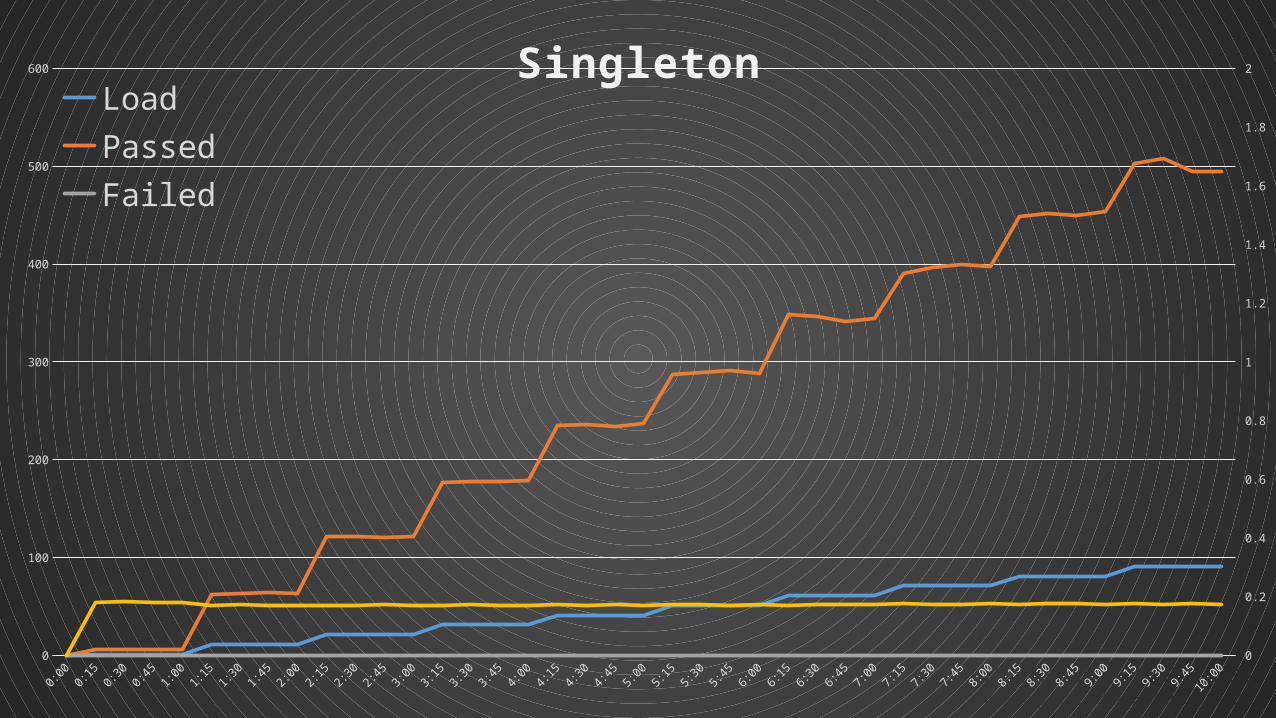
0:00 0:15 0:30 0:45 1:00 1:15 1:30 1:45 2:00 2:15 2:30 2:45 3:00 3:15 3:30 3:45 4:00 4:15 4:30 4:45 5:00 5:15 5:30 5:45 6:00 6:15 6:30 6:45 7:00 7:15 7:30 7:45 8:00 8:15 8:30 8:45 9:00 9:15 9:30 9:45 10:000
100
200
300
400
500
600
0
0.2
0.4
0.6
0.8
1
1.2
1.4
1.6
1.8
2SingletonLoadPassedFailedLatency

Busy Database


Why would you do the bad?

No Caching


No CachingLoad Test Setup


0:150:30
0:451:00
1:151:30
1:452:00
2:152:30
2:453:00
3:153:30
3:454:00
4:154:30
4:455:00
5:155:30
5:456:00
6:156:30
6:457:00
7:157:30
7:458:00
8:158:30
8:459:00
9:159:30
9:4510:00
10:1510:30
10:4511:00
11:1511:30
11:4512:00
12:1512:30
12:4513:00
13:1513:30
13:4514:00
14:1514:30
14:450
100
200
300
400
500
600
700
800
900
0
0.2
0.4
0.6
0.8
1
1.2
1.4
1.6
1.8
2
No Cache

0:150:30
0:451:00
1:151:30
1:452:00
2:152:30
2:453:00
3:153:30
3:454:00
4:154:30
4:455:00
5:155:30
5:456:00
6:156:30
6:457:00
7:157:30
7:458:00
8:158:30
8:459:00
9:159:30
9:4510:00
10:1510:30
10:4511:00
11:1511:30
11:4512:00
12:1512:30
12:4513:00
13:1513:30
13:4514:00
14:1514:30
14:4515:00
0
2000
4000
6000
8000
10000
12000
14000
0
0.2
0.4
0.6
0.8
1
1.2
1.4
1.6
1.8
2
Cache

“There are three kinds of lies: lies, damned lies, and statistics."

1 3 5 7 9 11 13 15 17 19 21 23 25 27 29 31 33 35 37 39 41 43 45 47 49 51 53 55 57 59 61 63 65 67 69 71 73 75 77 79 81 83 85 87 89 91 93 95 97 99 101 103 105 107 109 111 113 115 117 1190
20
40
60
80
100
120

average 14median 10
min 7max 104
50% 1075% 1090% 1095% 14
99% 100
100% 104

1. Instrument your application2. Instrument your application3. Observe4. Hypothesize5. Experiment6. Scope and Refine7. GOTO 3
Analysis Steps

Narrowing the Scope• Which high-level operations are having problems?• What high-level data can we correlate with the
problematic operations?• What is taking place inside the problematic operations?• Where is the time actually going?


Narrowing the Scope• What is taking place inside the problematic operations?• Where is the time actually going?


• “How NOT to Measure Latency” by Gil Tenewww.youtube.com/watch?v=DxF077s081Q• Performance Optimization project
github.com/mspnp/performance-optimization• Monitoring and Diagnostics Guidance
azure.microsoft.com/documentation/articles/best-practices-monitoring
Resources

© 2014 Microsoft Corporation. All rights reserved. Microsoft, Windows, Windows Vista and other product names are or may be registered trademarks and/or trademarks in the U.S. and/or other countries.The information herein is for informational purposes only and represents the current view of Microsoft Corporation as of the date of this presentation. Because Microsoft must respond to changing market conditions, it should not be interpreted to be a commitment on the part of Microsoft, and Microsoft cannot guarantee the accuracy of any information provided after the date of this presentation. MICROSOFT MAKES NO WARRANTIES, EXPRESS, IMPLIED OR STATUTORY, AS TO THE INFORMATION IN THIS PRESENTATION.