performance ofindigenous farming practices: a case study
TRANSCRIPT

;-': i\/"; •'. . , ., I~.·
PERFORMANCE OF INDIGENOUS FARMING PRACTICES: A CASE STUDY
OF MAIZE LAND USE TYPES IN UMZIMKULU AREA, EASTERN CAPE
LETHUKUTHULA L. JONGISA
UNIVERSITY OF KWAZULU-NATALCENTRE FOR ENVIRONMENT, AGRICULTURE AND DEVELOPMENT
PIETERMARITZ BURG
2005

Performance of indigenous fanning practices: A case study of maize land use types
in Umzimkulu area, Eastern Cape
By Lethukuthula Lemon Jongisa
A Mini-dissertation submitted in partial fulfilment of academic requirements for a Degree
ofMasters in Environment and Development, in the Centre for Environment, Agriculture
and Development, School of Environmental Sciences, University of KwaZulu-Natal,
Pietermaritzburg, South Africa, 2005
b
Declaration
This research was carried out under the supervision of Dr Denis Rugege who is Senior
Lecturer and Programme Director for Land Information Management in the Centre for
Environment, Agriculture and Development.
I Lethukuthula Lemon Jongisa, declare that the work contained in this Mini-dissertation
is entirely my own work with the exception of quotations or references which I have
attributed to their authors or sources. Furthermore it has not been submitted for any
degree or examination in any university.
Lethukuthula Lemon Jongisa
Dr Denis Rugege, Supervisor
......................................
c
Acknowledgements
I would like to express my gratitude to the people and institutions that contributed to the
completion of this research work.
• To Eastern Cape Department of Agriculture for giving me the opportunity to
participate in the Master of Environment and Development degree by funding my
tuition.
• To my supervisor Dr Denis Rugege and Co-supervisor Dr Franf;ois Naramabuye
for constant support and valuable guidance, especially for giving me a degree of
independence to work in my own way.
• To the local extension officers Mr Z Sithole, Mr D Gqwaru and Ms L Tatase;
without them I would not have been able to collect the massive data presented in
this thesis.
• To the farmers for their full participation and kindness they have displayed during
my data collection.
• To my colleagues Sindile Bidla and Mvuyisi Mbangeni for their unconditional
support and encouragement throughout the research work, I want to say to them
South Africa needs more people like you.
• My moth~r and dad, brother Thokozani, sisters Busisiwe and Khanyisile for every
role they played in bringing me where I am today
• My wife Sandisiwe and my daughter Ozie and sons Sethu and IDumie for making
me believe that there is a reason to go on in life.
d

NOTES
This Mini-dissertation is divided into Component A and Component B
Component A includes the following:
• Abstract• Research problem, objectives of the study and hypothesis• Literature review• Overview of study area• Methodology outlining the rationale for the approach.
Component B includes the following:
• Abstract• Brief introduction to the research problem; aims and objectives• Methodology• Results and discussion• Conclusions and recommendations
e

COMPONENT A
Performance of indigenous farming practices: A case study of maize land use types
in Umzimkulu area, Eastern Cape
Abstract
Although conventional or scientific farming practices have been encouraged and
promoted by state and other agencies, rural and resource poorfarmers have increasingly
resorted to indigenous farming practices. This study was undertaken to test the
hypothesis that indigenous farming practices are not only environmental friendly, but are
more profitable than conventional practices. A conceptual framework for testing the
hypothesis was formulated based on a comparison of Margins above Specified Cost of
indigenous and conventional farming practices. The data required were identified and a
methodology for data collection and analysis was designed. The research methodology
included a literature review, a GIS based sample scheme designedfor data collection and
statistical analysis.
As a major feature of this component of the mini-dissertation, the literature review
reveals that indigenous farming practices have positive impact on the environment by
improving soil through mulching, composting and use of non-toxic control ofpests and
diseases. On the other hand the review reveals that conventional practices can impact
negatively on the environment.

List of Contents for Component A
Abstract I
List of Contents for Component A ii
List of Tables 111
List of Figures 111
List of Abbreviations iv
1. INTRODUCTION 1
1.1 Problem statement 11.2 Objectives 21.3 Research hypothesis 2
2. LITERATURE REVIEW 3
2.1 INTRODUCTION 32.2 DEFINITION OF THE CONCEPTS 3
2.2.1 Indigenous farming practices 32.2.2 Conventional farming practices 4
2.3 DISTINGUISHING INDIGENOUS KNOWLEDGE FROM CONVENTIONALKNOWLEDGE 52.4 REVIEW OF CONVENTIONAL VERSUS INDIGENOUS FARMINGPRACTICES 6
2.4.1 Landpreparation 62.4.2 Seed selection 72.4.3 Planting 92.4.4 Soil care andfertility practices 92.4.5 Cropping systems 122.4.6 Weed control 132.4. 7 Disease andpest control 142.4.8 Storage 16
2.5 CHALLENGES FOR INDIGENOUS FARMING PRACTICES 162.5.1 Interaction between pre-existing knowledge and new knowledge 162.5.2 Gender and indigenous farming practices 162 5 3Ad' d' fi' ... ge an m 1genous armmgpractIces 182.5.4 Institutional support 182.5.6 Globalization 192 5 7 D . if' d' kn l d" ocumentatlOn 0 m 1genous ow e ge 202.5.8 Knowledge sophistication 202.5.9 Commercialization 202.5.10 Indigenous knowledge and education 21
2.6 THE USE OF GIS IN INDIGENOUS KNOWLEDGE 223 OVERVIEW OF STUDY AREA 23
11

3. 1 STUDY AREA 233.1.1 Location 233.1.2 Back ground ofthe area 243.1.3 Farming systems in Umzimkulu 253.1.4 Criteria for selection ofstudy area and sampling design 253.1.4 Weather conditions during 200312004 growing season 29
3.2 Discussion 294. METHODOLOGY 30
4.1 INTRODUCTION 304.2 CONCEPTUAL FRAMEWORK 304.3 DATA REQUIREMENTS AND COLLECTION METHODOLOGy 314.4 DATA ANALYSIS METHODOLOGY 344.5 LIMITATIONS TO THE STUDY. 34
5 OVERALL CONCLUSION 3S
REFERENCES 36
APPENDIXES 41
Appendix 1 Questionnaire 41
List of Tables
Table 1: Selected villages for farmer interview by administrative ward and BRU 26
Table 2: Symbol and codes of the Bio-Resource Units 32
Table 3: Ecotope defmition coding as described in Bio-Resource Units 33
List of Figures
Figure 1:Map showing locality of study area which is Urnzimkulu municipality 23
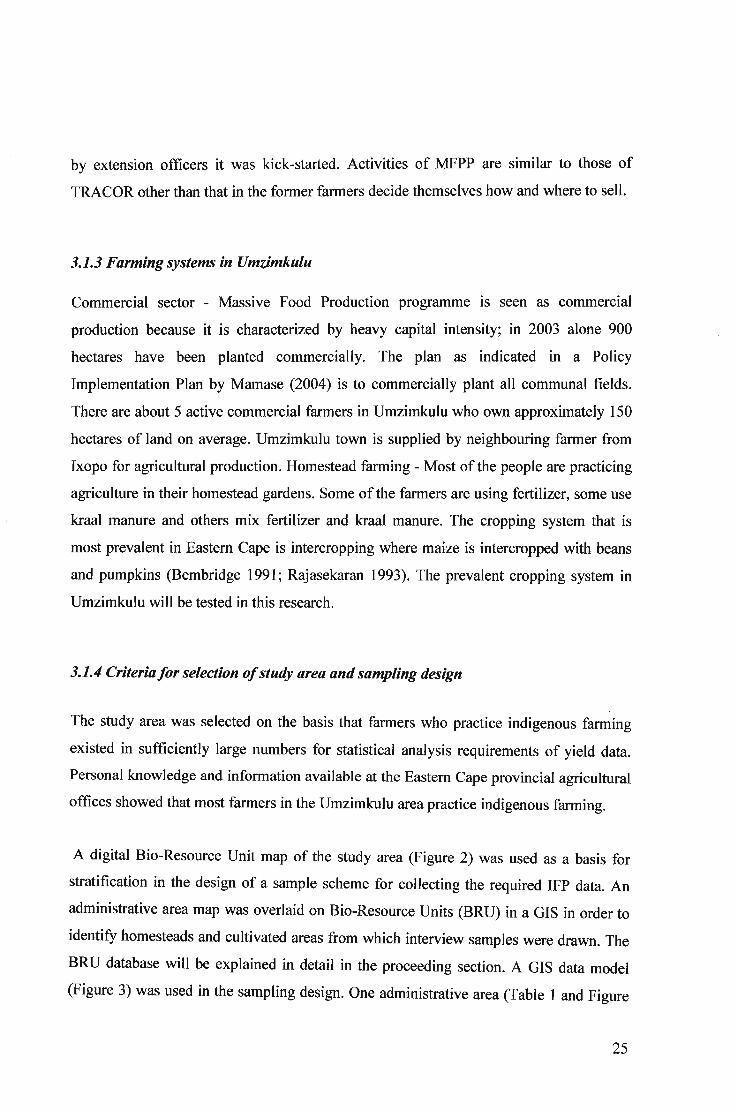
Figure 2: Map ofUmzimkulu Municipality showing randomly selected administrative
areas , 27
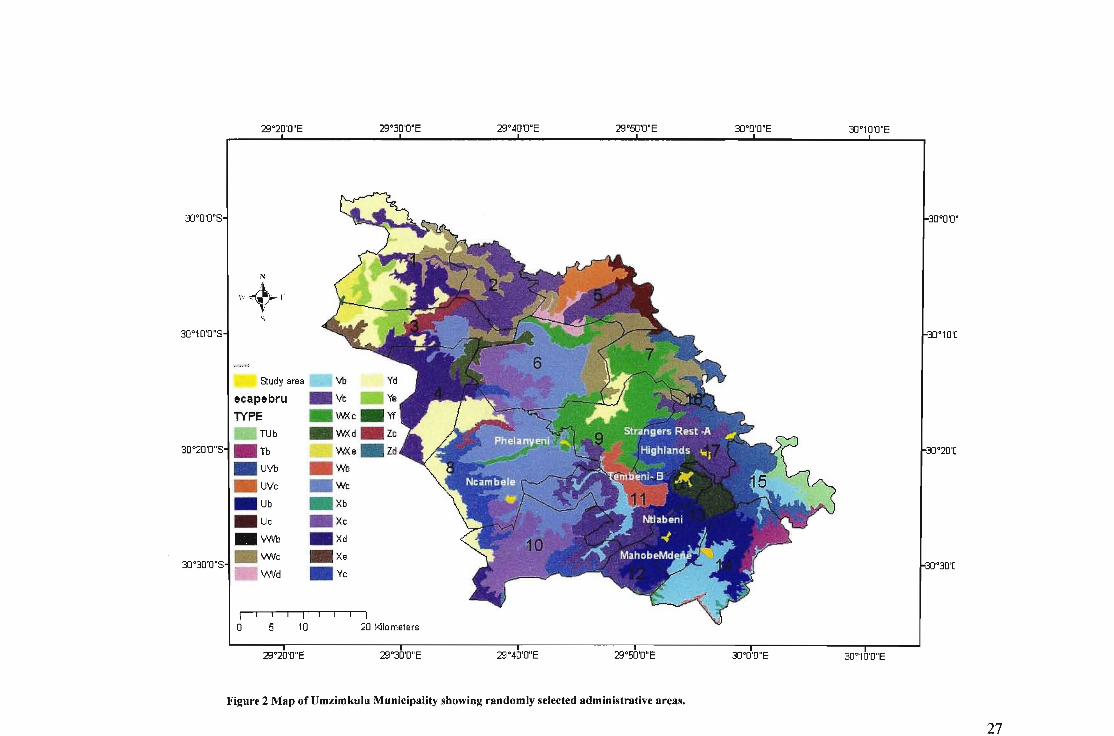
Figure:3 Diagram showing GIS operation conducted to select study area, 28
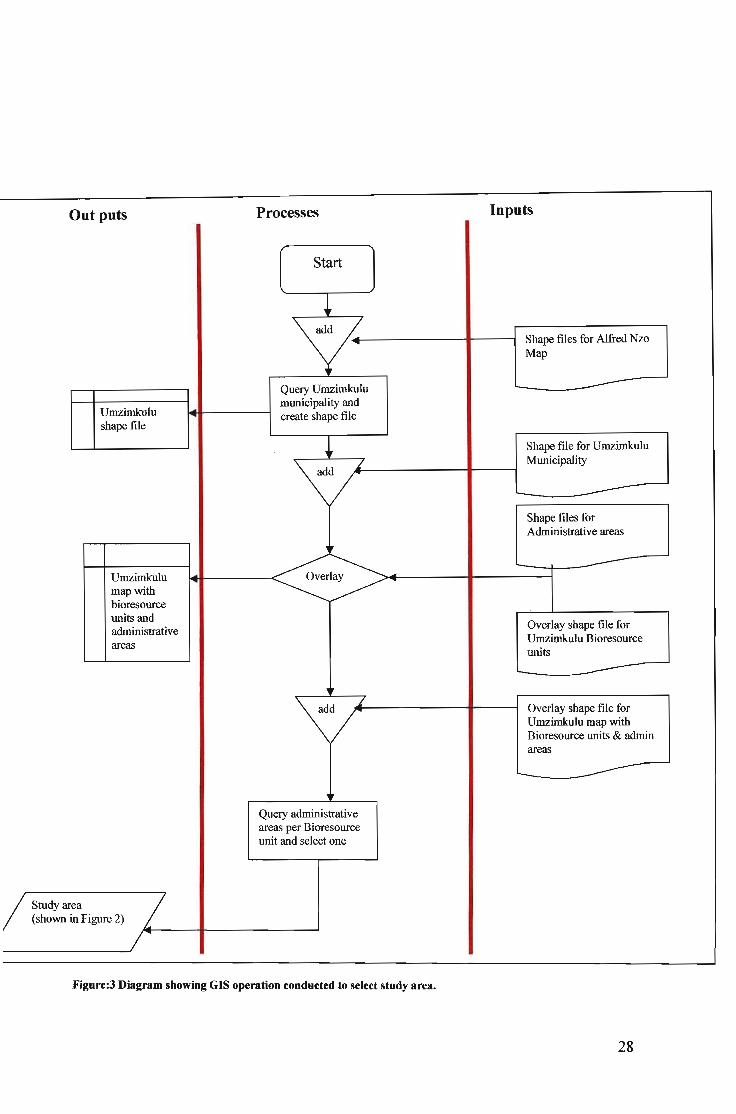
Figure:4 Rainfall normality for 2003-2004 map obtained form South African Weather
Service, 29
1ll
List ofAbbreviations
BRU Bio-Resource Unit
CFP Conventional Farming Practices
COMBUD Computerized Budgets
GIS Geographic Information Systems
IFP Indigenous Farming Practices
MaSC Margin above Specified Cost
MFPP Massive Food Production Programme
SPSS Statistical Package for Social Survey
TRACOR Transkei Agricultural Corporation
IV

CHAPTERl
1. INTRODUCTION
1.1 Problem statement
Most of the farmers have ignored indigenous methods and they have preferred
conventional methods of farming. The introduction of conventional farming knowledge
to African farmers was intended to increase production capacity, but this however
disregarded the fact that most of African farmers do not have economic resources to
engage in this western technology. Many African black farmers do not have access to
credit facilities; hence they cannot afford production inputs or pay for operational costs.
Conventional equipment is very expensive and needs huge capital investment.
There is a perception that indigenous farming cannot be used economically, this is based
on the fact that profitability of indigenous farming practices (IFP) has not been widely
studied. Conventional farming is geared towards maximising the yield than profit. Profits
are gaps between the value of goods and services produced and the cost of resource used
in their production (Barry, Ellinger, Hopkin & Baker 1995). Cost of production in
indigenous farming is very low in comparison with conventional farming, because of
cheaper and readily available inputs such as kraal manure, traditionally made seed, use of
animal draft power.
Although indigenous knowledge is increasingly becoming popular it has not been widely
integrated in research and development processes (Dawes 1993). Nothing or very little is
done to encourage farmers to use IFP in their production. Government and development
organizations have focused their investment on conventional farming practices (CFP)
because there is a perception that IFP is an out dated practice. Indigenous knowledge is
too much sophisticated for farmers of other societies and agricultural advisors to
understand, the absence of relevant literature to guide them is worsening the situation.
1

The above shortcomings form basis of the study that is established with the aim of
addressing the question of perception of profitability of indigenous farming practices.
This study would be conducted to document information describing the relationship
between farming practices and yield; farming practice and profit. This would be achieved
by studying IFP used by farmers in the Umzimkulu area of the Eastern Cape Province.
Farming practices that would be studied would include land preparation, seed selection,
planting, cropping systems, soil care (fertility) practices, pest control and weed control
methods. Component A of this research will review the existing literature, give an
overview of the study area, define methodology that would be used and outline
limitations of the study. The specific objectives ofthe study are listed in detailed below.
1.2 Objectives
1) To document Indigenous Farming Practices (lFP) used in maize based Land Use
systems in the Eastern Cape and assess the extent to which it is used.
2) To make profitability comparison between Indigenous Farming Practices (IFP) and
Conventional Farming Practices (CFP) for maize based Land Use Systems in the
study area.
3) To make recommendations for promoting IFP
1.3 Research hypothesis
Ho: There is no difference in profitability between Conventional Farming Practices
(CFP) and Indigenous Farming Practices (IFP) for rural small-scale maize based Land
Use Systems.
Ha: It is more profitable to use Indigenous Farming Practices (IFP) than to use
Conventional Farming Practices (CFP) for rural small-scale maize based Land Use
Systems.
2

CHAPTER 2
2. LITERATURE REVIEW
2.1 INTRODUCTION
This chapter reviews international and national literature primarily relevant to indigenous
farming practices. The different views of how various authors distinguish between IFP
and CFP are reviewed. Indigenous farming practices are reviewed in detail with specific
reference to their impact to the environment and the extent they are used. Comparison is
made between many countries. These farming practices are land preparation, seed
selection, planting, soil fertility and maintenance, cropping systems, weeding, pest and
disease control and storage, This chapter further reviews the involvement of women and
the impact of age in indigenous knowledge. The issues that are viewed by many authors
as challenges are also highlighted.
2.2 DEFINITION OF THE CONCEPTS
2.2.1 Indigenous farming practices
Agricultural knowledge is a practice, and agriculture is part of culture; successes and
failures in agriculture cannot be judged in instruments alone (Taylor, 2000). This means
that indigenous knowledge is embedded in the traditional practices of each society.
Indigenous farming practices are those practices that contain indigenous knowledge of a
particular society.
Emery and Associates (1997) define indigenous knowledge as knowledge that is sacred
and secular together; includes the supernatural, holistic of integrated - based on whole
systems and stored orally and in cultural practices. Rajasekaran and Warren (1994) view
indigenous knowledge as local knowledge that is unique to a given culture or society. It is
3
the infonnation base in society that facilitates decision making process. McCall (1996)
categorises indigenous knowledge into four categories, namely vernacular, specialized,
controlled and social knowledge. Vernacular knowledge being technical knowledge used
by most individuals such as pest control and weed control. Specialized knowledge being
technical knowledge being used by highly skilled resource people e.g. medicine.
Controlled knowledge refers to knowledge held by dominant group in the society and
social knowledge being knowledge that belongs to a particular clan.
In this study the indigenous knowledge will be defined as local knowledge that is unique
to a given culture or society. Indigenous fanning practices will be polyculture (mixed
cropping, multiple cropping, intercropping, interculture and relay planting), use of kraal
manure pure or mixed with commercial fertiliser, traditional prepared seed, unique land
preparation and planting methods and use traditional methods of weed and pest control.
The fanner who practices any of these practices will be defined as an indigenous fanner.
2.2.2 Conventionalfarming practices
Several authors use the tenn conventional knowledge interchangeably with Western
knowledge. In this Mini-dissertation the tenn 'conventional knowledge' will be used to
describe what other authors refer to as Western Knowledge except where an author is
quoted directly.
Conventional fanning knowledge is viewed as secular only; excludes the supernatural
analytical or reductionist, based on sub-sets of the whole and stored in books and
computers (Emery & Associates 1997). Warren (1991) adds that conventional fanning
knowledge is developed by universities, government research centres and private
industries. Eicher (2003) defines conventional agriculture as 'an industrialized
agricultural system characterized by mechanisation, monocultures, and the use of
synthetic inputs such as chemical fertilizers and pesticides, with emphasis on maximizing
productivity and profitability'. In this study this definition will be used to define CFP.
4

2.3 DISTINGUISHING INDIGENOUS KNOWLEDGE FROMCONVENTIONAL KNOWLEDGE
Agrawal (1995) differentiates indigenous knowledge from conventional knowledge by
history and evolution characteristics. Indigenous knowledge is much concerned with the
immediate and concrete necessities of people's daily livelihoods, it exists in a local
context and anchored to a particular community, while conventional knowledge IS
concerned with constructing general explanations (Agrawal 1995). Knowledge IS
transferred from one generation to another through training ties and social interactions
between different communities (prakash 2002). This means that indigenous knowledge
that has been improved when transferred to other generation is still indigenous
knowledge.
Indigenous knowledge systems are distinguished from conventional knowledge systems
by Kolawole (2001) 'on contextual, substantive, and methodological grounds. Firstly,
conventional knowledge systems are universal, due to the fact that Western education is
entrenched in many world cultures. Secondly, they have long been noted for their
rigorous observation, experimentation and validation procedures, all of which are
carefully documented. The same cannot be said of indigenous knowledge systems, in
particular when it comes to documentation'. With most of countries conducting research
and documenting their indigenous knowledge this differentiation may be irrelevant,
because it suggests that indigenous knowledge is indigenous when it is not documented.
Agrawal (1995) warns that 'the distinction between indigenous and conventional
knowledge can present problems for those who believe in the significance of indigenous
knowledge for development', and further suggest that 'attempt to create distinctions in
terms of indigenous technology and Western is potentially ridiculous. It makes much
more sense to talk about multiple domains and types of knowledge with differing logics
and epistemologies'.
5
2.4 REVIEW OF CONVENTIONAL VERSUS INDIGENOUSFARMING PRACTICES
2.4.1 Landpreparation
The use of tractor and other sophisticated implements are characteristic of conventional
land preparation for planting. It is well established that use of these implements in land
preparation has a negative impact to the soil structure. Fowler (1999) categorises
implements into two categories; those that loosen the soil e.g. the plough and those that
compact it e.g. rollers. Ploughing can result in soil being pulverised into fme tilth (Fowler
1999), thus resulting to wind erosion, while rollers can result in poor soil drainage and
aeration as they compact the soil.
On the other hand however, indigenous practices of land preparation are more pro-soil
conservation. Since time immemorial women used digging sticks and practised
conservation tillage (Van Averbeke 2002). Indigenous conservation tillage (Kayombo,
Ellis-Jones & Martin 2000) is still prevalent in areas with water deficit for example in
Kenya trash lines are constructed by placing crop residues on the line to impede run-off
and enhance infiltration, while in Tanzania ridges are us~d to retain some moisture in the
soil . In South Africa tillage principles that are used are derived from those expounded in
North America and Europe, except possible in the past five years when South African
researchers recently discovered and understood indigenous conservation (Fowler 1999).
Colonialists introduced metal hand hoes and the animal drawn plough. Fitshugh &
Wilhelm (1995) found that the use of animal draft power has been in existence since its
discovery, and has been a main source of power in agriculture. According to Van
Averbeke (2002) animal traction is not an indigenous technology because it was
introduced by colonialist 100 years ago, and has been forced to people through extension
services. Taylor (2000) argues that local knowledge incorporates both exogenous derived
technologies and new innovation that result from them. Local agricultural knowledge
does not operate in a vacuum; it exists with other external factors which affect it. When
colonialists introduced animal traction, African farmers adopted it to their condition by
6
,

introducing some changes (Simalenga, Belete, Mseleni & Jongisa 2000). Most of
indigenous knowledge has developed since then around animal traction and it has become
a cultural practice. Bobobee (1999) noted that researchers and policy makers see animal
traction as appropriate and affordable technology for farmers in most of the African
countries.
Bembridge (1984) reported that 60 percent of farmers in the Eastern Cape who were
applying kraal manure used animal drawn planter. This in itself indicated that new
knowledge has been developed by African farmers, which did not exist and was never
introduced to them.
2.4.2 Seed selection
Agricultural (conventional) development has had negative impact on native plant species
worldwide because it has replaced them with marketable crops (Easton & Ronald 2000).
Replacement of indigenous seed with the so-called genetically improved seed has not
been adopted fully well by African farmers as Bembridge (1991) noted that in Transkei
less than half on farmers were effectively implementing the practices of improved seeds.
In Latin America Quiroz (1996) also found that maize farmers were still continuing to
select local varieties, in spite of the widespread adoption of a modem, high-yielding
variety.
As conventional agriculture converts ever-increasing portions of earth's land surface to
monocu1ture, the genetic and ecological diversity of the planet erodes (Soule, Carre &
Jackson 1990). The use of hybrid seed results to the impoverishment of genetic stock,
developed over years by human agriculture (Easton & Ronald 2000). Reduced genetic
diversity in crops results in a loss of flexibility to meet future breeding challenges; as a
results recent gains in yield have been achieved by increased dependency on a very few
genetically narrow cultivars (Soule et al. 1990).
Although the use of traditional seed could be attributed to backwardness, Sibanda (1998)
suggested that agencies should first investigate indigenous people, then develop and
7

improve upon indigenous technologies. Agrawal (2004) also added that scientists ignore
indigenous knowledge of farmers because they have little interest of externalizing
farmer's tacit knowledge.
The farmers in Timor have developed a set of strategies to select the seeds as noted by
Kieft (2001), which are holistic in nature and include both physical and spiritual
indicators, are widely practised and are of significant relevance to agricultural
development. In Lesotho Rosenblum, Jaffe & Scheerens (2001) found that farmers used
household sowed local seeds, on 95 percent of their cropland, often saved from their
previous harvests. In Ifugao Rice Terrace Joshi, Matchol, Bhatam & Penia (2000) noted
that rice farmers have a particular way of selecting seed, they selected big, healthy and
stout panicles. These farmers have not used variety recommended by extension officers
because they believe that traditional variety has superior eating quality with heavy and
non shattering grains (Joshi et al. 2000).
The reasons for using traditional practices differ according to different reasons. In
Tanzania, Nyaronga, Wein, Olanya & Ojaimbo (2004) found that majority of farmers (89
percent) were using traditional seed because of high costs of certified seeds. In some
cases the treated seeds and certified seeds are not readily available when needed. Taste
and quality are also determinate factors in seed selection. Genetically modified seed are
said to be less tasty in comparison with traditional seeds (Nyaronga et al. 2004).
Women played a leading role in seed selection as they had in-depth knowledge of
indigenous edible plant. Taste appears to be counting more than size and quantity of
production. In a lesson learnt in India (AgrawaI2004) it was found that women have been
responsible for seed selection and domestication of seed because of their responsibility to
the family (Easton & Ronald 2000). Once farmers adopt crops and cycle seeds, local
varieties eventually emerge with high genetic variation and adaptation within the
cropping system.
8
2.4.3 Planting
Conventional farming employs scientifically researched crop calendars for establishing
planting dates. However, indigenous farmers select planting periods based on their
cultural beliefs and probably based on the observation of natural plant growth.
Agricultural knowledge is not only knowing how to plant or theorization about the crop;
it is about technical proficiency of wielding a hoe or managing oxen and cultural
proficiency (Taylor 2000). Time of planting is viewed by traditional farmers as one of
the most fundamental factors that affect crop production. The early planting (Bajwa &
Schaefers 1998) is used as a tactic for crop protection in several situations in east Africa.
Indigenous planting methods in many African countries have been the activity of women.
Van Averbeke (2002) noted that the common practice by African women for planting
was to broadcast seed before land preparation. This has been practised from time
immemorial. This practice has been introduced in recent years as modem knowledge
under the name of Zero Tillage or Conservation Tillage. Zero tillage and conservation
tillage are terms used interchangeably to refer to planting the soil without tillage.
2.4.4 Soil care andfertility practices
Soil structure, fertility and pH are some of the most fundamental characteristics of good
soil. Conventional soil fertilizing for crop growth is mainly based on chemical fertilizer
applications. Inappropriate timing and quantity of fertilizer application on field crops can
lead to excessive leaching of nutrients into underground water or surface water system
(Province of British Columbia 2001). Fertilizers release their nutrients based primarily on
temperature. Nitrogen is of greatest concern due to its solubility in water and potential for
nitrate contamination of groundwater (Province ofBritish Columbia 2001).
Fertilizer Society of South Africa (2000) noted that continuous use of nitrogenous
fertilizer results in acidification of soil, thus resulting in gradual drop of yield. Acidity
also reduces the general bacteria and biological life in the soil. Continuous use of
fertilizer can also result in saline soil which brings about retarded growth. Some of the
9

chemicals applied are leached or washed away, thus polluting water down stream.
Contamination with nitrate, a common fertilizer ingredient, can result in an illness called
methemoglobinemia in infants (Soule et al. 1990).
However, indigenous practices provide more sustainable alternatives of soil care and
fertilization. Indigenous soil care and fertility according to Rajasekaran (1993) refers to
the practices evolved, adopted, and modified by farmers based on their own informal
experiments with an objective of maintaining the fertility and productivity of the soil.
These include practices such as crop rotation, fallowing, farmyard manure, casarian
leaves and river band sand.
Van Averbeke (2002) noted that Nguni people did not use kraal manure despite its
abundance in their households instead they used fallowing and shifting cultivation to
address fertility and declining crop yields. Shifting cultivation and slash-and-burn, were
common practices among indigenous people of Asia and lowland Latin America, and
provided them with a high degree of economic independence and cultural integrity
(Burger 1990; Reijntjies, Haverkot & Waters-Bayer 1992). Shifting cultivation involves
alteration between crops, for example forest is burnt to clear the land and provides ash as
fertilizer or lime for soil (Reijntjies et al. 1992).
Fallowing is an indigenous soil fertility practice in which farmers rest the cultivated lands
for a certain period before using it again (Rajasekaran 1993). Recently this practice has
been incorporated to conservation tillage by researchers. Shifting cultivation and
fallowing were used interchangeably; the field that showed reduction in yield were
abandoned to fallow and remain unused many decades (Reijntjies et al. 1992), until
vegetation recovers (Itani 1998), in this way soil erosion is minimized because roots of
the de-bushed trees still exist.
Although use of kraal manure is an invention of African rural farmers Van Averbeke
(2000) maintains that it is a fairly recent practice not more that 100 year old and chemical
fertilizer was only introduced in the 1960s. In a survey conducted in Transkei Mkile
10

(2001) found that 43 percent of farmers applied kraal manure before planting. Most ofthe
farmers have come out with a new technique of mixing kraal man4re with granular
chemical fertilizer and gromor. In West Niger it was reported that farmers because of
insufficient kraal manure to fertilize the entire field; they developed a strategy of shifting
livestock from one low productive spot to another (Lamers, Feil, & Suerkert 1995).
Rice farmers as observed by Rajasekaran (1993) rear sheep for their manure, and they
indicated that five to six sheep are sufficient to manure one acre of rice. Rice farmers in
Ifugao Rice Terrace incorporated organic fertilizer such as sunflower leaves into the soil
prior to land preparation and seed sowing (Joshi at al. 2000). The use of kraal manure by
farmers depends on the social condition. In a study carried in Western Niger (Lamers et
al. 1995) three groups of farmers were identified; rich, moderately wealthy and resource
poor farmers. Moderately wealthy farmers and poor resource farmers were found to be
the only farmers using kraal manure.
Lamers et at. (1995) also noted that farmers use soil colour and texture to differentiate
between levels of soil fertility. In South Africa Van Dissel & de Graaf (1998) found that
the perception of farmers in erosion is far different from the one of researcher scientists.
The major differences are centred around perception of environment as a whole, on one
hand scientist believing that farmers influence land degradation on the other hand farmers
believing that it is God driven process. Management of soils revolves around husbandry
techniques that ensure good yield, as opposed to the simple addition of externally derived
inputs (Taylor 2000). For this reason indigenous farming is associated with low resource
farming.
Mulching is a common indigenous practice to recycle nutrients (Reijntjies et at. 1992).
Most of agricultural soils in South Africa have no humus. According to Milner (1996)
agricultural experts recommend that soil should contain at least 5 percent humus but in
fact soil contains 0.3 percent on average. The vegetative material that is left to mulch has
nutrients that were extracted from soil, by mulching them recycling takes place. The
benefits of mulch as listed by Milner (1996) are:-
11
• Prevents weed from growth because it blocks sunlight
• Keeps roots cool in summer
• Keeps roots warm in winter
• Provides food for soil bacteria and earthworms
• Protects bare soil from wind erosion
• Prevents water from evaporation
Mulching modifies the soil temperature by reducing exposure to the sunlight, conserves
the moistures and reduces erosion (Wolfe, Ross, Diem, Dillaha & Flahive 2002), and
provides food for soil bacteria and earthworm (Milner 1996). Earthworms play a vital
role in aerating the soil.
Composting is another soil fertility complementing indigenous practice that can be
integrated with mulching. The mulch that is left on the ground is converted into nutrients
through a decomposition process by bacteria (Wolfe et a/2002). Compost improves the
soil as it increases soil water retention and promotes the activity of earthworm and soil
micro-organisms.
2.4.5 Cropping systems
Conventional farming systems typically employ mono-cropping. In most of Africa,
mono-cropping was also introduced by colonialists. Colonial agricultural extension
services were aimed at eliminating multiple cropping (Easton & Ronald 2000), mainly to
grow cash crops for colonial consumption. This has resulted in the impoverishment of the
poorly resourced farmers. In South Africa, rural farmers were advised to plant one crop in
one plot without taking into consideration the current land distribution. The question of
where to derive other food types to ensure a balanced diet that is essential for survival has
been deliberately ignored by critics of indigenous cropping practices.
Nevertheless, indigenous polyculture has been maintained ~s a major cropping system
(Rajasekaran 1993) in many African countries. Many terms have been used to describe
polyculture including mixed cropping, multiple .cropping, intercropping, interculture,
12
relay planting and mixed farming (Bajwa & Schaefers 1998). Polyculture is a system of
cropping in which farmers cultivate two or more crops of different stature in alternate
rows or same rows simultaneously.
Bembridge (1984) indicated that intercropping was widely used in Transkei despite the
fact that it was not recommended by extension officers. In South Africa maize is often
intercropped with beans and pumpkins (Van Averbeke 2002). Bembridge (1986)
suggested that local researchers should put more focus on evaluating intercropping
systems with a view of improving intercropping technology. The reasons for using
polyculture vary from one country to another. Some of the reasons could be that there is
not enough land to practice monoculture, or there is not enough labour or capital to invest
on ploughing, harrowing and fertilizing land. Silwane (2000) found that 76 percent of
farmers in the Eastern Cape intercrop maize, beans and potatoes and that 93.7 percent of
these farmers planted these crops in rows. As stated in the hypothesis of this research, it
is implied that the production of multiple crops using indigenous polyculture not only
guaranties a balanced diet for the nutritional requirements of farmers and their
households but is actually more profitable than co.pventional monoculture as the costs of
production for indigenous polyculture are much lower. Also, surpluses of various
produce are marketable within the communities and are able to be sold profitably.
2.4.6 Weed control
The dominant practice that was used by farmers in developing countries was burning the
weeds, what is referred to as slash and bum by Burger (1990). Hand weeding has been
used widely in African continent not only because it is the best, but because labour can be
paid in kind and not cash (Shetto, Kwiligwa, Mkonwa & Massunga 2000). The use of
hand hoes is seen as time consuming requiring 300 ~OO hours per hectare and the use of
animal drawn cultivars reduce labour remarkably.
Reduced tillage is believed to be reducing the weed from the soil, and Fowler (2000)
maintains that weed spectrum has a tendency to change under reduced tillage. Farmers in
13
Tanzania (Reijntjies et al. 1992), and in South Africa did superficial hoeing and left dead
weed material on the soil surface as proactive mulch to recycle nutrients and prevent
weed re-growth by blocking the essential light as already mentioned earlier.
2.4.7 Disease andpest control
Chemical pesticides and fungicides are typically applied in conventional farming to
control pests and diseases. Application of pesticides may therefore not be a successful
strategy. Most pesticides are toxic. Besides the undesirable pests for which they are
intended, pesticides can harm other organisms including pets, livestock, wildlife and
human beings. Pesticides and herbicides make environment unfavourable for some
microbial activities. Pesticide formulation has some chemicals which can change the pH
of the soil (Vermeulen, Sweet, Krause, Hollings & Nel 1990), for that reason not every
pesticide formulation is suitable to be used on plants. For example, some formulations
can only be applied when certain weather conditions prevail or in particular plant species.
Excessive amounts of pesticides can run off and contaminate streams, rivers and
groundwater.
Bembridge (1991) suggested that innovators should have knowledge of the characteristics
of rural farming populations so that new innovations can be adopted by farmers.
Rajasekaran & Warren (1994) added that it is cost effective to use indigenous knowledge
since it builds on local knowledge. According to Joshi et al. (2000) most farmers know
pests and pest damage, although names may be different frQm those used by scientists.
Joshi et al. (2000) also found that majority of rice farmers in lfigao Rice Terraces were
not using pesticides, despite the fact that they did not know how to control pests.
Indigenous farming practices do not use toxic substances in controlling pests and
diseases. Indigenous techniques include digging-out and destroying the pest or using bait
to trap the pest (Bajwa & Scheafers 1998). Traditional practices of biological pest
control have recently been the subject of increasing scientific interest, and some
interesting findings have been documented. An example is cited by Reijntjes et al.
14

(1992), of China citrus growers who started a century ago to control insect damage in
oranges by placing predacious ant.
Bajwa & Schaefers (1998) maintain that fallowing makes the condition unfavourable for
pest infestation because it breaks pest and disease cycles. Continued cropping in the same
plot can increase insects and disease problems, while shifting cultivation may be seen as
an extreme measure to escape pest and diseases (Bajwa & Schaefers 1998).
In India (Prakash 2002) it was found that farmers previously were using pesticides, but
are currently using indigenous practices in controlling pest such as sowing of green
manure crop in paddy field boundaries, a practice that also improves soil fertility by
adding nitrogen. It is a common behaviour by resource-poor farmers that when new
knowledge is introduced it is adopted in large numbers, but as the time passes, farmers
gradually revert to their indigenous practices.
Early planting of maize as a cultural practice in East Africa plays a significant role in
reducing problems of maize leafhopper and stalk borer (DePury 1968; Warui & Kuria
1983 & Prinsley 1987 as cited by Bajwa & Schaefers (1998).
The other method used by indigenous farmers (Bajwa & Schaefers 1998) is crop rotation.
It helps in separating crops from their pest by space and time. Rotation is effective for
soil pest such as nematodes and cutworms. It is only those species with deeper nests that
are able to survive on certain plant residues when normal cultivation and crop rotation are
used (Bajwa & Schaefers 1998). Farmers in Lesotho as discovered by Rosenblum et at(2001) rotated their maize with wheat to control population of stalk borer.
According to Bandyopadhyay & Saha (1988) farmers in India sow more seed than they
actually need to cater for the amount that will be consumed by fowl, snails and wild
birds, or to cater for unexpected climatic conditions.
15

2.4.8 Storage
In India according to Pidatala & Khan (2003) farmers use practices such as threshing (use
of wooden stick) winnowing (use of broom sticks) cleaning (use of sieves) and drying in
their post harvest operations and storage of grains. Mechanical injury of stored grains
during threshing, shelling predisposes them to attack by pest (Bajwa & Schaefers, 1998),
hence it is recommended that damaged grains should be consumed first. The most
common method of storage structures used by indigenous African farmers is mud
thatched granary (Davis 1970 as cited by Bajwa & Schaefers, 1998). The advantage of
mud structure is that it is cheap to construct, yet it does not differ to other plastered
structures which are expensive in terms of storage quality.
2.5 CHALLENGES FOR INDIG~NOUSFARMING PRACTICES
2.5.1 Interaction between pre-existing knowledge and new knowledge
Indigenous knowledge is constantly evolving. Its .enrichment will depend on whether it
can interact with new types of information, and can be used to solve emerging problems.
However, the process by which pre-existing knowledge and new information interact
needs to be explored, so that research and extension approaches can be designed to
facilitate the acquisition of knowledge by farmers and counteract the erosion of their
prior knowledge (Ortiz, 1999).
2.5.2 Gender and indigenous farming practices
Women are generally ignored by researchers and their knowledge is undermined as
Zweifel (1997) noted that the growing interest in women's indigenous knowledge on the
part of researchers does not necessarily imply an appreciation of their knowledge, skills
and capabilities. Zweifel (1997) further maintains that studies of women's indigenous
knowledge may even harm them. Scientists tend to overlook the fact that women are
plant breeders and experts in local biodiversity. In some cases they fail to perceive
16

women's knowledge as real knowledge, often referring to it as primitive and intuitive
(Zweifel1997).
Women in rural areas of South Africa are also responsible for specific tasks such as
collecting traditional fodder, hoeing, weeding, irrigating, feeding animals, harvesting
grains, fruits and vegetables. Women have been ignored in farming decision-making
despite their role (Pidatala & Khan 2003). This is because there is a perception that
women do not have knowledge about farming and even if they had it, it does not differ
from the one of men. Anderson (2001) noted that even if women are farming they are
perceived to be assisting their husbands. Haile (2004) found that in Ethiopia women are
ploughing with oxen and they were innovating in many agricultural aspects.
Women in most societies play a significant role in managing the diversity of the
ecosystem, since they are responsible for sustaining the livelihood of the family (Zweifel
1997). Easton & Ronald (2000) noted that indigenous knowledge of edible plants is
vested with women in Africa. In Burkina Faso rural women collect roots of native plants
like baobab tree (Adansonia digitata) for use in the diet for their families, while in Sudan
women cull seeds and preserve a spread of varieties that will ensure resistance to
different conditions that may prevail (Easton & Ronald 2000). Information of indigenous
knowledge can therefore be viewed and perceived differently by different genders.
Pidatala & Khan (2003) added that understanding the role of gender and the way it
impacts the intrinsic value of local knowledge system is of critical importance as it
determines the dissemination of information. Research done in India indicated that post
harvest activities are largely the responsibility of women, and further suggest that women
be involved in the development of harvesting technology (Parvathi, Chandrakandan &
Karthikeyan 2000). In Timor (Kieft 2001) has shown that seed selection and seed storage
are a responsibility ofwomen.
Almost all biodiversity within reach of rural societies is used, developed and maintained
by local women (Zweifel 1997). It can therefore be concluded that women are
17
responsible for indigenous plant breeding. The challenge is upon researchers and
innovating institutions to involve and acknowledge women role in indigenous farming.
2.5.3 Age and indigenous farming practices
Young people learn values of life from the elders of those particular societies, and if the
values are not implanted at an early stage there might be deviations form cultural
practices. Agriculture is a part of cultural practices in a society and is inherited from
generation to generation. Bembridge (1986) found that in rural areas of Transkei most of
the progressive farmers were young farmers because they had higher level of aptitude.
However, contrary to that, one can attribute the progressiveness of young farmers to
physical capabilities. Indigenous farming is by far and large a laborious activity, it
requires farmers to be in a healthy status and to be physically fit. For example the use of
animal drawn planter and hand hoeing.
When transferring new knowledge to rural farmers it is important that scientists take the
age into consideration. Elderly people are known to be resisting new changes and this is
confirmed by Bembridge (1991) that innovative farmers are young. Traditional young
people have limited control over decision making because this is regarded as the activity
for elders. This results in knowledge completely being rejected if it does not suit the
needs of elderly people.
Urbanization has resulted in many young people moving to towns (Pidatala 2001), and
that has resulted in the slow transfer of knowledge to young people. Even those who
cannot find jobs in urban areas when they return, their minds are also urbanized.
Westernization has resulted in many young people viewing indigenous knowledge as
obsolete and out dated compared to western cultural practices (Sibanda 1998).
2.5.4 Institutional support
Bembridge (1986) highlighted that there is a lack of institutional support in terms of
operating policies and suitable technology for indigenous farmers. Most government
18

support such as technology transfer and research is geared towards conventional
innovations. Nothing or very little is done to improve the locally developed knowledge.
Educational institutions that are major sources of information are mostly promoting
conventional knowledge and technology. Endeavours have been made to transfer
conventional knowledge under the good name of 'participatory methods'. It is important
that clear distinction is made between disseminating conventional knowledge and
improving upon indigenous knowledge.
Farmers need more meaningful options than perceptions. Agrawal (2004) suggested that
scientists and development planners who want to develop (not to introduce) new
knowledge need to first look at what farmers are doing, how are they doing it and
understand the reasons why they are doing it.
Agriculture in South Africa has been shaped by political forces that were based in the fact
that there is nothing to learn from black farmers (Taylor 2000). This has created a legacy
of socio-economic and political entanglement that has promoted a highly developed
commercial white farming sector, that was supported by state institutions and agricultural
policies. An illustration of this is in the fact that in many developing countries indigenous
vegetables are overlooked by policy makers and extension officers, while exotic
vegetables are promoted mainly for commercial purposes (Rubaihayo 1994).
2.5.6 Globalization
In Africa substantial indigenous knowledge has disappeared with colonization.
Globalization is irresistible and cannot be avoided. If no tentative measures are taken to
preserve indigenous knowledge, most of it is likely to disappear completely (Pidatala
200 I). Pidatala (200 I) also noted that many countries and development organizations
have started initiatives to preserve and revitalize their indigenous knowledge as a
measure to counter the effects of globalization.
19

2.5.7 Documentation o/indigenous knowledge
Indigenous agricultural knowledge is passed as culture to other generations and there is
no formal training. Pidatala (200 I) confirmed that indigenous knowledge collectors are
liberated activists with no formal training in the theory of analysis and presentation of
results. Sibanda (1998) warns that while documentation of indigenous knowledge
systems is a major factor, the absence of scientific procedural explanations is worsening
the situation. This calls for indigenous knowledge scientific research and publication of
literature more especially in vernacular language.
2.5.8 Knowledge sophistication
Agrawal (2004) classified knowledge as (i) explicit; which can be easily recorded and (ii)
tacit; which cannot always be articulated. Knowledge that farmers of a particular society
posses, may be too much sophisticated for farmers in other society to understand
(Kolawole 2001). This may hinder intersociety transfer of knowledge. The sophistication
of knowledge can be a problem in so much that scientist may confuse it with myth. It is
also a challenge even to researchers, because when they do not understand certain
practice they will take that knowledge as irrelevant and useless. It is therefore important
that researchers have a clear cultural background of the topic they are researching.
2.5.9 Commercialization
Although indigenous knowledge is increasingly becoming popular it has not been widely
integrated in research and development processes (Dawes 1993). Government and
development organizations have focused their investment on CFP because there is a
perception that IFP are outdated and cannot be used commercially. The indigenous
practices are termed as primitive and their technology as stone-age and most researchers
don't believe they can get fruitful results from them.
20

Although European civilization in South Africa was established in 1652 by Van Riebeek,
Holtzhasen (1993) maintains that commercialization of indigenous plants has been very
insignificant. In the fruit category only watermelon has made it in the commercial world.
Rooibos, a traditional herbal tea of Khoi people in the Cape Province is one of the
indigenous plants that has became an important commercial crop. Judging from the
number of plants that have been commercialized one can conclude that most of the
valuable knowledge that can be used commercially is hampered by wrong perceptions
scientists have on indigenous knowledge. However, contrary to Holtzhasen (1993), one
can argue that most of the indigenous knowledge has been commercialized. The reason
why this has not been noticed is that once scientists adopt indigenous knowledge, it is
taken as new conventional or scientific knowledge.
2.5.10 Indigenous knowledge and education
Indigenous knowledge can play a vital role in knowledge development at large.
Ulluwishewa, Kaloko & Morican (1997) suggested that the philosophy of 'from the
known to the unknown' should be adopted if education is to be effective. This will be a
different move form participatory research where researchers develop new knowledge,
not from the practices of the farmers but from elsewhere, and trials are done with farmers
so that technology transfer takes place.
Teachers should invite farmers who are practicing indigenous farming to make
presentation and compare with conventional methods of production. Pupils are already
familiar with their culture, and therefore, they would find it interesting to learn about the
environment through these cultural forms. The subject of indigenous farming should be
introduced in institutions where extension officers receive their education. The statement
by a Rhodesian administrator in 1926 that intercropping is nothing more than 'hit and
miss planting in mixtures' is an indication ofperception of indigenous African agriculture
that persists today. These perceptions include National Agricultural Research and
Extension Systems (NARES), International Agricultural Research Centers (lARCs) and
among expatriate researchers and technicians (Jiggins 1989; Peters 2000 in Barrett,
2000).
21

2.6 THE USE OF GIS IN INDIGENOUS KNOWLEDGE
Farmer knowledge is valid and rational like scientific knowledge and it is an important
factor when planning resource management. It can be quantified, systematically
organised and geo-referenced by means of Geographic Information Systems (GIS). Many
countries are now starting to promote the use of indigenous knowledge, such knowledge
must be available and accessible. Lawas & Luning (1996) maintain that collection of
information from diverse indigenous sources from different locations around the world is
laborious costly and time consuming so proper storage must be ensured. All the
challenges of IFP can be attributed to it perception by researchers, policy and decision
makers and fellow farmers. GIS has an advantage in that it narrows the 'distance'
between professionals and resource users by being able to include the geographical
location of information sources of knowledge and resources.
2.9 DISCUSSION
Literature review revealed that indigenous farming practices (IFP) have a positive impact
to the environment such as mulching, composting and non toxic control of plant pest. It
has also been illustrated that conventional farming can lead to soil degradation, water
pollution, plant injury and loss of genetic diversity. Literature review has also shown that
IFP is still widely practised in developing countries by poor resource farmers. All the
challenges of IFP can be attributed to its perception by researchers, policy and decision
makers and fellow farmers. The use of GIS in promoting and documenting IFP can be
viewed as a solution to most of the challenges of IFP. While IFP is widely practised by
farmers in developing countries and shows positive impact to the environment, its
relationship with maize yield and profitability has not been clearly demonstrated. The
next chapter focuses on how study area was selected to assess relationship between
various IFP and maize yield.
22
CHAPTER 3
3 OVERVIEW OF STUDY AREA
3. 1 STUDY AREAThis chapter describes the methodology followed in identifying the study area, the design
of data sampling scheme. It further describes the study area, its historical background and
justifies its selection by describing criteria used.
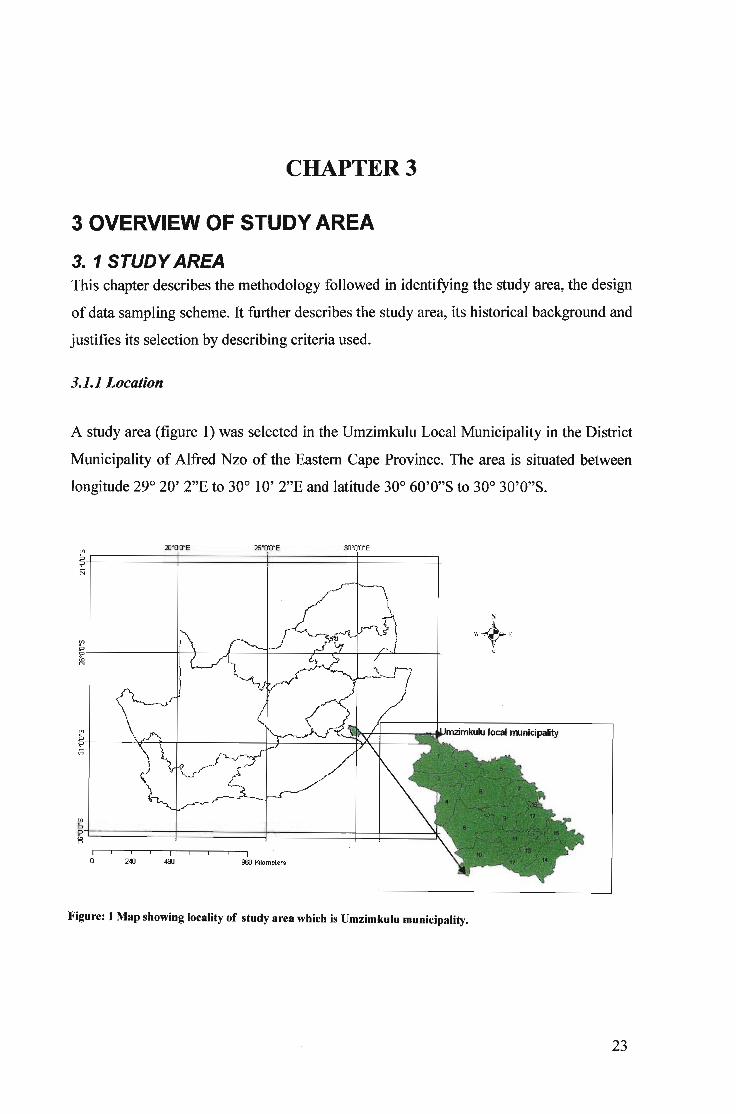
3.1.1 Location
A study area (figure 1) was selected in the Umzimkulu Local Municipality in the District
Municipality of Alfred Nzo of the Eastern Cape Province. The area is situated between
longitude 29° 20' 2"E to 30° 10' 2"E and latitude 30° 60'0"S to 30° 30'0"S.
3D'O'O"E2500\l"E2000\l"E(JJ
~-t=========+=========+=========+========+-N
I980 Kilometers
I480
I
240
~
Pt========+=========i==========1'===i====~'"1Il
Figure: 1 Map showing locality of study area which is Umzimkulu municipality.
23
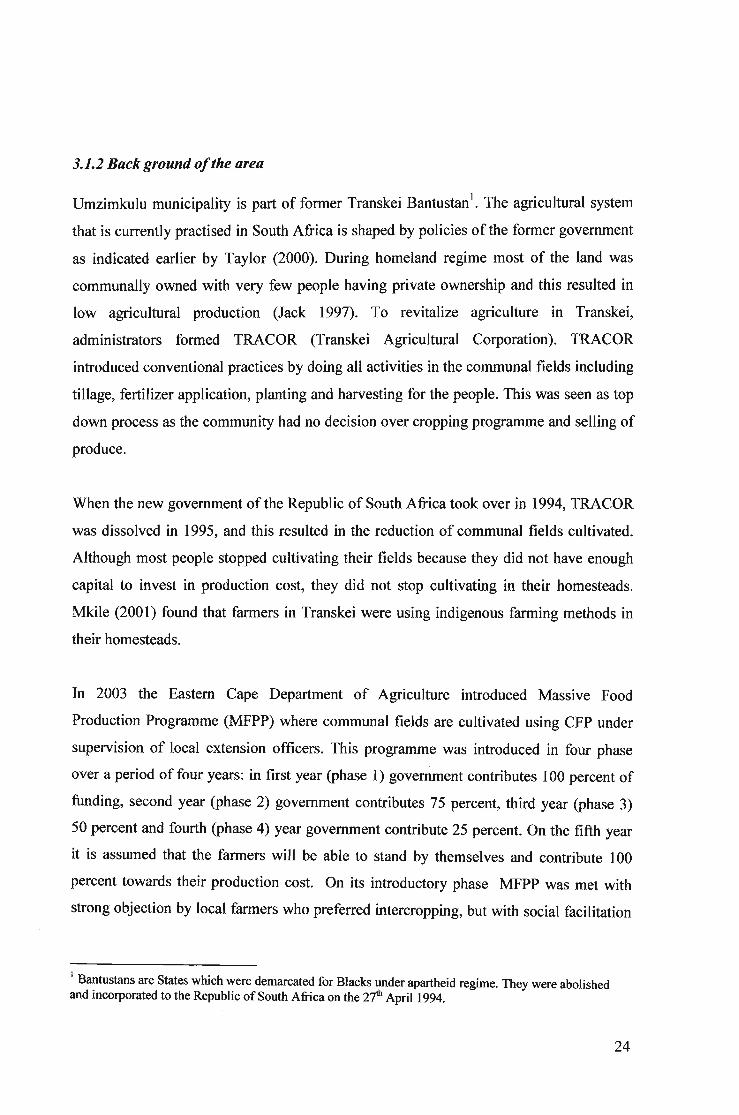
3.1.2 Back ground ofthe area
Umzimkulu municipality is part of former Transkei Bantustan1• The agricultural system
that is currently practised in South Africa is shaped by policies of the former government
as indicated earlier by Taylor (2000). During homeland regime most of the land was
communally owned with very few people having private ownership and this resulted in
low agricultural production (Jack 1997). To revitalize agriculture in Transkei,
administrators formed TRACOR (Transkei Agricultural Corporation). TRACOR
introduced conventional practices by doing all activities in the communal fields including
tillage, fertilizer application, planting and harvesting for the people. This was seen as top
down process as the community had no decision over cropping programme and selling of
produce.
When the new government of the Republic of South Africa took over in 1994, TRACOR
was dissolved in 1995, and this resulted in the reduction of communal fields cultivated.
Although most people stopped cultivating their fields because they did not have enough
capital to invest in production cost, they did not stop cultivating in their homesteads.
Mkile (2001) found that farmers in Transkei were using indigenous farming methods in
their homesteads.
In 2003 the Eastern Cape Department of Agriculture introduced Massive Food
Production Programme (MFPP) where communal fields are cultivated using CFP under
supervision of local extension officers. This programme was introduced in four phase
over a period of four years: in first year (phase 1) government contributes 100 percent of
funding, second year (phase 2) government contributes 75 percent, third year (phase 3)
50 percent and fourth (phase 4) year government contribute 25 percent. On the fifth year
it is assumed that the farmers will be able to stand by themselves and contribute 100
percent towards their production cost. On its introductory phase MFPP was met with
strong objection by local farmers who preferred intercropping, but with social facilitation
1 Bantustans are States which were demarcated for Blacks under apartheid regime. They were abolishedand incorporated to the Republic of South Africa on the 27th April 1994.
24
by extension officers it was kick-started. Activities of MFPP are similar to those of
TRACOR other than that in the former farmers decide themselves how and where to sell.
3.1.3 Farming systems in Umzimkulu
Commercial sector - Massive Food Production programme is seen as commercial
production because it is characterized by heavy capital intensity; in 2003 alone 900
hectares have been planted commercially. The plan as indicated in a Policy
Implementation Plan by Mamase (2004) is to commercially plant all communal fields.
There are about 5 active commercial farmers in Umzimkulu who own approximately 150
hectares of land on average. Umzimkulu town is supplied by neighbouring farmer from
Ixopo for agricultural production. Homestead farming - Most of the people are practicing
agriculture in their homestead gardens. Some of the farmers are using fertilizer, some use
kraal manure and others mix fertilizer and kraal manure. The cropping system that is
most prevalent in Eastern Cape is intercropping where maize is intercropped with beans
and pumpkins (Bembridge 1991; Rajasekaran 1993). The prevalent cropping system in
Umzimkulu will be tested in this research.
3.1.4 Criteria for selection ofstudy area and sampling design
The study area was selected on the basis that farmers who practice indigenous farming
existed in sufficiently large numbers for statistical analysis requirements of yield data.
Personal knowledge and information available at the Eastern Cape provincial agricultural
offices showed that most farmers in the Umzimkulu area practice indigenous farming.
A digital Bio-Resource Unit map of the study area (Figure 2) was used as a basis for
stratification in the design of a sample scheme for collecting the required IFP data. An
administrative area map was overlaid on Bio-Resource Units (BRU) in a GIS in order to
identify homesteads and cultivated areas from which interview samples were drawn. The
BRU database will be explained in detail in the proceeding section. A GIS data model
(Figure 3) was used in the sampling design. One administrative area (Table I and Figure
25

2) was randomly selected from each of seven Bio-Resource Units occurring III the
Umzimkulu area.
Table 1 Selected villages for farmer interviews by administrative ward and BRU
v·nAd . W dBRUNameBRU mm ar I a2eWc44 Glengarry 8 NgcambeleBWXcl3 Upper Bisi River 8 Phelanyeni
Ub28 Mahobe Mission 13 Ntlabeni
Vc33 The Fountains 13 HighlandsVb31 Deepdale 13 Mahobe MdeniVWb8 Tembeni 17 Tembeni
UVb7 Umzimkulu 17 Strangers Rest A
All homesteads using IFP were identified and listed in each administrative selected to
make up a sampling frame. A sample of 20 farmers from each Bio-Resource Unit was
selected from the list using the simple random sampling method. Where the number of
homesteads using indigenous farming practices was less than 20, all farmers were
selected. A total of 132 farmers were interviewed.
26
29°20'O"E 29°30'0"E 29°40'O"E 29°S0'0"E 30 0 0'0"E 30 0 10'0"E
30°0'0"8
30°10'0"8
30°20'0"8
30°30'0"8
N
A,.. II,v···V"
Study area e::..") Vb
ecapebru • VC
TYPE .WXc BVf
TUb .wxdBZc
_Tb WXe.Zd.UVb _\NolIIuVc .WcBUb "Xb
BUc ,-Xc_\IIIVb BXd
IIJVWc .Xe
VWd .Vc
I I I I I I I I Io S 10 20 Kilometers
'30°0'0"
'30~10'(
'30~20'(
'30~30'(
29°20'O"E 29°30'0"E 29°40'O"E 29°S0'0"E ]O°O'O"E 30 0 10'0"E
FiRure 2 Map ofUmzimkulu Municipality showinR randomly selected administrative areas.
27
Out puts
Urnzimkulushape file
Urnzimkulumap withbioresourceunits andadministrativeareas
Processes
Start
-~
Query Umzimkulumunicipality andcreate shape file
Overlay
Query administrativeareas per Bioresourceunit and select one
Inputs
Shape files for Alfred NzoMap
-
Shape file for UrnzimkuluMunicipality
-L
Shape files forAdministrative areas
-
Overlay shape file forUmzimkulu Bioresourceunits
L
Overlay shape file forUrnzimkulu map withBioresource units & adminareas
Study area I(shown in Figure 2)
Iol,..",-I-----I----------I
Figure:3 Diagram showing GIS operation conducted to select study area.
28

3.1.4 Weather conditions during 200312004 growing season
The climatic conditions that characterised Umzimkulu area in the 2003-2004 growing
season indicate normal warm temperature with mean temperature of 17°C. The risk
associated with hail storm and snow was seven percent in frequency. In some parts of
Umzimkulu (Figure 4) rainfall normality exceeded 100 percent while in some areas it
was between 75 percent and 100 percent. No drought or hail storms were reported. The
2003-2004 growing season was considered a normal year for the purposes of this
research.
Urnzimkulu
Percentage of Normal Rainfall for the Season July 2003to June 2004(based on preliminary data) South /llfrlc4In
Wuthoer St;rvict
% Normal_ 0-50
ESZ!l 50- 75c:=J 75- lOO_ 100-150_ 150-200_ >200
c:=J No Data
Figure:4 RainfaU normality for 2003-2004 map obtained form South African Weather Service.
3.2 Discussion
This chapter has summarised the study area selection and its background. The
background of the study will help in understanding the behaviour pattern and explaining
the reason for some indigenous practices. The criteria for study area selection will ensure
that there is no biasness from the results as BRUs are homogenous units.
29

CHAPTER 4
4. METHODOLOGY
4. 1 INTRODUCTION
This chapter describes the methodology that would be used to assess the performance of
IFP in maize land use systems. The purpose of this chapter is to explain the data
requirements and sources for this research and how data would be collected and analysed.
Limitations of the study are also explained in this chapter.
4.2 CONCEPTUAL FRAMEWORK
A conceptual framework for testing the hypothesis was formulated based on the Margin
above Specified Cost (MaSC) method developed by Van Reenen & Marias (1992). The
approach would be used to compare the relative profitability of the two farming practices.
The mathematical model for the calculation of the MaSC would be formulated later in the
research as data variables are defined from interview data.
Margin above Specified Cost would be used to calculate for profit made. Margin above
Specified Cost as defined by Van Reenen & Marias (1992) is an analysis of estimated
gross production value and specified costs that can be directly allocated to a production
branch (crops or livestock) on a per unit basis (for example per hectare or per crop).
The term margin above specified cost is preferred to gross margin because it represents
the contribution of each individual production branch towards the redemption of the fixed
30

cost, and the total none directly allocable variable cost and ultimate realisation of farm
profit (Van Reenen & Marias 1992). Profits as defined by Barry et af (1995) are gaps
between the value of goods and services produced and the cost of resource used in their
production. The calculated MaSC values for IFP and CFP would be compared in order to
determine which one was more profitable than the other.
4.3 DATA REQUIREMENTS AND COLLECTION METHODOLOGY
Production potential estimates of conventional maize land use systems based on scientific
inference are well documented. However, data on IFP are not readily available as
indigenous systems are neither exhaustively researched nor documented.
Data on IFP farming operations, their sequence and respective costs over the growing
season 2003-2004 including seed selection, land preparation, cropping system, planting,
soil care and fertilising, weed and pest control as well as yield data per hectare would be
collected from primary sources by interviewing farmers in a pre-defmed study area.
Details of the sampling design and data collection materials and methods have been
described in the previous section.
Data on CFP farming operations, sequence and respective costs would be obtained from
the so-called COMBUD2 Enterprise Budgets of the KwaZulu-Natal Provincial
Department of Agriculture. COMBUD data including prevailing market prices and
allocatable variable costs are compiled for every growing season. Allocatable variable
costs are those attributable to material input including fertilizer, lime and manure, weed
and pest control, contract work (labour), crop insurance, energy, maintenance and harvest
costs.
Potential yields per hectare data for CFP based land use systems including maize are also
available in the KwaZulu-Natal Provincial Department of Agriculture and Environmental
2 COMBUD: Computerized Budget
31
Affairs Bio-Resource database in Geographic Information System (GIS) medium. The
Bio-Resource database (Version 6.012) provides baseline data regarding approximate
yields for maize based land use systems attainable for defined production situations using
CFP. The database provides units of homogeneous biophysical conditions including
terrain, soils and climate referred to as the Bio-Resource Unit. The Bio-Resource Unit
(BRU) is defined by Camp (2003) as an ecological unit within which factors such as soil
type, climate, altitude, terrain and vegetation display sufficient degree of homogeneity.
The BRUs provide a good indication of potential yield for a range of crops, including
maize. However, the custodians of the BRU database recommend that for accurate
production potentials, detailed soil surveys be carried out to ascertain soil characteristics
including depth, type, clay content, drainage class and rockiness.
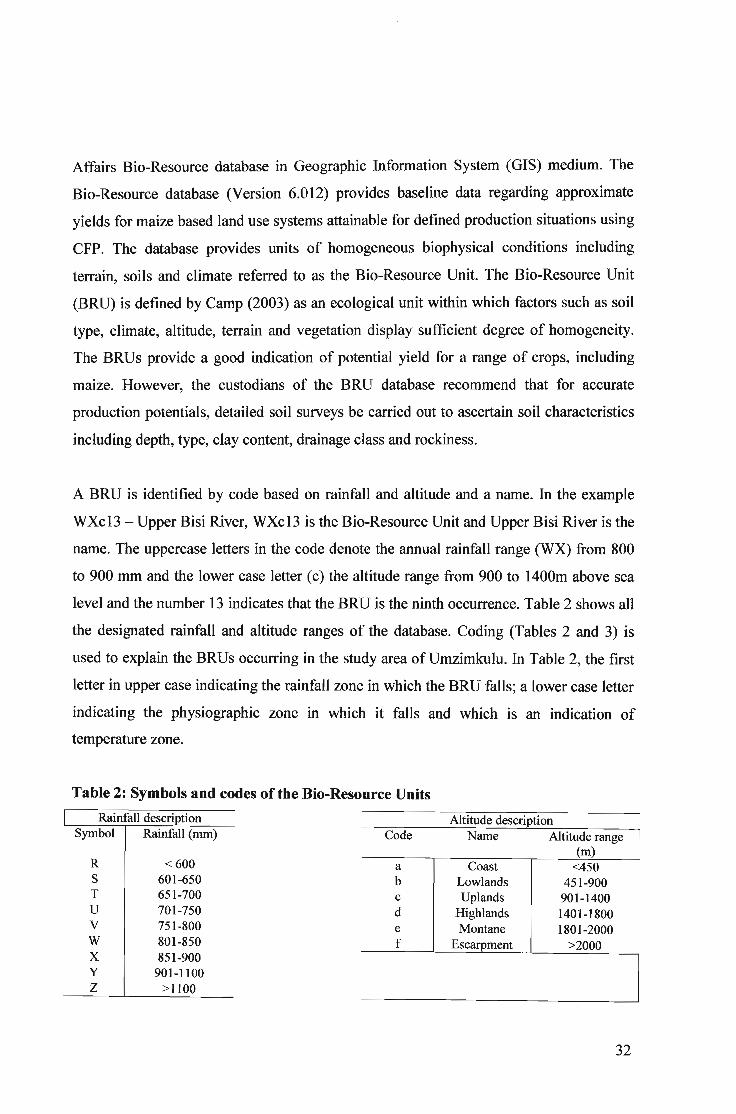
A BRU is identified by code based on rainfall and altitude and a name. In the example
WXc13 - Upper Bisi River, WXc13 is the Bio-Resource Unit and Upper Bisi River is the
name. The uppercase letters in the code denote the annual rainfall range (WX) from 800
to 900 mm and the lower case letter (c) the altitude range from 900 to 1400m above sea
level and the number 13 indicates that the BRU is the ninth occurrence. Table 2 shows all
the designated rainfall and altitude ranges of the database. Coding (Tables 2 and 3) is
used to explain the BRUs occurring in the study area ofUmzimkulu. In Table 2, the first
letter in upper case indicating the rainfall zone in which the BRU falls; a lower case letter
indicating the physiographic zone in which it falls and which is an indication of
temperature zone.
Altitude descriptionCode Name Altitude range
(m)a Coast <450b Lowlands 451-900c Uplands 901-1400d HigWands 1401-1800e Montane 1801-2000f Escarpment >2000
Symbol Rainfall (mm)
R <600S 601-650T 651-700U 701-750V 751-800W 801-850X 851-900y 901-1100Z >1100
Table 2: Symbols and codes ofthe Bio-Resource Units
Rainfall description
32

Each BRU contains subclasses referred to as soil ecotopes (Table 3) describing dominant
soil characteristics in terms of soil form, texture, depth, wetness, slope and surface
characteristics (e.g. rockiness).
Table 3 Ecotope definition coding as described in Bio-Resource Units
ABCDEFGHIJK
SoilsHumic soilsWell and moderately drained soilsAlluvial soilsMotteled and moderately drained soilsMotteled and poorly drained soilsBlack (Margalitic) soilsBlack (Margalitic) poorly drained soilsYoung soilsOther poorly drained soilsDuplex soilsOrganic soils and wetlands
123
Depth (mm)1 >8002 500-8003 300-5004 200-300
Slope (percent) If <12s 12-40x >40
Surface characteristicsn I Not rockyr .. Rocky
An example of ecotope B.l.2.f.r would indicate well and moderately drained soils; clay
>35 percent; depth 500-800mm; slope <12 percent and rocky surface.
33

4.4 DATA ANALYSIS METHODOLOGY
Margins above Specified Cost for IFP based maize land use systems would be calculated
using actual yield per hectare and cost of production data obtained from farmer
interviews. Comparison values of Margin above Specified Cost per hectare would be
calculated for CFP based maize land use systems using Bio-Resource potential yield at
70 percent management factor and COMBUD variable cost data for the 2003 - 2004
growing season. The BRU programme considers controlled research field management to
be 100 percent while in a practical farming production situation; good management
potential is considered to be 70 percent.
Primary IFP data obtained from interviews would be coded and entered to SPSS
statistical analysis software in order to explore distributions, trends and relationships
between them. Relationships between the sequential operations over the growing season
and IFP maize yield as the output of the main land use would be explored. Observed
variable costs associated to the farming operations would be aggregated to make up the
total cost. Yields would be converted into monetary equivalents by applying the
prevailing market prices and a comparison of profitability between IFP and CFP carried
out.
4.5 LIMITATIONS TO THE STUDY
Given the time and resources, constraints of this research would be limited by the
following aspects.
• A total number of 7 BRU would be studied because of time and budget
constraints.
• The data would be collected from farmers through interviews and validity would
entirely depend on the accuracy of information given by farmers. Trials and
34

experiments to get information would have made the study unaffordable in terms
of student research budget and time resources. Assumption is made in this study
that data that would be given by respondents would be accurate and would be the
true reflection of their farming practices.
• A total population in each administration selected will not be interviewed due to
time constraints. A Simple Random Sample would be employed to select farmers
for interviewing.
• Only data for IFP would be collected as primary data, CFP data will be obtained
from secondary data sources. The secondary data obtained will be deemed to be
accurate and valid and relevant to CFP in each BRU that would be studied.
5 OVERALL CONCLUSION
Component A has provided a basis on which the study would be undertaken and has
explained the problem statement and the need for this research. The literature review of
previous studies has revealed that indigenous farming practices have a positive impact on
the environment by improving soil through mulching, composting and use of non-toxic
control of pests and diseases that damage crops. On the other hand the review has
revealed that conventional practices can impact negatively on the environment. The
literature review has also summarised the types of indigenous practices used in other
developing countries and their challenges.
This component of the research has discussed the overview of study area and justified its
selection using GIS operations. A procedure using the Bio-Resource Units as
homogeneous mapping units for first stratification for a Simple Random Sample has been
described. The conceptual framework of the study has been outlined explaining the
method for testing the research hypothesis. The required data and their sources have been
identified and data collection and data analysis methods explained.
35
REFERENCES
AGRAWAL, R.C. 2004. Farmers as partners in knowledge development. World BankIK Notes. No.69. The World Bank, Washington D.C.
AGRAWAL, A. 1995. Indigenous and Scientific Knowledge: Some CriticalComments. Indigenous Knowledge and Development Monitor 3: 3-6.
ANDERSON, P.R. 2001. Focus on: Gender and indigenous knowledge. Experiencesin Nigeria and the USA. Indigenous Knowledge and Development Monitor 9: 16-17
BAJWA, W.!. & SCHAEFERS, G. 1998. Indigenous Crop Practices in Sub-SaharanEast Africa. Consortium for International Crop protection, USA.
BANDYOPADHYAY, A.K. & SAHA G.S. 1998. Indigenous methods of seedselection and preservation on the Andaman Islands in India. Indigenous Knowledgeand Development Monitor 6: 3-6.
BARRETT, C. B. 2000. The challenge of improved natural resource managementpractices adoption in African agriculture: A social science perspective. Paperprepared for the workshop on Understanding Adoption Processes for NaturalResource Management Practices for Sustainable Agricultural Production in SubSaharan Africa, Nairobi, Kenya, 3-5.
BARRY, PJ.,ELLINGER,P.N., HOPKIN, J.A. & BAKER, C.B. 1995. Financialmanagement in agriculture. Interestate, Danville.
BEMBRIDGE, T.J. 1984.A systems approach study of agricultural developmentproblems in Transkei. PhD thesis, University of Stellenbosch, Stellenbosch.
BEMBRIDGE, TJ. 1986. Characteristics ofProgressive Small-Scale Farmers inTranskei. Social Dynamics 12:77~85.
BEMBRIDGE, T.J. 1991. Technology transfer in Small-Scale Dryland CropProduction: Future Challenges. Development Southern Africa 8:479-493.
BOBOBEE, E.Y.H. 1999. Role ofdraft animal power in Ghanaian Agriculture.University of Science and Technology, Kumasi, Ghana.
BURGER, J. 1990. The Gaia Atlas ofFirst Peoples: A Future for the IndigenousWorld. Penguin Books, Ringwood.
CAMP, K. 2003. Guide to use of the Bioresource Programme. Cedara Report NoN/A/99/11, Natural Resource section - Technology development and training.Cedara,I-34.
36

DAWES, W. 1993. Introduction in Traditional knowledge and sustainabledevelopment. In: S.H. Davis and K. Ebbe (eds), Proceedings ofa Conference held atThe World Bank Washington D.C in Sept. 27 - 28. p.3-4 EnvironmentallySustainable Development Proceeding Series No. 4.
EASTON, P. & RONALD, M. 2000. Seeds of life: Women and AgriculturalBiodiversity in Africa. World Bank IK Notes. No 23. The World Bank, WashingtonD.C.
EICHER, A. 2003. Organic Agriculture: A glossary of terms for Farmers andGardeners. University of Califonia Cooperative Extension, South Broadway.
EMERY, A.R. & ASSOCIATES. 1997. Guidelines for Environmental Assessmentsand Traditional Knowledge. A Report from the Centre for Traditional Knowledge ofthe World Council ofIndigenous People (draft), Ottawa, 4-5.
FERTILIZER SOCIETY SOUTH AFRICA. 2000. Fertlizer Handbook 4rth edition.Lynnwood Ridge, South Africa
FITSHUGH, H. & A.E. WILHELM. 1995. Value and uses of indigenous livestockbreeds in developing nations. In: M.L Oldfield and J.B. Alcorn (eds), Biodiversity:culture, conservation and eco-development, p.l02-116. Michigan: MichiganUniversity Press.
FOWLER, R. 1999. Conservation tillage research and development in South Africa.In Kaumbutho PG and Simalenga TE (eds), Animalpowerfor weed control, p51-63.A resource book of the Animal Traction Network for Eastern and Southern AfricaTantesa,Wageningen.
HAILE M 2004. A Woman innovator Speaks. World Bank IK Notes. No.70 TheWorld Bank, Washington, D.e.
HOLTZHASEN, L.L. 1993 Ennobling and domestication of indigenous AfricanAmarula,. The indigenous Plant Use Newsletter 1: 1-3.
ITANI, 1. 1998. Evaluation ofan Indigenous farming system in the MantegoHighlands, Tanzania, and its Sustainability. South African Study Monographs 19: 5568.
JACK, B. 1997. Development strategy for the agricultural section in the EasternCape. Paper preparedfor the Eastern Cape revitalisation ofAgriculture Workshopheld on the 19'h August 1997 in Industrial Hall in Bisho.
37
JOSHI, R.C., MATCHOL, O.RO, BHATAM, RG. AND PENIA, F.A.D 2000.Farmers knowledge, attitudes and practices of rice crop and pest management atIfugao Rice Terraces (IRT), Philippines. Internationaljournal ofpest management46: 43-48.
KAYOMBO, K., ELLIS-JONES, J. & MARTIN, H.L. (2000) Indigenousconservation tillage system in East Africa with example oftheir evaluation from WestTanzania. Unpublishedpaper, Botswana College of Agriculture, Botswana.
KIEFT, J. 2001. Indigenous variety development in food crops strategies on Timor:their relevance for in situ biodiversity conservation and food security. IndigenousKnowledge and Development Monitor 9: 8-13.
KOLAWOLE, O.D. 2001. Local Utilization and sustainable rural development in the21 st century. Indigenous Knowledge and Development Monitor 9:13-15.
LAMERS, J.P.A., FElL, P.R & BUERKERT, A. 1995. Spatial crop growthvariability in Western Niger: The knowledge of farmers and researchers. IndigenousKnowledge and Development Monitor 3:17-19.
LAWAS, C.M. & LUNING, H.A. 1996. Farmers knowledge and GIS. IndigenousKnowledge and Development Monitor 4: 1-15.
MAMASE, M. 2004. Walking the talk continues. Speech delivered in PolicyImplementation 2004-2005for Department ofAgriculture in Bisho.
McCALL, K. 1996. ITK in East farming systems. Indigenous Knowledge andDevelopment Monitor 4: 20-35.
MKILE, Z. 2001. The use and agronomic effectiveness of kraal manures in theTranskei region of the Eastern cape, South Africa. M Sc dissertation, University ofFort Hare, Alice.
MILNER, P. 1996. The earthmill system for organic market garden. Earthmillproducts, Bredell, South Africa.
NYARONGA, RO., WEIN, H.L., OLANYA, O.M. & OJAIMBO, P.S. 2004.Farmer's cultural practices and management ofpotato late blight in Kenya Highlands:Implications for development of integrated disease management. InternationalJournal ofPest Management. 50: 135-144.
ORTIZ, O. 1999. Understanding interactions between indigenous knowledge andscientific information. Indigenous Knowledge and Development Monitor 7: 7-10.
38
PARVATHI, S., CHANDRAKANDAN, K. &KARTHIKEYAN, C. 2000. Womenand dry land post-harvesting practices in Tamil Nadu, India. Indigenous Knowledgeand Development Monitor 8: 13-16.
PIDATALA, K. & KHAN, A.R. 2003. Women & Indigenous Knowledge: a SouthSouth Perspective. World Bank IK Notes. No 63, The World Bank, Washington, D.e.
PIDATALA, K. 2001. Eritrea: The process of Knowledge Capturing IndigenousKnowledge. World Bank IK Notes. No 36, The World Bank, Washington, D.C.
PRAKASH, S. 2002. Using Indigenous Knowledge to Raise AgriculturalProductivity. World Bank IK Notes. No.45, The World Bank, Washington, D.C.
PROVINCE OF BRITISH COLUMBIA. 2001. The Ministry ofAgriculture, Foodand Fisheries. Victoria.
QUIROZ, C. 1996. Local knowledge systems contribute to sustainable development.Indigenous Knowledge & Development Monitor 2:13-17.
RAJASEKARAN, B., & WARREN, D.M. 1994. IK for Socioeconomic Developmentand Biodiversity Conservation: The Kolli Hills. Indigenous Knowledge &Development Monitor 2:13-17.
RAJASEKARAN, B. 1993. Indigenous technical practices in a rice-based farmingsystem. Center for Indigenous Knowledge for Agriculture and Rural Development,Ames.
REIJNTJES, C., B. HAVERKORT, & A. WATERS-BAYER. 1992. Farming for thefuture: An introduction to low-external input and sustainable agriculture. Macmillan,London.
ROSENBLUM, M.L., lAFFE, L. & SCHEERENS, l.C. 2001. Setting up farmers'research agendas in Lesotho./ndigenous Knowledge and Development Monitor 9: 3-7.
RUBAIHAYO, E.B. 1994. Indigenous vegetables in Uganda. African Crop ScienceConference Proceedings 1: 120-124.
SHETTO, M., KWILIGWA, E.M., MKOMNWA, S. & MASSUNGA, M. 2000.Weed control by draft animals: experience in the South Highlands of Tanzania. InStarkey P and Simalenga T (eds), Animalpowerfor weed control, p51-63. A resourcebook of the Animal Traction Network for Eastern and Southern Africa ,WageningenThe Nerthedands.
SffiANDA, H.1998. Sustainable Indigenous Knowledge Systems in Agriculture inZimbabwe's Rural areas ofMatabele and North and South Provinces. World Bank IKNotes. No.2. The World Bank, Washington, D.C.
39

SIMALENGA T.E, BELETE, B., MSELENI, N. & JONGISA L.L. 2000. Assessingthe profitability ofusing animal traction under small holder farming conditions.South African Journal ofAgricultural Extension 29: 1-9.
SOULE, J., CARRE, D. & JACKOSON, W. 1990. Ecological impact of modernagriculture. Ecological Impact of Morden Agriculture, McGraw-Hill.
TAYLOR, D. 2000. Local Agricultural Practice: Tradition, modernity anddevelopment in the context of low resource farming in South Africa. Payer j;resentedat the ASA conference School ofOriental & African Studies, London 2n -5 April,Participating in development: Approaches to Indigenous Knowledge.
ULLUWISHEWA, R., KALOKO, A.A. & MORICAN, D.H.M. 1997. Indigenousknowledge and sustainable living: Two case studies from Brunei. IndigenousKnowledge and Environmental Education, p. 3-4. Paper presented at EnvironmentalEducation Workshop, University of Brunei, Darussalam.
VAN AVERBEKE, W. 2002. Indigenous technology and technology-orientedResearch: Implications for research methodology. AIAEE 2002 proceedings ofthe18th Annual Conference held in Durban South Africa Proceeding Series No. 452.
VAN DISSEL S.C. & DE GRAAFF, J. 1998. Differences between farmers andscientists in the perception of soil erosion: a South African case study. IndigenousKnowledge and Development Monitor 6: 8-9.
VAN REENEN, M.J. & MARAIS A. DE K. 1992. Farm management: Financialplanning, analysis and control. JL van Schaik Publishers, Pretoria.
VERMEULEN, J.B., SWEET, S., KRAUSE, M., HOLLINGS, N. & NEL, A. 1990.A guide to the use ofpesticides and fungicides in the Republic of South Africa. 4th ed.Department ofAgriculture, RSA
WARREN, D.M. 1991. Using indigenous knowledge in agricultural development.World Bank Discussion Papers.NoI27. The World Bank, Washington, D.e.
WOLFE,M.L.,ROSS,B.B, DIEM, J.F.,DILLAHA, T.A & FLAHIVE, K.A.2002.Protecting water quality: best management practice for row grown crops onplastic mulch in Viginia. Viginia Cooperative Extension, Virginia.ZWEIFEL, H. 1997. Biodiversity and the appropriation ofwomen's knowledge.Indigenous Knowledge and Development Monitor 5:1-32.
40

APPENDIXES
Appendix 1 Questionnaire1. Profile of respondentsQuestionnaire Number... .. .Respondent Number. .Date .Ward No .Administration Area... .. .Size of area used of planting
2. Land preparation
1 How is the land prepared before planting
2 How much does this technique cost toprepare land
Digging Hand Animal Tractor No preparationssticks hoe traction hireI 2 3 4 5
No cost Less than RIOO- R300 Above 300RlOO
1 2 3 4
D
3 How land is fertilitymaintained
Fallowing Kraal Fertilizer Fertilizer Nothing Kraal manuremanure Kraal Manure
Fallowing Fallowing1 2 3 4 5
4 Indicate how mucll you apply .
5 How much does this technique cost tofertilize you garden
6 When do you apply fertilizer
Planting
Less than R50- RlOO RlOO-R500 AboveR500R501 2 3 4
Before After Planting During planting no fertilizerplanting applied1 2 3 4
7 How land is planted Spreading Plant in Use animal Tractor hire Otherseed rows drawn olanter1 2 3 4 5
8 Which cropping system Intercrop Intracropping Intercropping Monocroppingping
Intracroooing1 2 3 4
9 Which crops do youintracrop
Maize Maize Maize MaizeBeans
Beans Pumpkins Pumpkin1 2 3 4 5
41
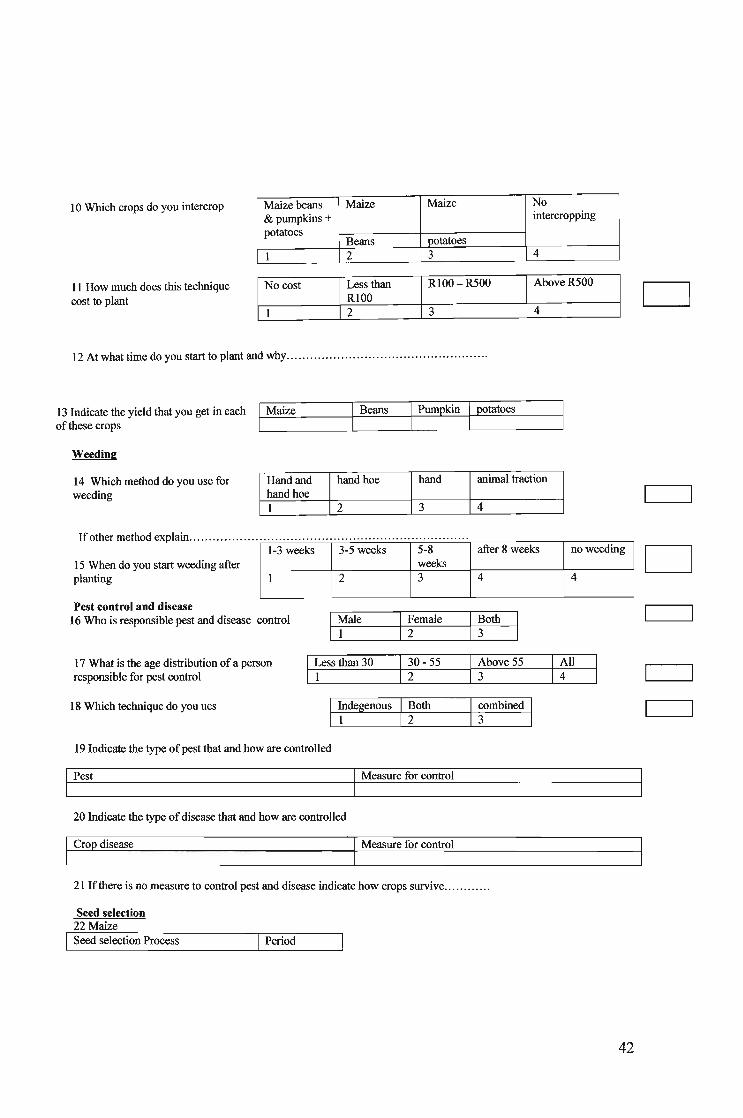
10 Which crops do you intercrop
] 1 How much does this techniquecost to plant
Maize beans Maize Maize No& pumpkins + intercropping
potatoesBeans potatoes
1 2 3 4
No cost Less than R]OO-R500 AboveR500RlOO
1 2 3 4o
12 At what time do you start to plant and why .
13 Indicate the yield that you get in each I-:M=aIZe~·:::.... -+~::.B~e=ans=--t~Pum-=::J:P:::k:::in~l...Jpo=ta:::to::::.e:::.s'------ofthese crops .
Weeding
14 Which method do you use forweeding
If other method explain .
15 When do you start weeding afterplanting
Hand and hand hoe hand animal tractionhand hoe] 2 3 4
.......................................................1-3 weeks 3-5 weeks 5-8 after 8 weeks no weeding
weeksI 2 3 4 4
DPest control and disease
]6 Who is responsible pest and disease control I~ale I ~emale I~oth17 What is the age distribution of a person I~ess than 30 I;0 - 55 I~bove55 I~llresponsible for pest control
18 Which technique do you ues I~degenoUS I~oth I~mbined I
] 9 Indicate the type ofpest that and how are controlled
1f-::...pe:::.s:.:.t Ir-'M=e=as:.:ur=_e::...:..:fo:.:.r...::c:.:::on:::tr=_0:::1'---- _
20 Indicate the type of disease that and how are controlled
If----"'C.:..:ro::.<P:..cd:.:i=.;se:.:as=.e'---- I-:M=easur==-e::...:..:fo:::T...::CO:.:::n:::tr=.o:.:I'---- _
2] Ifthere is no measure to control pest and disease indicate how crops survive .
Seed selection22 Maize
ISeed selection Process IPeriod
42

1. INTRODUCTION
1.1 Problem statement
Most of the farmers have ignored indigenous methods and they have preferred
conventional methods of farming. The introduction of conventional farming knowledge
to African farmers was intended to increase production capacity, but this however
disregarded the fact that most of African farmers do not have economic resources to
engage in this western technology. Many African black farmers do not have access to
credit facilities; hence they cannot afford production inputs or pay for operational costs.
Conventional equipment is very expensive and needs huge capital investment.
Although indigenous knowledge is increasingly becoming popular it has not been widely
integrated in research and development processes (Dawes 1993). Nothing or very little is
done to encourage farmers to use indigenous farming practices (IFP) in their production.
Government and development organizations have focused their investment on
conventional farming practices (CFP) because there is a perception that IFP is an out
dated practice and cannot be used commercially.
IFP includes using both indigenous technology and indigenous knowledge. The term
indigenous knowledge is used to distinguish the knowledge developed by a given
community from international knowledge systems or scientific knowledge (Warren
1991). Indigenous knowledge refers to the use of organic fertilizers such as animal
manures (kraal manure) instead of industrial chemical fertilizer, minimum tillage instead
of convectional tillage. A typical example of indigenous technology that is used by
farmers is animal draft power (Animal Traction). Fitshugh & Wilhelm (1995) maintains
that the use of animal draft power has been in existence since its discovery, and had been
a main source ofpower in agriculture.
I

In this study the indigenous knowledge will be defined as local knowledge that is unique
to a given culture or society. Indigenous farming practices will be intercropping, use of
kraal manure pure or mixed with commercial fertiliser, use self made seed, unique
planting methods and storage methods. The farmer who practices each of these practices
will be defined as an indigenous farmer. This research seeks to study IFP used by farmers
in the Umzimkulu area of the Eastern Cape Province. These include land preparation,
seed selection, planting, cropping systems, soil care (fertility) practices, pest and weed
control methods. Cost and benefits of using these methods will be compared with CFP.
1.2 Objectives
4) To document Indigenous Farming Practices (IFP) used in maize based Land Use
systems in the Eastern Cape and assess the extent to which it is used.
5) To make profitability comparison between Indigenous Farming Practices (IFP) and
Conventional Farming Practices (CFP) for maize based Land Use Systems in the
study area.
6) To make recommendations for promoting IFP
1.3 Research hypothesis
Ho: There is no difference in profitability between Conventional Farming Practices
(CFP) and Indigenous Farming Practices (IFP) for rural small-scale maize based Land
Use Systems.
Ha: It is more profitable to use Indigenous Farming Practices (IFP) than to use
Conventional Farming Practices (CFP) for rural small-scale maize based Land Use
Systems.
2

1.4 Conceptual framework
In order to test the hypothesis stated above, a study was designed and carried out to
determine and describe maize land use systems that rely on IFP and to make a
comparison in profitability with CFP systems. A cost-benefit analysis based on the
Margin above Specified Cost (MaSC) method developed by Van Reenen & Marias
(1992) was used to compare the relative profitability of the two farming practices. The
mathematical model for the calculation of the MaSC is explained later on in this section.
Margin above Specified Cost was used to calculate for profit made. Margin above
Specified Cost as defmed by Van Reenen & Marias (1992) is an analysis of estimated
gross production value and specified costs that can be directly allocated to a production
branch (crops or livestock) on a per unit basis (for example per hectare or per crop).
The term margin above specified cost is preferred to gross margin because it represents
the contribution of each individual production branch towards the redemption of the fixed
cost, and the total none directly allocable variable cost and ultimately realisation of farm
profit (Van Reenen & Marias 1992). Profits as defined by Barry et al. (1995) are gaps
between the value of goods and services produced and the cost of resource used in their
production.
The calculated MaSC values for IFP and CFP were compared in order to determine
which one was more profitable than the other.
1.4.1 Data requirements and availability
Production potentials estimates of conventional maize land use systems based on
scientific inference are well documented. However, data on IFP were not readily
available as indigenous systems are neither exhaustively researched nor documented.
Data on IFP farming operations, their sequence and respective costs over the growing
season including seed selection, land preparation, cropping system, planting, soil care and
3
fertilising, weed and pest control as well as yield data per hectare had to be collected
from primary sources by interviewing farmers in a pre-defined study area. Details of the
sampling design and data collection materials and methods are described in the
proceeding section.
Data on CFP farming operations, sequence and respective costs were obtained from the
so-called COMBUD Enterprise Budgets of the KwaZulu-Natal Provincial Department of
Agriculture. COMBUD data including prevailing market prices and allocatable variable
costs are compiled for every growing season. Allocatable variable costs are those
attributable to material input including fertilizer, lime and manure, weed and pest control,
contract work (labour), crop insurance, energy, maintenance and harvest costs. An
example of COMBUD gross margin model is provided in an enterprise budget in
Appendix 5.
Potential yields per hectare data for CFP based land use systems including maize are also
available in the KwaZulu-Natal Provincial Department ofAgriculture and Environmental
Affairs so-called Bio-Resource database in Geographic Information System (GIS) format.
The Bio-Resource database (Version 6.012) provides baseline data regarding
approximate yields for maize based land use systems attainable for defined production
situations using CFP. The database provides units of homogeneous biophysical
conditions including terrain, soils and climate referred to as the Bio-Resource Unit.
The Bio-Resource Unit (BRU) is defined by Camp (2003) as an ecological unit within
which factors such as soil type, climate, altitude, terrain and vegetation display sufficient
degree of homogeneity. The BRUs provide a good indication of potential yield for a
range of crops, including maize. However, the custodians (KwaZulu-Natal Provincial
Department of Agriculture and Environmental Affairs) of the BRU database recommend
that for accurate production potentials, detailed soil surveys be carried out to ascertain
soil characteristics including depth, type, clay content, drainage class and rockiness. The
alternative to BRU yield estimates is to obtain actual CFP based yield data from
interviewing a suitable sample of commercial farmers. Neither the detailed soil surveys
4

nor commercial farmer interviews were feasible within the means of this educational
research exercise for obtaining more reliable CFP yield data for the study area. It was
therefore decided that for the purposes of this academic exercise, BRU potential yield
estimates would be used as CFP baseline yield together with COMBUD data for the
calculation of Margin above Specified Costs, bearing in mind the limitations advised.
A BRU is identified by code based on rainfall and altitude and a name. In the example
WXc13 - Upper Bisi River, WXc13 is the Bio-Resource Unit and Upper Bisi River is the
name. The uppercase letters in the code denote the annual rainfall range (WX) from 800
to 900 mm and the lower case letter (c) the altitude range from 900 to 1400m above sea
level and the number 13 indicates that the BRU is the ninth occurrence. Coding (Tables 1
and 2) is used to explain the BRUs occurring in the study area of Umzimkulu. The first
letter in upper case (Table 1) indicates the rainfall zone in which the BRU falls; a lower
case letter indicating the physiographic zone in which it falls and which is an indication
of temperature zone.
Table 1: Symbols and codes ofthe Bio-Resource Units
Altitude descriptionCode Name Altitude range
(m)a Coast <450b Lowlands 451-900c Uplands 901-1400d Highlands 1401-1800e Montane 1801-2000f Escarpment >2000
Rainfall description
R <600S 601-650T 651-700U 701-750V 751-800W 801-850X 851-900Y 901-1100Z >1100
Symbol Rainfall (mm)
In each BRU contains subclasses referred to as soil ecotopes (Table 2) describing
dominant soil characteristics in terms of soil form, texture, depth, wetness, slope and
surface characteristics (e.g. rockiness).
5

Table 2 Ecotope definition coding as described in BRUs
Oa ( ercent)
ABCDEFGHIJK
SoilsHumic soilsWell and moderately drained soilsAlluvial soilsMotteled and moderately drained soilsMotteled and poorly drained soilsBlack (Margalitic) soilsBlack (Margalitic) poorly drained soilsYoung soilsOther poorly drained soilsDuplex soilsOrganic soils and wetlands
1 >352 5-153 <15
Depth (mm)1 >8002 500-8003 300-5004 200-300
Slot: e (percent) If <12s 12-40x >40
Surface characteristicsn I Not rockyr . Rocky
An example of ecotope B.l.2.f.r would indicate well and moderately drained soils; clay
>35 percent; depth 500-800mm; slope <12 percent and rocky surface.
6

1.4.2 Profitability comparison ofindigenous farming practices against conventionalfaming practices
Margins above Specified Cost for IFP based maize land use systems were calculated
using actual yield and cost of production data obtained from farmer interviews.
Comparison values ofMargin above Specified Cost were calculated for CFP based maize
land use systems using Bio-Resource potential yield at 70 percent management factor and
COMBUD variable cost data that were available for the 2003 - 2004 growing season.
The BRU programme considers controlled research field management to be 100 percent
while in a practical fanning production situation; good management potential is
considered to be 70 percent. Figurel shows a flowchart describing the methodology for
obtaining MaSC for the two farming practices for comparing profitability.
Profitability analysis: Indigenous Vs Conventional Farming Practices
IIFP based maize I ICFP based maize ILand Use System Land Use System
? ?Operations (observed) Operations (BRU based)Seed selectionLand preparation
Land preparation
PlantingPlanting
Soil care and fertilityFertilizing/liming
Weed controlProtection (v.eedslpests)
Pest ControlHarvesting
Actual Maize Grain (tonslha) I 70% Management IBeans (50kg bagslha Maize Grain (tonslha)Pumpkin (headslha)
?? .~ Market price1Market price I
I Actual Gross Income (Rand/ha) I 70% Maganement I
7Gross Income (Rand/ha)
Variable costs (observed)
7Variable costs (COMBUD)
Inputs InputsLand preparation (tractrJr hire) Labour (regular/seasonal)Seed Marketing & TransportSoil care and fertility Energy & maintenanceWeed control Crop insurance
I MaSCj (Randlha) I Pest control IMaSCc(Rand/ha) I Interest on working capital
I II IFP-CFP I"I Profitability corrparison I
Figure 1 Flowc~art show~g a pro~edure for ~alyzing profitability for by comparing Margins above Specified Costbetween ConventIOnal farmmg PractIces and Indigenous Farming Practices.
7
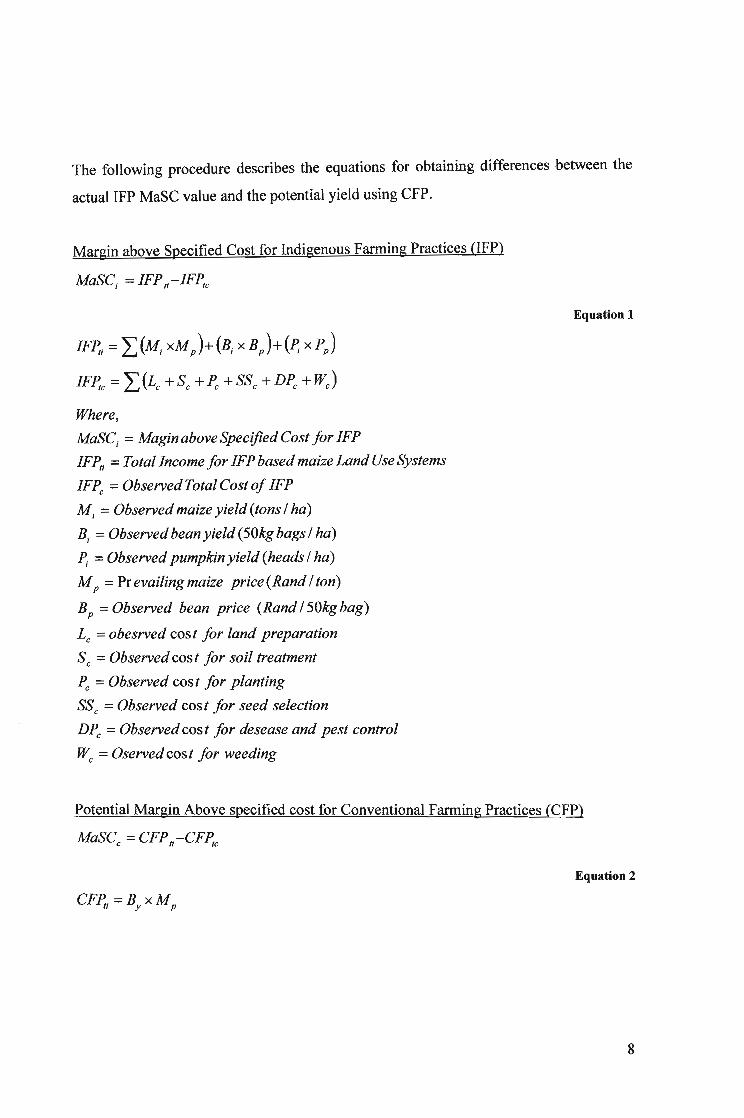
The following procedure describes the equations for obtaining differences between the
actual IFP MaSC value and the potential yield using CFP.
Margin above Specified Cost for Indigenous Farming Practices (lFP)
MaSC; = IFPti-IF~e
Equation 1
IF~; = I (M; xMp)+(B; x Bp)+(p; xPp)
IFp;e =I (Le +Se +Pe +SSe +DPe +WJ
Where,
MaSC; = Magin above Specified Cost for IFP
IFp'; =Total Income for IFP based maize Land Use Systems
IFPe =ObservedTotal Cost of IFP
M; =Observed maize yield (tons / ha)
B; =Observed bean yield (50kg bags / ha)
P; =Observed pumpkin yield (heads / ha)
Mp = Pr evailing maize price (Rand / ton)
Bp =Observed bean price (Rand / 50kg bag)
Le =obesrved cost for land preparation
Se = Observed cost for soil treatment
Pc =Observed cos t for planting
SSe =Observed cost for seed selection
DJ>" =Observed cost for desease and pest control
Wc =Oservedcost for weeding
Potential Margin Above specified cost for Conventional Farming Practices (CFP)
MaSCe = CFP,i-CFp'e
Equation 2
8

Where,
MaSCc =Maginabove Specified Cost forCFP
CFP/i = Total Income for CFP based maize Land Use System
CFPc =TotalCostofCFP fromCOMBUD(2003-2004)
By = 70% maize yield (tons / ha) from BRU database
Mp = Pr evailing maize price (Rand / ton)
MaSC comparison between IFP and CFP
MaSCdff = MaSC;-MaSCc
Where,
MaSCdff =Difference in Magin above Specified Cost between IFP and CFP
Equation 3
9
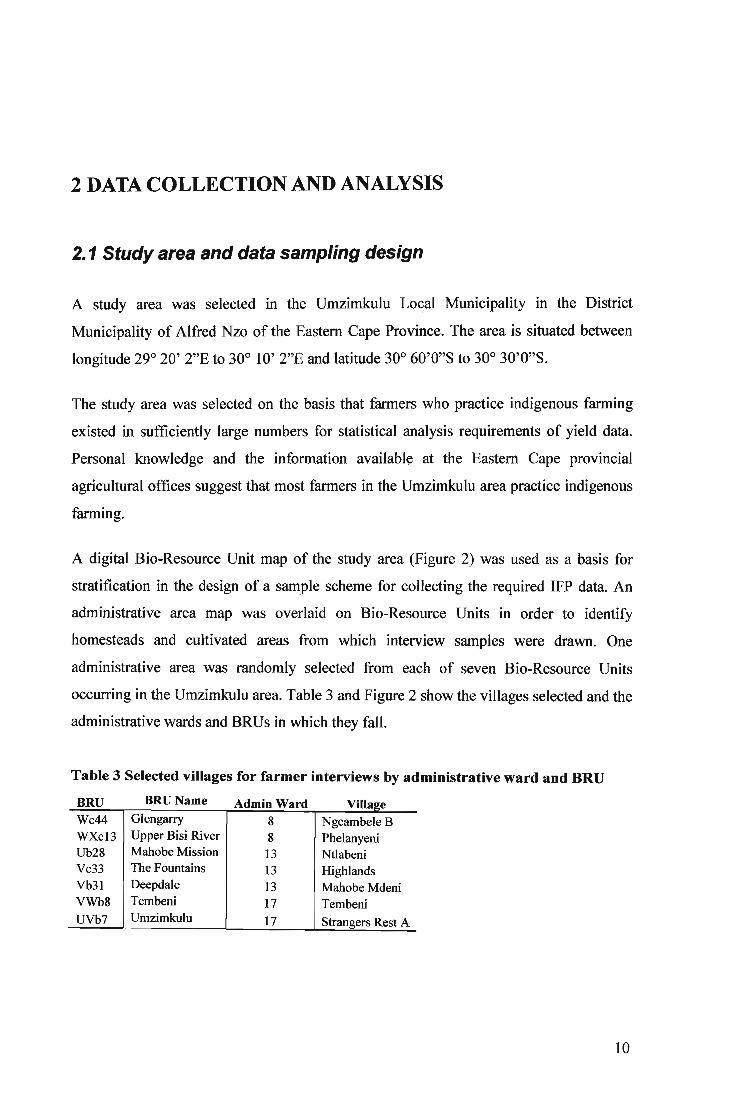
2 DATA COLLECTION AND ANALYSIS
2.1 Study area and data sampling design
A study area was selected in the Umzimkulu Local Municipality in the District
Municipality of Alfred Nzo of the Eastern Cape Province. The area is situated between
longitude 29° 20' 2"E to 30° 10' 2"E and latitude 30° 60'0"S to 30° 30'0"S.
The study area was selected on the basis that farmers who practice indigenous farming
existed in sufficiently large numbers for statistical analysis requirements of yield data.
Personal knowledge and the information available at the Eastern Cape provincial
agricultural offices suggest that most farmers in the Umzimkulu area practice indigenous
farming.
A digital Bio-Resource Unit map of the study area (Figure 2) was used as a basis for
stratification in the design of a sample scheme for collecting the required IFP data. An
administrative area map was overlaid on Bio-Resource Units in order to identify
homesteads and cultivated areas from which interview samples were drawn. One
administrative area was randomly selected from each of seven Bio-Resource Units
occurring in the Umzimkulu area. Table 3 and Figure 2 show the villages selected and the
administrative wards and BRUs in which they fall.
Table 3 Selected villages for farmer interviews by administrative ward and BRU
BRU BRU Name Ad' WmID ard Villal!eWc44 Glengarry 8 NgcambeleBWXc13 Upper Bisi River 8 PhelanyeniUb28 Mahobe Mission 13 NtlabeniVc33 The Fountains 13 HighlandsVb31 Deepdale 13 Mahobe MdeniVWb8 Tembeni 17 TembeniUVb7 Umzimkulu 17 Strangers Rest A
10

29°20'0"E 29°30'0"E 29°40'0"E 29°50'0"E 30 00'0"E 300 10'O'E
N
W~F~?
~
I I I I I I I I Io 5 10 20 Kilomelers
Study area
ecapebru
TYPEt:=TUb
_Tb
.UVb
.UVc
.Ub.Uc
.Wlb
IiIJI Wlc
\fINd
-3000'0"
-30°10'(
-30°20'(
-30°30'(
Vb Vd.Vc .Ve.wt..c .Vf
.VVXd .Zc
wt..e .Zd.Wo.Wc.Xb
.Xc
.Xd.Xe.Vc
30°0'0·8
30°30'0'8
30°20'0"8
30°10'0"8
29°20'0"E 29°30'O"E 29°40'0"E 29°50'0"E 30 0 0'0"E 30 0 10'0"E
Figure 2 Map ofUmzimkulu Municipality showing randomly selected administrative areas.
1 1

All homesteads using IFP were identified and listed in each administrative area selected
to make up a sampling frame. A sample of 20 farmers from each Bio-Resource Unit was
selected from the list using the simple random sampling method. Where the number of
homesteads using indigenous farming practices was less than 20, all farmers were
selected. A total of 132 farmers were interviewed.
2.2 Collection of indigenous farming practices data
A structured questionnaire (Appendix 1) was used to collect data from the selected
homesteads. The randomly selected farmers were interviewed by the researcher using the
structured questionnaire which aimed at obtaining data on indigenous production
practices regarding to land preparation, planting, soil fertility, cropping,$ystem, plant pest
control and seed selection and associated variable costs as well as yields obtained for the
growing season 2003-2004. All data were collected from each homestead per unit area on
a hectare basis. Prior to interviewing the farmer, the areas of the plots harvested were
measured. Most farmers in the study area practised intercropping and therefore, multiple
crops were often harvested from a single plot. Yield data were recorded as reported by
farmers in the 1,lnits in which they collect their harvests: maize in kg of grain, beans in
50kg bags and pumpkin in number of heads.
Poate & Daplyn (1993) discuss criticisms against this method which include arguments
that farmers tend to distort their responses either to under-report actual output for tax
evasion and other fears or tend to inflate their performance to qualify for credit and other
favourable treatment. Critics also allege that farmers may not know their output
sufficiently accurately. Response to the criticisms counter that concealment can also be
possible in other techniques such as crop-cutting which is thought to be the preferred
objective method and that it is highly unlikely that a farmer does not accurately know the
quantity of the harvest that is usually key for survival for another year. Poate & Daplyn
(1993) suggest that if harvesting techniques practised permit the farmer estimates of
output method, the latter should be considered as a valid, cost-effective and simple
12
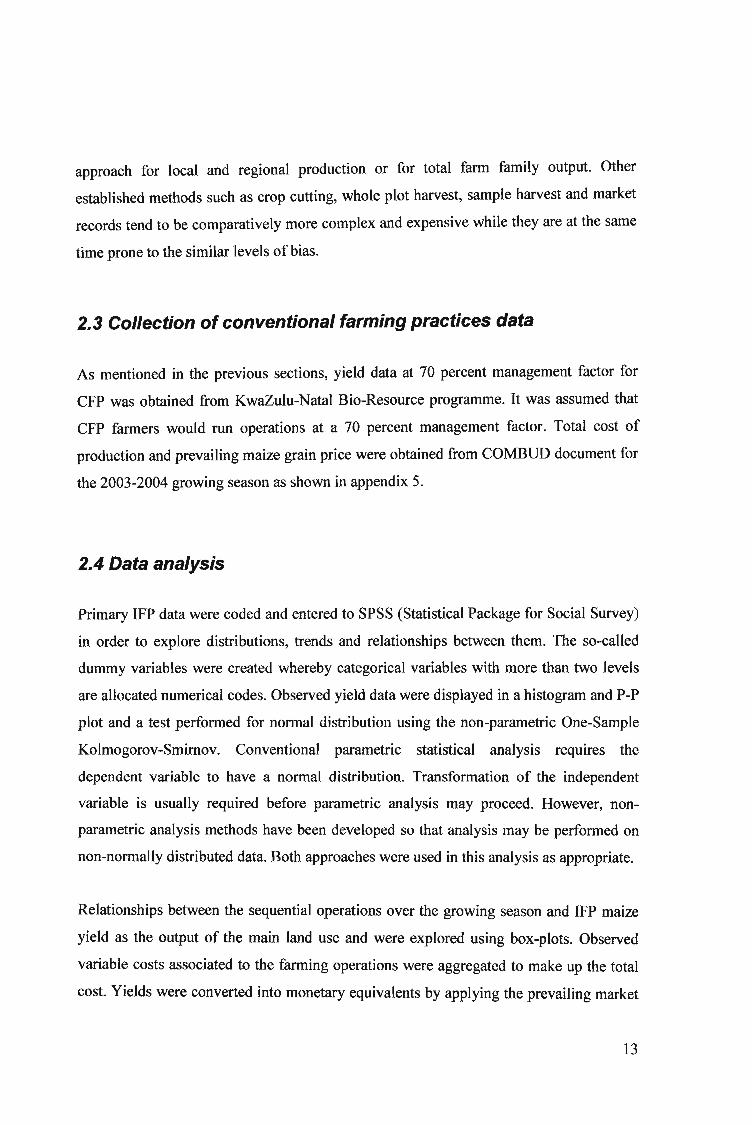
approach for local and regional production or for total farm family output. Other
established methods such as crop cutting, whole plot harvest, sample harvest and market
records tend to be comparatively more complex and expensive while they are at the same
time prone to the similar levels of bias.
2.3 Collection of conventional farming practices data
As mentioned in the previous sections, yield data at 70 percent management factor for
CFP was obtained from KwaZulu-Natal Bio-Resource programme. It was assumed that
CFP farmers would run operations at a 70 percent management factor. Total cost of
production and prevailing maize grain price were obtained from COMBUD document for
the 2003-2004 growing season as shown in appendix 5.
2.4 Data analysis
Primary IFP data were coded and entered to SPSS (Statistical Package for Social Survey)
in order to explore distributions, trends and relationships between them. The so-called
dummy variables were created whereby categorical variables with more than two levels
are allocated numerical codes. Observed yield data were displayed in a histogram and P-P
plot and a test performed for normal distribution using the non-parametric One-Sample
Kolmogorov-Smimov. Conventional parametric statistical analysis requires the
dependent variable to have a normal distribution. Transformation of the independent
variable is usually required before parametric analysis may proceed. However, non
parametric analysis methods have been developed so that analysis may be performed on
non-normally distributed data. Both approaches were used in this analysis as appropriate.
Relationships between the sequential operations over the growing season and IFP maize
yield as the output of the main land use and were explored using box-plots. Observed
variable costs associated to the farming operations were aggregated to make up the total
cost. Yields were converted into monetary equivalents by applying the prevailing market
13
price, from which the total cost was subtracted to obtain the MaSCi value according to
equation 1.
MaSC value was calculated for each respondent farmer. Similarly, CFP Margin above
Specified Cost (MaSCc) was calculated for each BRU according to Equation 2. As
mentioned in the previous section, 20 randomly selected interviews were conducted in
each BRU, except for Vb which had only 12 respondents. For each BRU, differences
between IFP and CFP Margins above Specified Cost were calculated to obtain MaSCdff
values according to Equation 3.
14

3 RESULTS
3.1 Data exploration and descriptive statistics
3.1.1 Indigenous farming yield data
As mentioned in the previous chapter, yield data collected from IFP farmer interviews
were tested for normality in SPSS statistical software. The Kolmogorov-Simimov 2-tail
normality test revealed non-normality (p=0.028, 0.=0.05); a mean = 2615; standard
deviation = 1487; N = 132. A histogram plot of the data showed a right-skewness that
may be attributable to unequal access to resources and a P-P plot showed that most of the
data did not fall on a straight line. A square root data transformation was performed on
the IFP yield data resulting in a normal distribution (P=0.25, 0.=0.05); mean 49; standard
deviation 14; N = 132. The histograms (Figure 3 and 4) and P-P plots (Figure 5 and 6),
display original and transformed yield data side by side for comparison.
20 14
12
~:-~
,,' 10
10
Sld. Dev~ 1487.54
Meao=2615.1
Maize yield in one hectare
Figure. 3 Histogram for actual yield.
Transfonned maize yield
Figure. 4 Histogram distribution for transformed IFP yield.
15

Normal P-P Plot of Maize yield in one I1.OO,-------------:;;;dlI
.75
.50
e0..
E:Jo .25
""1iJ.n o.oo"'--_~-~-~-_l
0.00 .25 .50 .75 1.00
Observed Cum Prob
Figure. 5 Normal probability plot for actual maize yield.
Normal P-P Plot of Transformed maizE1.00,----------:<1
.75
.50.0e0..
§o .25
"~",lj o.oo"'--__-_-~---.l
0.00 .25 .50 .75 1.00
Observed Cum Prob
Figure. 6 Transformed probability plot.
2.2 Relationship between individual indigenous farming practiceand maize yield .
3.2.1 Landpreparation
There is a significant difference between these three methods of land preparation in
relation to maize yield production (P=0.004) with animal traction associated with highest
yield (Figure 7) and this conform to the findings of Simalenga, Belete, Mseleni &
Jongisa (2000). This also could be attributed to the fact that tractor equipment has a
negative impact on the environment as it results to soil degradation as some implements
can lead to soil being pulverised into fine tilth (Fowler 1999).
90
80
70
60
.." 50"il'>'
.~40
"ll 30
~<2 20
~~ }D
N-
Hand hoe
24
Anhml tmction Tmctorhire
Method ofland preparation
Figure 7: Relationsbip between transformed maize yields and metbods of land preparation.
16
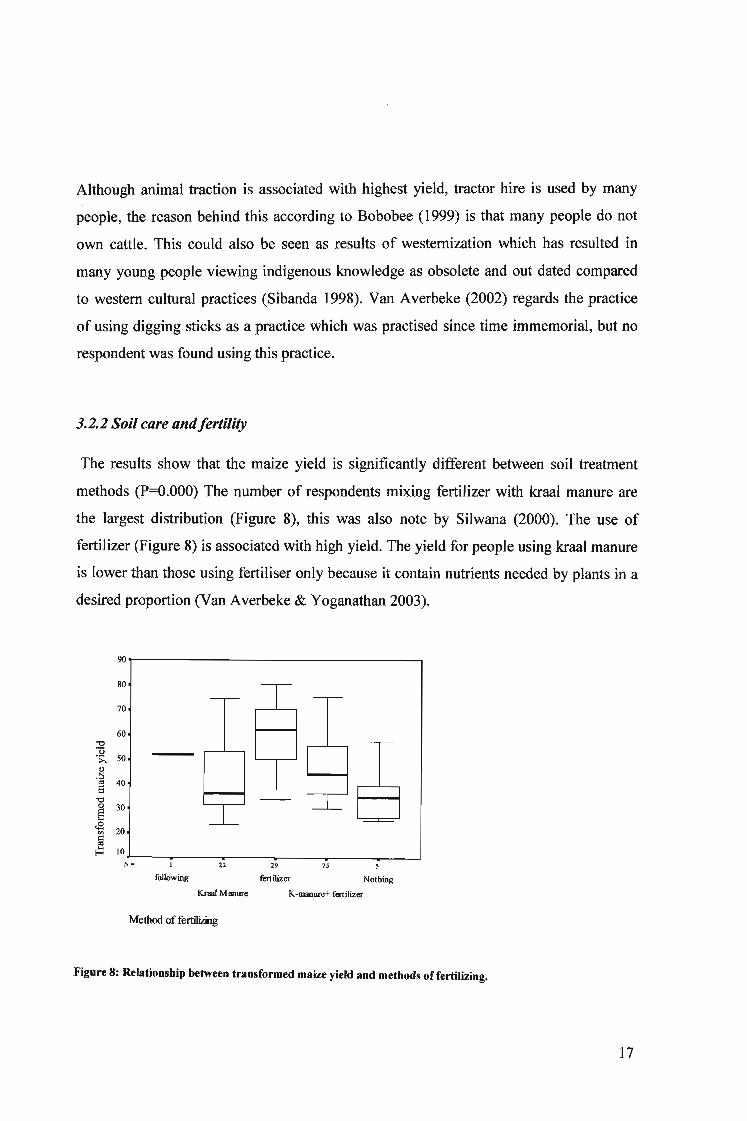
Although animal traction is associated with highest yield, tractor hire is used by many
people, the reason behind this according to Bobobee (1999) is that many people do not
own cattle. This could also be seen as results of westernization which has resulted in
many young people viewing indigenous knowledge as obsolete and out dated compared
to western cultural practices (Sibanda 1998). Van Averbeke (2002) regards the practice
of using digging sticks as a practice which was practised since time immemorial, but no
respondent was found using this practice.
3.2.2 Soil care andfertility
The results show that the maize yield is significantly different between soil treatment
methods (P=O.OOO) The number of respondents mixing fertilizer with kraal manure are
the largest distribution (Figure 8), this was also note by Silwana (2000). The use of
fertilizer (Figure 8) is associated with high yield. The yield for people using kraal manure
is lower than those using fertiliser only because it contain nutrients needed by plants in a
desired proportion (Van Averbeke & Yoganathan 2003).
90,------------------..
80
75
""~ 50
.§S 40
""§ 30
~ 20@
~ 10~---.---__:__----.-----.-----.-----lN- U H
70
60
fallowing fertilizer Nothing
Kraal Manure K-manure+ fertilizer
Method of fertiIizing
Figure 8: Relationship between transformed maize yield and methods offertilizing.
17
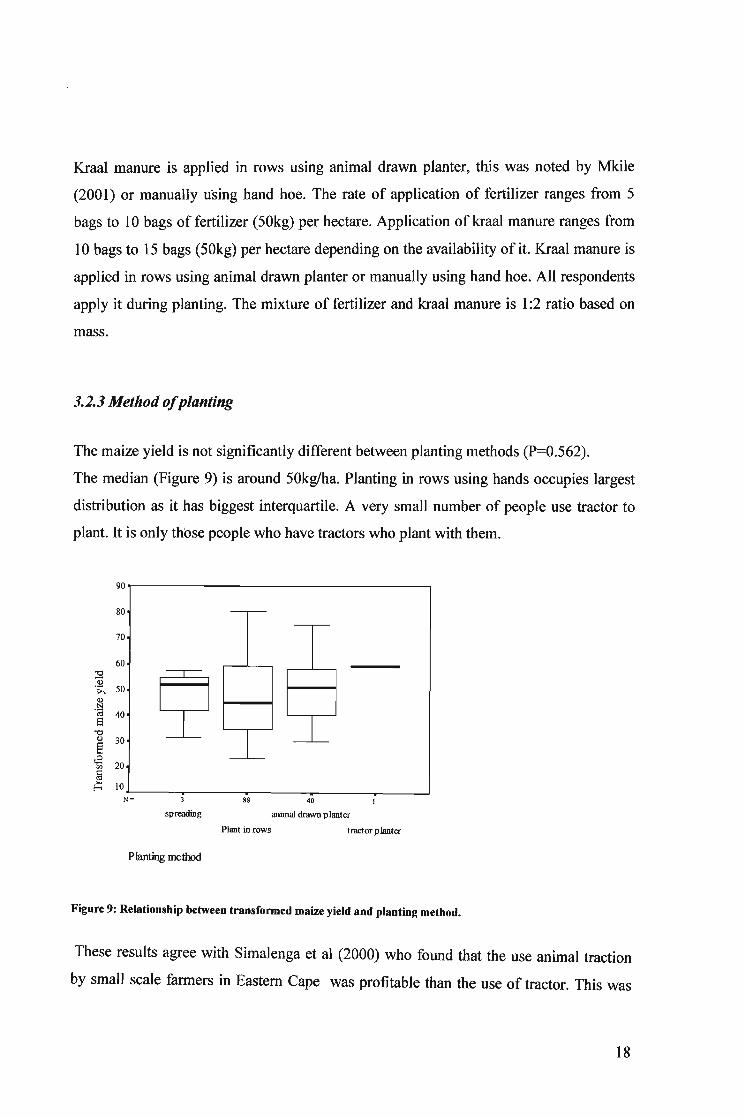
Kraal manure is applied in rows using animal drawn planter, this was noted by Mkile
(2001) or manually using hand hoe. The rate of application of fertilizer ranges from 5
bags to 10 bags of fertilizer (50kg) per hectare. Application of kraal manure ranges from
10 bags to 15 bags (50kg) per hectare depending on the availability of it. Kraal manure is
applied in rows using animal drawn planter or manually using hand hoe. All respondents
apply it during planting. The mixture of fertilizer and kraal manure is 1:2 ratio based on
mass.
3.2.3 Method ofplanting
The maize yield is not significantly different between planting methods (P=0.562).
The median (Figure 9) is around 50kglha. Planting in rows using hands occupies largest
distribution as it has biggest interquartile. A very small number of people use tractor to
plant. It is only thbse people who have tractors who plant with them.
90,....------------------.
:9Q)
';;" 50Q)
,!::lS 40
"0§ 30
~ 20a~ 10
N~=------..---....,8..-8---......40---~---l
spreading animal drawn planter
Plant in rows tractor planter
80
60
70
Planting method
Figure 9: Relationship between transformed maize yield and planting method.
These results agree with Simalenga et al (2000) who found that the use animal traction
by small scale farmers in Eastern Cape was profitable than the use of tractor. This was
18
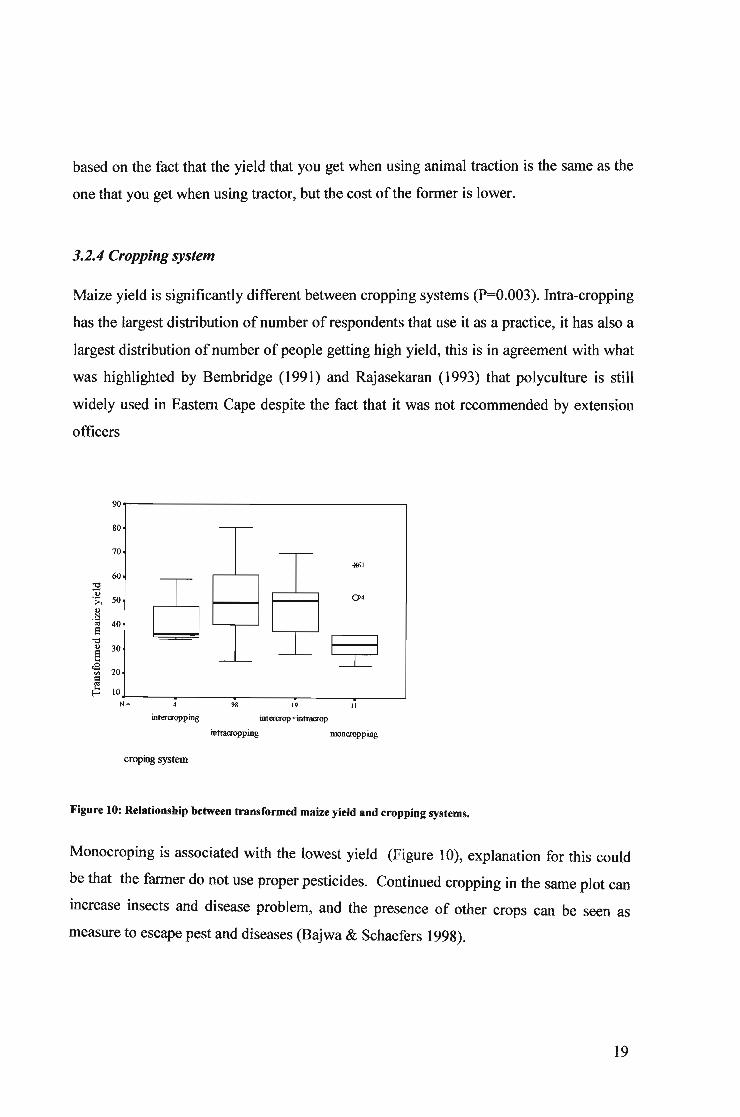
based on the fact that the yield that you get when using animal traction is the same as the
one that you get when using tractor, but the cost ofthe former is lower.
3.2.4 Cropping system
Maize yield is significantly different between cropping systems (P=0.003). Intra-cropping
has the largest distribution of number of respondents that use it as a practice, it has also a
largest distribution of number of people getting high yield, this is in agreement with what
was highlighted by Bembridge (1991) and Rajasekaran (1993) that polyculture is still
widely used in Eastern Cape despite the fact that it was not recommended by extension
officers
90
80
70
il61
60:::!.~ 0>4;>.. 50
Cl>.!::l'" 40Ei."
Cl> 30§
<S 20'"1il~ 10
N= 98 19 II
intercropping intercrop+intracrop
in~ping monoropping
croping system
Figure 10: Relationship between transformed maize yield 8nd cropping systems.
Monocroping is associated with the lowest yield (Figure 10), explanation for this could
be that the farmer do not use proper pesticides. Continued cropping in the same plot can
increase insects and disease problem, and the presence of other crops can be seen as
measure to escape pest and diseases (Bajwa & Schaefers 1998).
19

3.3.5 Plant pest measure
There is no significant difference between measures for plant pest control in relation to
maize yield (P=O.O19). The practise that has largest distribution in relation to maize yield
is combining indigenous practices and conventional practices (Figure 11). Combining
indigenous practices and conventional practices is associated with highest yield, this is
agreement with advice given by Bembridge (1991) who suggested that innovators should
have knowledge of the characteristics of rural farming populations so that new innovation
can be diffused and adopted by farmers.
90,-----------------,90.,---------------,
"September October November December
70
80
."
" 50.>-"-~ 40
E~ 30
EtB 20§.: IO.I--_~--~-~_-~------.J
N-
60
mWF.+ western
~ 50.>'
.~ 40
e"'3 30e~ 20~~ l0.l--__~--~---~---'
N- w 40
ind.ipous western
70
80
60
measures for pest control Time for planting
Figure 11: Relationship between transformed maize yield and measure for pest control.
Figure 12: relation ship between transformed maize yield and time for planting.
The distribution of people using indigenous methods of controlling pest is largest than
those who are using purely pesticides (Figure 11). This behaviour was also observed by
Prakash (2002) that when new knowledge is introduced it is adopted in large numbers,
but as the time pass by farmers gradually revert to their indigenous practices.
Early planting is used as a tactic for crop protection in several situations (Figure 12). This
was also noted in East Africa by Bajwa & Schaefers (1998) The largest interquartile
range is in December which implies that most of respondents prefer to plant later. The
respondents who get the highest yield are those who plant in November.
20

Most respondents indicated that the indigenous method they use to control pest is to plant
more seeds than actually needed to cater for the amount that will be consumed by fowl,
snails and wild birds, or to cater for unexpected climatic conditions. This practice is also
prevalent in India (Bandyopadhyay & Saha 1988).
3.2.6 Seed selection
There is significant difference between seed selection method in relation to maize yield
(p=0.000) Isiswenya has the larges distribution of number of people that use it and has a
largest distribution in term of farmers getting high yield (Figure 13).Isiswenya is a
traditional prepared seed, selected and dried using indigenous technique. Maize cobs are
dried under a fireplace for a period of three months, tips are removed and strong and big
grains are selected as seed. Isiswenya a traditional seed is the most prevalent method of
seed selection, this confirms findings of Rosenblum, Jaffe & Scheerens (2001) that
farmer preferred to use local seed on their crop land in Lesotho. It also confirms findings
of Bembridge (1991) that in Transkei replacement of indigenous seed with genetically
improved seed has not been adapted fully well by African farmers as less than half of
farmers were effectively implementing the practices of improved seeds.
90,...---------------
80 ()IQ,
70
60
"0Ol 50':;:'
".!:l 40
'"Ei--g 30
E~ 20;;~ 10.~__~ ~ ~__---.J
N= ~ ~ nisiswenya seled from 1unvest treated seed
seed method for maize
Figure 13: Relationship between transformed maize yield and methods for seed selection.
21
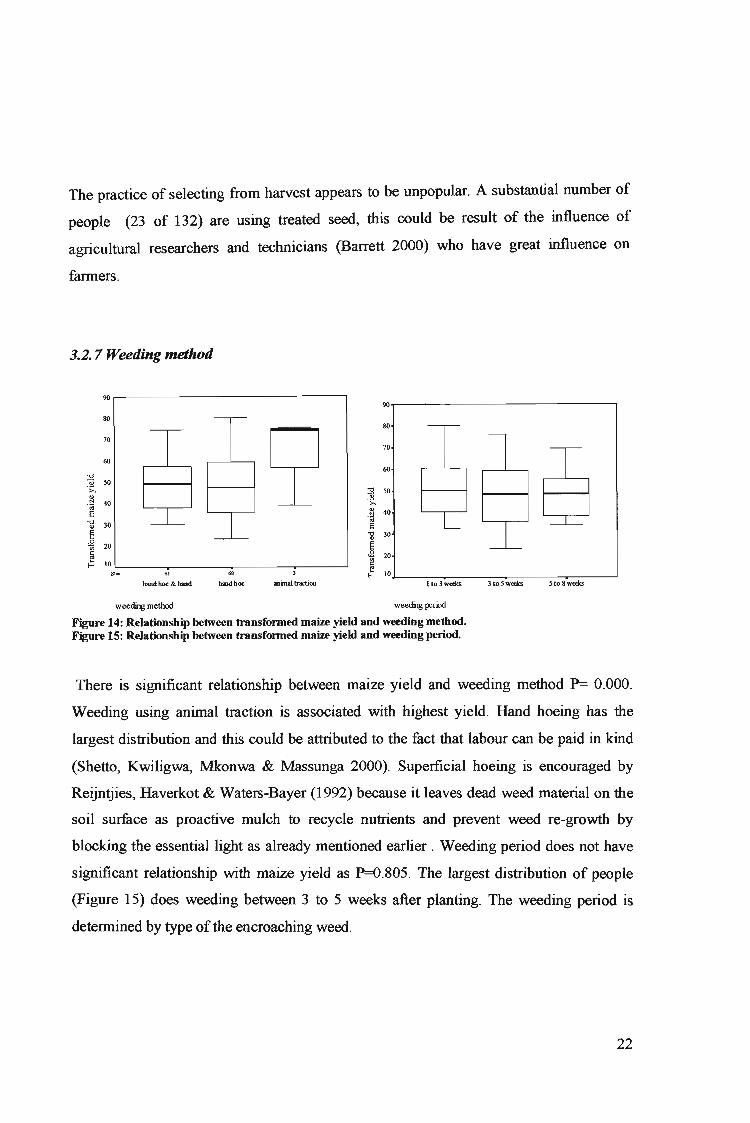
The practice of selecting from harvest appears to be unpopular. A substantial number of
people (23 of 132) are using treated seed, this could be result of the influence of
agricultural researchers and technicians (Barrett 2000) who have great influence on
farmers.
3.2. 7 Weeding method
90,------------------,9O..--~---------------,
60
70
80
::2 50_!l>,
§ 40
~11 30
§c.8 20a~ l0.l--__~-__:c~____,_-_::___=___:__--'
Ilo3wc:eks 3toSwecks 5lo8wecksaninal tractionband hoe & band
70
80
60
"0Q 50-;;,".; 40
E--g 30
EtE 20§8 10 '--__~---~--~------'
N- 68
hlIndboe
weeding method weeding perixl
Figure 14: Relationship between transfonned maize yield and weeding method.Figure 15: Relationship between transfonned maize yield and weeding period.
There is significant relationship between maize yield and weeding method P= 0.000.
Weeding using animal traction is associated with highest yield. Hand hoeing has the
largest distribution and this could be attributed to the fact that labour can be paid in kind
(Shetto, Kwiligwa, Mkonwa & Massunga 2000). Superficial hoeing is encouraged by
Reijntjies, Haverkot & Waters-Bayer (1992) because it leaves dead weed material on the
soil surface as proactive mulch to recycle nutrients and prevent weed re-growth by
blocking the essential light as already mentioned earlier. Weeding period does not have
significant relationship with maize yield as P=O.805. The largest distribution of people
(Figure 15) does weeding between 3 to 5 weeks after planting. The weeding period is
determined by type of the encroaching weed.
22

3.2.8 Bio-resource unit
There is significant relationship between Bio-Resource Units in relation to maize yield
(P=OOO). This reason for this significant difference is that biophysical condition such as
terrain, soils and climate in each BRU is homogenous and differ accordingly with other
BRUs
90,.-------------------,
20 20
UVb Vb
12
Vb
"0"0 50";;'
<l>
"!:j 40'"El"3 30§~ 20
a~ 10"-----,.---_~-____._-~~-_r_-~-~----J
N- H H H H
Wc WXc VWb Vc
80
60
70
Bioresource unit
Figure 16: Relationship between transformed maize yield and Bio-Resource Unit.
Environmental factors like climate, vegetation, soil type and terrain have major influence
on the yield of maize. The Bio-Resource Unit with a lowest maize yield is Vb33
(Figure16). The maize yield potential in BRU Vb33 is generally low its 2800. The
reason behind this is that this BRU has ecotopes which are rocky, naturally not suitable
for maize production.
23
3.3 Profitability comparison of indigenous farming practices andconventional farming practices
A detailed presentation of the calculated Margin above Specified Cost figures by BRU is
presented in Appendix 3. Comparison in profitability between the CFP and IFP methods
was analysed by calculating the average MaSC for each farming practice by BRU and
then subtracting them to obtain the average differences (Figure 1).
As mentioned earlier in the previous chapter, data were obtained from random samples of
20 farmers that use IFP selected from each BRU, except in Vb in which only 12 farmers
practised IFP. Since the BRU sample was relatively small with respect to conventional
statistical analysis requirements, it became necessary to ascertain that the observed
average differences in MaSC were not significantly different from the 'true' or
population averages. (Proof to the contrary would mean that the obtained average difference
would not be a valid representation ofthe real situation.) This was achieved by comparing the
observed average differences with proxy population of average differences simulated
using a bootstrap resampling procedure.
Bootstrap resampling is an established procedure for randomly replicating a given sample
to create a proxy population from which the sample was derived The bootstrap
resampling methodology is described to some detail by Efron and Tibshirani (1993); Burt
and Barber (1996); Blank et al (1999); in Rugege (2002) and by Davison & Hinkley
(1997).
Results of the calculation process for MaSCavd (Margin above Specified Cost average
difference)by BRU is provided in Appendix 3. A summary of observed average
differences in Margin above Specified Cost denoted by MaSCavd by BRU and their
respective resampled proxy population average differences are displayed in Table 4. In
the resampling procedure 10000 samples of MaSCavd were generated with replacement at
95 percent confidence level or significance level a = 0.05.
24

Table 4 Summary of profitability analysis by BRU
BRU MaSC; MaSCc MaSCavd Resampled AchievedMaSCavd level of(a = 0.05) significance
P-valueWc44 3453 1699 1754 1333 0.4828
WXc13 2837 1287 1550 1518 0.5103VWb8 2718 699 2019 1979 0.5126Vc33 2555 1081 1474 1511 0.5078Vb31 63 -1494 1557 1454 0.5021UVb7 2572 1287 1285 1247 0.5043Ub28 3286 669 2617 2251 0.4941
Results (Table 4) show that the average differences between the CFP and IFP MaSC
calculated from observed data are very close to those calculated from the proxy
population generated using the bootstrap resampling procedure. All observed cases
showed p-values well above the set 0.05 level of significance (Table 4). Appendix 4
shows histogram distributions of resampled MaSCavd values indicating the position of the
observed MaSCavd within the proxy population and the 95 percent confidence limits. All
the histogram distributions (Appendix 4) indicate that none of the observed MaSCavd
were significantly different from the population mean. In all BRUs average MaSCavd is
above 1285 in favour ofIFP.
Although CFP maize yields in kg/ha are significantly higher than those of IFP (Table 5),
CFP production costs are also much higher. The income derived from the intercropped
and intra-cropped beans and pumpkins makes a significantly increase total IFP income.
It is important also to note that the income of beans and pumpkins is not so high as it
would have been if CFP was used. The cost of production when using IFP is cheaper
when compared to using conventional method as most of indigenous inputs like kraal
manure, seeds, and indigenous pesticides are readily available at little or no cost.
Ploughing is paid in kind (provision of home brewed beer made out of traditional
25
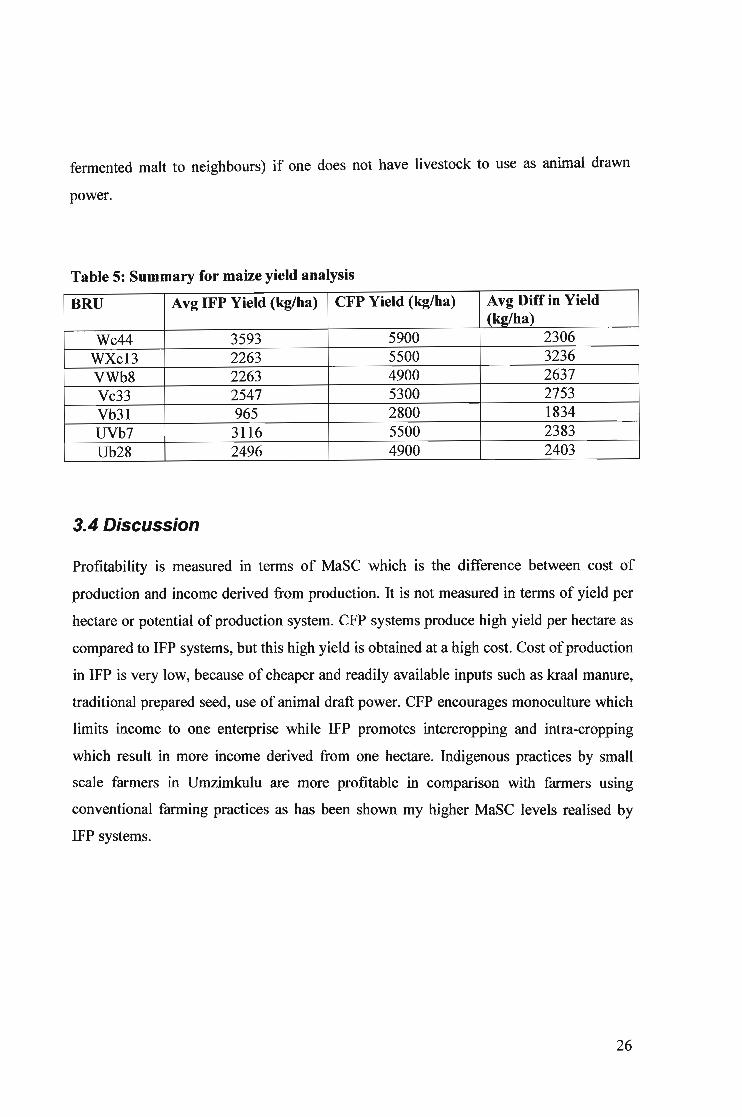
fermented malt to neighbours) if one does not have livestock to use as animal drawn
power.
Table 5: Summary for maize yield analysis
BRU Avg IFP Yield (kg/ha) CFP Yield (kg/ha) Avg Diff in Yield(kg/ha)
Wc44 3593 5900 2306WXc13 2263 5500 3236VWb8 2263 4900 2637Vc33 2547 5300 2753Vb31 965 2800 1834UVb7 3116 5500 2383Ub28 2496 4900 2403
3.4 Discussion
Profitability is measured in terms of MaSC which is the difference between cost of
production and income derived from production. It is not measured in terms of yield per
hectare or potential of production system. CFP systems produce high yield per hectare as
compared to IFP systems, but this high yield is obtained at a high cost. Cost ofproduction
in IFP is very low, because of cheaper and readily available inputs such as kraal manure,
traditional prepared seed, use of animal draft power. CFP encourages monoculture which
limits income to one enterprise while IFP promotes intercropping and intra-cropping
which result in more income derived from one hectare. Indigenous practices by small
scale farmers in Umzimkulu are more profitable in comparison with farmers using
conventional farming practices as has been shown my higher MaSC levels realised by
IFP systems.
26

5 CONCLUSIONS AND RECOMMENDATIONS
5. 1 Conclusion
5.1.1 Indigenous farming practices used in Umzimkulu
This research has shown that digging using sticks has vanished as it is no longer practised
in South Africa. Animal traction is still being used by people who own livestock and
those who are close to them. The majority of people use tractor to prepare their land, not
because it is cheap but because it is readily available. The people who are using animal
traction have the highest yield.
The findings of the research indicate that the largest distribution of people still use hand
hoes to plant in rows and some use animal traction to plant. There is no significant
relationship between planting methods in relation to maize yield. Hand hoeing is also
common practice in Umzimkulu.
Shifting cultivation is no longer done as people are settled in their communities. A very
small number of people are still fallowing lout of 132 people was practising fallowing.
There is a significant number of people who are using kraal manure. The practise of
mixing kraal manure and commercial fertilizer is still prevalent in many BRUs and is
associated with highest yields. A very small number of people apply nothing to fertilize
their soil.
A large number of people are intercropping and intra-cropping while some combine these
practices. A small number of people practise monocropping. The people who use
indigenous methods in controlling crop pests is still large. Some people because of
financial constraints mix indigenous methods and conventional methods of preventing
crop pests. Indigenous seed Isiswenya is the most prevalent seed selection. Although
treated seed is still used, many people prefer to use isiswenya.
27
5.1.2 Profitability
This study has shown that IFP is more profitable than CFP for small scale maize farmers.
Although' profitability differs according to BRU, in all cases MaSC i was greater than
MaSCc• This can be attributed to production costs of IFP which are very low while
income per hectare is high. The reverse is true for CFP. For example the cost ofoperating
a tractor and that of operating an animal drawn planter differs significantly. Furthermore,
some ofthe inputs like kraal manure are available at no cost. The seed is prepared from
previous harvest. The reason for high income is that intercropping and intra-cropping
result in more than one enterprise, deriving income for one hectare.
5.2 Recommendation
IFP should be integrated to research and development. Innovations should be based on
what people are doing and should suite their way of life. Research should focus on
improving the current indigenous practices.
Further research on IFP needs to be done in order to document all the information for
future references and also to change the perception of researchers, scientist and extension
officers on indigenous farming practices.
28
References
BAJWA, W.!. & SCHAEFERS, G. 1998. Indigenous Crop Practices in Sub-SaharanEast Africa. Consortium for International Crop protection, USA.
BANDYOPADHYAY, A.K. & SAHA G.S. 1998. Indigenous methods of seedselection and preservation on the Andaman Islands in India. Indigenous Knowledgeand Development Monitor 6: 3-6.
BARRETT, C. B. 2000. The challenge of improved natural resource managementpractices adoption in African agriculture: A social science perspective. Paperprepared for the workshop on Understanding Adoption Processes for NaturalResource Management Practices for Sustainable Agricultural Production in SubSaharan Africa, Nairobi, Kenya, July 3-5.
BARRY, P.J.,ELLINGER,P.N., HOPKIN, J.A. & BAKER, C.B. 1995. Financialmanagement in agriculture. Interestate, Danville.
BEMBRIDGE, T.J. 1991. Technology transfer in Small-Scale Dryland CropProduction: Future Challenges. Development Southern Africa 8:479-493.
BOBOBEE, E.Y.H. 1999. Role ofdraft animal power in Ghanaian Agriculture,University of Science and Technology Kumasi, Ghana.
CAMP, K. 2003. Guide to use of the Bio-Resource Programme. Cedara Report NoN/A/99/11, Natural Resource section - Technology development and training,Cedara, 1-34.
DAVISON, A.C. & HINKLEY, D.V. 1997. Bootstrap methods and their application.Cambs, London.
DAWES, W. 1993. Introduction in Traditional knowledge and sustainabledevelopment. In: S.H. Davis and K. Ebbe (eds), Proceedings ofa Conference held atThe World Bank Washington D.C in Sept. 27 - 28. p.3 Environmentally SustainableDevelopment Proceeding Series No. 4.
FITSHUGH, H. & A.E. WILHELM. 1995. Value and uses of indigenous livestockbreeds in developing nations. In: M.L Oldfield and J.B. Alcorn (eds), Biodiversity:culture, conservation and eco-development, p.102-116. Michigan University Press,Michigan
29
FOWLER, R. 1999. Conservation tillage research and development in South Africa.In Kaumbutho PG and Simalenga TE (eds), Animal powerfor weed control, p51-63.A resource book of the Animal Traction Network for Eastern and Southern AfricaTantesa,Wageningen.
MKILE, Z. 2001. The use and agronomic effectiveness ofkraal manures in theTranskei region of the Eastern Cape, South Africa. M Sc dissertation, University ofFort Hare, Alice.
POATE, C.D. & DAPLYN, P.F. 1993. Data for Agrarian Development. CambridgeUniversity Press.
PRAKASH, S. 2002. Using Indigenous Knowledge to Raise AgriculturalProductivity. World Bank IK Notes. No.45 The World Bank, Washington, D.C.
RAJASEKARAN, B. 1993. Indigenous technical practices in a rice-based farmingsystem. Center for Indigenous Knowledge for Agriculture and Rural Development,Ames.
REIJNTJES, C., B. HAVERKORT, & A. WATERS-BAYER. 1992. Farming for thefuture: An introduction to low-external input and sustainable agriculture. Macmillan,London.
ROSENBLUM, M.L., JAFFE, L. & SCHEERENS, J.c. 2001. Setting up farmers'research agendas in Lesotho. Indigenous Knowledge and Development Monitor 9: 3-7
RUGEGE, D. 2002. Regional analysis of maize-based land use systems for earlywarning application. Doctoral Thesis, Wageningen University, The Nertherlands.
SHETTO, M., KWILIGWA, E.M., MKOMNWA, S. & MASSUNGA, M. 2000.Weed control by draft animals: experience in the South Highlands ofTanzania. InStarkey P and Simalenga T (eds), Animalpowerfor weed control, p51-63. A resourcebook of the Animal Traction Network for Eastern and Southern Africa ,WageningenThe Nertherlands.
SIBANDA, H.1998. Sustainable Indigenous Knowledge Systems in Agriculture inZimbabwe's Rural areas ofMatabele and North and South Provinces. World Bank IKNotes. No.2. The World Bank, Washington, D.C.
SILWANA, T.T. 2000.The performance of maize/bean and maize/pumpkin intercropsunder different planting combinations and weeding in Transkei, Sout Africa. M Scdissertation, University of Fort Hare, Alice.
30

SIMALENGA T.E, BELETE, B., MSELENI, N. & JONGISA L.L. 2000. Assessingthe profitability of using animal traction under small holder farming conditions.South African Journal ofAgricultural Extension 29: 1-9.
VAN AVERBEKE, W. 2002. Indigenous technology and technology-orientedResearch: Implications for research methodology. AIAEE 2002 proceedings ofthelsth Annual Conference held in Durban South Africa Proceeding Series No. 452.
VAN AVERBEKE, W. & YOGANATHAN, S. 2003. Using kraal manure asfertilizer. Department of Agriculture, Republic of South Africa.
VAN REENEN, M.l. & MARAIS A. DE K. 1992. Farm management: Financialplanning, analysis and control. JL van Schaik Publishers, Pretoria.
WARREN, D.M. 1991. Using indigenous knowledge in agricultural development.World Bank Discussion Papers. No 127. The World Bank, Washington, D.e.
31

Appendix 1: Questionnaire1. Profile of RespondentQuestionnaire CodelID ,. .. . .Date .Ward No .Administration Area... .. . .Size of area of planted
2. Land preparationo
I How is the land prepared before planting Digging Hand Animal Tractor No preparationssticks hoe traction hireI 2 3 4 5 o
2 How much does this technique cost toprepare land
3 How land is fertilitymaintained
No cost Less than RIOO -R300 Above 300RIOO
I 2 3 4
Fallowing Kraal Fertilizer Fertilizer Nothing Kraal manuremanure Kraal Manure
Fallowing FallowingI 2 3 4 5
oo
4 Indicate how much you apply .
5 How much does this technique cost tofertilize you garden
6 When do you apply fertilizer
Less than R50- RlOO R100-R500 AboveR500R50I 2 3 4
Before After Planting During planting no fertilizerplanting appliedI 2 3 4
o
oPlanting
8 Which cropping system
7 How land is planted
9 Which crops do youintracrop
Spreading Plant in Use animal Tractor hire Otherseed rows drawn planter1 2 3 4 5
Intercrop Intracropping Intercropping Monocroppingping
IntracroooingI 2 3 4
Maize Maize Maize MaizeBeans
Beans Pumpkins PumpkinI 2 3 4 5
32
o
o

10 Which crops do you intercrop Maize beans Maize Maize No& pumpkins + intercroppingpotatoes
Beans potatoes1 2 3 4
11 How much does this techniquecost to plant D12 At what time do you start to plant and why .
13 Indicate the yield that you get in each I~M=a=iz::e I--:B=.e=an=s_-+-~.::..p.::um=p::kin=-t..J:pc::o.::ta::.to::.:e::s _ofthese crops .... ..
Weeding
14 Which method do you use forweeding
Hand and hand hoe hand animal tractionhand hoe1 2 3 4 o
Pest control and disease16 Who is responsible pest and disease control I~ale I~ema1e I~Oth
17 What is the age distribution of a person Iiess than 30 I;0 - 55 I~bove55 IZUresponsible for pest control
18 Which technique do you ues I~degenOUS I~oth I~mbined I
If other method explain .1-3 weeks 3-5 weeks 5-8 after 8 weeks
15 When do you start weeding after weeksplanting 2 3 4
19 Indicate the type of pest that and how are controlled
no weeding
4oooo
l,--p::.:e::s:.:..t I_M_eas_ur_e-=..:foc.:.r...:coc.:.n::.tr::.o:..:1-------------
20 Indicate the type ofdisease that and how are controlled
I_C=ro:.tP:..:d=i=se:.::ase=-=- I....;M=eas=.:u::.re~fo::.r..::c.::..on:::tr=..;o:.:I'--- _
21 Ifthere is no measure to control pest and'disease indicate how crops survive .
Seed Selection22 MaizeSeed selection Process I Period
33
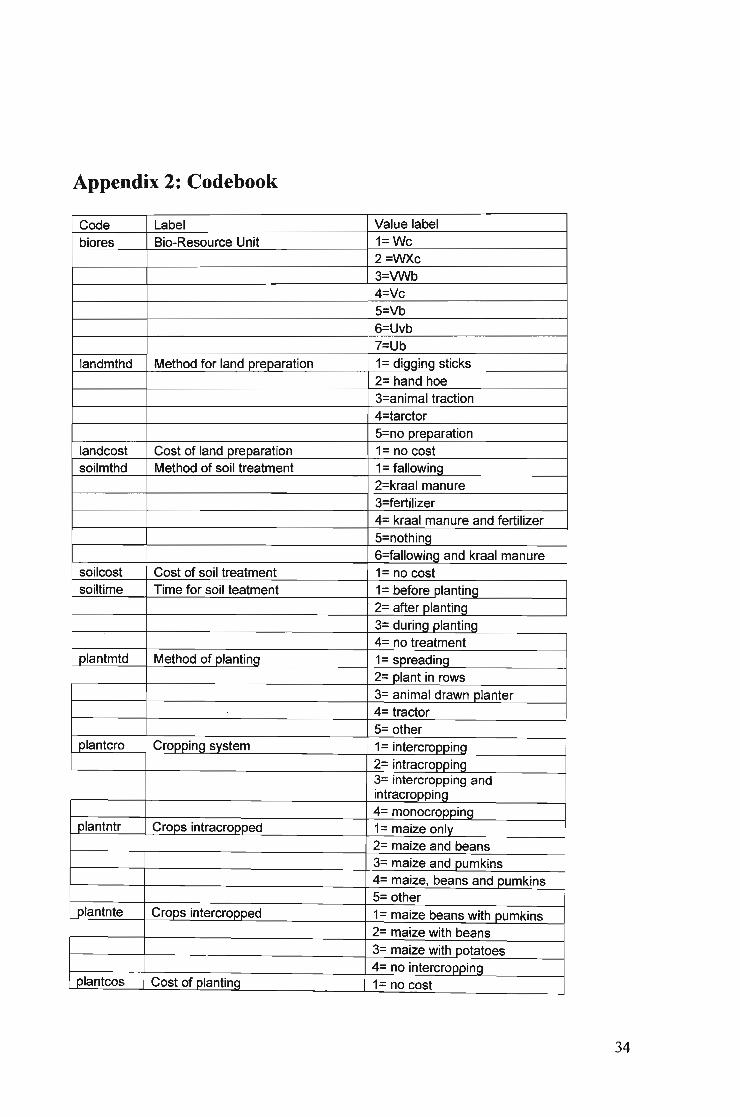
Appendix 2: Codebook
Code Label Value labelbiores Bio-Resource Unit 1=Wc
2=WXc3=VWb4=Vc5=Vb6=Uvb7=Ub
landmthd Method for land preparation 1= digging sticks2= hand hoe3=animal traction4=tarctor5=no preparation
landcost Cost of land preparation 1= no costsoilmthd Method of soil treatment 1= fallowing
2=kraal manure3=fertilizer4= kraal manure and fertilizer5=nothina6=fallowinq and kraal manure
soilcost Cost of soil treatment 1= no costsoiltime Time for soil teatment 1= before plantina
2= after plantinq3= during plantinq4= no treatment
plantmtd Method of planting 1= spreadinq2= plant in rows3= animal drawn planter4= tractor5= other
plantcro Cropping system 1= intercroppinq2= intracroppina3= intercropping andintracroppina4= monocroppinq
plantntr Crops intracropped 1= maize onlv2= maize and beans3= maize and pumkins4= maize, beans and pumkins5= other
plantnte Crops intercropped 1= maize beans with pumkins2= maize with beans3= maize with potatoes4= no intercroppinq
plantcos Cost of planting 1= no cost
34
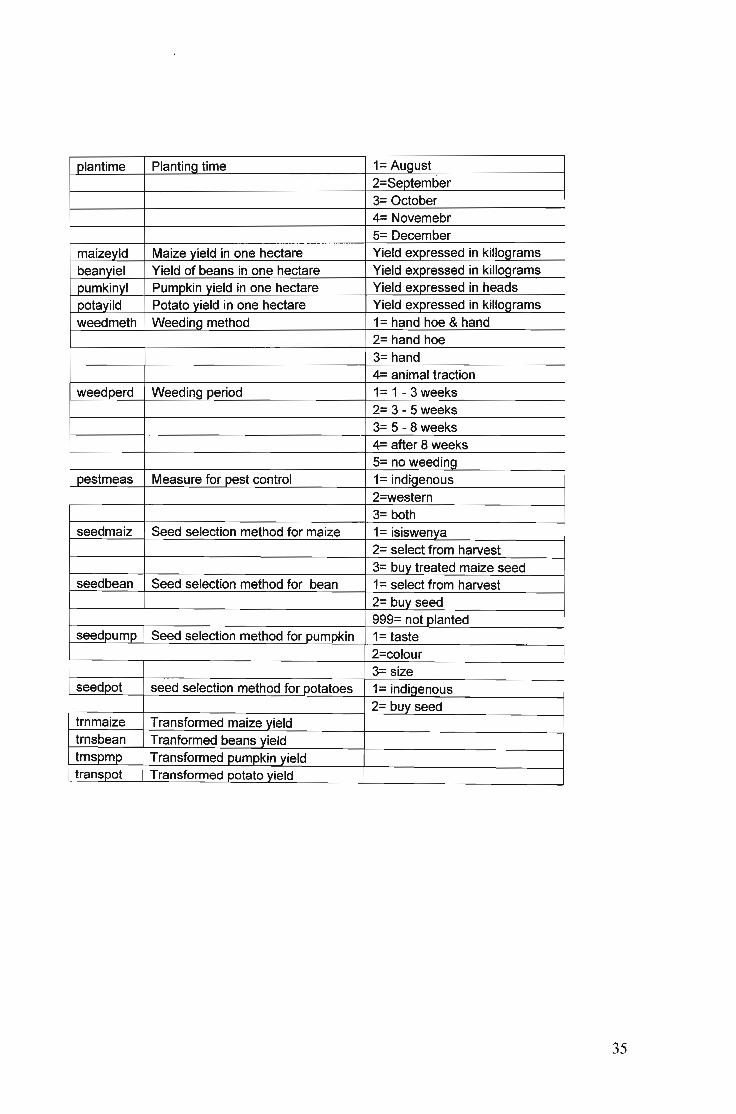
plantime PlantinQ time 1= AUQust2=September3= October4= Novemebr5= December
maizevld Maize vield in one hectare Yield expressed in killoQramsbeanyiel Yield of beans in one hectare Yield expressed in killoQramspumkinvl Pumpkin yield in one hectare Yield expressed in headspotayild Potato yield in one hectare Yield expressed in killoQramsweedmeth Weedina method 1= hand hoe & hand
2= hand hoe3= hand4= animal traction
weedperd Weeding period 1= 1 - 3 weeks2= 3 - 5 weeks3= 5 - 8 weeks4= after 8 weeks5= no weeding
pestmeas Measure for pest control 1= indiQenous2=western3= both
seedmaiz Seed selection method for maize 1= isiswenva2= select from harvest3= buy treated maize seed
seedbean Seed selection method for bean 1= select from harvest2= buy seed999= not planted
seedpump Seed selection method for pumpkin 1= taste2=colour3= size
seedpot seed selection method for potatoes 1= indiaenous2= buy seed
trnmaize Transformed maize yieldtrnsbean Tranformed beans yieldtrnspmp Transformed pumpkin yieldtranspot Transformed potato yield
35
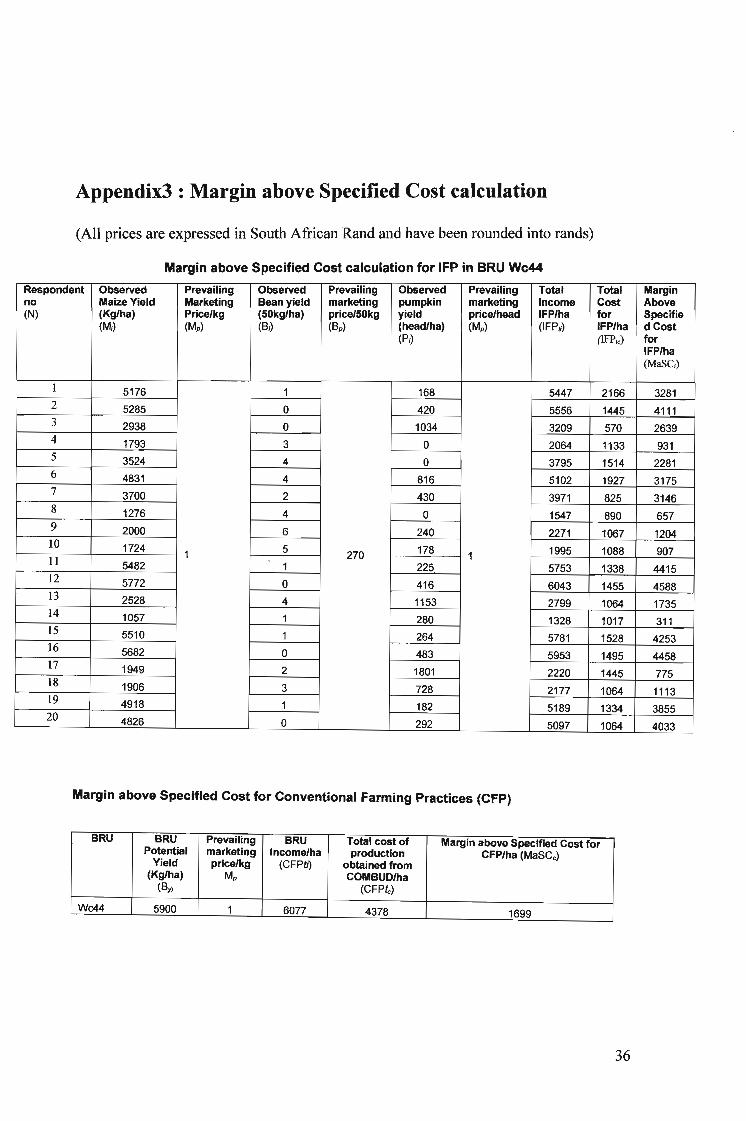
Appendix3 : Margin above Specified Cost calculation
(All prices are expressed in South African Rand and have been rounded into rands)
Margin above Specified Cost calculation for IFP in BRU Wc44
Respondent Observed Prevailing Observed Prevailing Observed Prevailing Total Total Margin
no Maize Yield Marketing Bean yield marketing pumpkin marketing Income Cost Above
(N) (Kg/ha) Price/kg (50kg/ha) price/50kg yield price/head IFP/ha for Specifie
(Mi) (Mp) (Bi) (Bp) (head/ha) (Mp) (IFPw) IFP/ha dCost(Pi) (!FP,c) for
IFP/ha(MaSc i)
1 5176 1 168 5447 2166 3281
2 5285 0 420 5556 1445 41113 2938 0 1034 3209 570 26394 1793 3 0 2064 1133 9315 3524 4 0 3795 1514 22816 4831 4 816 5102 1927 31757 3700 2 430 3971 825 31468 1276 4 0 1547 890 6579 2000 6 240 2271 1067 120410 1724 5 178 1995 1088 9071 270 111 5482 1 225_ 5753 1338 441512 5772 0 416 6043 1455 458813 2528 4 1153 2799 1064 173514 1057 1 280 1328 1017 31115 5510 1 264 5781 1528 425316 5682 0 483 5953 1495 445817 1949 2 1801 2220 1445 77518 1906 3 728 2177 1064 111319 4918 1 182 5189 1334 385520 4826 0 292 5097 1064 4033
Margin above Specified Cost for Conventional Farming Practices (CFP)
BRU BRU Prevailing BRU Total cost of Margin above Specified Cost forPotential marketing Income/ha production CFP/ha (MaSCc)
Yield price/kg (CFPb) obtained from(Kg/ha) Mp COMBUD/ha
(By) (CFPfc)
Wc44 5900 1 6077 4378 1699
36

DATA AND CLULCULATIONS FOR BRU WXc13
Margin above Specified Cost Indigenous Farming Practices (IFP)
Respondent Observed Prevailing Observed Prevailing Observed Prevailing Total Total Marginno Maize Yield Marketing Bean yield marketing pumpkin marketing Income Cost for Above
(N) (Kg/ha) Price/kg (50kg/ha) price/50kg yield price/head IFP/ha IFP/ha Specified(Mi) (Mp) (B;) (Bp) (head/ha) (Mp) (IFP.) (lFP,c) Cost for
(Pi) IFP/ha(MaSC,)
1 2860 0 0 3131 850 22812 1500 0 0 1771 892 8793 2938 0 1026 3209 1162 20474 1435 7 2375 1706 1195 5115 2723 7 1401 2994 1276 17186 1932 7 0 2203 1064 11397 1212 0 424 1483 876 6078 1591 4 1774 1862 1751 1119 1208 7 0 1479 1064 41510 1082 0 1166 1353 1064 28911 1 270 1
1208 8 1176 1479 1770 -29112 2801 8 0 3072 1064 200813 2528 0 280 2799 1064 173514 2114 8 0 2385 1064 132115 2787 0 0 3058 1064 199416 2564 0 1324 2835 1434 140117 2437 7 728 2708 1443 126518 1906 7 2177 1064 111319 3580 0 824 3851 1064 278720 4870 11 0 5141 2041 3100
Margin above Specified Cost for Conventional Farming Practices (CFP)
BRU BRU Prevailing BRU Total cost of MarginPotential marketing Income/ha production above
Yield price/kg (CFPb) obtained Specified(Kg/ha) Mp from Cost for
(By) COMBUD/ha CFP/ha(CFPfc) (MaSCc)
WXc13 5500 1 5665 4378 1287
37

DATA AND CLULCULATIONS FOR BRU VWb8
Margin above Specified Cost Indigenous Farming Practices (IFP)
Respondent Observed Prevailing Observed Prevailing Observed Prevailing Total Total Marginno Maize Marketing Bean marketing pumpkin marketing Income Cost Above
(N) Yield Price/kg yield price/50kg yield price/head IFPlha for Specified(Kg/ha) (Mp) (50kg/ha) (Bp) (head/ha) (Mp) (IFPn) IFP/ha Cost for(M;) (B;) (P;) (IFP,c) IFPlha
(MaSC,)
1 2860 1 1740 3131 1339 17922 4941 2 0 5212 1740 34723 2938 4 1666 3209 1560 16494 1793 4 1500 2064 1339 7255 3524 2 0 3795 1339 24566 3367 2 0 3638 1339 22997 1603 5 0 1874 1339 5358 1060 5 0 1331 1339 -89 2364 1 0 2635 1339 129610 5411 5 1604 5682 2977 27051 270 111 3289 2 0 3560 1339 222112 3224 5 0 3495 1339 215613 1011 4 0 1282 844 43814 2643 1 1567 2914 1339 157515 2787 1 0 3058 1339 171916 2564 6 0 2835 1339 149617 2437 8 1688 2708 1876 83218 1906 7 0 2177 1339 83819 1790 1 0 2061 879 118220 1748 2 0 2019 1339 680
Margin above Specified Cost for Conventional Farming Practices (CFP)
BRU BRU Prevailing BRU Total cost of MarginPotential marketing Incomelha production above
Yield price/kg (CFPtl) obtained Specified(Kg/ha) Mp from Cost for
(By) COMBUDlha CFP/ha(CFPf,,) (MaSCc)
VWb8 4900 1 5047 4378 669
38
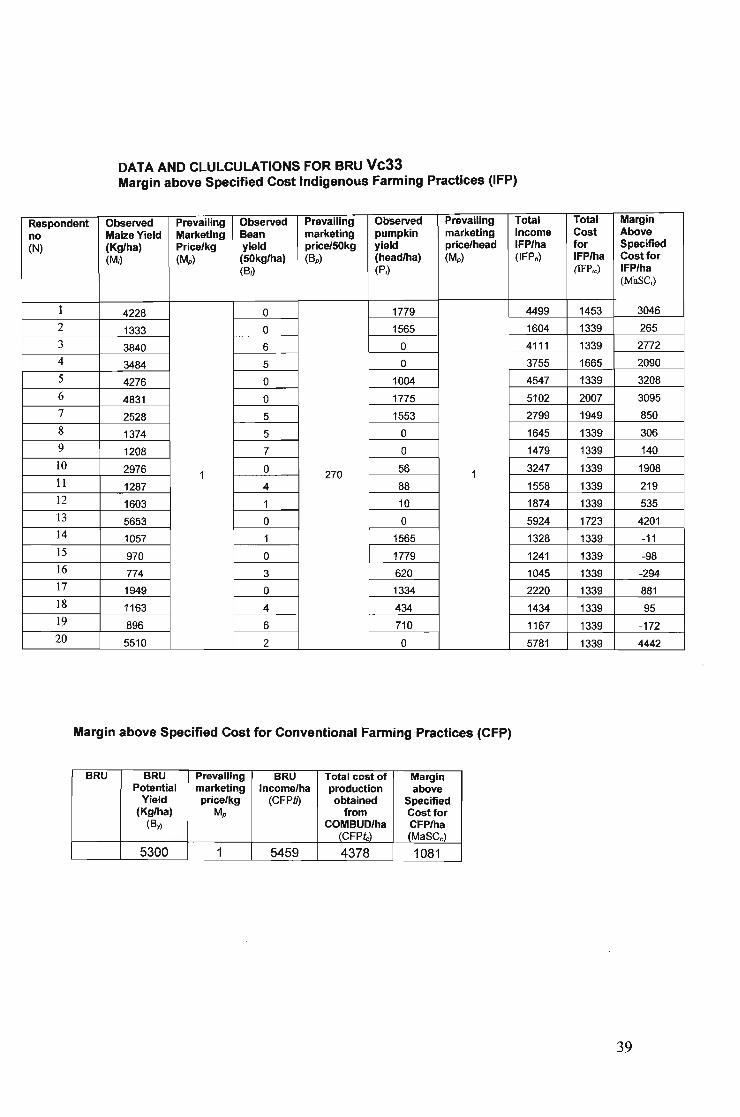
DATA AND CLULCULATIONS FOR BRU Vc33Margin above Specified Cost Indigenous Farming Practices (IFP)
Respondent Observed Prevailing Observed Prevailing Observed Prevailing Total Total Margin
no Maize Yield Marketing Bean marketing pumpkin marketing Income Cost Above
(N) (Kg/ha) Price/kg yield pricelSOkg yield price/head IFP/ha for Specified
(Mi) (Mp) (SOkg/ha) (Bp) (head/ha) (Mp) (IFPfi) IFPlha Cost for(B;) (Pi) (IFP,c) IFP/ha
(MaSq
1 4228 0 1779 4499 1453 30462 1333 0 1565 1604 1339 2653 3840 6 0 4111 1339 27724 3484 5 0 3755 1665 20905 4276 0 1004 4547 1339 32086 4831 0 1775 5102 2007 30957 2528 5 1553 2799 1949 8508 1374 5 0 1645 1339 306
9 1208 7 0 1479 1339 14010 2976 0 56 3247 1339 1908
1 270 111 1287 4 88 1558 1339 21912 1603 1 10 1874 1339 53513 5653 0 0 5924 1723 420114 1057 1 1565 1328 1339 -1115 970 0 1779 1241 1339 -9816 774 3 620 1045 1339 -29417 1949 0 1334 2220 1339 88118 1163 4 434 1434 1339 9519 896 6 710 1167 1339 -17220 5510 2 0 5781 1339 4442
Margin above Specified Cost for Conventional Farming Practices (CFP)
BRU BRU Prevailing BRU Total cost of MarginPotential marketing Income/ha production above
Yield price/kg (CFPh) obtained Specified(Kg/ha) Mp from Cost for
(By) COMBUD/ha CFP/ha(CFPfc) (MaSCc)
5300 1 5459 4378 1081
39

DATA AND CLULCULATIONS FOR BRU VB31
Margin above Specified Cost Indigenous Farming Practices (IFP)
Respondent Observed Prevailing Observed Prevailing Observed Prevailing Total Total Cost Margin
no Maize Marketing Bean marketing pumpkin marketing Income for IFP/ha Above
(N) Yield Price/kg yield price/50kg yield price/head IFP/ha (IFP,c) Specified(Kg/ha) (Mp) (50kg/ha) (Bp) (head/ha) (Mp) (IFP6) Cost for(M;) (B;) (Pi) IFP/ha
(MaSC;)
1 617 0 0 888 922 -342 1111 0 0 1382 1007 3753 701 1 0 972 922 504 791 0 88 1062 1223 -1615 545 0 0 816 922 -1066 635 1 0 906 922 -16
1 270 17 1318 0 0 1589 947 6428 1008 0 50 1279 922 3579 1208 0 0 1479 1007 47210 820 0 0 1091 922 16911 1287 0 0 1558 922 63612 1543 0 0 1814 1223 591
Margin above Specified Cost for Conventional Farming Practices (CFP)
BRU BRU Prevailing BRU Total cost of MarginPotential marketing Income/ha production above
Yield price/kg (CFPtJ) obtained Specified(Kg/ha) Mp from Cost for
(By) COMBUD/ha CFP/ha(CFPIc) (MaSCc)
Vb 2800 1 2884 4378 -1494
40
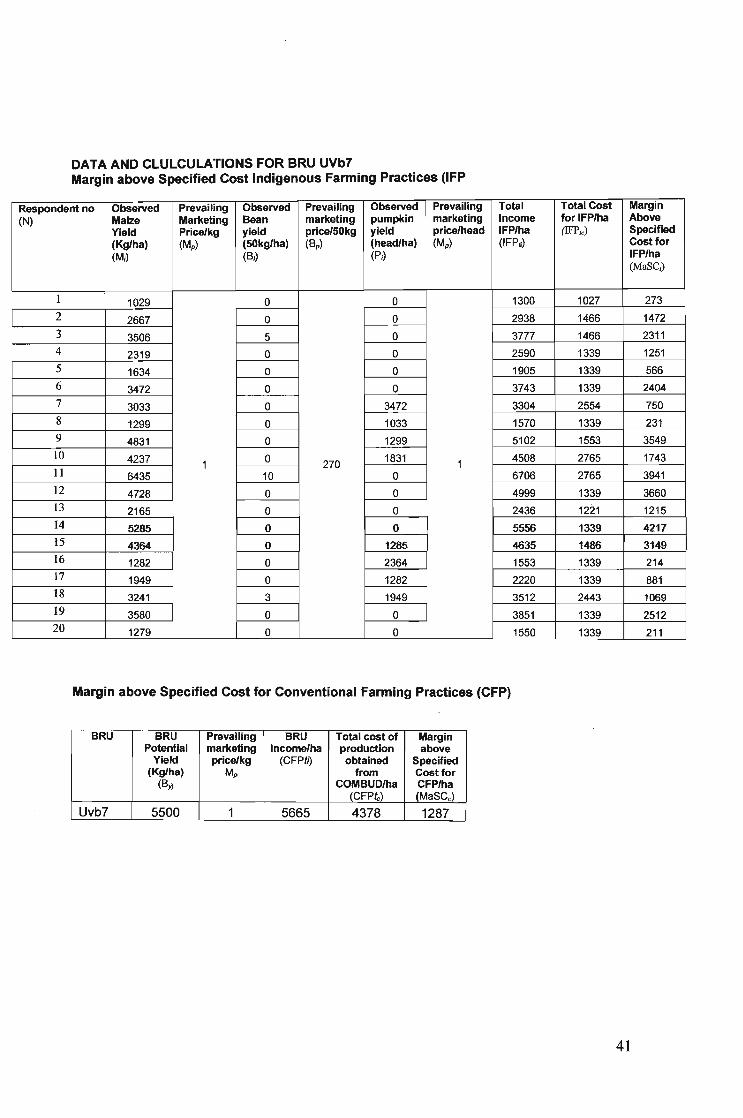
DATA AND CLULCULATIONS FOR BRU UVb7Margin above Specified Cost Indigenous Farming Practices (IFP
Respondent no Observed Prevailing Observed Prevailing Observed Prevailing Total Total Cost Margin
(N) Maize Marketing Bean marketing pumpkin marketing Income for IFP/ha Above
Yield Price/kg yield price/50kg yield price/head IFP/ha (lFP,c) Specified
(Kg/ha) (Mp) (50kg/ha) (Bp) (head/ha) (Mp) (IFP6) Cost for
(M;) (B;) (Pi) IFP/ha(MaSc,)
I 1029 0 0 1300 1027 2732 2667 0 0 2938 1466 14723 3506 5 0 3777 1466 23114 2319 0 0 2590 1339 12515 1634 0 0 1905 1339 566
6 3472 0 0 3743 1339 24047 3033 0 3472 3304 2554 7508 1299 0 1033 1570 1339 2319 4831 0 1299 5102 1553 354910 4237 0 1831 4508 2765 1743II
1 270 16435 10 0 6706 2765 3941
12 4728 0 0 4999 1339 366013 2165 0 0 2436 1221 121514 5285 0 0 5556 1339 421715 4364 0 1285 4635 1486 314916 1282 0 2364 1553 1339 21417 1949 0 1282 2220 1339 88118 3241 3 1949 3512 2443 106919 3580 0 0 3851 1339 251220 1279 0 0 1550 1339 211
Margin above Specified Cost for Conventional Farming Practices (CFP)
BRU BRU Prevailing BRU Total cost of MarginPotential marketing Income/ha production above
Yield price/kg (CFPb) obtained Specified(Kg/ha) Mp from Cost for
(By) COMBUD/ha CFPlha(CFPf,,) (MaSCc)
Uvb7 5500 1 5665 4378 1287
41

DATA AND CLULCULATIONS FOR BRU Ub28
Margin above Specified Cost Indigenous Farming Practices (IFP
Respondent Observed Prevailing Observed Prevailing Observed Prevailing Total Total Cost Margin
no Maize Marketing Bean marketing pumpkin marketing Income for IFP/ha Above
(N) Yield Price/kg yield price/50kg yield price/head IFP/ha (lFPlC) Specified(Kg/ha) (Mp) (50kg/ha) (Bp) (head/ha) (Mp) (IFPw) Cost for
(Mi) (Bi) (Pi) IFP/ha(MaSC i)
1 1163 14 0 1434 1221 213
2 896 14 0 1167 1553 -3863 2834 2 1024 3105 1339 17664 2710 2 1055 2981 1339 16425 3289 10 0 3560 1339 22216 4821 4 800 5092 2443 26497 1001 4 0 1272 1339 -678 1848 4 813 2119 1339 7809 1136 6 0 1407 1339 6810 1089 11 828 1360 1339 21
1 270 111 1838 15 0 2109 1445 664
12 1122 5 0 1393 1339 5413 3342 5 833 3613 1339 227414 2114 14 0 2385 1445 94015 2033 15 636 2304 1339 96516 3230 4 0 3501 1339 216217 1949 4 704 2220 1432 78818 3125 8 0 3396 1339 205719 5550 6 0 5821 2443 337820 4836 6 0 5107 1887 3220
Margin above Specified Cost for Conventional Farming Practices (CFP)
BRU BRU Prevailing BRU Total cost of MarginPotential marketing Income/ha produCtion above
Yield price/kg (CFPtI) obtained Specified(Kg/ha) Mp from Cost for
(By) COMBUD/ha CFPlha(CFPt,l (MaSCc)
Ub28 4900 1 5047 4378 669
42
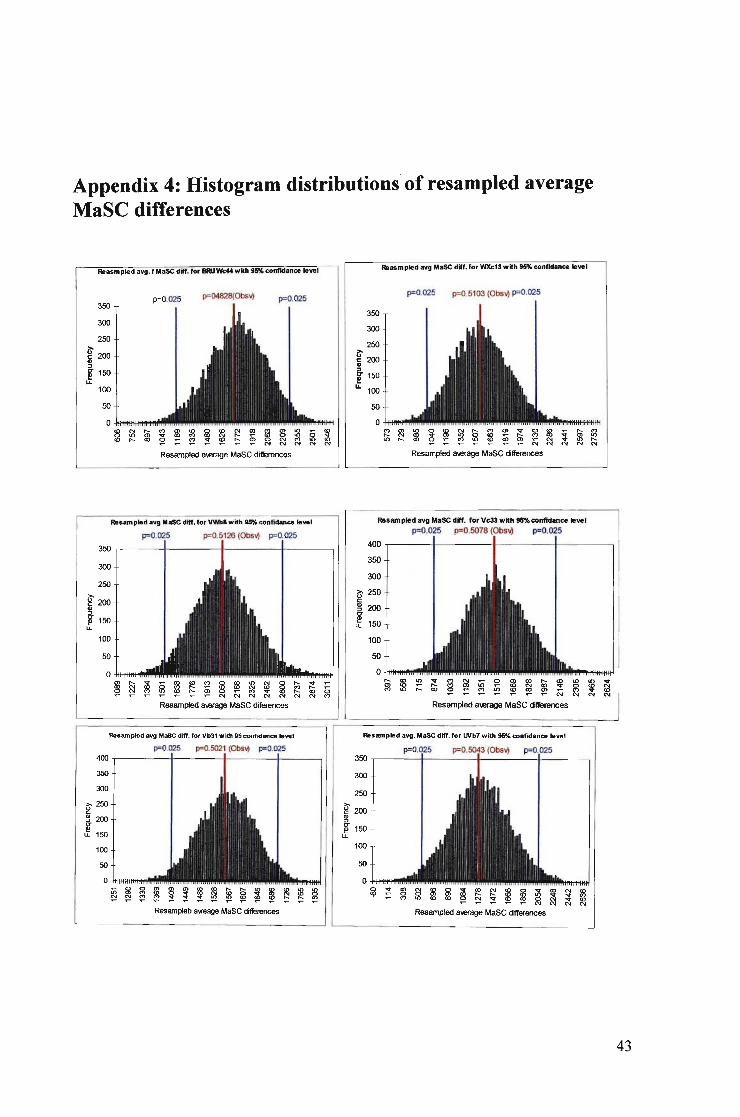
Appendix 4: Histogram distributions of resampled averageMaSC differences
ReasmpJed avg. f Ma5C diff. for ElRUWc44 with 95'% confklance levelRIIIasmpled avg MaSC diff. for Me13 with 95% confidance ~vel
1'=0.5103 (Obs\/) 1'=0.025
~ ~ 8 ~ ~ ~ ~ ~ g ~ ~ ~ ~m ~ ~ ~ ~ ~ ~ ~ N ~ ~ N NResampled aloerage MaSC dilrerences
50
o -litt!!tff'I!''''''''
p=0.025
350300
250,.,g 200.,::l
~ 150
IL 100
p=04828(Obs\/)1'=0.025350
300
250,.,g 200.,::l
~ 150IL
100
500 __1IM'II1I1IIl
~ ~ ~ ~ m~ ~ ~ ~ ~ ~ ~ ~ 0 ~~ ~ ~ ~ ~ ~ ~ ~ ~ ~ ~ ~Resampled aloerage MaSC dil!efences
Resampled avg MaSC diff. for VWb8with 99ik conftdance level
300
g 250
~200
I 150
100
50
0"-Cl<'l
400 r----t-----t-----t----~
350
RIlsampled avg MaSC dWf. for Vc33 w~h 95% conlldanee level
1'=0.025 p=0.5078 (Obs\/) 1'=0.025p=0.5126 (Obs\/) p=0.025p=0.025
50
350 -,-----+------11------+---~
300
250>-g200~~ 150IL
100
Resampled aloerage MaSC diferences Resampled aIoerage MaSC diflerences
Reaampled avg Masc diff. fOf Vb31 with 95conf"ldance level Resampled avg. MaSC cliff. for lNb7 with W.4 coRndance level
p=0.025p=0.025 p=0.5021 (Obs'" p=0.025400.-----+----11----~--~
p=0.5043 (Obs\/) p=0.025350,------1----1------1--------,
350
300
,., 250g~ 200c-l!!u.. 150
100
500 __.11I
~ ~ ~ ~ ~ ~ ~ ~ ~ ~ ~ ~ ~ ~ §Resamp/eb """'age MaSC di1lerences
300
250>-g 200~~150u..
100
43

Resampled avg.MaSC diff. for 1JJ28 with 95% confidance level
350
300
250
g 200dl::>
~ 150u.
100
50
p=0.025 p=0.4941 (Obs\/) p=0.025
Resampled awrage MaSC differences
44
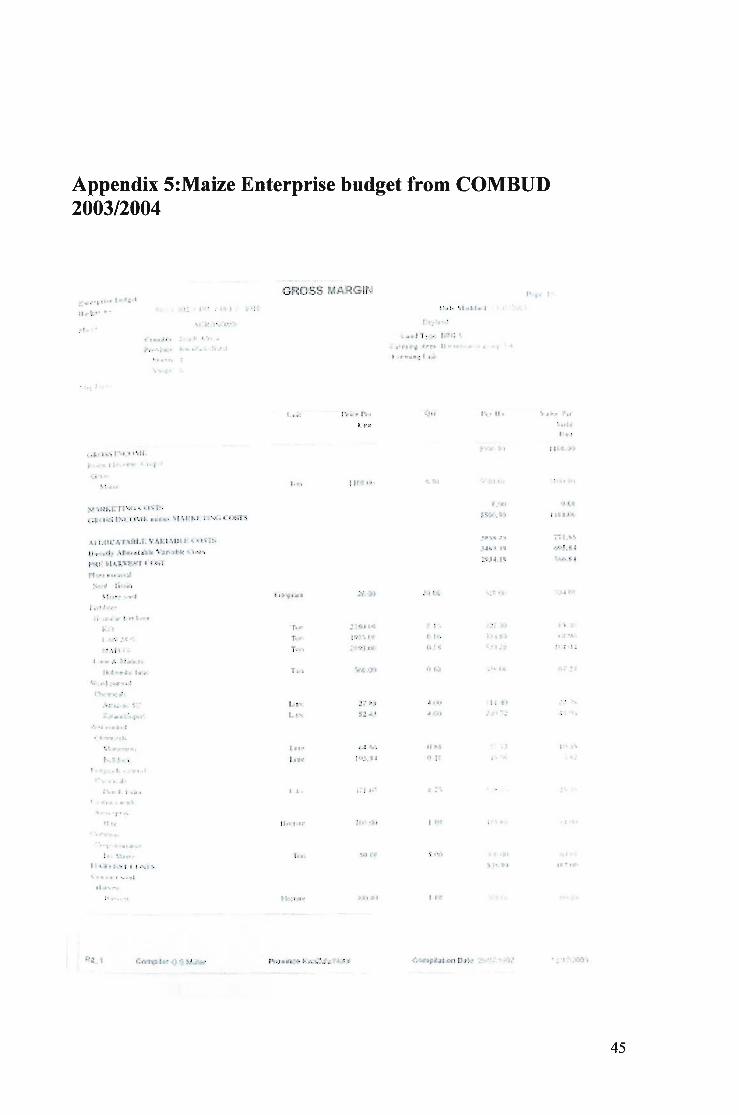
Appendix 5:Maize Enterprise budget from COMBUD2003/2004
GFWSS MARGlt·.!1';""'" .i,,. ! ~ ll,::; ,J
!1.1' ~..':' I ~, •
I..... :
i .; :~ ~.J
......... ,I 1 ;;;,r-: 1,':'1; I.
~ .. 'n"'p,jl·f" B"n" ',-. ,,~
I.·..''llilll l,:' I~
", 11.
I ••
••• a;. h ..·.I ....' ~ ."rfi.~ .,' t 1 ·r~· .. f
."I.: AU
~·...:j..I:'n··x:. •. I.t·;T:-.a::J:ft"".... I:·."U'-.1t. ""'--'1" ~I tll:t· J J -','.1 L":!>... :s
.\1 L~ll:", pi,ilJ.f. 'i ..\~1 !llf: •. I !-;'"T:-,
n ........1I; l~J'.E..I......~~ ·f.·:sr·a;J:~ ~·Ii"J ..
I ,. 5i ..;~'i.l"..I:o·" I {,,:.;T
""'-.1"1"11 ,41
:':"'~" :i· Ifl
I. p0;-",_I
lll·.,,. .. ·
~:. I
I '. '.' ~,)"J,'.[1
P:·:;'·I';
~~ol':-l 11'-
•... 1
r ;·tJf.1
::~.t.:il\~)
.. ,1\.... ;
;.J!o' III
';,,'\
e I to ••n
" '\
(I",I hJ.l...-s.
";";L"-l"
-:.9.!."'1
,,t • ~',
11: I:
, .. ,t 'I'litl i" .':
l:' o-.l.';of'li.J
1"'-..-"'10:,/'
,'. Of I(".ll
t· • !.•..
~ ",.
I' "j.
l).., 1 t·... ,
.........I l"ol. h" I 'I.··.i.:-.
t·I· •. ·l
T..
I toll"
I L
l"'~'1
.i. i ..~
Ill' -:-;1
".-. (~
J ,l:iJ)
.. (.a,I
flfoi
(1 to-
, ..
f r.t
.:.,..<
I: -,-I
..
•.•. 'l
i"1 to,
45

Enterprise hmlJ,;l'(
Budget no 001 , 002 I 001 I 003 I 0010
GROSS MARGIN
·~--~~~~--~~Prict' I'n -----,Q""c-.-~
Unit
St:HU~ T
l'n)\incc
I
I",'"I1- ~--~--.-._.--
i1. ._
AGRONO~f'{
Soulh :\frica
KW~IZU!Il/NJIJI
D'1 lJnd
Land T}'p~ BRG 3
Farming Area Bio·resource grnup ";.-l
Farming Unit
\ ,,1\11: !'er
Yidd
Llli(
~·brkcljng CO~1
Transport
Transport TOil
I\l.-\RGIN ADO\"E DIRECTLY ALLDCATAllLE VARIABLE COSt'S
Indir~ctlJ Allocalable Variabli." Costs
PRE l·fARV~TCOST
En~rgy
Repairs and h1:lint"n;:Hlce
HARVEST COSTS
TOTAL PRE IIARVEsr COSTS
TOTAL HARVE.'IT COSTS
GROSS MARGIN ABOVE TOTAL AlLOCATABLE VARIABLE COSTS
Interesl on Working Capital (1 ....000%)
Regular Labour Costs
MARGIN ABOVE SPECIFIED COSTS
·17.00 5.0n 2'\:; OV
:?O.'lO.SI
Jg~.l.05
38':1.05
IB8.JJ
200.72
0.00
3323.25
53:-.00
16~l.i5
274JO
2.ti .I~
111l).71\
·l7.on.t06.]u
i7.!l1
i7.RI
66..L65
107.00
32R.35
':;-1.97
·.n ..:n
Compllcr G S Mu!ler Province KW2Zulu!Nalal Compilation D.1te 2"5Q7.1DS?
46
COMPONENTB

COMPONENTB
Performance of indigenous farming practices: A case study of maize land use types
in Umzimkulu area, Eastern Cape
Abstract
A case study was conducted in 7 Bio-Resource Units in Umzimkulu area in Eastern Capeto examine the profitability of indigenous farming practices. This was achieved bycomparing Margin above Specified Cost of indigenous farming practices withconventional farming practices. The farming practices were examined in the followingcategories: land preparation, planting, soil care and fertility, cropping systems, seedselection andplantpest measure. In all categories mentioned above there was significantrelationship between farming practices and maize yield (P<0.005) except for method ofplanting and plant pest control. The practices that have shown highest yield are animaltraction (land preparation), use of fertilizer (soil care and fertility), intracropping(cropping practices) miXing indigenous and conventional (plant pest measure). In allBio-Resource Units the observed average difference in margin above specified cost wasgreater that Rl,285,00 in favour of indigenous farming practices. All observed casesshowed p-values well above the set 0.05 level ofsignificance indicating that none weresignificantly different from the population mean.

TABLE OF CONTENTS OF COMPONENT B
Abstract I
TABLE OF CONTENTS OF COMPONENT B ii
LIST OF TABLES 111
LIST OF FIGURES ,. IV
1. INTRODUCTION 1
1.1 Problem statement 11.2 Objectives 21.3 Research hypothesis 21.4 Conceptual framework 3
1.4.1 Data requirements and availability 31.4.2 Profitability comparison ofindigenous farming practices against conventionalfaming practices 7
2 DATA COLLECTION AND ANALYSIS 10
2.1 Study area and data sampling design 102.2 Collection of indigenous farming practices data 122.3 Collection of conventional farming practices data 132.4 Data analysis 13
3 RESULTS 15
3.1 Data exploration and descriptive statistics 153.1.1 Indigenousfarmingyield data 15
2.2 Relationship between individual indigenous farming practice and maize yield 163.2.1 Landpreparation 163.2.2 Soil care andfertility 173.2.3 Method ofplanting 183.2.4 Cropping system 193.3.5 Plant pest measure 203.2.6 Seed selection 213.2.7 Weeding method 223.2.8 Bio-resource unit 23
3.3 Profitability comparison of indigenous farming practices and conventional farmingpractices 243.4 Discussion 26
5 CONCLUSIONS AND RECOMMENDATIONS 27
5.1 Conclusion 275 1 1 L d' fi' . d' TT' k I.. n 1genous armmgpractices use m vmZlm U U 275.1.2 Profitability 28
5.2 Recommendation 28References 29
ii

Appendix 1: Questionnaire .........................•.................................................................. 32
Appendix 2: Codebook ................................................................................................•.. 34
Appendix3 : Margin above Specified Cost calculation 36
Appendix 4: Histogram distributions of resampled average MaSC differences 43
Appendix 5:Maize Enterprise budget from COMBUD 2003/2004 45
LIST OF TABLES
Table I: Symbols and codes of the Bio-Resource Units 5
Table 2 Ecotope definition coding as described in Bio-Resource Units 9.
Table 3 Selected villages for farmer interviews by administrative ward and BRU 10
Table 4 Summary ofprofitability analysis by BRU +-~
Table 5: Summary for Maize Yield Analysis +-9.
iii

LIST OF FIGURES
Figure I Flowchart showing a procedure for analysing profitability....................•..•.........................•...7
Figure 2: Map of Urnzimkulu Municipality showing randomly selected administrative areas .11
Figure. 3 Histogram for actual yield J.~
Figure. 4 Histogram for transformed yield .15
Figure. 5 Normal probability plot for actual maize yield 16
Figure. 6 Transformed probability plot maize yield .16
Figure 7: Relationship between transformed maize yields and methods ofland preparation .16
Figure 8: Relationship between transformed maize yield and methods offertilizing, .17
Figure 9: Relationship between transformed maize yield and planting method .18
Figure 10: Relationship between transformed maize yield and cropping systems .19
Figure 11: Relationship between transformed maize yield and measure for pest control.. 20
Figure 12: relation ship between transformed maize yield and time for planting 21
Figure 13: Relationship between transformed maize yield and methods for seed selection 22
Figure 14: Relationship between transformed maize yield and weeding method 22
Figure 15: Relationship between transformed maize yield and weeding period .22
Figure 16: Relationship between transformed maize yield and Bio-Resource Unit ~J
IV