performance of pefc under different gas-mixing conditions
TRANSCRIPT

Performance of PEFC Under Different Gas-Mixing Conditions
I01A-1080
240th ECS Meeting
Yulei MA, Miho KAGEYAMA, and Motoaki KAWASEDepartment of Chemical Engineering, Kyoto University,
Kyoto, Japan
October 10-14, 2021Orlando (digital meeting)

1/161. Introduction – background
Polymer Electrolyte Fuel Cell: PEFC
Anode 2H2 → 4H+ + 4e-
Cathode O2 + 4H+ + 4e- → 2H2O
Total O2 + 2H2 → 2H2O
GDL
MEA
PEM
H+
H2, H2O
cathodeanodegas channel
GDLgas channel
e−
H2 O2
e−e−
H2O
H2O
O2 or air, H2O
GDL
MEA
PEM
H+
H2, H2O
cathodeanodegas channel
GDLgas channel
e−
H2 O2
e−e−
H2O
H2O
O2 or air, H2OH2, H2O O2 or air, H2Oe-
GDL GDL gas channel
gas channel
PEM: Proton Exchange MembraneMEA: Membrane Electrode AssemblyGDL: Gas Diffusion Layer
Advantages
Issues1. High cost (Pt)2. Durability3. Overpotential 4. Water management
(Flooding & dehydration)
1. High efficiency2. Low running temperature
(20-100 oC)3. Continually Start-up & Shut-down4. High power density
ENE-FARM [2]
FCV [1]
[1] Toyota, http://toyota.jp/sp/fcv/[2] Tokyo Gas, http://www.zaikei.co.jp/article/20130117/122411.html
For PEFCs’ grand-scale commercialization, their performance should be further improved.

2/161. Introduction – issues
[3] M. Kawase et al., AIChE J., 63, 249–256 (2017)
Effect of oxygen partial pressure and relative humidity (RH) on oxygen reduction reaction (ORR) [3]
⚫ The performance of PEFC is the results of the distribution of local current density and materials concentration, especially oxygen and water.
GDL Gas channel
Image of the cross flow in the GDL
rib
catalyst layer
⚫ The reactant gas flows across the porous GDL to the neighbor channel, so that the component distribution is more complicated.
A computationally inexpensive way to model and understand the effects of the gas channels on the cell performance is required.
The cell performance is strongly affected by the gas channels.
However, many models which contains the effects of gas channels are too computationally expensive to predict the cell performance immediately and to be applied into the process control system.

3/161. Introduction – objective
To evaluate the effect of the gas macro-mixing on the cell performance ,
the concept of the residence time distribution (RTD) was applied,
in the perspective of chemical reaction engineering.
Tracer input(by impulse or step)
Tracer response
Volumetric flow rate
v
Volumetric flow rate
v
Gas channels,operating conditions
macro-mixing
RTDCell
performance
Application of the concept of RTD on PEFC By assuming the non-flooding condition
E(t)
Time t
Ot
dt
Total area = 1
Fraction of elements whose residence time is between t – (t + dt)
Res
iden
ce t
ime
dis
trib
uti
on
fu
nct
ion
RTD can be calculated by measuring the response of the tracer at the outlet of the vessel.• Since the cross-flow exists in the GDL, fluid elements with different residence time
mixes with each other, which effects the RTD.• The performance of the reactor can be predicted according to the RTD

4/162. Numerical Calculation – governing equations
∇ ∙ (𝜌𝑼) = 0
∇ ∙ 𝜌𝑼𝑼 − ∇ ∙ 𝜇∇𝑼 = −∇𝑃 + 𝑺𝒎
𝑺𝒎 = −𝜇
𝐾𝑼
Mass conservation
Momentum conservation
Momentum source term
GDL: regarded as a uniform porous layer, which obeys the Darcy’s law.
Solved by finite volume method (FVM) by using OpenFOAM 8.
Assumptions1. steady-state, 2. no liquid water flooding,3. no reaction,4. isothermal and uniform
temperature distribution,5. uncompressible fluid.
In gas channel, 𝑺𝒎 = 0In GDL, 𝜇/𝐾 = constant.
gas channeloutlet
gas channelinlet
Parallel
gas channeloutlet
gas channelinletGDL
Serpentine
Number of meshes: 383 000 373 000
𝜌: density [kg/m3]
𝜇: viscosity [Pa . s]
P: total pressure [Pa]
U: velocity vector [m/s]
K: permeability [m2]
21 mm
rib
1
1 1
[mm]
21 mm
gas channel
GDL

5/162. Numerical Calculation – velocity & pressure
[m/s
][P
a]
Steady isothermal uncompressible fluid (without reaction)
Conditions
Temperature 80 oC
Pressure 101325 Pa
O2 flow rate 100 mL/min
(20 oC, 1 atm)
H2O(g) flow rate 32.77 mL/min
(20 oC, 1 atm)
(the gas is humidified in a 65 oC
bubbler)
Gas channel GDL
0 1 1.19 [mm]
Vel
oci
ty f
ield
Pre
ssu
re f
ield
Serpentine channelParallel channel

6/162. Numerical Calculation – velocity & pressure
[m/s
][P
a]
Steady isothermal uncompressible fluid (without reaction)
Parallel channel Serpentine channel
Vel
oci
ty f
ield
Pre
ssu
re f
ield
Gas channel GDL
0 1 1.19 [mm]
The cross-flow of the serpentine channels is much more remarkable than that of parallel channel,
since the pressure gradient between the neighbor channels is steep in case of the serpentine.

7/162. Numerical Calculation – RTD
𝜕𝜑
𝜕𝑡+ ∇ ∙ 𝜑𝑼 = 0
Transport equation of the tracer
GDL
gas channeloutlet
gas channeloutlet
gas channelinlet
gas channelinlet
𝜑: physic property of the tracer, e.g. temperature, concentration, electrical conductivity.
Solved by finite volume method (FVM) by OpenFOAM 8
time [s]
trac
er c
on
cen
trat
ion
[m
ol/
L]
Step input of the tracer
Assumptions1. steady-state, 2. no liquid water flooding,3. no reaction,
Tracer input
Tracer response
time [s]
trac
er c
on
cen
trat
ion
[m
ol/
L]
Response of the tracer
4. isothermal and uniform temperature distribution,
5. uncompressible fluid,6. no diffusion of the tracer.
Parallel channel Serpentine channel
Convection of the tracer inside the gas channels and GDLs
The cross flow in the GDL in case of the serpentine is much more obvious than that in case of the parallel.

8/16
0
1
2
3
4
5
0 1 2 3 4
E(θ
)[-
]
Dimiensionless residence time θ [-]
3. Results – RTD
0
5
10
15
20
25
30
35
40
0 0.1 0.2 0.3 0.4 0.5
E(t)
[s-1
]
Residence time t [s]
0
0.2
0.4
0.6
0.8
1
0 0.1 0.2 0.3 0.4 0.5
F(t)
[-]
Residence time t [s]
Parallelҧ𝒕 = 𝟎. 𝟏𝟎𝟕 𝐬
𝝈𝟐 = 𝟎. 𝟎𝟑𝟏𝟏 𝐬𝟐
𝒔𝟑 = 𝟎. 𝟓𝟎𝟐𝟏 𝐬𝟑
Serpentineҧ𝒕 = 𝟎. 𝟏𝟑𝟔 𝐬
𝝈𝟐 = 𝟎. 𝟎𝟎𝟕𝟗 𝐬𝟐
𝒔𝟑 = 𝟎. 𝟏𝟏𝟓𝟖 𝐬𝟑
1st moment: average residence time
ҧ𝑡 = න0
∞
𝑡𝐸 𝑡 𝑑𝑡
2nd moment: variation 𝜎2 = න0
∞
𝑡 − ҧ𝑡 2𝐸 𝑡 𝑑𝑡
3rd moment: skewness 𝑠3 =1
𝜎3/2න0
∞
𝑡 − ҧ𝑡 3𝐸 𝑡 𝑑𝑡
Characterization parameters of the RTD
𝐹 𝑡 = Τത𝜑𝐿(𝑡) ത𝜑0(0)𝐸 𝑡 = 𝑑𝐹 𝑡 /𝑑𝑡
Parallel
Serpentine
𝐸 𝜃 𝑑𝜃 = 𝐸 𝑡 𝑑𝑡
𝜃 = 𝑡/ ҧ𝑡
Cumulative RTD function 𝐹(𝑡) RTD function E(𝑡)
Dimensionless RTD function E(𝜽)
ത𝜑𝐿: integrated average value at outlet face [m-2] ത𝜑0: integrated average value at inlet face [m-2]
Parallel
Serpentine
The long residence time of the gas element indicates that the gas element in the cell has high possibility to be reacted.

9/163. Results – reactor models
CSTR
PFR
−𝑟SO = 𝑘gc𝑝O 𝑝O =𝑃𝑦O0 1 − 𝑥O1 + 𝑦O0𝑥O
𝑎𝑤 =𝑃
𝑝Ssat
𝑦S0 + 2𝑦O0𝑥O1 + 𝑦O0𝑥O
Reaction kinetics(Oxygen reaction rate per active area)
Reactor design equations
Material balance
kgc: partial-pressure-based apparent kinetics constant [mol/(Pa.m2.s)]
-rSO: oxygen consumption rate per active area [mol/(m2s)]
CO0: oxygen concentration in the inlet gas [mol/m3]
yS0: water vapor molar fraction of the inlet gas [-]
yO0: oxygen molar fraction of the inlet gas [-]
aw: activity of water vapor [-]
pO: local oxygen partial pressure [Pa]
pSsat: saturated water vapor pressure [Pa]
A: active area from the gas inlet [m2]
v0: inlet gas volumetric flow rate [m3/s]
xO: oxygen conversion [-]
P: total pressure [Pa]
Active area/volumetric flow rate: equivalent to the space time
The cell performance can be predicted as the 𝒌𝒈𝒄 and the design equations are known.
PFR: plug flow reactorNo axial mixing in the flow direction. (ideal reactor)The reaction rate is uniform in the radial direction, but varies continuously in the axial direction.
CSTR: continuously stirred tank reactorThe gas completely mixes in the reactor. (ideal reactor)The reaction rate is uniform in the reactor.
PEFCThe macro mixing of the gas can be characterized by the combination of the PFR and the CSTR. (non-ideal reactor)
PEFCThe design equation is determined by the gas channel
𝑑(𝐴/𝑣0 ) = 𝐶O0𝑑𝑥O/(−𝑟SO)
Τ𝐴 𝑣0 = 𝐶O0𝑥O/(−𝑟SO)
−𝑟SO𝑑𝐴 = 𝐶O0𝑣0𝑑𝑥O
−𝑟SO𝐴 = 𝐶O0𝑣0𝑥O
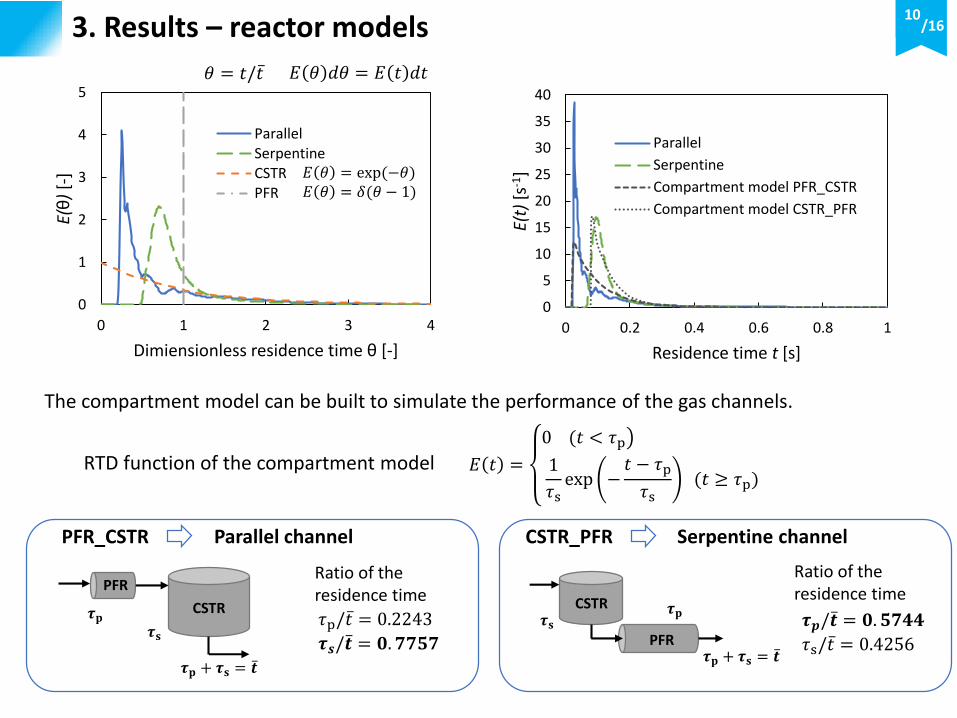
10/163. Results – reactor models
PFR_CSTR CSTR_PFR
𝜏p/ ҧ𝑡 = 0.2243
𝝉𝒔/ ҧ𝒕 = 𝟎. 𝟕𝟕𝟓𝟕
𝝉𝒑/ ҧ𝒕 = 𝟎. 𝟓𝟕𝟒𝟒
𝜏s/ ҧ𝑡 = 0.4256
𝐸 𝑡 =
൯0 (𝑡 < 𝜏p
1
𝜏sexp −
𝑡 − 𝜏p
𝜏s(𝑡 ≥ 𝜏p)
RTD function of the compartment model
Parallel channel Serpentine channel
The compartment model can be built to simulate the performance of the gas channels.
Ratio of the residence time
Ratio of the residence time
0
5
10
15
20
25
30
35
40
0 0.2 0.4 0.6 0.8 1
E(t)
[s-1
]
Residence time t [s]
Parallel
Serpentine
Compartment model PFR_CSTR
Compartment model CSTR_PFR
0
1
2
3
4
5
0 1 2 3 4
E(θ
)[-
]
Dimiensionless residence time θ [-]
ParallelSerpentineCSTRPFR
𝐸 𝜃 = exp(−𝜃)𝐸 𝜃 = 𝛿(𝜃 − 1)
PFR
CSTR𝝉𝐩𝝉𝐬
𝝉𝐩 + 𝝉𝐬 = ҧ𝒕
PFR
CSTR𝝉𝐬
𝝉𝐩
𝝉𝐩 + 𝝉𝐬 = ҧ𝒕
𝐸 𝜃 𝑑𝜃 = 𝐸 𝑡 𝑑𝑡𝜃 = 𝑡/ ҧ𝑡

11/164. Discussion – experimental
By changing the active area/volumetric flow rate ratio, the cell performance with different “space time” can be measured.
2 cm×2 cm
2 cm×1.5 cm
2 cm×1 cmVolumetric flow rateControlled by the mass flow controller.O2 flow rate: 30~100 mL/min (20 oC, 1 atm)H2 flow rate is 2 times of the O2 flow rate
The reactant gas was humidified by the bubbler.(Humidified temperature: 65 oC, Cell temperature: 80 oC, Total pressure at the cell outlet: 1 atm)
PI
To AnodeH2
MFC1To Cathode
O2
PEFC
PI
MFC2
Thermostatic Chamber
Bubbler
electrochemical measurement system
100 oC
100 oC
100 oC80 oC
100 oCBubbler
PI
PI
TrapH2O
Active areaControlled by the opening area of the gasket. The GDL has the same area as the active area.
Opening size:
GDL
Gasket
MEA
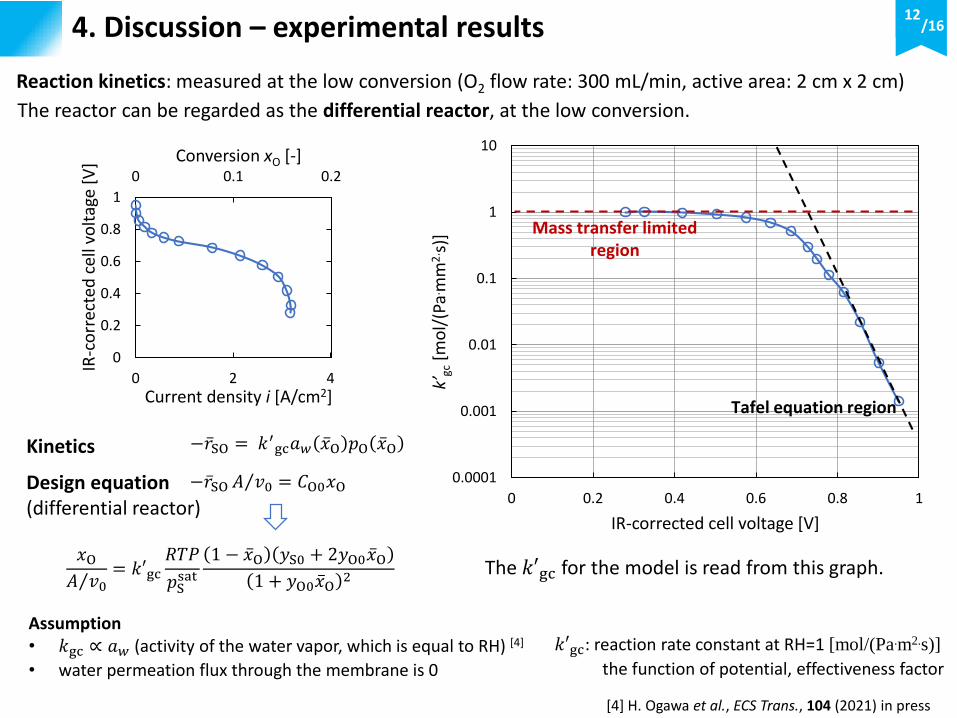
12/164. Discussion – experimental results
0.0001
0.001
0.01
0.1
1
10
0 0.2 0.4 0.6 0.8 1
k’gc
[mo
l/(P
a. mm
2. s
)]
IR-corrected cell voltage [V]
Tafel equation region
Mass transfer limitedregion
𝑥OΤ𝐴 𝑣0
= 𝑘′gc𝑅𝑇𝑃
𝑝Ssat
1 − ҧ𝑥O 𝑦S0 + 2𝑦O0 ҧ𝑥O1 + 𝑦O0 ҧ𝑥O
2
𝑘′gc: reaction rate constant at RH=1 [mol/(Pa.m2.s)]
the function of potential, effectiveness factor
0 0.1 0.2
0
0.2
0.4
0.6
0.8
1
0
0.2
0.4
0.6
0.8
1
0 2 4
Conversion xO [-]
IR-c
orr
ecte
d c
ell v
olt
age
[V]
Current density i [A/cm2]
Reaction kinetics: measured at the low conversion (O2 flow rate: 300 mL/min, active area: 2 cm x 2 cm)
The reactor can be regarded as the differential reactor, at the low conversion.
− ҧ𝑟SO Τ𝐴 𝑣0 = 𝐶O0𝑥O
− ҧ𝑟SO = 𝑘′gc𝑎𝑤 ҧ𝑥O 𝑝O ҧ𝑥OKinetics
Design equation(differential reactor)
Assumption• 𝑘gc ∝ 𝑎𝑤 (activity of the water vapor, which is equal to RH) [4]
• water permeation flux through the membrane is 0
[4] H. Ogawa et al., ECS Trans., 104 (2021) in press
The 𝑘′gc for the model is read from this graph.

13/16
0
20
40
60
80
100
0 50 100 150 200
p[k
Pa]
𝜏 [s/m]
4. Discussion – model evaluation
−𝑟SO 𝑥O 𝑑𝜏 = 𝐶O0𝑑𝑥O
−𝑟SO 𝑥O2 𝜏s = 𝐶O0(𝑥O2 − 𝑥O1)
KineticsDesign equation
−𝑟SO 𝑥O = 𝑘′gc𝑎𝑤 𝑥O 𝑝O 𝑥O
I. C. 𝑥O = 0@ 𝜏 = 0
(0 ≤ 𝜏 ≤ 𝜏p)
(𝜏p < 𝜏 ≤ ҧ𝑡)
𝜏p/ ҧ𝑡 = 0.2243ҧ𝑡 = 𝐴/𝑣0
Compartment model PFR_CSTR (parallel)
𝒙𝐎𝟎 = 𝟎 𝒙𝐎𝟏
𝒙𝐎𝟐
0
0.1
0.2
0.3
0.4
0.5
0.6
0.7
0.8
0 100 200 300 400 500 600
x O[-
]
A/v0 [s/m]
IR-corrected cell voltage = 0.50 V
0.60 V
0.70 V
0.75 V
Compartment modelPFR_CSTR (parallel)
A = 2 cm x 2 cm
A = 2 cm x 1.5 cm
A = 2 cm x 1 cm
Experimental results measured with parallel channel
Example: IR-corrected cell voltage = 0.60 V, Τ𝐴 𝑣0 = 200 s/m
O2 partial pressureH2O partial pressure
𝑥O1 = 0.059𝜏 = 𝜏p
0
0.5
1
1.5
2
2.5
3
0
1
2
3
4
0 50 100 150 200
v[m
L/s]
F[m
mo
l/m
in]
𝜏 [s/m]
O2 molar flow rate
H2O molar flow rate
Total volumetric flow rate
PFR
CSTR𝝉𝐩𝝉𝐬
𝝉𝐩 + 𝝉𝐬 = ҧ𝒕
(PFR)
(CSTR)
Inlet Outlet Inlet Outlet

14/164. Discussion – effects of gas channels
CSTR_PFR (serpentine)
The calculation results indicate that:• The parallel channels (close to CSTR) have
better performance at low conversion• The serpentine channels (close to PFR) have
better performance at high conversion
0
0.1
0.2
0.3
0.4
0.5
0.6
0.7
0 100 200 300 400 500 600
x O[-
]
A/v0 [s/m]
IR-corrected cell voltage = 0.60 V Compartment model
PFR_CSTR (parallel)
Compartment modelCSTR_PFR (serpentine)
CSTR
PFR PFR
CSTR
IR-corrected cell voltage = 0.75 V
Due the self-catalytic reaction, CSTR>PFR at low conversion, PFR>CSTR at high conversion,gas macro-mixing is beneficial at low conversion.
0
0.2
0.4
0.6
0.8
0 100 200 300 400 500
x O[-
]A/v0 [s/m]
Compartment modelPFR_CSTR (parallel)
Compartment modelCSTR_PFR (serpentine)
High conversion( Τ𝐴 𝑣0 = 500 s/m)serpentine > parallel
0
0.05
0.1
0.15
0.2
0 30 60 90 120
x O[-
]
A/v0 [s/m]
Compartment modelCSTR_PFR (serpentine)
Compartment modelPFR_CSTR (parallel)
Low conversion( Τ𝐴 𝑣0 = 120 s/m) parallel > serpentine
IR-corrected cell voltage = 0.60 V
0
0.05
0.1
0.15
0.2
0.25
0.3
0
20
40
60
80
100
120
0 0.2 0.4 0.6 0.8 1
-rSO
[mo
l/(m
2s)
]
p[k
Pa]
xO [-]
O2 partial pressure
H2O partial pressure
Reaction rate
−𝑟SO 𝑥O = 𝑘′gc𝑎𝑤 𝑥O 𝑝O 𝑥O
Inlet Outlet
Inlet Outlet

15/16
0
0.1
0.2
0.3
0.4
0.5
0.6
0.7
0.8
0.9
1
0 1 2 3
IR-c
orr
ecte
d c
ell v
olt
age
[V]
i [A/cm2]
v0 = 2.69 mL/sv0 = 1.35 mL/sv0 = 1.04 mL/sv0 = 0.81 mL/s
A = 2 cm x 2 cm
4. Discussion – model improvement
The polarization curve can also be predicted by compartment model (1 variable: 𝜏p/ ҧ𝑡).
0
0.1
0.2
0.3
0.4
0.5
0.6
0.7
0.8
0.9
1
0 1 2 3
IR-c
orr
ecte
d c
ell v
olt
age
[V]
i [A/cm2]
2 cm x 2 cm2 cm x 1.5 cm2 cm x 1 cm
v0 = 2.69 mL/s
Calculated resultslineExperimental results(parallel)
The model fits well with the experimental results (parallel channels) at low current density (low conversion).
Possible reason for the deviation: RTD calculation was without the reaction, kinetics determination was not accurate at high conversion, the compartment model has the limitation.
More accurate model, which can explain the phenomenon simply, is going to be discussed.
Fixed flow rate Fixed active area
𝜏𝑝/ ҧ𝑡 = 0.225𝜏𝑝/ ҧ𝑡 = 0.291
𝜏𝑝/ ҧ𝑡 = 0.323𝜏𝑝/ ҧ𝑡 = 0.359

16/165. Conclusions
PFR_CSTR
CSTR_PFR
𝜏p/ ҧ𝑡 = 0.2243
𝝉𝒔/ ҧ𝒕 = 𝟎. 𝟕𝟕𝟓𝟕
𝝉𝒑/ ҧ𝒕 = 𝟎. 𝟓𝟕𝟒𝟒
𝜏s/ ҧ𝑡 = 0.4256
Parallel channel
Serpentine channel
Ratio of the residence time
Ratio of the residence time
• The RTDs of parallel and serpentine gaschannels were simulated by numerical method.
• By changing the active area/volumetric flowrate ratio, the cell performance with different“space time” was measured experimentally.
• Parallel channels, which are close to the CSTR,have better performance at low oxygenconversion, where the gas macro-mixing isbeneficial, due to the self-catalytic behavior.
• The compartment model fits the experimentaldata well, however more accurate model isrequired to understand the phenomenon,which is going to be discussed.
The method in the perspective of chemical engineering was applied to evaluate the PEFC.
The method mentioned in this study can be applied to other shapes of gas channels to understand the gas macro-mixing, and may be helpful for the cell design.
Better performance at low conversion.
Better performance at high conversion.
PFR
CSTR𝝉𝐩𝝉𝐬
𝝉𝐩 + 𝝉𝐬 = ҧ𝒕
PFR
CSTR𝝉𝐬
𝝉𝐩
𝝉𝐩 + 𝝉𝐬 = ҧ𝒕
AcknowledgementThis work was supported by the FC Platform Program: Development of design-for-purpose numericalsimulators for attaining long life and high performance project (FY 2020–FY 2022) conducted by theNew Energy and Industrial Technology Development Organization (NEDO), Japan.

Performance of PEFC Under Different Gas-Mixing Conditions
I01A-1080
240th ECS Meeting
Yulei MA, Miho KAGEYAMA, and Motoaki KAWASEDepartment of Chemical Engineering, Kyoto University,
Kyoto, Japan
October 10-14, 2021Orlando (digital meeting)