performance of esg funds in emerging asian …
TRANSCRIPT

Corporate Governance Insight, Volume-3, Issue-1, eISSN: 2582-0834
GLOBAL RESEARCH FOUNDATION FOR CORPORATE GOVERNANCE 39
PERFORMANCE OF ESG FUNDS IN EMERGING ASIAN COUNTRIES: A
COMPARATIVE ANALYSIS
Sakshi Mittal1 and Niti Bhasin2
Abstract
The study has primarily been undertaken to examine the performance of ethical funds in
comparison to the mutual funds that have been serving the investors with the profit motive. It
focuses on evaluating the select emerging Asian countries on the basis of their performance
which is measured by certain parameters.
The primary purpose of this study is to provide a detailed analysis of the increasingly evolving
socially responsible asset management market and go beyond aggregate financial comparisons
in developed countries between SRI and traditional mutual funds. To do so, we have studied
137 socially conscious mutual funds and 137 traditional funds which are closely matched based
on age, objective and size. The key feature of this paper involves an empirical analysis of
mutual fund performance measured by Sharpe ratio, Treynor ratio and Jensen alpha. For the
purpose of this study the mutual funds are distinguished on the basis of their investment
objective and were named as ESG funds and conventional mutual funds.
A comparison was drawn between the ESG funds and matched conventional mutual funds of
the five emerging Asian countries namely, China, India, Thailand, South Korea, and Taiwan
using five parameters. The Sharpe ratio, Jensen's Alpha, excess return of funds over the index,
Treynor ratio and last 5 years Returns. The results shows that for China, the last 5 years returns
are significantly higher for the ESG funds. The other four parameters are not significantly
different for the matched conventional funds. In India, ESG funds have performed better in
terms of generating returns versus the index whereas for the other four parameters the
difference in ESG and matched conventional is found to be insignificant. In South Korean
markets, the matched conventional funds have performed significantly better in terms of Sharpe
ratio and rest of the parameters are insignificantly different. In Thailand also, the matched
1 Assistant Professor, Department of Commerce, Bharati College, University of Delhi, Email:
2 Professor, Department of Commerce, Delhi School of Economics, University of Delhi, Email:
Corporate Governance Insight, Volume-3, Issue-1, eISSN: 2582-0834
GLOBAL RESEARCH FOUNDATION FOR CORPORATE GOVERNANCE 40
conventional funds have outperformed in terms of Sharpe ratio whereas, the other parameters
are found to be insignificantly different. In Taiwan there is no significant difference between
the performance of ESG funds and the matched funds. The selection of ESG and SRI
sustainability stocks by the investors will provide them with the additional opportunity to
diversify their portfolio without sacrificing on the financial grounds. Moreover, these options
also provide them a set of safer haven during economic downturn. It is demonstrated by the
analysis that the ESG funds are less sensitive to the risk factors, so in times of crisis, the ESG
funds are expected to sail through the deep waters.
Keywords: SRI, ESG, Ethical funds, Matched pair, Emerging Asian countries, sustainability
JEL Classification: D14, G11, G40, O16

Corporate Governance Insight, Volume-3, Issue-1, eISSN: 2582-0834
GLOBAL RESEARCH FOUNDATION FOR CORPORATE GOVERNANCE 41
1. Introduction
Environment, Social and Governance funds (ESG funds) are vehicles that pool and
subsequently channelize the wealth of their clients into funds that are classified as socially
responsible. Haigh and Hazelton (2004) provides “it is the practice of directing investment
funds in a way that investors’ financial objectives are combined with their commitment to
social concern. This concern can be justice, economic development, peace and/or a healthy
environment.” The aim of mutual funds dedicated to socially responsible investment is to
provide the investor with better risk-adjusted returns by engaging in companies with corporate
social responsibility excellence. Especially after witnessing the pandemic which ceases the life
in different context from economy to human mobility, socially responsible behavior while
investing is least we can do to ensure survival in future, before jeopardizing the nature
completely.
During the last couple of decades, this new form of investing strategy has emerged. This new
kind of investing focus on integrating non-financial criterions into the investment process;
these criterions are usually related to ethical, “Environmental, social and governance” matters.
It has been shown that funds that incorporate these kinds of criterions have increased
tremendously and the inflows into these funds have also grown a lot (Sandberg, 2009). The
reason for this according to Dijk de Groot and Nijhof (2015) is that investors have shown an
increased interest in what impact their investments have on the environment and therefore a
demand for funds that fulfill investors’ preferences has emerged. Although socially responsible
investments are a relatively recent sector, interest in this area is rapidly growing. Nonetheless,
it is popular to use many terms interchangeably due to the shortage of qualified practitioners in
this field as well as the weak regulatory and legal structure. In addition, investing where not
just profit maximization is sought reflects investments that are also in line with the personal
values of the investor. The foremost promoter of socially responsible investment is presently
the PRI (Principles for Responsible Investment) alliance group of the United Nations. This
investor effort sets the global outlook for prudent investment and most scholars follow the
terminology of PRI. PRI defines Responsible Investing as “an approach to investing that aims
to incorporate ESG factors into investment decisions, to better manage risk and generate
sustainable, long term returns.”

Corporate Governance Insight, Volume-3, Issue-1, eISSN: 2582-0834
GLOBAL RESEARCH FOUNDATION FOR CORPORATE GOVERNANCE 42
This study brings out the nuances between the performances of the ESG funds with the Non
ESG matched funds in five Emerging Asian Countries on the basis of certain ratios computed.
The chapter instigates with Table 1 which displays the number of ESG funds examined in each
country and their matched conventional portfolios. The matching of conventional counterparts
is done on the basis of age (history length in number of days) and size (assets under
management in US $ million) of the funds. The Sharpe ratio, Treynor ratio, Jensen alpha, last
five year’s returns and return versus index were then computed for these ESG funds and their
matched conventional counterparts. These ratios were compared using the independent sample
T Test for equality of means using SPSS.
The conventional mutual fund that matches these attributes of the ESG fund is herein referred
as its Matched conventional counterpart. To find out the matched conventional counterpart of
every ESG fund, methodology of Matching pair Technique (Mallin et al. 1995) has been
followed. The matched conventional counterparts have been found to bring both ESG and non-
ESG funds on similar platform of comparison. This was done with a view to rule out the
difference in financial performance of ESG and non-ESG funds on account of the difference
in their age and size.
Table 1: The Number of ESG Funds and the Matched Conventional Funds in 5 Emerging Asian
Countries
Country ESG Funds
Matched Conventional
Funds
Total Number of Funds
India 15 15 30
China 39 39 78
Taiwan 5 5 10
South Korea 51 51 102
Thailand 27 27 54
Total 274
Source: Research compilations
1.1 Country Selection Criteria
With a view to draw a comparative analysis between ESG funds and their match conventional
funds on the basis of performance which is measured by using certain parameters is done for
emerging Asian countries which are selected according to MSCI. MSCI Inc. (formerly Morgan

Corporate Governance Insight, Volume-3, Issue-1, eISSN: 2582-0834
GLOBAL RESEARCH FOUNDATION FOR CORPORATE GOVERNANCE 43
Stanley Capital International and MSCI Barra), is a global provider of equity, fixed income,
hedge fund stock market indices, and multi asset portfolio analysis tools. It publishes the MSCI
BRIC, MSCI World and MSCI EAFE Indices. For this part of analysis five emerging Asian
countries were considered namely India, China, Thailand, South Korea and Taiwan.
2. Comparative Analysis of Performance of ESG Funds and Conventional Funds of
Emerging Asian Countries on The Basis of Certain Parameters
With a view to achieve the objective to compare and analyse the financial performance of ESG
funds with their matched conventional counterparts for emerging Asian countries on the basis
of the total risk adjusted return, systematic risk adjusted return, return on a portfolio in excess
of its theoretical expected return, excess of fund return over the benchmark return and last 5
years return the following hypotheses have been drafted for convenience of interpretation on
the basis of each parameter.
H01: There is no significant difference in the Sharpe ratio of ESG funds with their matched
conventional counterparts for China/ India/ Thailand/ South Korea / Taiwan.
H11: There is significant difference in the Sharpe ratio of ESG funds with their matched
conventional counterparts for China/ India/ Thailand/ South Korea / Taiwan.
H02: There is no significant difference in the Treynor ratio of ESG funds with their matched
conventional counterparts for China/ India/ Thailand/ South Korea / Taiwan.
H12: There is significant difference in the Treynor ratio of ESG funds with their matched
conventional counterparts for China/ India/ Thailand/ South Korea / Taiwan.
H03: There is no significant difference in the Jensen’s Alpha of ESG funds with their
matched conventional counterparts for China/ India/ Thailand/ South Korea / Taiwan.
H13: There is significant difference in the Jensen’s Alpha of ESG funds with their matched
conventional counterparts for China/ India/ Thailand/ South Korea / Taiwan.
H04: There is no significant difference in the return versus index of ESG funds with their
matched conventional counterparts for China/ India/ Thailand/ South Korea / Taiwan.
H14: There is significant difference in the return versus index of ESG funds with their
matched conventional counterparts for China/ India/ Thailand/ South Korea / Taiwan.

Corporate Governance Insight, Volume-3, Issue-1, eISSN: 2582-0834
GLOBAL RESEARCH FOUNDATION FOR CORPORATE GOVERNANCE 44
H05: There is no significant difference in the last 5 year’s return of ESG funds with their
matched conventional counterparts for China/ India/ Thailand/ South Korea / Taiwan.
H15: There is significant difference in the last 5 year’s return of ESG funds with their
matched conventional counterparts for China/ India/ Thailand/ South Korea / Taiwan.
2.1 Comparative Performance Analysis of ESG Funds and Conventional Funds of
China
Sharpe Ratio: Measures like standard deviation and beta are used as a proxy for risk in
calculating risk adjusted measures of return. One of the most common measures is the Sharpe
Ratio, which is a portfolio’s return in excess of the risk free rate divided by the standard
deviation of the portfolio. This measure tells us the ratio of reward per unit of risk: the higher
the number the better. It can be witnessed from the table 2 that Chinese Ethical and
conventional funds are outperformers by having the highest Sharpe ratio. The average Sharpe
ratio is 3.3 for the ESG funds and 4.4 for the conventional funds.
Table 2: Group Statistics of Ratios of ESG Funds and Matched Conventional Funds in China
Ethical or
Conventional
N Mean Std. Deviation Std. Error Mean
Sharpe
ESG 39 3.3289 4.77123 .76401
Conventional
(matched)
39 4.4657 6.91196 1.10680
J alpha
ESG 13 9.6172 10.75560 2.98307
Conventional
(matched)
11 10.4634 23.90476 7.20756
Ret vs
index
ESG 14 -.4519 .99251 .26526
Conventional
(matched)
11 -.2758 .79095 .23848
Treynor
ESG 14 .3317 .38888 .10393
Conventional
(matched)
11 .7335 1.82909 .55149
Last 5yrs
ret
ESG 13 32.5265 21.47836 5.95702
Conventional
(matched)
12 18.6563 17.25037 4.97975
Source: Research output

Corporate Governance Insight, Volume-3, Issue-1, eISSN: 2582-0834
GLOBAL RESEARCH FOUNDATION FOR CORPORATE GOVERNANCE 45
Jensen’s Alpha lets an investor assess how much extra return a fund has received above the
anticipated return, while taking into account the market’s non-diversifiable risk. The projected
return is determined using the CAPM (Capital Asset Pricing Model). A positive Jensen’s alpha
means that the fund managers have been able to generate higher returns than the market (which
in our case are the underlying indexes) by careful stock selection. Jensen’s alpha = (portfolio
return – expected return (CAPM)).
As can be comprehended from table 2 the Chinese ESG funds has an alpha of 9.60 and 10.46
for the conventional funds. This means that fund manager has been able to pull out a return
9.60% higher than the expected. For each expected risk function, the Treynor ratio measures
how much an investment has received above the risk-free market rate of return. Whereas the
Sharpe ratio considers the overall investment risk, the Treynor ratio considers only the systemic
risk, ensuring the non-systematic risk is entirely diversified in portfolio growth. Systemic risk
or non-diversifiable risk is the risk in the Treynor ratio, expressed by beta. Table 2 displays
that the mean treynor ratio is slightly better for conventional funds as it is 0.73 for conventional
funds and 0.33 for ethical funds but the difference is statistically insignificant.
Last 5 years’ Returns keeps a track of long term returns for ethical and conventional funds.
Interestingly, it was found that the long term returns of the Ethical funds are higher than that
of the conventional (matched) funds. Which evidently proves that the Ethical funds who invest
their money in ESG companies will perform well in long run as it takes time to incorporate
ESG practices in an industrial set up and also these strategies will bring returns only after a lag.
The last 5 years returns for an ethical fund averages around 32.52% whereas, for a conventional
fund it averages around 18.65%.
If we compare the return of the fund versus Index’s return then they both come out to be
negative which means that the Index returns are higher than the fund’s return. The reason for
the higher index return can be the level of diversification in the index. For the ethical funds the
average negative return versus index is 0.45 and 0.27 negative return versus index for the
matched conventional funds. In table 3 the mean difference is calculated by subtracting the
mean of the conventional funds from the mean of the ethical funds. The negative t value
indicates that the mean Sharpe ratio, Jensen’s alpha, Treynor’s ratio and the fund return versus
Corporate Governance Insight, Volume-3, Issue-1, eISSN: 2582-0834
GLOBAL RESEARCH FOUNDATION FOR CORPORATE GOVERNANCE 46
index is high for the conventional funds but none of them is statistically significant. So, as
opposed to the belief that the conventional funds perform better in terms of these parameters is
proven wrong and the Sharpe ratio, Jensen alpha and Treynor ratio is not statistically different
for ethical and conventional funds in the Chinese financial markers.
However, the positive t value of the last 5 years returns indicate that it is higher for the ethical
funds and the p value is significant at a level of 10% as the p<0.10. So, we can encapsulate that
the ethical funds are able to generate higher last 5 years average returns as compared to the
matched conventional funds in China. Hamilton et al. (1993) and Statman (2000) have
contrasted the returns of ethical and standard US funds to each other, as well as S&P 500 and
Domini Social Index (DSI), respectively. Their alpha Jensen stated that risk-adjusted returns
of ethical mutual funds are no different from traditional funds. The managerial implication of
this result could be to align the interest of investors who want to satisfy their conscience by
doing good for the environment, society or public at large and have a long term horizon of their
return window.

Corporate Governance Insight, Volume-3, Issue-1, eISSN: 2582-0834
GLOBAL RESEARCH FOUNDATION FOR CORPORATE GOVERNANCE 47
Table 3: Output of Independent Samples T Test for Equality of Means for ESG Funds and Matched Conventional Funds in China
Ratios Computed Levene’s Test for Equality of
Variances
T Test for Equality of Means
F Sig. t df Sig.
(2 tailed)
Mean
Difference
Std. Error
Difference
95% Confidence Interval of
the Difference
Lower Upper
Sharpe Equal variances assumed 2.257 .137 -.845 76 .401 -1.13679 1.34488 -3.81536 1.54177
Equal variances not assumed -.845 67.513 .401 -1.13679 1.34488 -3.82082 1.54723
J alpha Equal variances assumed 2.547 .125 -.115 22 .910 -.84613 7.36095 -16.11182 14.41955
Equal variances not assumed -.108 13.392 .915 -.84613 7.80049 -17.64806 15.95580
Ret vs
index
Equal variances assumed .043 .837 -.480 23 .636 -.17611 .36680 -.93489 .58267
Equal variances not assumed -.494 22.986 .626 -.17611 .35670 -.91403 .56181
Treynor Equal variances assumed 4.704 .041** -.804 23 .430 -.40183 .50001 -1.43618 .63252
Equal variances not assumed -.716 10.713 .489 -.40183 .56120 -1.64108 .83741
Last 5yrs
ret
Equal variances assumed 2.057 .165 1.770 23 .090* 13.87013 7.83450 -2.33677 30.07702
Equal variances not assumed 1.786 22.595 .087 13.87013 7.76428 -2.20747 29.94773
*** significant at 1% level, **significant at 5% level, * significant at 10% level
Source: Research output

Corporate Governance Insight, Volume-3, Issue-1, eISSN: 2582-0834
GLOBAL RESEARCH FOUNDATION FOR CORPORATE GOVERNANCE 48
2.2 Comparative Performance Analysis of ESG Funds And Conventional Funds of India
Table 4: Group Statistics of Ratios of ESG Funds and Matched Conventional Funds in India
ESG or Conventional N Mean Std. Deviation Std. Error
Mean
Last 5 years
return
ESG 10 43.2751 7.76414 2.45524
Conventional (matched) 10 35.5372 11.92687 3.77161
Sharpe ratio ESG 13 -1.8633 1.11847 .31021
Conventional (matched) 14 -2.4752 1.53572 .41044
J alpha ESG 11 -5.4793 4.09669 1.23520
Conventional (matched) 9 -6.3003 10.06573 3.35524
Ret vs index ESG 12 .1146 .19992 .05771
Conventional (matched) 10 -.0549 .16937 .05356
Treynor ESG 10 -.6699 1.40835 .44536
Conventional (matched) 9 -.0262 .81380 .27127
Source: Research output
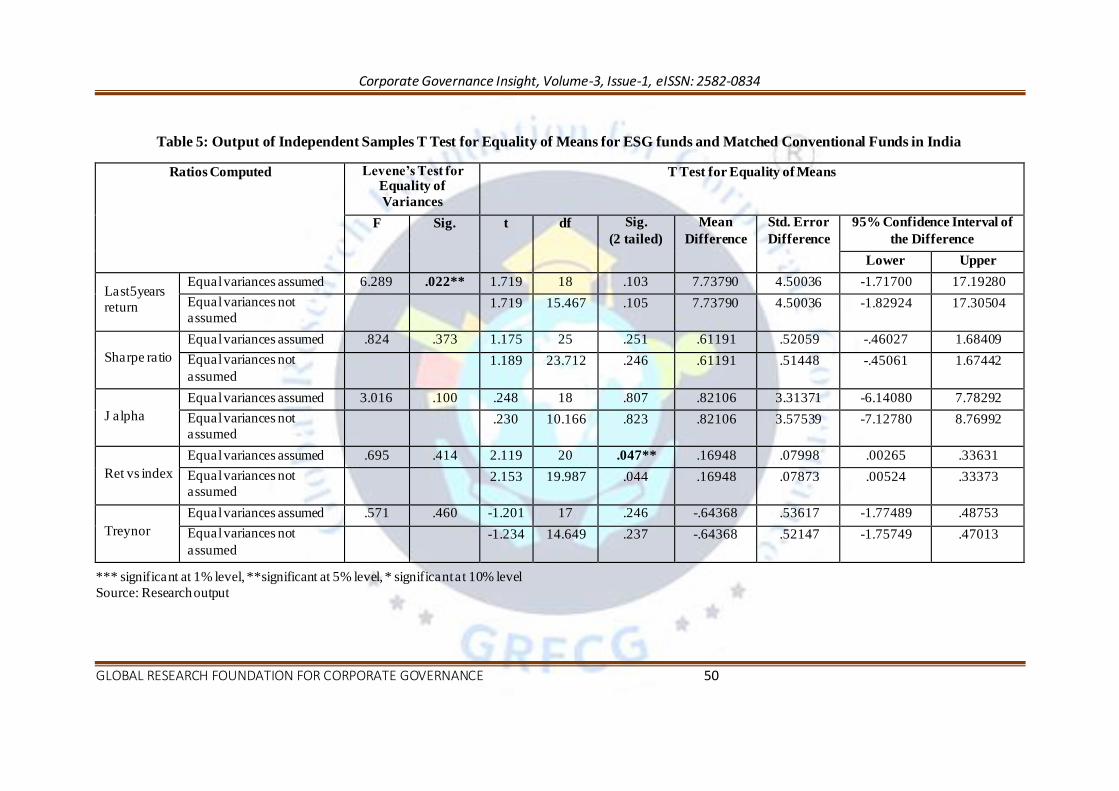
The table 4 confirms that for Indian markets, Sharpe ratio, Jensen’s alpha, Treynor ratio are all
negative for both ethical as well as conventional (matched) portfolios. It indicates that Indian
mutual funds markets are not working in the best possible way in terms of reaping returns for
the unitholders, may it be the excess return over market, or the risk adjusted returns. Only the
last 5 years returns are positive 43.27% for ethical funds and positive 35.53% for conventional
funds. So, the Indian ethical funds have performed better than the conventional matched funds.
Some have historically argued that taking an ESG approach could mean sacrificing returns.
Work however indicates otherwise. There is no lack of ways to adopt an ESG model, but maybe
the simplest method is to buy ESG-focused funds that have shown to deliver comparable
returns to their benchmarks.
From the output table 5 it is apparent that although the positive signs of the values in the mean
difference column indicates that the Sharpe ratio, Jensen alpha etc. are higher for the ethical
funds in the Indian markets but are found to be insignificant. So we cannot reject the null
hypotheses and can say that the Sharpe ratio, Jensen alpha, treynor ratio and last 5 years returns

Corporate Governance Insight, Volume-3, Issue-1, eISSN: 2582-0834
GLOBAL RESEARCH FOUNDATION FOR CORPORATE GOVERNANCE 49
are not statistically different for ethical and matched conventional funds but return versus index
has been significantly higher for ESG funds in India. These findings are in consonance with
Bauer et al. (2005) who reviewed 103 German, US and UK ethical mutual funds over the period
1990 2001. Using Carhart multi factor model to evaluate the performance of ethical and
conventional mutual funds, they found no evidence of significant differences in risk adjusted
returns between ethical and conventional funds. The inference that can be drawn is that the
investors who wants to invest passively can earn higher returns by investing in the ESG funds
to satisfy twin objectives of doing good while doing well, which is a win -win solution for
investors as well as the society, environment and other stakeholders and also for the companies
who are trying to follow difficult path of ethics, keeping the society at large in mind.
2.3 Comparative Performance Analysis of ESG Funds And Conventional Funds of
South Korea
The table 6 illustrates that for South Korean markets, Sharpe ratio, Jensen’s alpha, treynor ratio
are all negative for both ethical as well as conventional (matched) portfolios. That indicates
that South Korean mutual funds markets are not able to generate fair amount of retu rns may it
be the excess return over market, or the risk adjusted returns. Only the returns versus the index
are positive 0.4932% for ethical funds and positive 0.3139% for conventional funds. So, the
Korean ethical funds have performed better than the conventional matched funds.The output
of the independent sample T Test in Table 7 exhibits that the negative sign of mean difference
of Sharpe ratio, Jensen alpha and last 5 years returns indicate that these ratios are higher for the
conventional matched funds but the p values were found to be significantly higher Sharpe ratio
for conventional funds. The positive signs of the values in the mean difference column indicates
that the treynor ratio and return versus index are higher for the ethical funds in the Ko rean
markets but are found to be insignificant.
Corporate Governance Insight, Volume-3, Issue-1, eISSN: 2582-0834
GLOBAL RESEARCH FOUNDATION FOR CORPORATE GOVERNANCE 50
Table 5: Output of Independent Samples T Test for Equality of Means for ESG funds and Matched Conventional Funds in India
Ratios Computed Levene’s Test for Equality of
Variances
T Test for Equality of Means
F Sig. t df Sig.
(2 tailed)
Mean
Difference
Std. Error
Difference
95% Confidence Interval of
the Difference
Lower Upper
Last5years
return
Equal variances assumed 6.289 .022** 1.719 18 .103 7.73790 4.50036 -1.71700 17.19280
Equal variances not
assumed 1.719 15.467 .105 7.73790 4.50036 -1.82924 17.30504
Sharpe ratio
Equal variances assumed .824 .373 1.175 25 .251 .61191 .52059 -.46027 1.68409
Equal variances not
assumed
1.189 23.712 .246 .61191 .51448 -.45061 1.67442
J alpha
Equal variances assumed 3.016 .100 .248 18 .807 .82106 3.31371 -6.14080 7.78292
Equal variances not
assumed .230 10.166 .823 .82106 3.57539 -7.12780 8.76992
Ret vs index
Equal variances assumed .695 .414 2.119 20 .047** .16948 .07998 .00265 .33631
Equal variances not
assumed 2.153 19.987 .044 .16948 .07873 .00524 .33373
Treynor
Equal variances assumed .571 .460 -1.201 17 .246 -.64368 .53617 -1.77489 .48753
Equal variances not
assumed
-1.234 14.649 .237 -.64368 .52147 -1.75749 .47013
*** significant at 1% level, **significant at 5% level, * significant at 10% level
Source: Research output

Corporate Governance Insight, Volume-3, Issue-1, eISSN: 2582-0834
GLOBAL RESEARCH FOUNDATION FOR CORPORATE GOVERNANCE 51
Table 6: Group Statistics of Ratios of ESG Funds and Matched Conventional Funds in South
Korea
ESG or Conventional N Mean Std. Deviation Std. Error Mean
Sharpe
ESG 51 -2.5203 1.76565 .24724
Conventional
(matched)
51 -.2111 5.24155 .73396
J alpha
ESG 16 -7.2631 10.59307 2.64827
Conventional
(matched)
21 -4.3371 10.16819 2.21888
Treynor
ESG 17 -.8305 1.12282 .27232
Conventional
(matched)
26 -.9190 1.78121 .34932
Ret vs
index
ESG 18 .4932 .56956 .13425
Conventional
(matched)
26 .3139 .84169 .16507
Last 5yrs
ret
ESG 34 -5.5676 12.78813 2.19315
Conventional
(matched)
34 -1.7751 11.46307 1.96590
Source: Research output
So, we cannot reject the null hypotheses and can say that the Jensen alpha, treynor ratio, return
versus index and last 5 years returns are not statistically different for ethical and matched
conventional funds. We can conclude that the Sharpe ratio is higher for the conventional funds
by almost 2.3% in South Korea. As Kreander et al. (2005) found out of all 18 foreign pairs the
ethical funds perform better on average according to all the indicators. However, only the
ethical funds have higher Jensen and size-adjusted measures for the domestic category of 24
funds while the non-ethical funds have marginally better Sharpe and Treynor measures on
average. It can be concluded that the total risk adjusted returns are better for conventional
portfolios as compared to ESG funds that could be because the level of compensation investors
are receiving for the additional level of risk they are taking with the investment is good.
Although, the risk measured by Sharpe ratio is both the downward variability and upward
variability. So, the risk in ESG funds could also be because of high upward variability in returns
also. The managerial implication of this outcome could be used for the risk lovers that if they
invest in conventional mutual funds they will be adequately compensated for bearing the risk.
However, the mean Sharpe ratio of ESG funds as well as matched conventional funds are
negative.

Corporate Governance Insight, Volume-3, Issue-1, eISSN: 2582-0834
GLOBAL RESEARCH FOUNDATION FOR CORPORATE GOVERNANCE 52
Table 7: Output of Independent Samples T Test for Equality of Means for ESG Funds and Matched Conventional Funds in South Korea
Ratios Computed Levene’s Test for Equality of
Variances
T Test for Equality of Means
F Sig. t df Sig.
(2 tailed)
Mean
Difference
Std. Error
Difference
95% Confidence Interval of
the Difference
Lower Upper
Sharpe Equal variances assumed 25.240 .000*** -2.982 100 .004*** -2.30924 .77449 -3.84580 -.77267
Equal variances not assumed -2.982 61.203 .004 -2.30924 .77449 -3.85781 -.76066
J alpha Equal variances assumed .369 .547 -.852 35 .400 -2.92592 3.43537 -9.90008 4.04824
Equal variances not assumed -.847 31.726 .403 -2.92592 3.45496 -9.96583 4.11399
Treynor Equal variances assumed 1.476 .231 .182 41 .856 .08853 .48587 -.89271 1.06976
Equal variances not assumed .200 40.974 .843 .08853 .44293 -.80601 .98306
Ret vs
index
Equal variances assumed .856 .360 .787 42 .436 .17934 .22802 -.28082 .63949
Equal variances not assumed .843 41.992 .404 .17934 .21277 -.25005 .60872
Last 5yrs
ret
Equal variances assumed .391 .534 -1.288 66 .202 -3.79247 2.94528 -9.67291 2.08796
Equal variances not assumed -1.288 65.226 .202 -3.79247 2.94528 -9.67421 2.08927
*** significant at 1% level, **significant at 5% level, * significant at 10% level
Source: Research Output

Corporate Governance Insight, Volume-3, Issue-1, eISSN: 2582-0834
GLOBAL RESEARCH FOUNDATION FOR CORPORATE GOVERNANCE 53
2.4 Comparative Performance Analysis of ESG Funds And Conventional Funds of
Thailand
Table 8: Group Statistics of Ratios of ESG Funds and Matched Conventional Funds in Thailand
ESG or Conventional N Mean Std. Deviation Std. Error Mean
Sharpe
ESG 27 -3.7786 1.29968 .25012
Conventional
(matched) 27 -3.1495 .76870 .14794
J alpha
ESG 17 .9134 6.67463 1.61883
Conventional
(matched) 24 2.8999 8.66525 1.76879
Ret vs
index
ESG 17 -.1373 .28729 .06968
Conventional
(matched) 24 -.3389 .55734 .11377
Treynor
ESG 17 -.5771 .21205 .05143
Conventional
(matched) 24 -.5675 .21899 .04470
Last 5yrs
ret
ESG 10 8.8067 11.21456 3.54635
Conventional
(matched) 9 5.4867 12.12078 4.04026
Source: Research Output
The table 8 displays that for the markets of Thailand, the Sharpe ratio, treynor ratio and return
versus index are all negative for both ethical as well as conventional (matched) portfolios. It
indicates Thailand mutual funds markets are not able to generate fair amount of returns, only
the last 5 years returns are positive 8.806% for ethical funds and positive 5.486% for
conventional funds. So, in Thailand ethical funds have performed better than the conventional
matched funds in terms of last 5 years returns. Output of the independent sample T Test in table
9 depicts the negative sign of mean difference of Sharpe ratio, Jensen alpha and treynor ratio
indicating that these ratios are higher for the conventional matched funds but only Sharpe ratio
is statistically significantly higher for conventional funds whereas other parameters are not.
The positive signs of the values in the mean difference column indicates that the last 5 years
returns and return versus index are higher for the ethical funds in the Thailand markets but are
found to be insignificant.

Corporate Governance Insight, Volume-3, Issue-1, eISSN: 2582-0834
GLOBAL RESEARCH FOUNDATION FOR CORPORATE GOVERNANCE 54
Table 9: Output of Independent Samples T Test for Equality of Means for ESG Funds and Matched Conventional Funds in Thailand
Ratios Computed Levene’s Test for Equality of
Variances
T Test for Equality of Means
F Sig. t df Sig.
(2 tailed)
Mean
Difference
Std. Error
Difference
95% Confidence Interval of
the Difference
Lower Upper
Sharpe Equal variances assumed .164 .688 -2.165 52 .035** -.62911 .29060 -1.21224 -.04599
Equal variances not assumed -2.165 42.207 .036 -.62911 .29060 -1.21547 -.04275
J alpha Equal variances assumed 1.180 .284 -.792 39 .433 -1.98656 2.50730 -7.05806 3.08494
Equal variances not assumed -.829 38.668 .412 -1.98656 2.39776 -6.83781 2.86469
Ret vs
index
Equal variances assumed 9.019 .005*** 1.365 39 .180 .20162 .14769 -.09710 .50035
Equal variances not assumed 1.511 36.175 .139 .20162 .13341 -.06890 .47214
Treynor Equal variances assumed 2.438 .126 -.139 39 .890 -.00956 .06853 -.14817 .12905
Equal variances not assumed -.140 35.293 .889 -.00956 .06814 -.14785 .12873
Last 5yrs
ret
Equal variances assumed .913 .353 .620 17 .543 3.32003 5.35271 -7.97320 14.61327
Equal variances not assumed .618 16.415 .545 3.32003 5.37590 -8.05301 14.69307
*** significant at 1% level, **significant at 5% level, * significant at 10% level
Source: Research Output

Corporate Governance Insight, Volume-3, Issue-1, eISSN: 2582-0834
GLOBAL RESEARCH FOUNDATION FOR CORPORATE GOVERNANCE 55
So, we can conclude that the Sharpe ratio is higher for the conventional funds by almost 0.629%
in Thailand. Findings by Kreander et al. (2005) indicate that the performance metrics do not
reflect a major difference between ethical and non-ethical funds. These were similar to those
reached by Mallin et al. (1995).
2.5 Comparative Performance Analysis of ESG Funds And Conventional Funds of
Taiwan
The table 10 establishes that for the markets of Taiwan, the Sharpe ratio, treynor ratio and
return versus index are all negative for both ethical as well as conventional (matched)
portfolios. The Jensen alpha is positive 5.34% for the ethical funds and 1.366% for matched
funds and last 5 years returns are positive 1.782% for ethical funds and positive 7.267% for
conventional funds. So, the Thailand ethical funds have performed better than the conventional
matched funds in terms of last 5 years returns and Jensen alpha.
Table 10: Group Statistics of Ratios of ESG Funds and Matched Conventional Funds in Taiwan
Ethical or
Conventional N Mean Std. Deviation Std. Error Mean
Sharpe
ESG 5 -1.9828 1.03451 .46265
Conventional
(matched) 5 -1.4890 5.66671 2.53423
J alpha
ESG 3 5.3457 8.87988 5.12680
Conventional
(matched) 5 1.3660 9.46737 4.23394
Ret Vs
index
ESG 3 -.0637 .36777 .21233
Conventional
(matched) 5 -.1920 .07835 .03504
Treynor
ESG 3 -.2507 .15674 .09049
Conventional
(matched)
5 .2178 1.53679 .68727
Last 5yrs
ret
ESG 3 1.7820 6.41164 3.70176
Conventional
(matched) 3 7.2670 2.56176 1.47903
Source: Research output

Corporate Governance Insight, Volume-3, Issue-1, eISSN: 2582-0834
GLOBAL RESEARCH FOUNDATION FOR CORPORATE GOVERNANCE 56
Table 11 exhibits the negative sign of mean difference of Sharpe ratio, Treynor ratio and last 5
years returns which indicates that these ratios are higher for the conventional matched funds
but it was found that none of them is statistically significantly different. The positive signs of
the values in the mean difference column indicates that the Jensen alpha and return versus index
are higher for the ethical funds in the Taiwan n markets but are found to be insignificant.
Findings by Kreander et al. (2005) indicate that the performance metrics do not reflect a major
difference between ethical and non-ethical funds. These were similar to those reached by
Mallin et al. (1995).
3. Conclusion
A comparison was drawn between the ESG funds and matched conventional mutual funds of
the five emerging Asian countries namely, China, India, Thailand, South Korea, and Taiwan
using five parameters The Sharpe ratio, Jensen’s Alpha, excess return of funds over the index,
Treynor ratio and last 5 years Returns
The results show that for China, the last 5 years returns are significantly higher for the ESG
funds. The other four parameters are not significantly different for the matched conventional
funds. This finding is in line with the fact that ESG is a quality criterion for mutual funds. In
long term, the ESG funds are able to generate higher returns because it takes time for them to
reap benefits. Bauer et al (2005) suggested that ethical funds are less vulnerable to price
volatility than traditional funds as the investment’s primary emphasis is more on growth than
on current valuation. In their intricate work Nofsinger and Varma (2014) indicated that ethical
companies in turbulent times are better managed and thus more stable. The meaning of their
recommendation is that in a volatile environment, ethical funds may be better and they found
that U.S. ethical funds are asymmetric because they outperform traditional funds in times of
crisis but underperform in times of non-crisis due to their investments in stable companies.
In India, ESG funds have performed better in terms of generating returns versus the index
whereas for the other four parameters the difference in ESG and matched conventional is found
to be insignificant. This finding tells us that these ESG funds have outperformed the benchmark
index which itself is a well-diversified set of portfolios in a country. So, we can say that the
ESG funds in India have very bright future. The other parameters are also higher for ethical
funds but have not been able to prove their statistical significance, nevertheless, we should
keep faith in these special purpose vehicles for investment and let them prove their fertility.

Corporate Governance Insight, Volume-3, Issue-1, eISSN: 2582-0834
GLOBAL RESEARCH FOUNDATION FOR CORPORATE GOVERNANCE 57
Table 11: Output of Independent Samples T Test for Equality of Means for ESG Funds and Matched Conventional Funds in Taiwan
Ratios Computed Levene’s Test for Equality of
Variances
T Test for Equality of Means
F Sig. t df Sig.
(2 tailed)
Mean
Difference
Std. Error
Difference
95% Confidence Interval of
the Difference
Lower Upper
Sharpe Equal variances assumed 23.181 .001* -.192 8 .853 -.49380 2.57611 -6.43433 5.44673
Equal variances not assumed -.192 4.266 .857 -.49380 2.57611 -7.47354 6.48594
J alpha Equal variances assumed .004 .950 .587 6 .578 3.97967 6.77400 -12.59571 20.55504
Equal variances not assumed .599 4.591 .578 3.97967 6.64908 -13.58104 21.54037
Ret vs
index
Equal variances assumed 9.417 .022* .792 6 .458 .12833 .16195 -.26795 .52461
Equal variances not assumed .596 2.110 .609 .12833 .21520 -.75301 1.00967
Treynor Equal variances assumed 6.681 .042* -.510 6 .628 -.46847 .91874 -2.71655 1.77962
Equal variances not assumed -.676 4.137 .535 -.46847 .69321 -2.36817 1.43123
Last 5yrs
ret
Equal variances assumed 4.664 .097** -1.376 4 .241 -5.48500 3.98630 -16.55273 5.58273
Equal variances not assumed -1.376 2.623 .275 -5.48500 3.98630 -19.26886 8.29886
*** significant at 1% level, **significant at 5% level, * significant at 10% level
Source: Research Output

Corporate Governance Insight, Volume-3, Issue-1, eISSN: 2582-0834
GLOBAL RESEARCH FOUNDATION FOR CORPORATE GOVERNANCE 58
In South Korean markets, the matched conventional funds have performed significantly better
in terms of Sharpe ratio and rest of the parameters are insignificantly different. By virtue of its
meaning, the non ESG funds have been able to deliver higher risk adjusted returns in South
Korean markets. In Thailand also, the matched conventional funds have outperformed in terms
of Sharpe ratio whereas, the other parameters are found to be insignificantly different. In
Taiwan there is no significant difference between the performance of ESG funds and the
matched funds.
As opposed to the belief that the conventional funds perform better in terms of these parameters
is proven wrong and the Sharpe ratio, Jensen alpha and treynor ratio is not statistically different
for ethical and conventional funds in the Chinese financial markers. However, as summarized
in table 12 the positive mean difference of 13.87 in the last 5 years returns indicate that it is
higher for the ethical funds. Having a look at the p value we can say it is significant at a level
of 10% as the p<0.10. So, we can say that the ethical funds are able to generate higher last 5
years average returns as compared to the matched conventional funds. Oh, Park, Pervez and
Gahuri (2013) claim that ethical funds are considerably better in the long term than traditional
funds, for example in retail markets where consumer preferences for sustainable products
inevitably add value to the ethical fund (Haigh & Hazelton, 2004). Also Cummings (2000)
argued that ethical investments are better in the long run since they “…pursues a joint financial
/social utilitarian perspective, whereby both financial and social goals are achieved through
long term commitment to social behavior, which minimizes externalities to the firm”(p. 80).
Table 12: Conclusions Drawn from Comparative Analysis of Performance of ESG Funds and
Conventional Funds of Emerging Asian Countries on the basis of Certain Parameters
Country Tested Parameter Mean Difference
(ESG Funds – Matched
Conventional Funds)
p value Accept/ Reject
China
Sharpe ratio -1.13679 .401 Fail to reject H0
Jensen Alpha -.84613 .910 Fail to reject H0
Treynor ratio -.40183 .489 Fail to reject H0
Return versus index -.17611 .636 Fail to reject H0
Last 5 years returns 13.87013 .090* Reject H0
India
Sharpe ratio .61191 .251 Fail to reject H0
Jensen Alpha .82106 .807 Fail to reject H0
Treynor ratio -.64368 .246 Fail to reject H0

Corporate Governance Insight, Volume-3, Issue-1, eISSN: 2582-0834
GLOBAL RESEARCH FOUNDATION FOR CORPORATE GOVERNANCE 59
Return versus index .16948 .047** Reject H0
Last 5 years returns 7.73790 .105 Fail to reject H0
South Korea
Sharpe ratio -2.30924 .004*** Reject H0
Jensen Alpha -2.92592 .400 Fail to reject H0
Treynor ratio .08853 .856 Fail to reject H0
Return versus index .17934 .436 Fail to reject H0
Last 5 years returns -3.79247 .202 Fail to reject H0
Thailand
Sharpe ratio -.62911 .035** Reject H0
Jensen Alpha -1.98656 .433 Fail to reject H0
Treynor ratio -.00956 .890 Fail to reject H0
Return versus index .20162 .139 Fail to reject H0
Last 5 years returns 3.32003 .543 Fail to reject H0
Taiwan
Sharpe ratio -.49380 .857 Fail to reject H0
Jensen Alpha 3.97967 .578 Fail to reject H0
Treynor ratio -.46847 .535 Fail to reject H0
Return versus index .12833 .609 Fail to reject H0
Last 5 years returns -5.48500 .275 Fail to reject H0
***significant at 1% level, **significant at 5% level, * significant at 10% level
Source: Research output
It is ostensible from table 12 that although the positive signs of the values in the mean
difference column indicates that the Sharpe ratio, Jensen alpha etc. are higher for the ethical
funds in the Indian markets but are found to be insignificant. So we cannot reject the null
hypotheses and can say that the Sharpe ratio, Jensen alpha, treynor ratio and last 5 years returns
are not statistically different for ethical and matched conventional funds but return versus index
has been significantly higher for ESG funds in India at 5% level of significance.
Table 12 throws light on the negative sign of mean difference of Sharpe ratio, Jensen alpha and
last 5 years returns which designates that these ratios are higher for the conventional matched
funds but observing their p values we establish that only Sharpe ratio is statistically
significantly higher for conventional funds. The positive signs of the values in the mean
difference column indicates that the treynor ratio and return versus index are higher for the
ethical funds in the Korean markets but are found to be insignificant. So we cannot reject the
null hypotheses and can say that the Jensen alpha, treynor ratio, return versus index and last 5

Corporate Governance Insight, Volume-3, Issue-1, eISSN: 2582-0834
GLOBAL RESEARCH FOUNDATION FOR CORPORATE GOVERNANCE 60
years returns are not statistically different for ethical and matched conventional funds. But we
will reject the null hypotheses that the Sharpe ratio is not significantly different for ethical and
matched funds. So, we can conclude that the Sharpe ratio is higher for the conventional funds
by almost 2.3% in South Korea. The same holds true for the markets in Thailand, where the
Sharpe ratio is higher for the conventional funds by almost 0.629%. Differences of all the
portfolios analyzed in terms of the Sharpe ratios are not statistically significant. This finding
confirms preceding papers such as Hassan and Girard (2010), Miniaoui et al. (2015), and Rana
and Akhter (2015). Investors are thus neutral between traditional, Islamic, and hybrid
diversification approaches for portfolios.
The positive signs of the values in the mean difference column indicates that the Jensen alpha
and return versus index are higher for the ethical funds in the Taiwan markets but are found to
be insignificant. So we fail to reject the null hypotheses and can say that the Sharpe ratio, Jensen
alpha, treynor ratio, return versus index and last 5 years returns are not statistically different
for ethical and matched conventional funds in Taiwan. Over the years, the research findings
have been mixed and Revelli and Viviani’s recent study (2014) suggests that there is no
disparity in yield between ethical and conventional funds.
The selection of ESG and SRI sustainability stocks by the investors will provide them with the
additional opportunity to diverse their portfolio without sacrificing on the financial grounds.
Moreover, these options also provide them a set of safer haven during economic downturn. It
is demonstrated by the analysis that the ESG funds are less sensitive to the risk factors, so in
times of crisis, the ESG funds are expected to sail through the deep waters.
As it is observed from the conclusions that there is no detriment in adopting ESG principles
and practices in terms of return generating capability of ESG compliant firms, the Individual
financial institutions should consider adopting globally recognized principles such as the
United Nations Principles for Responsible Investment (UN PRI) and corporate sustainability
reporting and participate in United Nations Environment Programme (UNEP) Financial
Initiative in order to show their support and intent to safeguard the environment, society and
public at large.

Corporate Governance Insight, Volume-3, Issue-1, eISSN: 2582-0834
GLOBAL RESEARCH FOUNDATION FOR CORPORATE GOVERNANCE 61
References
Agarwalla, S. K., Jacob, J. and Varma, J. R. (2013). Four factor model in Indian equities
market, Working Paper W.P. No. 2013-09-05, Indian Institute of Management, Ahmedabad.
URL: http://www.iimahd.ernet.in/~iffm/Indian-Fama-French-Momentum/four-factors-India-
90s-onwards-IIM-WP-Version.pdf
Adler, T. & Kritzman, M. (2008). The cost of socially responsible investing. Journal of
Portfolio Management, 35 (1), pp. 52-56.
Azmi W., Adam N, Dewandaru G., Nagayev R. (2019). Doing well while doing good: The
case of Islamic and sustainability equity investing, Borsa Istanbul Review, 19(3), pp. 207-218.
Bauer, R., J. Derwall and R. Otten, (2007). The Ethical Mutual Fund Performance Debate: New
Evidence from Canada, Journal of Business Ethics, 70(2), 111–124.
Bauer, R., Koedijk, K., & Otten, R. (2005). International evidence on ethical mutual fund
performance and investment style. Journal of Banking and Finance, 29(7), pp. 1751-1767.
Bauer, R., R. Otten and A. T. Rad (2006). Ethical Investing in Australia, is there a Financial
Penalty?, Pacific-Basin Finance Journal, 14(1), 33–48.
Becchetti, L., Ciciretti, R., Dalo, A., & Herzel, S. (2015). Socially responsible and conventional
investment funds: performance comparison and the global financial crisis. Applied Economics,
47(25), pp. 2541-2562.
Bello, Z. Y., (2005). Socially Responsible Investing and Portfolio Diversification, Journal of
Financial Research, 28(1), 41–57.
Bengtsson, E. (2008). A History of Scandinavian Socially Responsible Investing, Journal of
Business Ethics, 82(4), 969–983.
Benson, K. L., T. J. Brailsford and J. E. Humphrey, (2008). Socially responsible investment
funds: Investor reaction to current and past returns, Journal of Banking and Finance 32(9),
1850–1859.
Camilleri, M.A. (2017). Socially Responsible and Sustainable Investing: A Review and
Appraisal. University of Malta, Department of Corporate Communication, Working Paper,
2017
Carhart, M. M. (1997). On the Persistence in Mutual Fund Performance, The Journal of
Finance, 52(1), 57–82.
Carhart, M. M., Carpenter, Jennifer N., Lynch, Anthony W., Musto, David K. (2002). Mutual
Fund Survivorship, Review of Financial Studies, 15 (5), pp. 1439-1463.
Chang, C. E. and H. D. Witte. (2010). Performance Evaluation of U.S. Socially Responsible
Mutual Funds: Revisiting Doing Good and Doing Well, American Journal of Business 25(1),
9–22.

Corporate Governance Insight, Volume-3, Issue-1, eISSN: 2582-0834
GLOBAL RESEARCH FOUNDATION FOR CORPORATE GOVERNANCE 62
Chang, C. E., Nelson, W. A., & Witte, H. D. (2012). Do green mutual funds perform well?
Management Research Review, 35(8), pp. 693-708.
Cortez, M. C., F. Silva and N. Areal. (2009). The Performance of European Socially
Responsible Funds, Journal of Business Ethics, 87(4), 573–588.
Derwall, J. & K. Koedijk. (2009). Socially Responsible Fixed-Income Funds, Journal of
Business Finance & Accounting, 36(1/2), 210–229.
Derwall, J., Koedijk, K., Ter Horst, J. (2011). A tale of values-driven and profit-seeking social
investors. Journal of Banking and Finance, 35, 2137-2147.
Fama, E. F., & French, K. R. (1993). Common risk factors in the return on stocks and bonds.
Journal of Financial Economics, 33(1), pp. 3-56.
Fernandez, A., Matallin, J. (2008). Performance of Ethical Mutual Funds in Spain: Sacrifice or
Premium?. Journal of Business Ethics, 81, pp. 247-260.
Galema R., Plantinga A., Scholtens B. (2008). The stocks at stake: Return and risk in socially
responsible investment, Journal of Banking & Finance, 32 (12), pp 2646-2654.
Geczy, C., Stambaugh, F., Levin, D. (2005). Investing in Socially Responsible Mutual Funds.
Available at SSRN: http://ssrn.com/abstract=416380.
Gil-Bazo, J., Ruiz-Verdu, P., & Santos, A. A. (2010). The Performance of Socially responsible
Mutual Funds: The role of Fees and Management Companies. Journal of Business Ethics,
94(2), pp. 243-263.
Global Sustainable Investment Alliance. (2016). 2016 Global Sustainable Investment Review.
Brussel: Global Sustainable Investment Alliance.
Goldreyer, F., Ahmed, P., and Diltz, J., 1999. The performance of socially responsible mutual
funds: Incorporating socio-political information in portfolio selection. Managerial Finance,
25, pp 23-36.
Gregory, A., Matatko, J., Luther, R. (1997). Ethical unit trust financial performance: Small
company effects and fund size effects. Journal of Business Finance and Accounting, 24, pp
705-725.
Haigh, M., Hazelton, J. (2004). Financial Markets: A Tool for Social Responsibility?. Journal
of Business Ethics, 52, 59–71.
Hamilton, S., Jo, H., & Statman, M. (1993). Doing Well while Doing Good? The Investment
Performance of Socially Responsible Mutual Funds. Financial Analysts Journal, 49(6), pp. 62-
66.
Humphrey, J. E., Tan, D. T. (2013). Does it really hurt to be responsible? Journal of Business
Ethics.

Corporate Governance Insight, Volume-3, Issue-1, eISSN: 2582-0834
GLOBAL RESEARCH FOUNDATION FOR CORPORATE GOVERNANCE 63
Humphrey, J., Warren, G., & Boon, J. (2016). What is Different about Socially Responsible
Funds? A Holdings-Based Analysis. Journal of Business Ethics, 138(2), 263-277.
Humphrey, J. E. and D. D. Lee. (2011). Australian Socially Responsible Funds: Performance,
Risk and Screening Intensity. Journal of Business Ethics, 102(4), pp. 519– 533.
Jin, J., & Han, L. (2018). Assessment of Chinese green funds: Performance and industry
allocation. Journal of Cleaner Production, 171(10), pp. 1084-1093.
Jones, S., Van der Laan, S., Frost, G., & Loftus, J. (2008). The Investment Performance of
Socially Responsible Investment Funds in Australia. Journal of Business Ethics, 80(2), pp.
181-203.
Kempf, A. and Osthoff, P. (2007). The Effect of Socially Responsible Investing on Portfolio
Performance. European Financial Management, 13, pp. 908-922.
Kreander, N., Gray, R., Power, D., & Sinclair, C. (2005). Evaluating the Performance of Ethical
and Non-Etihcal Funds: A Matched Pair Analysis. Journal of Business Finance & Accounting,
32(7-8), pp. 1465-1493.
Kempf, A., and P. Osthoff. (2008). SRI funds: nomen est omen’, Journal of Business Finance
and Accounting , 35(9/10), pp. 1276–1294.
Leite, P., & Cortez, M. C. (2015). Performance of European socially responsible funds during
market crises: Evidence from France. International Review of Financial Analysis, 40, pp. 132-
141.
Li, S., Fetscherin, M., Alon, I., Lattemann, C., & Yeh, K. (2010). Corporate social
responsibility in emerging markets - the importance of the governance environment.
Management International Review, 50(5), pp. 635-654.
Lozano, J., Albareda, L., & Balaguer, M. (2006). Socially Responsible Investment in the
Spanish Financial Market. Journal of Business Ethics, 69(3), pp. 305-316.
Luther, R.G. and Matatko, J. (1994). The Performance of Ethical Unit Trusts: Choosing an
Appropriate Benchmark. British Accounting Review, 26, pp. 77-89.Mallin, C., Saadouni, B.,
& Briston, R. (1995). The financial performance of ethical investment funds . Journal of
Business Finance and Accounting, 22(4), pp. 483-496.
Mollet, J. C., & Ziegler, A. (2014). Socially responsible investing and stock performance: New
empirical evidence for the US and European stock markets. Review of Financial Economics,
23(4), pp. 208-216.
Nofsinger, J., Varma, A. (2014). Socially responsible funds and market crises. Journal of
Banking & Finance, 48, pp. 180-193.

Corporate Governance Insight, Volume-3, Issue-1, eISSN: 2582-0834
GLOBAL RESEARCH FOUNDATION FOR CORPORATE GOVERNANCE 64
Oh, Chang Hoon & Park, Jae-Heum & Ghauri, Pervez. (2013). Doing Right, Investing Right:
Socially Responsible Investing and Shareholder Activism in the Financial Sector. Business
Horizons. 56, pp. 703-714.
Renneboog L.,Ter Horst J., Zhang C., (2008)a. Socially responsible investments: Institutional
aspects, performance, and investor behavior. Journal of Banking & Finance, 32 (9), pp. 1723-
1742.
Renneboog, L., Ter Horst, J., Zhang, C. (2008)b. The price of ethics and stake holder
governance: The performance of socially responsible mutual funds. Journal of Corporate
Finance, 14(3), pp. 302-322.
Renneboog, L., Ter Horst, J., Zhang, C. (2011). Is ethical money financially smart?
Nonfinancial attributes and money flows of socially responsible investment funds. Journal of
Financial Intermediation, 20, pp. 562-588.
Sauer, David A. (1997).The Impact of Socially-Responsibility Screens on Investment
Performance: Evidence from the Domini 400 Social Index and Domini Mutual Fund, Review
of Financial Economics, 6 (2), pp. 137-149.
Schwartz, M. S. (2003). The “Ethics” of Ethical Investing. Journal of Business Ethics, 43(3),
195-213.
Sparkes, R. (2001). Ethical investment: whose ethics, which investment? Business Ethics: A
European Review, 10(3), 194-205.
Statman, M. (2006). Socially Responsible Indexes: Composition, performance, and tracking
error. The Journal of Portfolio Management, 32(3), 100-109.
Sharpe, W. F. (1966). Mutual Fund Performance. The Journal of Business, 39(1), pp. 119-138.
Silva, F., & Cortez, M. C. (2016). The performance of US and European green funds in
different market conditions. Journal of Cleaner Production, 135, pp. 558-566.
Statman, M. (2000). Socially Responsible Mutual Funds. Financial Analysts Journal, 56, pp.
30-39.
Statman, M. (2006). Socially responsible indexes: composition, performance, and tracking
error. Journal of Portfolio Management, 32, pp.100-109.
Statman, M., Glushkov, D. (2009). The wages of social responsibility. Financial Analysts
Journal, 65, pp. 33–46.
Treynor, J. (1965). How to rate management investment funds. Harvard Business Review, 43,
pp. 63-75.