performance of companhia vale do rio doce in 2002 · paulista de ferro ligas (cpfl), a producer of...
TRANSCRIPT
1
Press Release 2002
PERFORMANCE OF COMPANHIA VALE DO RIODOCE IN 2002
The financial and operational information contained in this press release, except whetherotherwise indicated, is based on consolidated figures, according to generally acceptedaccounting principles in the United States of America (“US GAAP”). The main subsidiariesof CVRD which composes these consolidated figures are: RDME, Sibra, Ferteco, UrucumMineração, Pará Pigmentos, Docenave, Aluvale, Alunorte, Florestas Rio Doce, Celmar, RioDoce Europa, Itaco, CVRD Overseas and Rio Doce Finance International.
Rio de Janeiro, February 26, 2003 – Companhia Vale do Rio Doce (CVRD)recorded a net profit of US$ 680 million in 2002, the equivalent to US$ 1.77 pershare, compared to US$ 1.29 billion in 2001. In fourth quarter of 2002 (4Q02) theCompany obtained net earnings of US$ 569 million, corresponding to US$ 1.48 pershare.
Operating profit in 2002 amounted to US$ 1.38 billion. However, the 52.3%appreciation of the US dollar (USD) during the year against the Real (BRL) had asignificant negative effect on net earnings. The volatility in the exchange rateprovoked a loss of US$ 580 million due to the impact on net debt denominated inUSD (net debt minus assets abroad).
If we were to disregard the capital gains from the sale of assets, which are of a non-recurring nature, net earnings in 2002 (pro forma earnings) would have been US$631 million, compared to US$ 503 million in 2001.
US$ 602 million was paid out to shareholders in the form of interest on shareholdersequity, US$ 0.98 per share on April 30 and US$ 0.70 on December 10. Thedividend yield, measured in USD, amounted to 6.8%.
Total shareholder return (TSR), the measurement which best indicates value creationas it incorporates the effect of share price variation and dividends paid, amounted to24.2% in 2002, an excellent level of remuneration against a background globalscenario of low returns and uncertainty. Over the period 1998/2002 TSR amountedto 14.4% per year.
Despite the slow recovery in the global economy and the fall in iron ore and pelletprices, CVRD set several new records in terms of sales, revenues and cashgeneration.
Volumes sold of iron ore and pellets, ferro-alloys, potash and alumina, all reachedrecord levels, as did the transport of general cargo by railroads for clients.

US GAAP 20022
Shipments of iron ore and pellets amounted to 164.1 million tons, up 10.4% in relation to 2001. Ferro-alloys sales totalled 522,000 tons, compared to just 252,000 in 2001, when power rationing forced a cut inproduction in Brazil. Sales of potash amounted to 731,000 tons, an increase of 45.3% in relation to theprevious year. Total sales of alumina, produced by Alunorte, amounted to 1.64 million tons compared to1.595 million in 2001.
The transport of general cargo (cargo other than iron ore and pellets), carried by the Vitória to Minas(EFVM) and Carajás (EFC) railroads, amounted to 14.7 billion net ton kilometres (ntk), an increase of14.0% compared to 2001.
Net revenues of US$ 4.113 billion were 4.5% higher than in 2001, the highest level since the Companybegan to release its financial statements in US GAAP. Cash generation as measured by EBITDA(earnings before interest taxation depreciation and amortization) amounted to US$ 1.789 billion, whichalso constituted a new record. The EBITDA/net revenues ratio was 43.5% in 2002.
CVRD's capital expenditure, measured in accordance with US GAAP criteria, totalled US$ 898.2 millionin 2002, the major tranche of this, US$ 435.1 million, going towards the financing of projects.
The year 2002 saw the inauguration of the São Luís pellet plant at the port of Ponta da Madeira, in thestate of Maranhão, which has a production capacity of 6 million tons a year. The commercial operation ofthis plant began in the second half of the year. The Funil hydroelectric plant, located in the state of MinasGerais, in which CVRD holds a 51% stake, entered into service at the end of 2002. Funil has an installedcapacity of 180 MW.
At the end of December 2002, the Company's total debt amounted to US$ 3.331 billion, slightly higherthan the level of US$ 3.244 billion registered as of December 31, 2001. The cash holdings at the end oflast year amounted to US$ 1.091 billion.
In 4Q02, CVRD obtained net earnings of US$ 569 million, more than compensating for the lossesincurred in the two previous quarters, which were caused by monetary variation - resulting from thedepreciation in the BRL. EBITDA reached US$ 406 million in 4Q02 and EBITDA margin, 39.1%.
RELEVANT EVENTS IN 4Q02
Public Offering for the Shares of Companhia Paulista de Ferro Ligas
On November 26, 2002 an auction was held on BOVESPA for the repurchase of shares in CompanhiaPaulista de Ferro Ligas (CPFL), a producer of ferro-alloys controlled by CVRD. 80% of the shares incirculation were acquired, which corresponds to 4.94% of the total capital of CPFL. The amount involvedin the operation was R$ 7,896,117.09. The delisting of CPFL was authorized by CVM (Braziliansecurities and exchange commission) in December 2002.
ISO 14001
In November 2002, the iron ore mines at Itabira received ISO 14001 certification for their EnvironmentalQuality Control System. With this, all CVRD's main operations now hold the ISO 14001 certificate.
Strategic moves in the steel industry
CVRD, together with Arcelor, made a joint proposal for the acquisition of Acesita’s stake in CompanhiaSiderúrgica de Tubarão (CST). This transaction involves an agreement which allows the sale of CVRD'sstake in CST from 2007. At the same time, the agreement guarantees approval by CST’s controllingshareholders, for a project to construct a third blast furnace. Therefore, the temporarily increase in stakethat CVRD holds in CST has, in counterpart, achieved greater liquidity in terms of its shareholding and a

US GAAP 20023
significant increase in its sales of iron ore and pellets to this company from 2006, which is consistent withCVRD’s strategy of focusing on its core mining businesses.
Logistics Joint Venture
CVRD has formed a partnership with Mitsui, a global Japanese player in logistics markets, for thedevelopment of an inter-modal transport business. Mitsui will contribute technology and know-how in thearea of container warehousing management and the creation of a feeder service - the loading of containersfor international maritime shipping.
Dividends
Under the established Dividend Policy, on January 30, 2003 the Company's Executive Board presented tothe Board of Directors a proposal for the payment of dividends and/or interest on equity to itsshareholders, of the minimum amount of US$ 400 million, which corresponds to US$ 1.04 per share, tobe made in two equal tranches, on April 30 and October 31, 2003, respectively.
Acquisition of Rana
In February 2003, CVRD acquired full control of Elkem Rana, located in the industrial park of Mo iRana, in Norway, for approximately US$ 17.6 million. The company, whose name will be changed to RioDoce Manganese Norway, has a plant which produced ferro chrome alloys up to June 2002. In 2003 itwill start to produce manganese ferro alloys, allowing CVRD to expand its ferro-alloy activities inContinental Europe, where its subsidiary Rio Doce Manganese Europe already operates a manganese-alloy producing plant in Dunkirk, France.
SHORT TERM PROSPECTS
The global economy continues in a convalescence phase, with nominal and real interest rates remaining athistorically low levels, while the USD continues to show a weakening trend against a reference basket ofcurrencies. One of the implications of the depreciation in the USD is the likely positive effect on metalprices, seeing that there is negative correlation between the value of the US dollar and the prices of thesecommodities.
The US economy is issuing mixed signals in terms of its recovery, the Eurozone appears to be entering aphase of even more modest growth and Japan has proved unable to emerge from a stagnant economy.
The main macro-economic effect of a possible war against Iraq, reflected in the rise in oil prices, appearsto have been partially anticipated by the markets, causing a supply shock to the global economy.However, depending on the intensity and the duration of this effect, the recovery phase in the globaleconomy could see a reversal, resulting in a recession such as that which occurred at the beginning of thenineties.
On the other hand, the rapid economic growth in China and the phase through which that country’seconomy is passing, is influencing minerals and metals markets disproportionally compared to China'srelative importance in global GDP terms. Increasing income levels are allowing growing numbers of itspopulation access to consumer durables, whose manufacture employs the intense use of metals such assteel, aluminum and copper. At the same time, the country is implementing a substantial investmentprogram in infrastructure and housing, also requiring a highly intensive use of these metals. As aconsequence, it is estimated that China is currently responsible for 15% of global metal consumption.
The extraordinary expansion in the consumption of steel and the need to substitute the use of domesticiron ore with the imported variety, has led China to dramatically increase its purchases of ore, which grewby approximately 20 million tons in 2002.
US GAAP 20024
We estimate that for 2002, the seaborne trade of iron ore will have set a new record of approximately 475million tons. For 2003, it is estimated that there will be global demand, principally driven by China, ofsome 500 million tons. Already in the first month of 2003 global production of crude steel, according tothe IISI (International Institute for Steel and Iron), is showing an increase of 10.7% in relation to January2002, which is a good indication of the pressure of demand for iron ore.
Catering to this demand will encounter certain limitations, both in terms of production capacity at the ironore mines, as well as in logistics. CVRD is operating at full capacity, and only modest expansion ispredicted in the level of shipments for 2003, fuelled principally by the ramping up of production at theSão Luiz pellet plant.
In the case of alumina, the situation is similar. In order to sustain growth in aluminum production, Chinahas more than doubled its imports of alumina between 2000 and 2002, and continuing growth in demandis contributing to the rise in prices.
Stage 3 of Alunorte, the alumina refinery controlled by CVRD, which increases the company's productioncapacity by 2.4 million tons a year, entered its experimental operational phase at the end of January. TheCompany intends to invest in the construction of stagess 4 and 5, increasing Alunorte’s capacity to 4.2million tons.
In the logistics market, CVRD has significantly increased investment in the purchase of locomotives andwagons to meet demand for its services, seeing that it already has contracts which will ensure the full useof the equipment being ordered.
SALES VOLUMES AND REVENUES
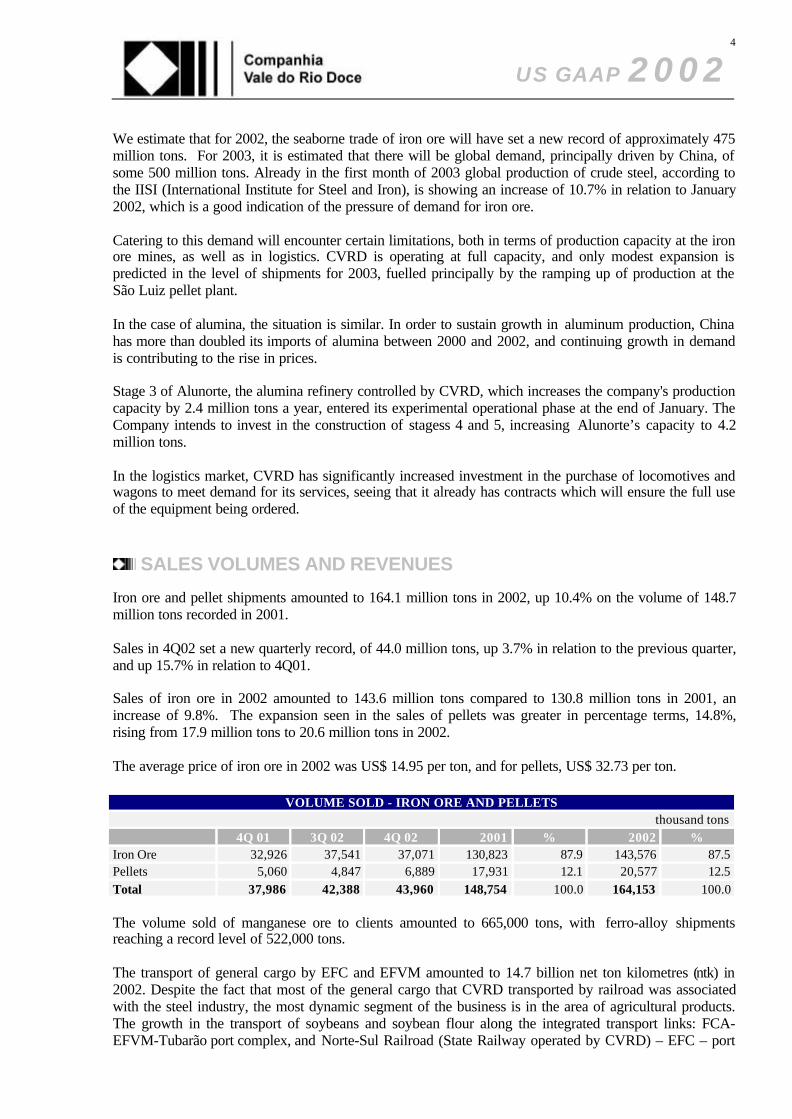
Iron ore and pellet shipments amounted to 164.1 million tons in 2002, up 10.4% on the volume of 148.7million tons recorded in 2001.
Sales in 4Q02 set a new quarterly record, of 44.0 million tons, up 3.7% in relation to the previous quarter,and up 15.7% in relation to 4Q01.
Sales of iron ore in 2002 amounted to 143.6 million tons compared to 130.8 million tons in 2001, anincrease of 9.8%. The expansion seen in the sales of pellets was greater in percentage terms, 14.8%,rising from 17.9 million tons to 20.6 million tons in 2002.
The average price of iron ore in 2002 was US$ 14.95 per ton, and for pellets, US$ 32.73 per ton.
VOLUME SOLD - IRON ORE AND PELLETSthousand tons
4Q 01 3Q 02 4Q 02 2001 % 2002 %Iron Ore 32,926 37,541 37,071 130,823 87.9 143,576 87.5Pellets 5,060 4,847 6,889 17,931 12.1 20,577 12.5Total 37,986 42,388 43,960 148,754 100.0 164,153 100.0
The volume sold of manganese ore to clients amounted to 665,000 tons, with ferro-alloy shipmentsreaching a record level of 522,000 tons.
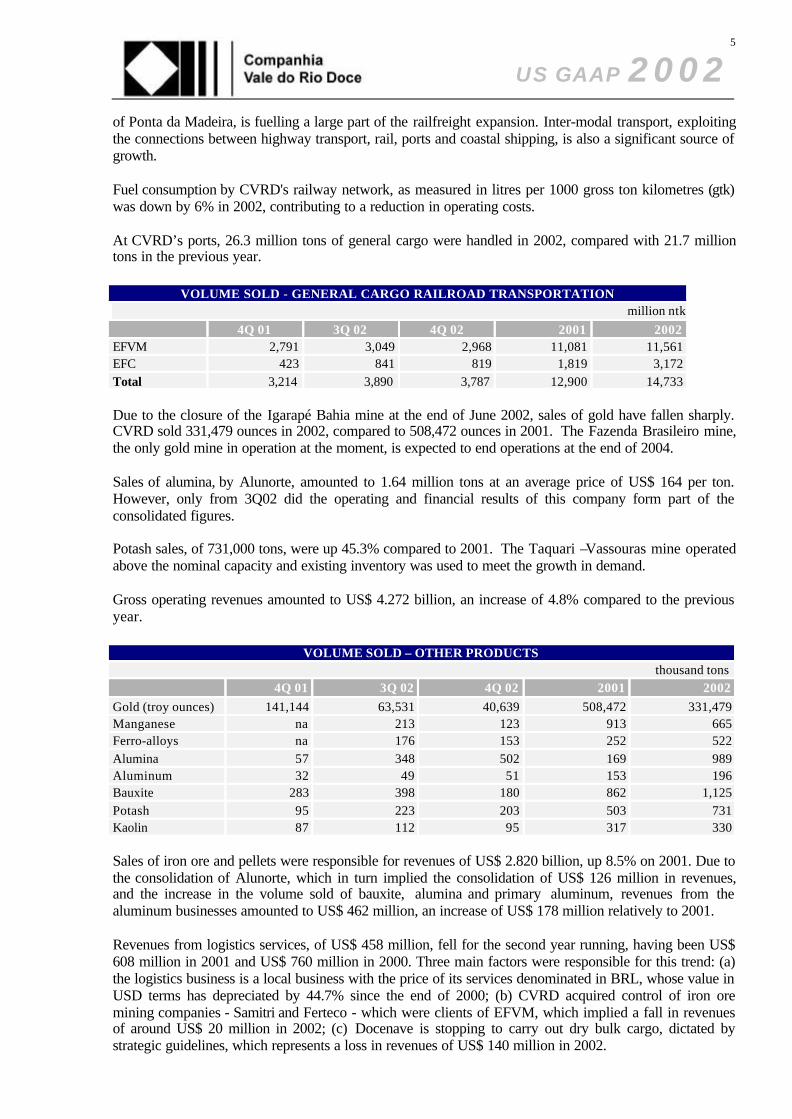
The transport of general cargo by EFC and EFVM amounted to 14.7 billion net ton kilometres (ntk) in2002. Despite the fact that most of the general cargo that CVRD transported by railroad was associatedwith the steel industry, the most dynamic segment of the business is in the area of agricultural products.The growth in the transport of soybeans and soybean flour along the integrated transport links: FCA-EFVM-Tubarão port complex, and Norte-Sul Railroad (State Railway operated by CVRD) – EFC – port
US GAAP 20025
of Ponta da Madeira, is fuelling a large part of the railfreight expansion. Inter-modal transport, exploitingthe connections between highway transport, rail, ports and coastal shipping, is also a significant source ofgrowth.
Fuel consumption by CVRD's railway network, as measured in litres per 1000 gross ton kilometres (gtk)was down by 6% in 2002, contributing to a reduction in operating costs.
At CVRD’s ports, 26.3 million tons of general cargo were handled in 2002, compared with 21.7 milliontons in the previous year.
VOLUME SOLD - GENERAL CARGO RAILROAD TRANSPORTATIONmillion ntk
4Q 01 3Q 02 4Q 02 2001 2002EFVM 2,791 3,049 2,968 11,081 11,561EFC 423 841 819 1,819 3,172Total 3,214 3,890 3,787 12,900 14,733
Due to the closure of the Igarapé Bahia mine at the end of June 2002, sales of gold have fallen sharply.CVRD sold 331,479 ounces in 2002, compared to 508,472 ounces in 2001. The Fazenda Brasileiro mine,the only gold mine in operation at the moment, is expected to end operations at the end of 2004.
Sales of alumina, by Alunorte, amounted to 1.64 million tons at an average price of US$ 164 per ton.However, only from 3Q02 did the operating and financial results of this company form part of theconsolidated figures.
Potash sales, of 731,000 tons, were up 45.3% compared to 2001. The Taquari –Vassouras mine operatedabove the nominal capacity and existing inventory was used to meet the growth in demand.
Gross operating revenues amounted to US$ 4.272 billion, an increase of 4.8% compared to the previousyear.
VOLUME SOLD – OTHER PRODUCTSthousand tons
4Q 01 3Q 02 4Q 02 2001 2002
Gold (troy ounces) 141,144 63,531 40,639 508,472 331,479Manganese na 213 123 913 665Ferro-alloys na 176 153 252 522Alumina 57 348 502 169 989Aluminum 32 49 51 153 196Bauxite 283 398 180 862 1,125Potash 95 223 203 503 731Kaolin 87 112 95 317 330
Sales of iron ore and pellets were responsible for revenues of US$ 2.820 billion, up 8.5% on 2001. Due tothe consolidation of Alunorte, which in turn implied the consolidation of US$ 126 million in revenues,and the increase in the volume sold of bauxite, alumina and primary aluminum, revenues from thealuminum businesses amounted to US$ 462 million, an increase of US$ 178 million relatively to 2001.
Revenues from logistics services, of US$ 458 million, fell for the second year running, having been US$608 million in 2001 and US$ 760 million in 2000. Three main factors were responsible for this trend: (a)the logistics business is a local business with the price of its services denominated in BRL, whose value inUSD terms has depreciated by 44.7% since the end of 2000; (b) CVRD acquired control of iron oremining companies - Samitri and Ferteco - which were clients of EFVM, which implied a fall in revenuesof around US$ 20 million in 2002; (c) Docenave is stopping to carry out dry bulk cargo, dictated bystrategic guidelines, which represents a loss in revenues of US$ 140 million in 2002.
US GAAP 20026
Nonetheless, this trend, as indicated by the strong growth in logistics services is likely to see a reversal,unless the BRL continues to devalue against the USD, which we consider to be unlikely.
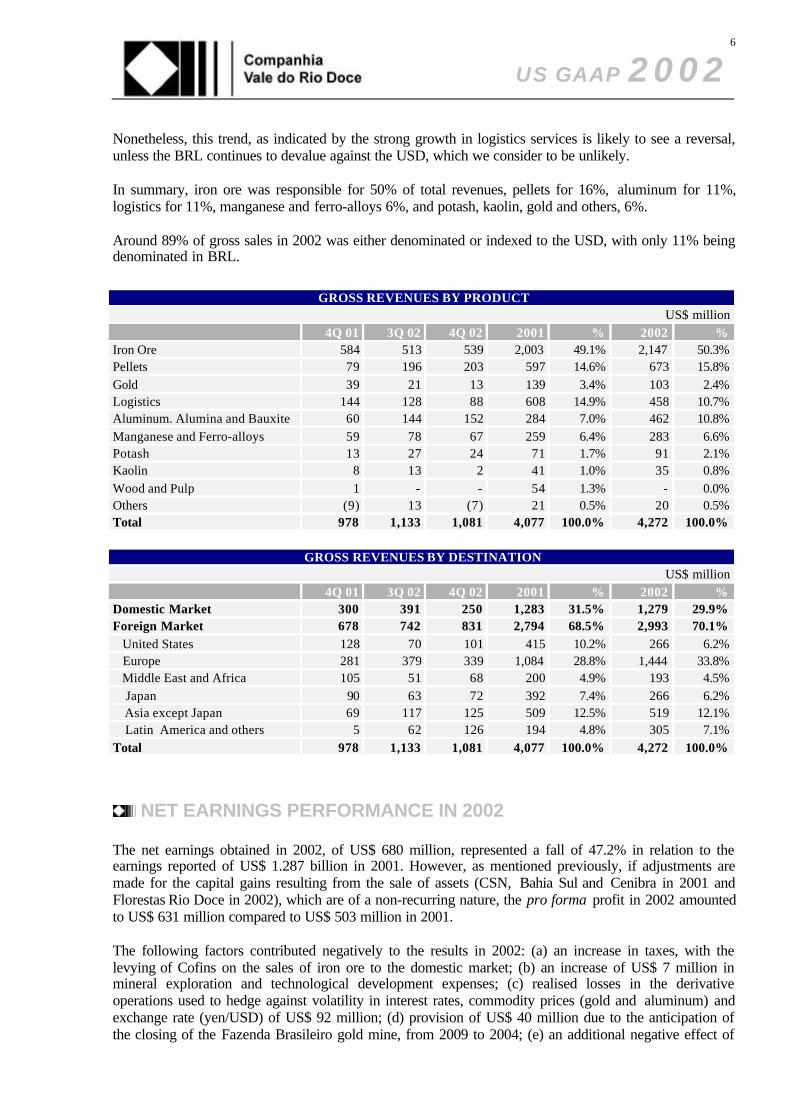
In summary, iron ore was responsible for 50% of total revenues, pellets for 16%, aluminum for 11%,logistics for 11%, manganese and ferro-alloys 6%, and potash, kaolin, gold and others, 6%.
Around 89% of gross sales in 2002 was either denominated or indexed to the USD, with only 11% beingdenominated in BRL.
GROSS REVENUES BY PRODUCTUS$ million
4Q 01 3Q 02 4Q 02 2001 % 2002 %Iron Ore 584 513 539 2,003 49.1% 2,147 50.3%Pellets 79 196 203 597 14.6% 673 15.8%Gold 39 21 13 139 3.4% 103 2.4%Logistics 144 128 88 608 14.9% 458 10.7%Aluminum. Alumina and Bauxite 60 144 152 284 7.0% 462 10.8%Manganese and Ferro-alloys 59 78 67 259 6.4% 283 6.6%Potash 13 27 24 71 1.7% 91 2.1%Kaolin 8 13 2 41 1.0% 35 0.8%Wood and Pulp 1 - - 54 1.3% - 0.0%Others (9) 13 (7) 21 0.5% 20 0.5%Total 978 1,133 1,081 4,077 100.0% 4,272 100.0%
GROSS REVENUES BY DESTINATIONUS$ million
4Q 01 3Q 02 4Q 02 2001 % 2002 %Domestic Market 300 391 250 1,283 31.5% 1,279 29.9%Foreign Market 678 742 831 2,794 68.5% 2,993 70.1% United States 128 70 101 415 10.2% 266 6.2% Europe 281 379 339 1,084 28.8% 1,444 33.8% Middle East and Africa 105 51 68 200 4.9% 193 4.5% Japan 90 63 72 392 7.4% 266 6.2% Asia except Japan 69 117 125 509 12.5% 519 12.1% Latin America and others 5 62 126 194 4.8% 305 7.1%Total 978 1,133 1,081 4,077 100.0% 4,272 100.0%
NET EARNINGS PERFORMANCE IN 2002
The net earnings obtained in 2002, of US$ 680 million, represented a fall of 47.2% in relation to theearnings reported of US$ 1.287 billion in 2001. However, as mentioned previously, if adjustments aremade for the capital gains resulting from the sale of assets (CSN, Bahia Sul and Cenibra in 2001 andFlorestas Rio Doce in 2002), which are of a non-recurring nature, the pro forma profit in 2002 amountedto US$ 631 million compared to US$ 503 million in 2001.
The following factors contributed negatively to the results in 2002: (a) an increase in taxes, with thelevying of Cofins on the sales of iron ore to the domestic market; (b) an increase of US$ 7 million inmineral exploration and technological development expenses; (c) realised losses in the derivativeoperations used to hedge against volatility in interest rates, commodity prices (gold and aluminum) andexchange rate (yen/USD) of US$ 92 million; (d) provision of US$ 40 million due to the anticipation ofthe closing of the Fazenda Brasileiro gold mine, from 2009 to 2004; (e) an additional negative effect of

US GAAP 20027
US$ 154 million in monetary variation on liabilities, caused by the devaluation of the BRL in relation tothe USD; (f) an increase of US$ 54 million in provisions for losses on investments, influence principallyby the write-off of the US$ 86 million premium paid for the acquisition of control of Caemi.
Losses realised with derivatives to hedge against fluctuation in gold price, of US$ 22 million, afectedoperating costs. Loss with transactions to protect against Libor fluctuation, of US$ 68 million, areaccounted as financial expenses. In the case of loss with currency fluctuation, the result, US$ 2 million,were allocated as monetary variation.
On the positive side, of note is the strong increase of US$ 195 million in gross operating revenues; thereduction, despite the strong increase in sales, of US$ 19 million in the cost of goods sold; the drop ofUS$ 17 million in sales, general and administrative expenses; and the increase of US$ 21 million inequity income generated by non-consolidated companies.
COST OF GOODS SOLDUS$ million
4Q 01 3Q 02 4Q 02 2001 2002
Personnel 59 58 54 243 231Materials 113 114 123 427 459Outsourced Services 131 98 105 415 360Acquisition of Iron Ore and Pellets 180 140 165 752 692Acquisition of bauxite - 31 32 - 74Depreciation and Depletion 63 62 31 252 250Others 11 47 62 183 187Total 557 550 572 2,272 2,253
The profit recorded in 4Q02, of US$ 569 million, was mainly driven by the reversal of the monetaryvariation effect on foreign currency denominated loans of US$ 757 million, caused by the 9.3%depreciation of the USD relative to the BRL between 30 September and 31 December 2002. Besides that,there was a partial reversion of the provision made in the 3Q02 due to the obligation granted to VALIA -CVRD’s pension fund - of a return of 6% per year plus IGP-DI on the value of CSN shares transferred tothe pension fund in March 2001. The reversion of US$ 41 million was made given that CSN shares tradedat the BOVESPA, closed the year at R$ 51.06, very close to the price set in the contract, of R$ 51.14 pershare at that date. As a result, only R$ 1 million was left provisioned.
CASH GENERATION
Free cash flow (operational cash flow minus investments) generated in 2002 amounted to US$ 1.256billion, 27.3% higher than that recorded in 2001, of US$ 987 million. The level of cash flow permitted,with a room to spare, the payment of dividends in the form of interest on shareholders equity, and intereston debt, of US$ 602 million and US$ 188 million respectively.
EBITDA for 2002 amounted to US$ 1.789 billion, representing an increase of 1% on the EBITDA of US$1.772 billion reported in the previous year. EBITDA margin reached 43.5%.
In 2002, adjustments for non-cash items amounted to US$ 104 million and dividends received from non-consolidated companies amounted to US$ 91 million. In 2001, adjustments for non-cash items amountedto US$ 466 million and dividends received were US$ 41 million higher than in 2002, totalling US$ 132million.
US GAAP 20028
MRN, with US$ 32 million, Samarco, with US$ 17 million, CSI, with US$ 9 million, Valesul and GIIC,with US$ 6 million, were responsible for 77% of the dividends received by CVRD from its nonconsolidated affiliates.
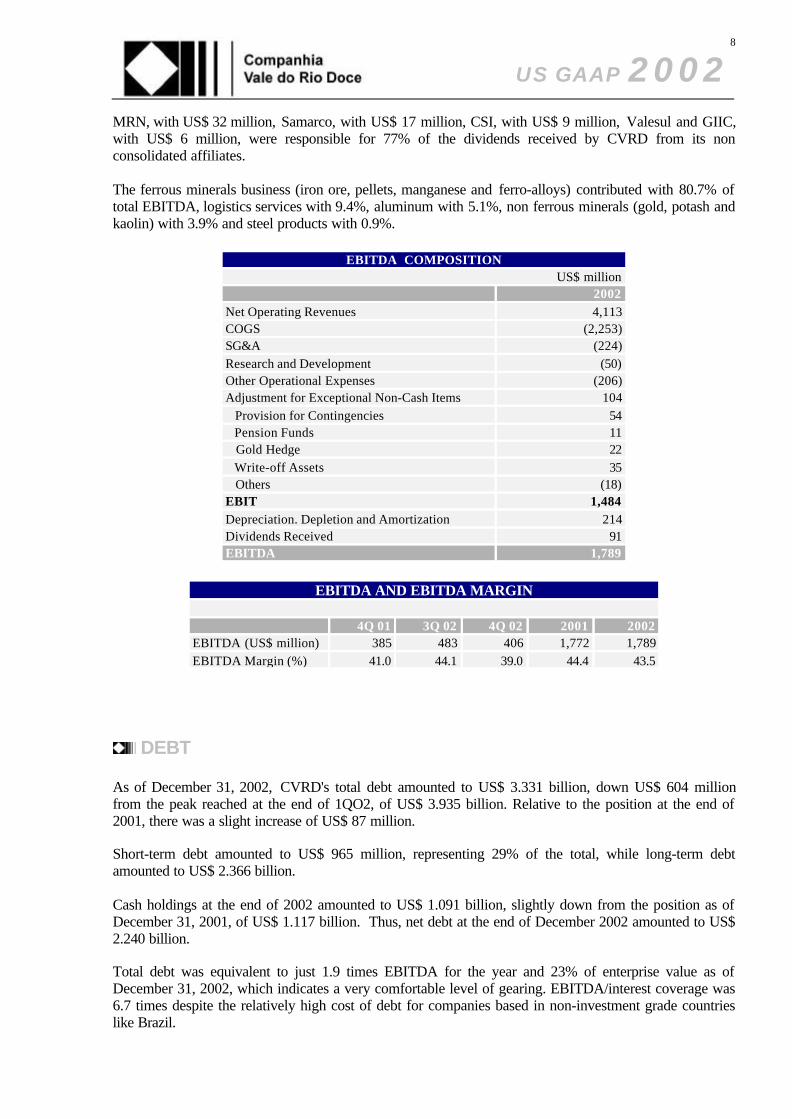
The ferrous minerals business (iron ore, pellets, manganese and ferro-alloys) contributed with 80.7% oftotal EBITDA, logistics services with 9.4%, aluminum with 5.1%, non ferrous minerals (gold, potash andkaolin) with 3.9% and steel products with 0.9%.
EBITDA COMPOSITIONUS$ million
2002Net Operating Revenues 4,113COGS (2,253)SG&A (224)Research and Development (50)Other Operational Expenses (206)Adjustment for Exceptional Non-Cash Items 104 Provision for Contingencies 54 Pension Funds 11 Gold Hedge 22 Write-off Assets 35 Others (18)EBIT 1,484Depreciation. Depletion and Amortization 214Dividends Received 91EBITDA 1,789
EBITDA AND EBITDA MARGIN
4Q 01 3Q 02 4Q 02 2001 2002EBITDA (US$ million) 385 483 406 1,772 1,789EBITDA Margin (%) 41.0 44.1 39.0 44.4 43.5
DEBT
As of December 31, 2002, CVRD's total debt amounted to US$ 3.331 billion, down US$ 604 millionfrom the peak reached at the end of 1QO2, of US$ 3.935 billion. Relative to the position at the end of2001, there was a slight increase of US$ 87 million.
Short-term debt amounted to US$ 965 million, representing 29% of the total, while long-term debtamounted to US$ 2.366 billion.
Cash holdings at the end of 2002 amounted to US$ 1.091 billion, slightly down from the position as ofDecember 31, 2001, of US$ 1.117 billion. Thus, net debt at the end of December 2002 amounted to US$2.240 billion.
Total debt was equivalent to just 1.9 times EBITDA for the year and 23% of enterprise value as ofDecember 31, 2002, which indicates a very comfortable level of gearing. EBITDA/interest coverage was6.7 times despite the relatively high cost of debt for companies based in non-investment grade countrieslike Brazil.

US GAAP 20029
DEBT INDICATORSUS$ million
2001 2002Gross Debt 3,244 3,331Net Debt 2,127 2,240Gross Debt / LTM EBITDA (x) 1.83 1.86EBITDA / Interest Coverage (x) 7.32 6.65Gross Debt / Total Assets (x) 0.26 0.23
US GAAP 200210
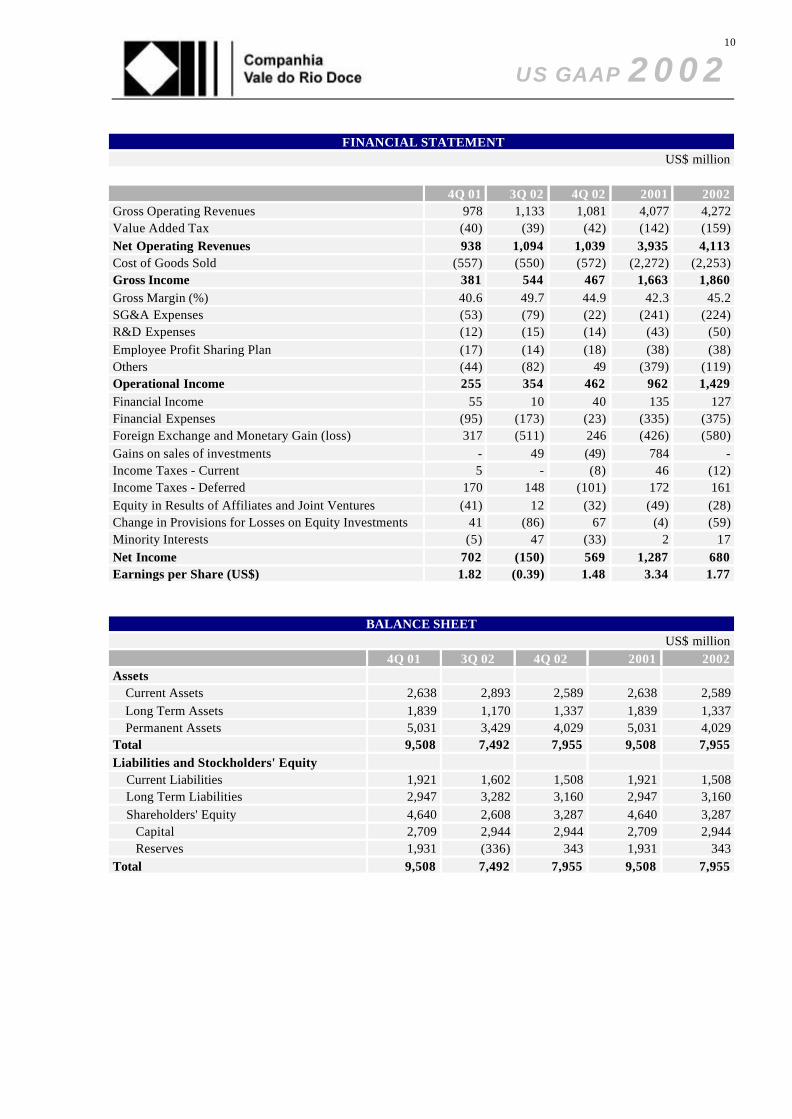
FINANCIAL STATEMENTUS$ million
4Q 01 3Q 02 4Q 02 2001 2002Gross Operating Revenues 978 1,133 1,081 4,077 4,272Value Added Tax (40) (39) (42) (142) (159)Net Operating Revenues 938 1,094 1,039 3,935 4,113Cost of Goods Sold (557) (550) (572) (2,272) (2,253)Gross Income 381 544 467 1,663 1,860Gross Margin (%) 40.6 49.7 44.9 42.3 45.2SG&A Expenses (53) (79) (22) (241) (224)R&D Expenses (12) (15) (14) (43) (50)Employee Profit Sharing Plan (17) (14) (18) (38) (38)Others (44) (82) 49 (379) (119)Operational Income 255 354 462 962 1,429Financial Income 55 10 40 135 127Financial Expenses (95) (173) (23) (335) (375)Foreign Exchange and Monetary Gain (loss) 317 (511) 246 (426) (580)Gains on sales of investments - 49 (49) 784 -Income Taxes - Current 5 - (8) 46 (12)Income Taxes - Deferred 170 148 (101) 172 161Equity in Results of Affiliates and Joint Ventures (41) 12 (32) (49) (28)Change in Provisions for Losses on Equity Investments 41 (86) 67 (4) (59)Minority Interests (5) 47 (33) 2 17Net Income 702 (150) 569 1,287 680Earnings per Share (US$) 1.82 (0.39) 1.48 3.34 1.77
BALANCE SHEETUS$ million
4Q 01 3Q 02 4Q 02 2001 2002Assets Current Assets 2,638 2,893 2,589 2,638 2,589 Long Term Assets 1,839 1,170 1,337 1,839 1,337 Permanent Assets 5,031 3,429 4,029 5,031 4,029Total 9,508 7,492 7,955 9,508 7,955Liabilities and Stockholders' Equity Current Liabilities 1,921 1,602 1,508 1,921 1,508 Long Term Liabilities 2,947 3,282 3,160 2,947 3,160 Shareholders' Equity 4,640 2,608 3,287 4,640 3,287 Capital 2,709 2,944 2,944 2,709 2,944 Reserves 1,931 (336) 343 1,931 343Total 9,508 7,492 7,955 9,508 7,955
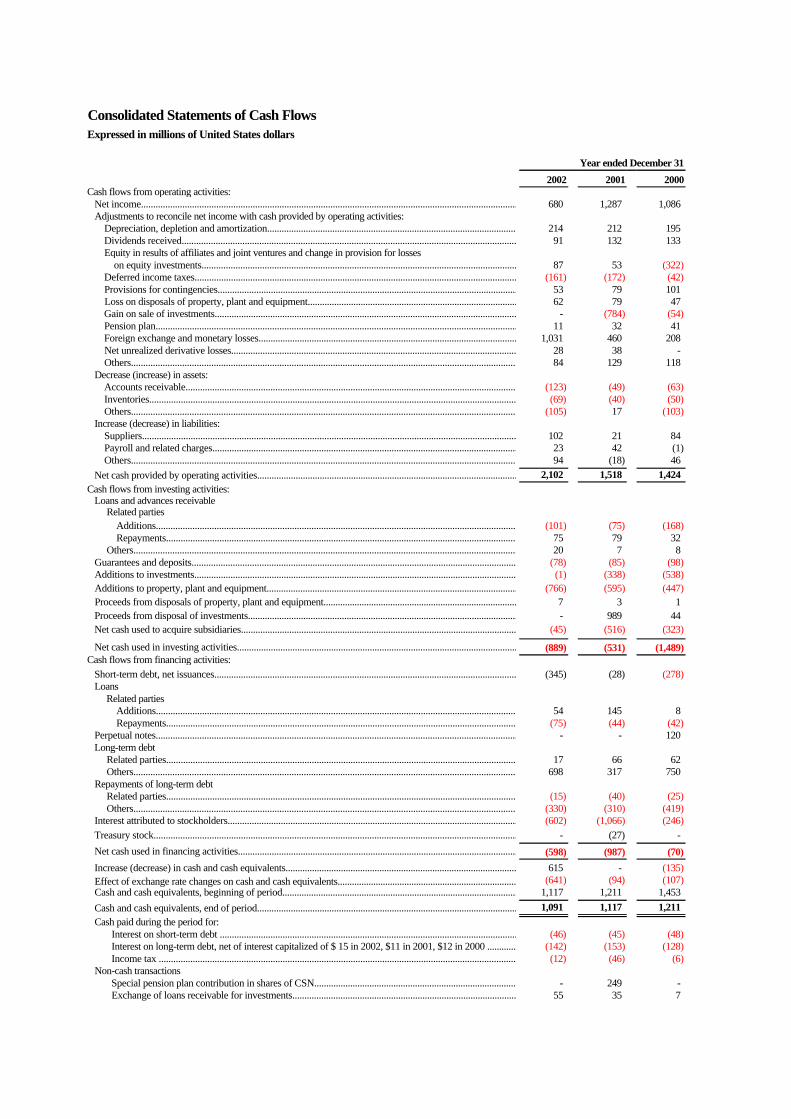
Consolidated Statements of Cash FlowsExpressed in millions of United States dollars
Year ended December 31
2002 2001 2000Cash flows from operating activities: Net income.................................................................................................................................................................................................680 1,287 1,086 Adjustments to reconcile net income with cash provided by operating activities: Depreciation, depletion and amortization........................................................................................................................................................................214 212 195 Dividends received.......................................................................................................................................................................................................................................91 132 133 Equity in results of affiliates and joint ventures and change in provision for losses on equity investments................................................................................................................................................................................................................................87 53 (322) Deferred income taxes........................................................................................................................................................................................(161) (172) (42) Provisions for contingencies........................................................................................................................................................................53 79 101 Loss on disposals of property, plant and equipment........................................................................................................................................................................62 79 47 Gain on sale of investments...................................................................................................................................... - (784) (54) Pension plan........................................................................................................................................................................11 32 41 Foreign exchange and monetary losses........................................................................................................................................................................1,031 460 208 Net unrealized derivative losses.......................................................................................................................................................................28 38 - Others......................................................................................................................................................................................................84 129 118 Decrease (increase) in assets: Accounts receivable....................................................................................................................................................................................................................................(123) (49) (63) Inventories........................................................................................................................................................................(69) (40) (50) Others......................................................................................................................................................................................................(105) 17 (103) Increase (decrease) in liabilities: Suppliers......................................................................................................................................................................................................102 21 84 Payroll and related charges......................................................................................................................................................................................................23 42 (1) Others......................................................................................................................................................................................................94 (18) 46 Net cash provided by operating activities.........................................................................................................................2,102 1,518 1,424 Cash flows from investing activities: Loans and advances receivable Related parties Additions........................................................................................................................................................................(101) (75) (168) Repayments........................................................................................................................................................................75 79 32 Others......................................................................................................................................................................................................20 7 8 Guarantees and deposits........................................................................................................................................................................(78) (85) (98) Additions to investments........................................................................................................................................................................(1) (338) (538) Additions to property, plant and equipment........................................................................................................................................................................(766) (595) (447) Proceeds from disposals of property, plant and equipment.............................................................................................. 7 3 1 Proceeds from disposal of investments..................................................................................................................................- 989 44 Net cash used to acquire subsidiaries........................................................................................................................................................................(45) (516) (323) Others......................................................................................................................................................................................................- - - Net cash used in investing activities...........................................................................................................................................................(889) (531) (1,489)Cash flows from financing activities: Short-term debt, net issuances..................................................................................................................................................(345) (28) (278) Loans Related parties Additions........................................................................................................................................................................54 145 8 Repayments.........................................................................................................................................................................................(75) (44) (42) Perpetual notes................................................................................................................................................................................................................- - 120 Long-term debt Related parties........................................................................................................................................................................17 66 62 Others........................................................................................................................................................................................................................698 317 750 Repayments of long-term debt Related parties........................................................................................................................................................................(15) (40) (25) Others........................................................................................................................................................................................................................(330) (310) (419) Interest attributed to stockholders...........................................................................................................................................(602) (1,066) (246) Treasury stock........................................................................................................................................................................- (27) - Net cash used in financing activities..................................................................................................................................(598) (987) (70)
Increase (decrease) in cash and cash equivalents......................................................................................................................................615 - (135) Effect of exchange rate changes on cash and cash equivalents.................................................................................... (641) (94) (107) Cash and cash equivalents, beginning of period..........................................................................................................................1,117 1,211 1,453 Cash and cash equivalents, end of period..............................................................................................................................1,091 1,117 1,211 Cash paid during the period for: Interest on short-term debt .........................................................................................................................................(46) (45) (48) Interest on long-term debt, net of interest capitalized of $ 15 in 2002, $11 in 2001, $12 in 2000 ....................................................................................(142) (153) (128) Income tax ...........................................................................................................................................................................(12) (46) (6) Non-cash transactions Special pension plan contribution in shares of CSN.............................................................................................................- 249 - Exchange of loans receivable for investments....................................................................................................................................................55 35 7
US GAAP 200212
CAPITAL EXPENDITURE IN 2002
CVRD's strong operational cash generation allows growth initiatives to be judged on their merits, freefrom the influence of short-term liquidity problems.
Investment realised in 2002 amounted to US$ 898.2 million. Discounting acquisitions this year, capitalexpenditure amounted to US$ 803.1 million.
The largest tranche of investment realised in 2002, US$ 435.1 million, was allocated to projects.
US$ 328 million was spent on the ferrous mining business, US$ 136.2 million of which was invested inprojects. US$ 81.6 million was spent on the construction of the São Luiz pellet plant and its supportinginfrastructure - the plant entering into service in the second half of the year. US$ 35.1 million was spenton expanding the transport capacity in the Northern System to increase the rate at which iron ore can becarried away from the mines. This included the construction of Pier III at the port of Ponta da Madeiraand the construction and enlargement of the iron ore stockyards, in which US$ 18.4 million and US$ 14.8million was invested, respectively.
The manganese and ferro-alloy companies carried out investment of approximately US$ 19.0 million, ofwhich US$ 3.1 million was spent on converting the SIBRA III plant from producer of silicon basedmetals to a producer of manganese alloys.
US$68.4 million was allocated to logistics projects, US$ 28.3 million in the purchase of locomotives, andUS$ 30.2 million in the enlargement of general cargo handling capacity in the Southern System.
US$ 75.8 million was invested in the development of the Sossego copper project, begun in April andwhich is expected to begin operations in the middle of 2004, marking CVRD’s into a new market. InJune, CVRD acquired total control of Salobo Metais, part of the Salobo project, from Anglo American,for US$ 50.9 million.
In the aluminum area, US$ 63.9 million was spent in the second half of 2002 on expanding aluminaproduction capacity from 1.6 million tons a year to 2.4 million tons. The works were completed inJanuary 2003 and the plant is now operating, on an experimental basis, using the new capacity.
The project to expand capacity at the Taquari-Vassouras potash mine in the state of Sergipe, in 2002required US$ 7.9 million. The new production capacity, of 850,000 tpa, is expected to come on streamtowards the middle of 2005.
Construction of the hydroelectric plants involved investment of US$ 78.1 million. Most of this was spenton the plants at Aimorés (US$ 40.2 million) and Candonga (US$ 16.4 million) and the completion ofFunil (US$ 17.2 million), which entered into service in December 2002. Candonga, which will have acapacity of 140 MW, and Aimorés, with 330 MW, are scheduled to enter into service at the end of 2003.
US$ 47.1 million was injected into Celmar, with the aim of paying off the capital and interest on a long-term loan and maintaining forestry plantation activity. The assets of Celmar are to be integrated with theproject to produce pig iron in the North of Brazil.
Investments in maintenance and environmental protection amounted to US$ 238.1 million, most of whichwas spent on landfill and improving the areas around the iron ore mines and the Company’s logisticsroutes.
The Company invested US$ 32.1 million in mineral prospecting during the year, continuing its search fornew deposits of copper, nickel, gold, platinum and zinc, among others. In addition to this, US$ 12.9

US GAAP 200213
million was invested by the BNDES, under the Mineral Risks Contract agreement, which amounted toUS$ 45.0 million in 2002.
A further US$ 14.2 million was invested in information technology and US$ 6.9 million in technologicalresearch.
CAPITAL EXPENDITURES* - 2002
By business area US$ million % By category US$ million %
Ferrous Minerals 328.0 36.5% Capital Injections 76.7 8.5%
Logistics 143.1 15.9% Maintenance 238.1 26.5%
Non-Ferrous Minerals 150.1 16.7% Projects 435.1 48.4%
Energy 81.8 9.1% Mineral Exploration 32.1 3.6%
Aluminum 109.8 12.2% Information Technology 14.2 1.6%
Others 85.5 9.5% Technological Research 6.9 0.8%
Acquisitions 95.1 10.6%
Total 898.2 100% Total 898.2 100%
* Consolidated CAPEX according to US GAAP criteria.

US GAAP 200214
IRON ORE AND PELLETS – FINANCIAL INDICATORS – NON AUDITEDUS$ million
HISPANOBRAS 4Q 01 3Q 02 4Q 02 2001 2002Sales (thousand tons) 998 686 1,139 3,608 3,567 Foreign Market 148 166 313 1,218 1,321 Domestic Market 850 520 826 2,390 2,246Average Price (US$/ton) 31.12 32.07 25.80 31.42 29.77
Net Operating Revenues 31 24 31 113 110Cost of Goods Sold (25) (20) (29) (92) (94)Financial Results 1 1 - 1 1Net Earnings 2 4 1 10 10Gross Margin (%) 19.4 16.7 6.5 18.6 14.5EBITDA 4 5 1 20 16EBITDA Margin (%) 12.9 20.8 3.2 17.7 14.5NIBRASCO 4Q 01 3Q 02 4Q 02 2001 2002Sales (thousand tons) 1,371 1,842 2,116 6,993 7,215 Foreign Market 432 290 733 2,311 2,166 Domestic Market 939 1,552 1,333 4,682 5,049Average Price (US$/ton) 27.90 25.96 28.52 29.80 28.64
Net Operating Revenues 38 52 61 208 210Cost of Goods Sold (34) (47) (52) (180) (185)Financial Results 1 - (1) (1) (3)Net Earnings (15) 2 3 (4) 7Gross Margin (%) 10.5 9.6 14.8 13.5 11.9EBITDA (13) 6 9 26 27EBITDA Margin (%) (34.2) 11.5 14.8 12.5 12.9Gross Debt (in US$ million) - Short Term 2 2 2 2 2 - Long Term 4 2 1 4 1Total 6 4 3 6 3ITABRASCO 4Q 01 3Q 02 4Q 02 2001 2002Sales (thousand tons) 995 815 913 3,287 3,307 Foreign Market 700 572 431 2,247 2,180 Domestic Market 295 243 482 1,040 1,127Average Price (US$/ton) 31.90 30.06 30.18 31.72 29.51
Net Operating Revenues 27 26 27 100 100Cost of Goods Sold (22) (23) (25) (81) (89)Financial Results (2) 5 (2) 1 6Net Earnings 1 3 2 9 9Gross Margin (%) 18.5 11.5 7.4 19.0 11.0EBITDA 4 1 1 17 5EBITDA Margin (%) 14.8 3.8 3.7 17.0 5.0Gross Debt (in US$ million) - Short Term - - - - - - Long Term 1 15 - 1 -Total 1 15 - 1 -
US GAAP 200215
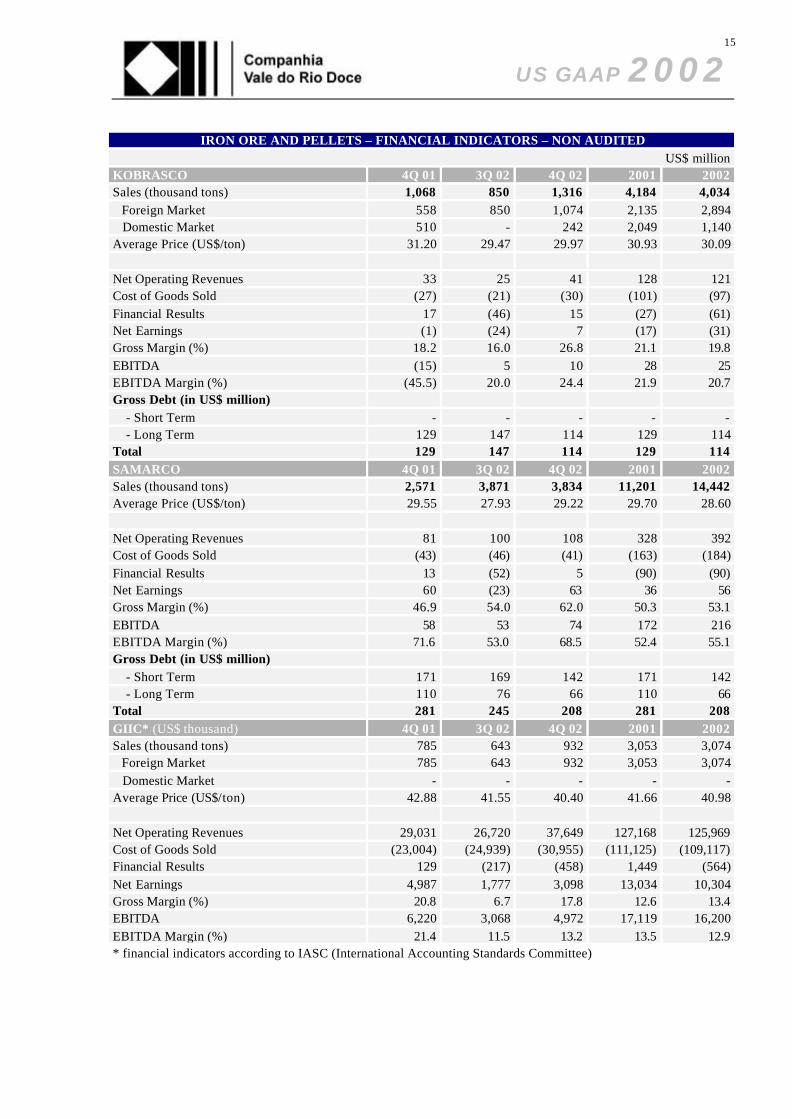
IRON ORE AND PELLETS – FINANCIAL INDICATORS – NON AUDITEDUS$ million
KOBRASCO 4Q 01 3Q 02 4Q 02 2001 2002Sales (thousand tons) 1,068 850 1,316 4,184 4,034 Foreign Market 558 850 1,074 2,135 2,894 Domestic Market 510 - 242 2,049 1,140Average Price (US$/ton) 31.20 29.47 29.97 30.93 30.09
Net Operating Revenues 33 25 41 128 121Cost of Goods Sold (27) (21) (30) (101) (97)Financial Results 17 (46) 15 (27) (61)Net Earnings (1) (24) 7 (17) (31)Gross Margin (%) 18.2 16.0 26.8 21.1 19.8EBITDA (15) 5 10 28 25EBITDA Margin (%) (45.5) 20.0 24.4 21.9 20.7Gross Debt (in US$ million) - Short Term - - - - - - Long Term 129 147 114 129 114Total 129 147 114 129 114SAMARCO 4Q 01 3Q 02 4Q 02 2001 2002Sales (thousand tons) 2,571 3,871 3,834 11,201 14,442Average Price (US$/ton) 29.55 27.93 29.22 29.70 28.60
Net Operating Revenues 81 100 108 328 392Cost of Goods Sold (43) (46) (41) (163) (184)Financial Results 13 (52) 5 (90) (90)Net Earnings 60 (23) 63 36 56Gross Margin (%) 46.9 54.0 62.0 50.3 53.1EBITDA 58 53 74 172 216EBITDA Margin (%) 71.6 53.0 68.5 52.4 55.1Gross Debt (in US$ million) - Short Term 171 169 142 171 142 - Long Term 110 76 66 110 66Total 281 245 208 281 208GIIC* (US$ thousand) 4Q 01 3Q 02 4Q 02 2001 2002Sales (thousand tons) 785 643 932 3,053 3,074 Foreign Market 785 643 932 3,053 3,074 Domestic Market - - - - -Average Price (US$/ton) 42.88 41.55 40.40 41.66 40.98
Net Operating Revenues 29,031 26,720 37,649 127,168 125,969Cost of Goods Sold (23,004) (24,939) (30,955) (111,125) (109,117)Financial Results 129 (217) (458) 1,449 (564)Net Earnings 4,987 1,777 3,098 13,034 10,304Gross Margin (%) 20.8 6.7 17.8 12.6 13.4EBITDA 6,220 3,068 4,972 17,119 16,200EBITDA Margin (%) 21.4 11.5 13.2 13.5 12.9* financial indicators according to IASC (International Accounting Standards Committee)

US GAAP 200216
ALUMINUM - SELECTED FINANCIAL INDICATORS - ADJUSTED AND NON AUDITEDUS$ million
MRN 4Q 01 3Q 02 4Q 02 2001 2002Sales (thousand tons) 3,175 2,555 2,982 10,952 9,928 Foreign Market 992 740 601 3,413 2,616 Domestic Market 2,183 1,815 2,381 7,539 7,312Average Price (US$/ton) 21.67 12.46 20.54 20.63 18.95
Net Operating Revenues 62 43 55 211 173Cost of Goods Sold (31) (30) (29) (111) (107)Financial Results (1) - - (1) (1)Net Earnings 28 30 17 81 94Gross Margin (%) 50.0 30.2 47.3 47.4 38.2EBITDA 40 27 36 131 101EBITDA Margin (%) 64.5 62.8 65.5 62.1 58.4Gross Debt (in US$ million) - Short Term 1 23 29 1 29 - Long Term 22 78 76 22 76Total 23 101 105 23 105ALBRAS 4Q 01 3Q 02 4Q 02 2001 2002Sales (thousand tons) 70 104 104 332 406 Foreign Market 66 101 100 317 393 Domestic Market 4 3 4 15 13Average Price (US$/ton) 1,282.77 1,289.68 1,306.47 1,428.99 1,306.38
Net Operating Revenues 91 132 136 472 529Cost of Goods Sold (60) (79) (78) (281) (316)Financial Results 86 (153) 56 (121) (231)Net Earnings 80 (73) 135 51 20Gross Margin (%) 34.1 40.2 42.6 40.5 40.3EBITDA 34 59 57 195 219EBITDA Margin (%) 37.4 44.7 41.9 41.3 41.4Gross Debt (in US$ million) - Short Term 183 20 20 183 20 - Long Term 450 499 466 450 466Total 633 519 486 633 486VALESUL 4Q 01 3Q 02 4Q 02 2001 2002Sales (thousand tons) 16 19 27 76 90 Foreign Market 5 8 13 23 42 Domestic Market 11 11 14 53 48Average Price (US$/ton) 1,757.16 1,654.96 1,618.98 1,880.19 1,661.77
Net Operating Revenues 26 30 40 129 139Cost of Goods Sold (19) (20) (27) (91) (99)Financial Results (1) - - (4) (1)Net Earnings 3 6 10 19 25Gross Margin (%) 26.9 33.3 32.5 29.5 28.8EBITDA 6 9 14 36 38EBITDA Margin (%) 23.1 30.0 35.0 27.9 27.3Gross Debt (in US$ million) - Short Term 1 1 1 1 1 - Long Term 2 1 1 2 1Total 3 2 2 3 2
US GAAP 200217
“This press release may contain statements that express management’s expectations about future events or results rather thanhistorical facts, These forward-looking statements involve risks and uncertainties that could cause actual results to differ materiallyfrom those projected in forward-looking statements. and CVRD cannot give assurance that such statements will prove correct,These risks and uncertainties include factors: relating to the Brazilian economy and securities markets. which exhibit volatility andcan be adversely affected by developments in other countries; relating to the iron ore business and its dependence on the globalsteel industry. which is cyclical in nature; and relating to the highly competitive industries in which CVRD operates, For additionalinformation on factors that could cause CVRD’s actual results to differ from expectations reflected in forward-looking statements.please see CVRD’s reports filed with the Comissão de Valores Mobiliários and the U,S, Securities and Exchange,”