performance of an active noise control system for … · this report describes an active noise...
TRANSCRIPT

NASA/TM--2000-210229 AIAA-2000-1906
Performance of an Active Noise Control
System for Fan Tones Using Vane Actuators
Daniel L. Sutliff
AYT Corporation, Brook Park, Ohio
Alan R.D. Curtis
Materials System, Inc., Littleton, Massachusetts
Laurence J. Heidelberg
Glenn Research Center, Cleveland, Ohio
Paul J. Remington
BBN Technologies, Cambridge, Massachusetts
Prepared for the6th Aeroacoustics Conference and Exhibit
cosponsored by the American Institute of Aeronautics and Astronautics
and the Confederation of European Aerospace Societies
Lahaina, Hawaii, June 12-14, 2000
National Aeronautics and
Space Administration
Glenn Research Center
July 2000
https://ntrs.nasa.gov/search.jsp?R=20000085868 2018-07-30T21:38:32+00:00Z

NASA Center for Aerospace Information7121 Standard Drive
Hanover, MD 21076Price Code: A03
Available from
National Technical Information Service
5285 Port Royal RoadSpringfield, VA 22100
Price Code: A03

PERFORMANCE OF AN ACTIVE NOISE CONTROL SYSTEM FOR FAN TONESUSING VANE ACTUATORS
Daniel L. Sutliff
Research Engineer, Senior Member AIAA
AYT Corporation
NASA Glenn Research Center, MS 77-6
21000 Brookpark Road
Cleveland, OH 44135
Alan R.D. Curtis
Technology Manager
Materials System, Inc
521 Great Road
Littleton, MA 01460
Laurence J. Heidelberg
Senior Research Engineer, Senior Member AIAA
NASA Glenn Research Center, MS 77-6
21000 Brookpark Road
Cleveland, OH 44135
Paul J. Remington
Principal Engineer
BBN Technologies, Mail Stop 15/2a
70 Fawcett Street
Cambridge, MA 02318
Abstract
An Active Noise Control (ANC) system for ducted fan noise was built that uses actuators located in stator vanes. The custom
designed actuators were piezoelectric benders manufactured using THUNDER technology. The ANC system was tested in the
NASA Active Noise Control Fan rig. A total of 168 actuators in 28 stator vanes were used (six per vane). Simultaneous inlet
and exhaust acoustic power level reductions were demonstrated for a fan modal structure that contained two radial modes in each
direction. Total circumferential mode power levels were reduced by up to 9 dB in the inlet and 3 dB in the exhaust. The
corresponding total 2BPF tone level reductions were by 6 dB in the inlet and 2 dB in the exhaust. Farfield sound pressure level
reductions of up to 17 dB were achieved at the peak mode lobe angle. The performance of the system was limited by the
constraints of the power amplifiers and the presence of control spillover. Simpler control/actuator systems using carefully
selected subsets of the full system and random simulated failures of up to 7% of the actuators were investigated. (The actuators
were robust and none failed during the test). Useful reductions still occurred under these conditions.
Introduction-
A goal of the NASA Advanced Subsonic Technology
Noise Reduction Program is the reduction in transport
aircraft EPNL attributed to the engine source by 6 dB
relative to 1992 technology. A component of EPNL is
fan tone noise caused by rotor-stator interaction and
duct modal propagation.
A unique characteristic of turbomachinery noise is the
modal structure. The acoustic waveform is three-
dimensional and highly complex, and is best described
as a spinning mode _. Knowledge of these spinning
modes is important to identify the generation
mechanism and to successfully apply noise control.
Previous work has shown the potential for modal
control to reduce the tone levels of ducted fans.
Theoretical and experimental work has shown that
Active Noise Control (ANC) can significantly reduce
the tone levels of ducted fans. NASA Glenn Research
Center's (GRC) Active Noise Control Fan (ANCF)
serves as a test bed to verify proposed ANC
technologies 2_. The tonal nature of rotor-stator
NASA/TM--2000-210229 1

interaction noise makes ANC a potentially attractive
solution. Prior experimental investigations of activenoise control used acoustic actuators mounted in the
duct walls to reflect or absorb interaction modes 4'_.
Vane actuators offer a method of applying active noise
control at the acoustic source. The unsteady forces ofthe fan wake passing over the vane and the acousticsources of the vane actuators are at the same location so
there is a potential benefit over active noise control
systems that use actuators in the duct walls. Vane-
mounted actuators require less axial space than an
equivalent wall-mounted array, a significant attractionconsidering the trend toward shorter ducts on turbofan
engines. Analytical studies _ of the active control of fan
noise using vane actuators have suggested that the
technique may be feasible.
This report describes an active noise control system that
uses vane actuators and the demonstration of the system
on the NASA ANCF test rig at NASA GRC. The rotor-
stator interaction modes at twice blade passing
frequency (2BPF) were the target of the active control.
The ANCF was configured with 28 vanes to generate
the circumferential mode, m=2, at 2BPF. The (4,0) and
t4,1) radials propagated in the inlet and the exhaust
over the fan speed range of interest.
A NASA contractor report more fully documents the
background and investigation from which this studyarose 7.
Experimental Apparatus
ANCF Facility
ANCF Test Rig
The NASA Active Noise Control Fan 2 rig (figure 1 ) is
located in the Aeroacoustic Propulsion Laboratory atthe NASA Glenn Research Center. A sixteen-blade
four-foot diameter fan is enclosed in a fan duct that is
cantilevered from a support structure. The fan is driven
by a shaft that runs through a center body. No internal
struts are required since the center body and duct walls
are fixed to the support structure. (Internal struts couldaffect the fan/stator interaction acoustic modes of the
duct, resulting in a more complicated mode structure.)Inflow and turbulence distortions that would introduce
asymmetric force loading of the blades are minimizedby an inflow control device (ICD) at the inlet. A set ofstator vanes is cantilevered from a central hub structure.
For these tests, the fan blades were set at an angle of 40
degrees. The twenty-eight stator vanes with the
actuator were installed with a 2.25-inch spacingbetween the fan blades and stator vanes.
In-Duct Measurements
In-duct levels were measured using the NASA rotating
rake modal measurement system that allowed the effect
of the ANC on each propagating mode to be
independently measured _. Time domain averaging is
used to reduce noise unsynchronized to fan rotation and
narrow band spectra are used to extract the magnitude
and phase of each m-order component for each
microphone. Different m-orders appear as distinct
spectral lines frequency shifted due to Doppler effects.
A set Bessel functions appropriate to the m-order is
then fitted to the data in a least square sense to obtainthe radial mode content. There are two rake
microphone arrays for the ANCF, a seven-microphone
array for the inlet and a six-microphone array for theexhaust. A gear mechanism rotates the rakes at one-
hundredth the rate of the fan (only one rake is installed
at a time.) The microphone signals are sampledsynchronously with the rotation of the fan and hence
synchronously with the interaction spinning acousticmodes generated by the fan.
The result of the rake processing is a set of complexspinning mode amplitudes at the rake locations 3. It isassumed that reflections from duct terminations are
negligible and that the spinning mode amplitudes
represent the amplitudes of modes propagating from fanto the duct termination, and then radiating to the farfield.
Far Field Measurements
Although the reductions of sound level in the fan duct
are of significance and provide the primary analysis, the
objective of fan noise control is the reduction of thenoise radiated to observers in the far field. The ANCF
rig was positioned in the center of the anechoic dome in
order to measure the farfield directivity. The radiated
sound field is measured at an array of 28 microphones
placed in the plane of the fan duct and around asemicircle with a radius of 50 feet. Narrow-band
spectral analysis was used to detect all tonal
components in the sound field at each microphone and
BPF, 2BPF and 3BPF components were extracted. Thefar field data for each harmonic can be used to
determine the directivity of the radiation pattern.
Active Noise Control System
Vane Actuators
An earlier study evaluated the feasibility of potentialactuator technologies for active noise control 9. This
study concluded that although active noise control offan noise by vane actuators is feasible, no actuator
available at the time met the severe noise levels and
NASA/TM--2000-210229 2

environmentrequirementsof a commercialturbofanengineandthatdevelopmentof suchactuatorswasrequired.
Therequirementsfor theNASAANCF are less severe
but still demanding. The basic requirement is that theactuator must make enough noise. In order to be able to
cancel the sound produced by rotor-stator interaction,
the actuator must be capable of making at least the samelevel of sound. The actuator must also fit within the
confines of the vane profile and at least two actuators
must be placed across the chord at a given radiallocation to control two directions. Estimates of the
displacements required were available from a simulation
of a flat plate cascade model of a vane set using a two-
dimensional fluid dynamics simulation code.
There are other engineering requirements including
cost, reliability, power consumption, structural
integrity, environmental requirements including
temperature tolerance, and system integrationconsiderations not considered in this investigation.
THUNDER Introduction
THUNDER _° is an actuator technology invented at
NASA Langley Research Center. The acronym stands
for THin UNimorph DrivEr and sensoR.
A THUNDER actuator is a composite of three thin
layers, a metal base, a piezoelectric wafer, and a metal
top cover, bonded together under pressure and at high
temperature with the LaRC SI polyimide adhesive.
When a voltage is applied between the metal layers
across the piezo-electric transducer (PZT) it expands,
and the differential in-plane stresses cause the actuator
to bend or generate a force. The very high bond
strength created by the use of the polyimide and the
manufacturing process results in a very robust device
that can be taken to high strains without fracture. The
high displacement capability led to some initial
investigations into the feasibility of the use ofTHUNDER devices as vane actuators for the ANCF.
At the time of the investigation, no physical models of
THUNDER actuators were available, and in order to
understand the mechanism and properties of the
devices, a series of models were constructed and
experimentally verified 7. An understanding of the basicmechanisms allowed educated design of devices to
meet a given specification. However, as was
discovered early in the development process, the details
of each physical device and in particular the method offixing the device to a support have a great deal of
variability that makes accurate prediction of
performance problematic.
Actuator Performance Properties
The drive level dependent properties of the PZT
material are apparent when the actuator displacement
sensitivities are examined. Figure 2 illustrates this
behavior. Figures 2a-c are for a prototype actuator
close to the final design. Figure 2d shows the vane
actuator amplifier output attached to a typical pair ofvane actuators.
The capacitance of the PZT material is drive dependent.This behavior can be seen in measurements of actuator
dynamic capacitance; that is the measured transfer
function between actuator voltage and charge. The
dynamic capacitance for a prototype actuator driven at10 and 100 Vrms at 1000 Hz doubles from around
70 nF to 140 nF. The transducer capacitance increases
approximately with the square of the current.
The capacitance non-linearity affects the actuator
sensitivity expressed in displacement per volt.
Figure 2a shows a graph of displacement output versus
voltage drive level for the prototype actuator driven at1000 Hz. The displacement/voltage sensitivity increases
with drive level as the resonance frequency drifts down
towards the drive frequency.
PZT is a charge device; an applied charge causes a
strain. The piezoelectric sensitivity expressed in terms
of displacement/charge is less sensitive to drive level.
Figure 2b shows a graph of displacement output versuscurrent drive level. The displacement/current sensitivity
is approximately uniform with drive level.
The variation in actuator displacement output resonance
with increasing voltage drive level is shown in
figure 2c. Note the decrease in resonance frequencywith increasing drive level. At high drive levels, this
actuator exceeds the design requirement of 25 _tm rms
displacement at 1000 Hz. However, at low levels theresonance frequency is above 1200 Hz, but at high
drive levels it has dropped to close to 1100 Hz.
Although the increase in displacement due to the
presence of the resonance is welcome (as long as allactuators in an array increase by the same amount), the
frequency shift has added approximately 45 degrees of
phase to the frequency response function. This added
phase could cause instability if not modeled by thecontroller.
At 100 Vrms drive level the sound pressure output wasmeasured at a level of 90 dB SPL for a 1 kHz sine wave
at 1 m in an anechoic chamber. The total harmonic
distortion was less than 26 dB. It is assumed that most
of that distortion was due to the power electronics andnot non-linearities in the actuator.
NASA/TM--2000-210229 3

Actuator Geometric Design
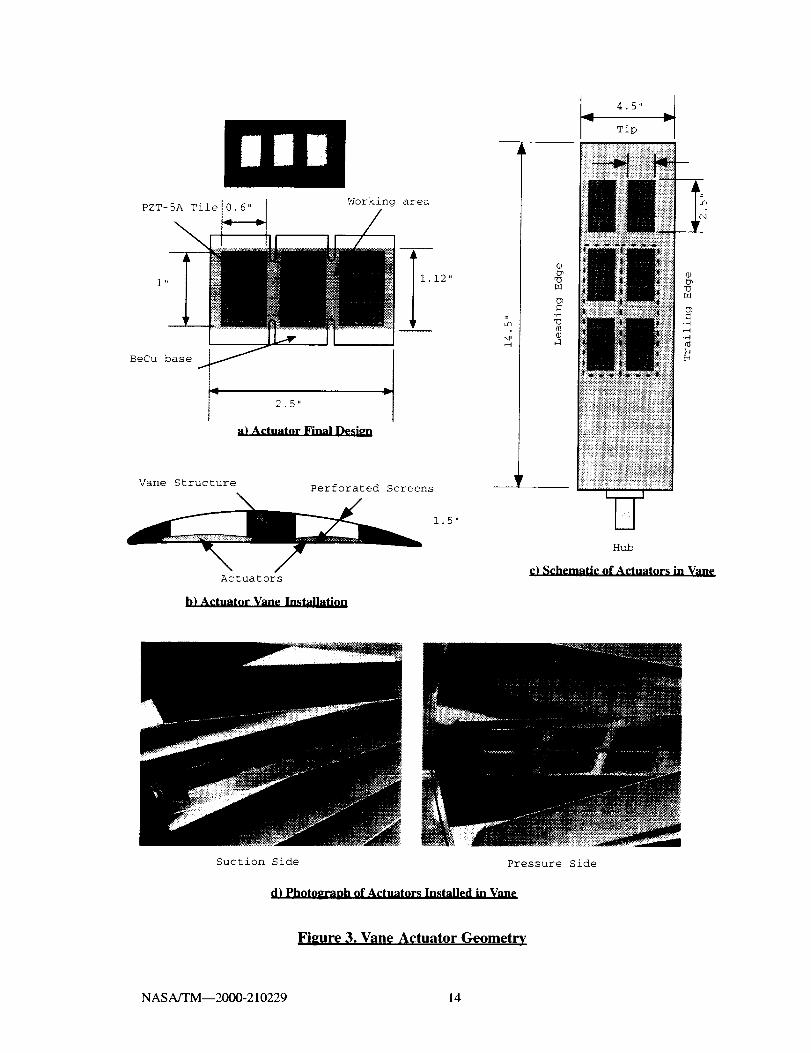
The final actuator design is illustrated in figure 3a.
Three PZT-5A tiles each one-inch long, 0.6 inches wide
and 0.007 inches thick are bonded to a Beryllium
Copper base 1.5 inches wide, 2.5 inches long and 0.010
inches thick. Not shown in the figure are the aluminum
top covers for each tile used to maintain flow quality
over the cavity. These were 0.001 inch thick and were
trimmed to leave a small border at each edge of the tile.
The design of three tiles in one unit was chosen to
select the required resonance frequency of 1200 Hz.
For the mounting method used, actuators with this
geometry have the required resonance for a length ofabout 1.1 inches, which was a convenient chordwise
dimension for an ANCF vane actuator. Experimental
experience suggested that actuators with a width-to-
length aspect ratio of 0.6:1 performed well. Other
aspect ratios either had too much thermal pre-stress
curvature or had less repeatable dynamic
characteristics. The three-tile design was a method of
combining three individual actuators with the right
dynamic characteristics to produce one device of the
width required for the vane. The small notches in the
long sides of the actuator are to relieve the thermal pre-
stress curvature in the long dimension.
Figure 3b is cross section of the vane illustrating theinstallation of the actuators in the vane. The actuator
inserted in a pocket machined in the vane and bonded to
a small retaining shelf. The actuator operates in dipole
mode, radiating sound to both pressure and suction
surfaces of the vane. The continuity of airflow over the
vane is maintained on each surface by a cover sheet
made from perforated metal bonded to the vane so that
it conforms to the airfoil profile and lies flush with thesurface.
The objective of the ANCF test was to cancel the
interaction modes simultaneously in the inlet andexhaust. It is not sufficient for the actuators to be
capable of producing the required level of sound: they
must be capable of creating the correct mix of modes
with the correct phase relationship. It is the phase
relationship that is most difficult to meet, and the
required actuator outputs may be much larger for a mix
of modes with a given phase than the same amplitude of
modes with arbitrary phase.
Four actuators per vane are required to cancel the four
propagating acoustic modes. The actuator displacement
and phase requirements depend on their locations in the
vane. In an effort in parallel to the actuator
development, the effect on actuator location was
studied using VO72 _ to provided guidance on the finallocation of the actuators. This rotor-stator interaction
noise code accommodates realistic annular geometries.
The code was modified to incorporate additional source
terms representing the vane actuators. The actuators
were modeled as rectangular patches simply supported
on four sides with a sinusoidal velocity distribution.
These dipole sources were introduced one at a time and
used to predict complex transfer functions between the
patch velocity and the resulting mode amplitudes.
A matrix of different patch sizes and locations
constrained by the physical limitations of the ANCF
vane and the prototype vane actuators was run. In orderto cancel both inlet and exhaust modes, two different
chord-wise locations are required and the geometry ofthe vane limited the width of the actuators to about one-
inch. Wider actuators than this were found less
effective. Optimal locations for the chordwise pairwere as far apart as possible with one close to the
leading edge and the other close to the trailing edge.
For each chordwise location, a pair of spanwise patcheswere used. These were initially matched to the radial
distribution of the disturbance modes. A shorter tipactuator was used to avoid crossing the node of the first
radial mode. To compensate, a longer hub actuator was
used. Optimal designs tended to make the tip actuatorabout 2.5 inches long and the hub actuator 5 inches
long. For practical reasons, it was desired to have a
single actuator design, and so the hub actuator was split
into two 2.5 inch devices driven with the same velocity
and separated by a suitable gap for the mountingstructure. Within these constraints the radial location of
the four actuators were varied and a solution with the
least maximum displacement required to cancel the
expected fan levels was chosen.
A diagram of the locations of the actuators within each
vane is shown in figure 3c. Figure 3d is a photographof actuators installed in a vane.
The required four circumferential arrays of actuatorswere thus constructed from a total of 168 actuators.
Each of the 28 vanes held 6 actuators with actuator #1
being the tip leading edge, #2 the tip trailing edge, #3a
the middle leading edge, #4a the middle trailing edge,
#3b the hub leading edge and #4b the hub trailing edge.
The hub pair of actuators on the leading edge, #3a and#3b, were driven as a pair with the same control signal
making effectively one actuator. In a similar way, the
inner pair on the trailing edge, #4a and #4b, was also
driven as a pair giving effectively four independentactuators on each vane.
NASA/TM--2000-210229

Power Amplifier Design
Power amplifiers were required to drive each of the 168
actuators. Many actuators were driven in pairs by the
same control signal enabling actuators pairing at the
power amplifiers. This reduced the amplifier
requirement to 84. The two inner actuator pairs on each
vane (#3a&b and #4a&b in fig. 3c) are required to
receive the same control signal so are naturally paired
to the output of one amplifier. The outer pair of
actuators poses more of a problem, as they are
individual devices that receive independent control
signals. Due to modal symmetry, an even mode such asm = 4, actuators in the same location of diametrically
opposite vanes receive the same control signal (in fact
actuators in every seventh vane receive the same
control signal) and it was decided to use these to form a
pair at the output of one amplifier channel.
Power amplifiers for PZT actuators such as the
THUNDER actuators are a predominantly reactive
electrical load; they present the equivalent load of a
capacitor to the amplifier. As no commercially
available amplifier was available, a custom designed
amplifier was built with each amplifier channel
designed to drive a pair of installed actuators. The
amplifiers are current drive devices, producing a givencurrent output for a given voltage input. The two
actuators driven by an amplifier were connected in
parallel to the amplifier output to ensure that the fullvoltage output of the amplifier was applied to each
actuator. The amplifier current and voltage output as a
function of voltage input when attached to a pair of
actuators is shown in figure 2d. The current output is
linear with voltage input: voltage output non-linear.
Current limiting resistors (150 rearms rms) were used
on the amplifiers to protect the transducers.
Calibration
In order to prevent control modal spillover, each
actuator in an array should have the same sensitivity.
Most of the variability in actuator output was reduced
by design of the mounting system and by careful
control of the manufacturing process. However, as isinevitable, some variation remained.
There were two methods of calibrating installed
actuators. Voltage/current ratios were taken as the
primary sensitivity measure. A front panel switch on
each amplifier rack enabled the monitoring of the
voltage and current supplied to the pair of actuators
attached to each amplifier channel. The gain of the
amplifier from voltage in to current out was trimmed by
a potentiometer on the front panel to ensure that each
actuator pair in an array received the same current for
the same drive signal.
Displacement/current sensitivity is only an indication ofthe true sensitivity between controller output voltage
and the acoustic output of an actuator. An acoustic
cavity calibrator was designed, with six microphones insix sealed cavities that could be fixed to the vane. Due
to the level dependent sensitivity of the actuators, it is
necessary to calibrate the actuators at close to full
output power and, although this method allowed an
approximate calibration to be performed, acoustic
cross-talk between actuators was significant and provedto be sensitive to vane location. A better method would
be required if a more accurate calibration were desired.
Fortunately, control spillover was low enough for the
system to demonstrate reasonable noise reductionlevels.
One issue with both the front panel trimming
potentiometer and the series trim capacitor is that they
limit the maximum output of the actuators. In array of
twenty-eight actuators, this means that in order to
calibrate the array, all channels have to be reduced to
the sensitivity of the actuator with the smallest
sensitivity. The maximum output of the array is
constrained to the maximum output of the weakestactuator.
Control System
Controller Requirements
A typical turbofan engine has many hundreds of
acoustic modes that could theoretically propagate. The
hundreds of actuators and independent control channels
that would be required for a full modal control system
would be impractical. Fortunately, the number of
modes generated by the fan is usually much less than
the total number that could propagate due to the
symmetries of rotor-stator interaction _. A control
system that uses a radially distributed array of actuators
can make use of the same geometry to couple into thesame set of modes as the fan source, with minimal
coupling to any of the other modes. Such a system
based on matched symmetrical actuator arrays results in
a much simpler controller.
Rotor-stator interaction kinematics allows only certain
circumferential mode orders to be generated and
propagate. The circumferential mode orders (m)
generated are related to the number of fan blades (B),the number of stator vanes (V), and the harmonic (h) of
BPF and are given by the formula:
m = hB - kV (k is any integer) [I]
NASA/TM--2000-210229 5

Anactivenoisecontrolsystemmusttake into account
the full set of acoustic modes that it could potentially
generate. In order to control any or all of the modes, a
modal active control system will require independent
control actuator channels equal to the number of modesit is desired to control.
A circumferential array of physically identical actuatorswith the same axial and radial coordinates can be driven
by a single control signal to produce a set of modes
with the same circumferential mode order. The signal
must be phased shifted appropriately for each actuator
position in the array. From the perspective of the
controller, the array is a single actuator. However, a
problem with such an actuator array is the phenomenon
of spatial aliasing. If an array of L actuators is driven to
generate a mode order m, it will also generate modes oforders:
.... m-2L,m-L,m,m+L,m+2L .... [2]
If the highest circumferential mode order that can
propagate is M, then at least
L > M + Im] [3]
actuators are required to avoid spatial aliasing.
An important observation is that a single actuator array
can independently control multiple m orders when the
outputs of two or more phased array signals aresummed at each actuator. The number of actuators
required is then based on the largest m order required.
If the fan blade and vane counts are chosen such that at
most one m order is cut-on (at least for lower harmonics
of BPF), then an array of actuators fully populating the
vanes will not alias into cut-on modes as it produces theidentical set of aliased modes as the vanes. Reduced
actuators arrays, e.g. a set with every other vane
containing an actuator, must more carefully considerthe aliased modes.
Although the source may only contain modes with one
or few m orders, these modes may contain more than
one radial order. In order to couple directly with a
given m order, a circumferential array must be placed at
the same radial location. To control multiple radial
orders multiple arrays are required. For the generalcase, these arrays must be located at either differentaxial or radial locations.
Arrays placed at the same radial location but different
axial locations, for example both on the duct wall, will
couple with a given radial order with the same
magnitude but different phase. This phase difference is
related to the axial phase speed of the mode and isdifferent for different orders. The number of axial
arrays required is equal to the number of radial modes
propagating in that circumferential mode. By a similar
argument, it is necessary to have two sets of arrays at
different axial locations to control modes that propagatein the two axial directions, i.e., the inlet and exhaustducts.
Similar arguments to those used to specify the actuator
requirements apply to specifying the sensor
requirements. In general, in order to sense each of the
modes of propagation, the same number of independent
sensor chan_'_cls is required. If it is known that only a
few independent modes are present, and the mode
characteristics are known, then only sensor channels to
resolve those modes are required. In theory, these
sensors need not be placed in either circumferential or
axial arrays; they can be individual sensors with somerestrictions on their locations.
Control Strategy for the ANCF Rig
The control strategy selected for the ANCF was based
on the requirements of the specific test conditions. TheANCF is four feet in diameter and has 16 blades.
Nominal fan rotational speed is 1886 RPM, resulting in
-500 Hz BPF tone and -I000 Hz 2BPF. Twenty-eight
fan exit guide vanes were selected for the vane actuatortests. The number of stator vanes was selected so that
the BPF tone of fan/stator interaction was cut-off. The
rotor-stator interaction mode at 2BPF is m = 4, of
which the first two radial modes (4,0) and (4,1) are cut-
on at 1000 Hz. There are a total of four independent
fan modes at 2BPF including modes that propagate bothfore and aft.
Actuator Phasing
The four circumferential arrays of actuators are driven
by four independent controller output signals. In order
to drive an m = 4 mode, the signal to each of the 28
vanes in an array must be phased appropriately for the
location of the vane. The required increment of phase
for an m = 4 mode is -_/Tn. For each array the actuator
in the same vane relative to each quadrant, every
seventh vane, will receive the same phased control
signal; seven independent signals are required for each
control channel and its associated array.
The distribution of the 28 outputs of the actuator array
processor to the 84 inputs of the power amplifiers was
implemented by distributing the filter outputs to the
correct amplifier inputs. Each inner array has two
actuators per vane; each inner array control signal
drives four amplifier inputs and eight actuators. Outer
array control signals drive two amplifier inputs eachand four actuators.
NASA/TM--2000-210229 6

Sensor Arrays
A set of sensor arrays constructed for this test condition
was installed on the ANCF rig. There were six
circumferential arrays each of sixteen uniformly spaced
sensors: three arrays in the inlet three arrays in the
exhaust. The output of these sensor arrays was
processed using an analog beam former that observedmode orders m = +4.
Tonal Control
The core control system implements a synchronousmulti-channel Filtered-X LMS algorithm _2. The control
and plant filters were three tap digital Finite Impulse
Response filters. The plant was identified in the
presence of the disturbance in a two step process. The
first step designs a set of parallel digital filters that
internally cancel the disturbance tone. These filters arethen used to detect the increment in residual
microphone signals when each of the four actuator
arrays is in turn activated by the controller. The
controller then designs a set of 24 filters that model the
transfer function from each controller output through
each actuator array to each microphone array and
controller input. The plant identification can also berun with the fan disturbance noise at a different
frequency to the actuator drive signals when a function
generator is then used to clock the controller.
The core control is then implemented. This is a
synchronous adaptive feed-forward scheme based onthe Filtered-X LMS. The four output filters were
adaptively updated using a function of the output of 24
filters that represent the path from each control outputto each sensor input. A feature of the version of the
algorithm used for the tests was the ability to set a hardlimit to individual control channel output voltages.
This was to prevent the control signal from exceeding
the maximum level that could safely be acconunodated
by the power amplifier inputs. The algorithm ensuresthat the maximum level is not exceeded by preventing
any update that would cause a control filter output toexceed that level. The maximum level can be
independently set for each control output and if one
output is constrained at its maximum, the other controlfilters can continue to adapt.
A monitor program allows interaction with the
controller functions to set filter lengths, convergence
parameters and control output limits. It also displays in
real time the amplitudes of controller output and
residual input signals when the control or identification
programs are running.
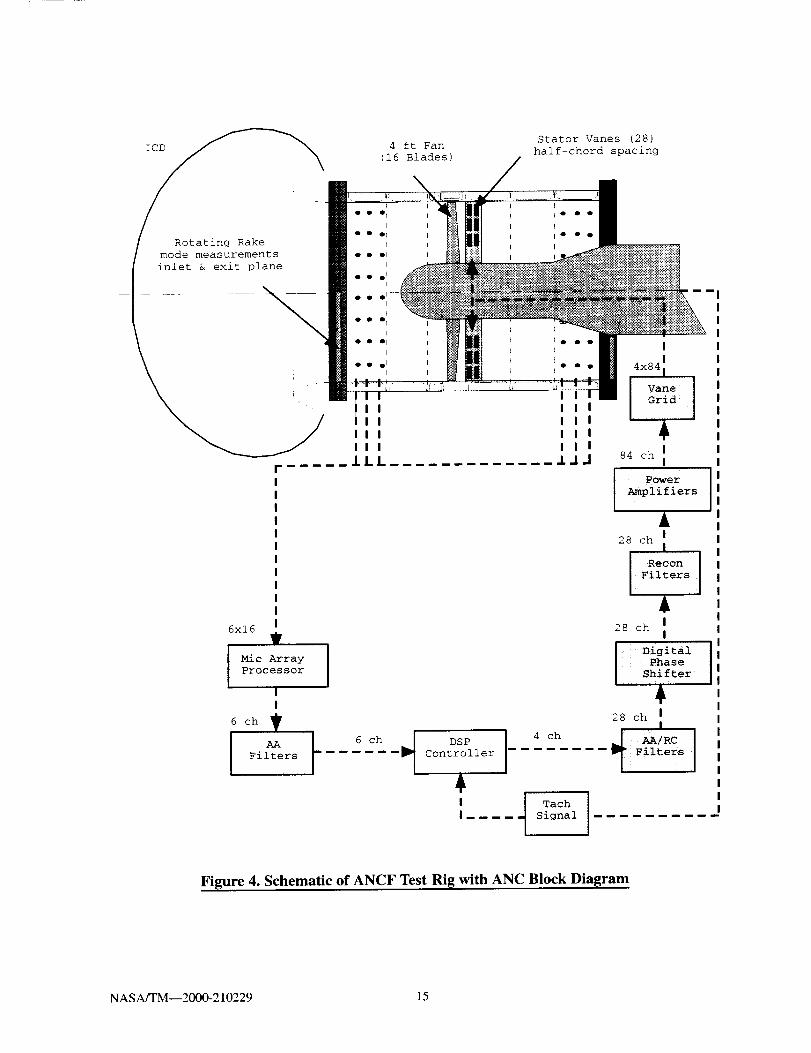
Control System Schematic
A schematic of all the control system components and
their interconnections is shown in figure 4.
The control path starts at the sensor arrays. The 6x16
microphone outputs are processed by the microphone
array processor implemented in analog electronics. The
six outputs of the array processor represent the m = +4
component of the sound field at each array location.
For each array, two possible outputs were available, the
cosine transform component or the sine transform
component. When added with the correct phase, these
two components can be taken as a time domain
representation of the m = 4 component. The six
processed sensor signals are filtered by analog anti-
aliasing filters with a cut-off of 1.1 kHz.
The controller is implemented on a DSP processor. The
control algorithm is a synchronous multi-channel FX-LMS with off-line identification in the presence of the
disturbance. For the test, a 6 input by 4 output control
structure was implemented.
The controller is clocked by a signal derived from a
digital encoder on the main fan shaft. The encoder
produces 128 TTL pulses per fan revolution. As the fanhas sixteen blades, this corresponds to a frequency eight
times BPF or four times 2BPF, approximately 4 kHz at
1886 rpm. The shaft encoder signal also provided
synchronization signals for the rotating rake drive and
signal processing system.
The controller is operated in two modes. The first is a
synchronous control mode with the fan shaft encoder
providing the 4kHz clock for both controller and rake.The second is an asynchronous control mode with an
external signal generator providing the clock for bothcontroller and rake. This second mode is used to
measure the output of the control system with the fan
operating at a different speed. With the fan 2BPF at adifferent frequency to the actuators, the effect of the
actuators alone can be accurately measured by both the
controller and the rake system while the flow effects arestill included.
The four analog control output signals are then passed
to the digital actuator array processor. This is a bank of
28 digital filtersdesigned to have the correct phase shift
to generate four independent m = 4 mode components
at the actuator arrays. The array processor is
implemented on DSP computer. No anti-aliasing filters
are required, as the control output reconstruction filters
suffice. The 28 digital output signals are filtered by a
bank of 28 low-pass analog reconstruction filters.
NASA/TM--2000-210229 7

The28analogoutputsignalsarethentakento andsharedby the appropriateinputs of the poweramplifiers.The84amplifieroutputsarethenpassedtobreakoutboardsattachedaboveeachamplifierrackwherecalibrationtrimmingcapacitorscanbeattachedif necessary.The168outputsfromthebreakoutboardsgo thevanegrid wheretheyaredistributedto thecorrectactuators.Twenty-eightfifty-footlongribboncablesrunfromthevanegridto atrailingleadandcableattachedtoeachvane.
ResultsIn-Duct
Actuator Signatures
The acoustic signature of the actuator system without
the acoustic influence of the fan or control system wasstudied first. This can be done with the fan at zero or
very low RPM. However, if the hydrodynamic flow
effects are important one can set the fan RPM to about90% of the frequency the actuators are driven. This
sets up a condition where the actuators see a similar
flow field yet their acoustic signature can be easilyseparated from that of the fan.
Figure 5 shows the modal signature of the individual
driver sets. as measured at the inlet entrance plane bythe rotating rake. The actuators were driven at 960 Hz.
(equivalent to a fan RPM of 1800) while the fan rotated
at 1650 RPM. The 3-dimensional plots show the powerin each i m,n_ mode. The total PWL in a circumferential
mode is shown along the back wall. Indicated in tabular
form is the total tone power, the power in m=4, and the
sum of the power in the non-m--4 modes. These values
are an indication of the modal efficiency of the
actuators. Ideally, all of the power should be in the
m=4 target mode. However, in practice, a system that
achieves _1_ the target mode 20 dB higher than the next
highest mode and t2_ a target mode PWL 10 dB higherthan the sum of all other non-target modes is a realistic
goal for near optimum results. (Power in modes other
than the target mode is sometimes referred to as
spillover. )
Figures 5a and 5b show the leading and trailing edge tip
actuators. Most of the power is in mode (4,0). The tip
actuators couple best to the outer wall dominated mode.The ratio of m=4 PWL to non- m=4 PWL is 6.9 dB for
the leading edge and 5.0 dB for the trailing edge.
While not optimum, these ratios can yield usefulresults.
The inlet modal signatures of the leading and trailing
edge hub mounted actuators are shown in figures 5c
and 5d. This location couples nearly equally well into
the (4,0) & (4,1) modes. The modal efficiencies of the
hub drivers are 17.8 dB (leading edge) and 9.2 dB
(trailing edge). These ratios are excellent.
The modal signature with all actuator sets driven
simultaneously at varying amplifier gain levels is
shown in figure 6. Compare figure 6b to figure 5 to
compare identical gain settings. Coherently adding the
m=4 PWL for each of the 4 sets driven individually at a
gain of 0.5 (figure 5) yields 104.4 dB. All sets driven
simultaneously at a gain of 0.5 yield a measured m=4
PWL at 104.1 dB, as shown in figure 6b. The
individual sets add the target mode coherently as
expected.
The spillover measured with all sets driven
simultaneously at a gain of 0.5 is 98.1 dB PWL.
Coherently adding the non- m=4 PWL from the
individual signatures yields 94.2 dB. This is a
surprising result in that the extraneous modes would be
expected to be random, thus adding non-coherently, let
alone greater than the coherent sum. A small
mathematical effect could arise from the way the low-
level modes are analyzed. If a mode is below themeasurement floor of -70 dB it is not included in the
calculation of total PWL. If the individual sets are
generating several modes just below this floor, it is
possible that all sets combined would raise the PWL to
a measurable level. Thus, the individual sets' spillover
PWL may be artificially low. Compensating for this by
assigning a 70 dB PWL to all modes not measured
yields a total extraneous mode PWL of 95.1 dB by
coherently adding the levels of the individual
extraneous modes. This does not explain the entireincrease in measured extraneous PWL.
Another possibility that can account for larger spillover
is the actuators coupling to each other through the vane.
This might change the response of an actuator set when
excited simultaneously with other sets compared to its
response when excited alone. This type of behavior has
been noted in wall actuators. Further testing on
actuator-vane-actuator coupling is desirable.
The gain in figures 6a-d varies from 0.25 to 1.0. This
corresponds to actuator amplifier output of 42 to170mArms. The nominal drive level was 0.5
(85 mArms) and at a gain of 1.0, audible harmonic
distortion was noted, thought to be caused by the
current limiting resistors. As the gain is doubled from0.25 to 0.50 the m=4 PWL increases almost 6 dB, as
expected. This is expected because a doubling of the
gain is approximately a quadrupling of the amplifierpower output (see fig 2d). Doubling the gain again (to
1.0) increases the PWL by only 3 dB. This non-linear
NASA/TM--2000-210229 8

responseis furtherindicationofthedistortion.Mostofthedistortionatthehighergainsettingswasnotedtobeintotheharmonics.Themodalefficiencymeasuredateachgainsettingis approximately6.0dB, nearlyindependentofgainsetting.
Figure7 showsmodalsignatureof theactuatorsetsexcitedindividuallyasmeasuredbytherotatingrakeattheexhaustexitplane.Whiletheinletandexhaustrakedataarenottakensimultaneously,theactuatorinputswerethesameforthetworunssothesignaturescanbeconsideredastheoverallsignature.Them=4PWLsaregenerallylowerin the exhaustthanin thanthosemeasuredin theinlet,indicatingtheactuatorsradiatemoretowardtheinlet.
Thetip leadingedgeset(fig.7a)hasaverypoormodalsignal-to-noiseratio,0.7dB. Thisis dueto thelowm=4outputlevelgeneratedby thissetratherthanahighlevelof spillover.Thetip trailingedgeandhubleadingedgeratiosaregoodat8.3and8.5dB(fig.7band 7c). The hub trailing edgeactuatorset isparticularlyefficientwitha12.9dBratio(fig.d).
Figure8 showsmodalsignaturein the exhaustgeneratedbyall actuatorsetsdrivensimultaneously,atvariousamplifiergains.
Comparingthecoherentlyaddedm=4PWLsnotedinfigure7 to thelevelactuallymeasuredyields99.9Vs100.5dB. Againtheextraneousmodesarefor thecombinedexcitationarehigherthanexpected,97.7dBmeasuredvs.90.9dBfromthecoherentlyaddedsum(94.1dBif modesbelowtheflooraremathematicallyadded).Thesameargumentismadefortheexhaustobservationsaswasmadeearlier with the inlet results.
Figure 8a and 8b indicate that doubling the input gainalso causes a 6 dB increase in the mode PWL, with
further increases in gain in figure 8c exhibiting the
amplifier output limit.
ANC Performance
The in-duct performance of the ANC system was
judged by two criteria. The first is the ability of the
system to reduce the level of the target mode. This isan evaluation of the quality of the convergence
algorithm and the input sensor's ability to distinguishthe target mode. The second is the reduction achieved
in the total harmonic tone power level. This is primarily
related to the modal efficiency of the actuators as
described in a previous section.
The ANC performance at a corrected fan speed of 1800
RPM is presented in figure 9. Figure 9a shows the inlet
modal map of the fan at 2BPF. The two radials (4,0)
and (4,1) of the rotor-stator interaction mode are clearly
seen. The m=4 PWL is 108.4 dB and very weak
extraneous modes are seen.
The modal map with the ANC system active is shown
in figure 9b. The m=4 mode has been reduced 7.6 dB.The total 2BPF PWL has been reduced 6.2 dB. The
difference is a result of the ANC system increasing the
level of the non-m=4 modes by 3.3 dB. The equivalent
performance in the exhaust is shown in figure 9c and
9d. The m=4 mode has been reduced by 3.7 dB, with a
total PWL reduction of 2.0 dB. At first glance, it
appears that the inlet performance is superior.However, the controller works to reduce all the inputsensor channels to a minimum in a total RMS sense.
This control methodology tends to equalize the inletand exhaust m=4 levels which are 100.8 and 101.9 dB,
respectively. The remaining difference might beattributed to the difference in the duct geometry.
Figure 10 shows that the performance of the ANC
system is maintained over a fan corrected RPM range
of 1400 to 1800. Figure 10a compares the individualradial mode absolute levels of the fan to levels with the
ANC operating. The reduction achieved for the
individual modes are shown in figure 10b. For fan
speeds above 1550 RPM where two radials are present,a 6 to 8 dB of reduction in m=4 is achieved Most of the
mode reduction is due to a reduction in the (4,1) radial
as it is generally the strongest radial present in the
original fan signature. The apparent increase in
performance at 1500 RPM and below is a result of the(4,1) mode cut-off resulting in an over-specified control
system. The additional flexibility results in a completecancellation of the (4,0) mode.
A modal noise floor is calculated by mathematically
removing the m=4 from the fan 2BPF mode map
illustrated in figures 5-9. This can be considered the
maximum theoretical performance of the ANC system
for that particular speed. Figure 10c shows the absolute
levels of the tone are brought down to the modal floor
levels when only a single radial is present. When the
second radial is cut-on, the system does not achieve the
full reduction possible. This is partly due to the power
amplifiers limits mentioned earlier. Figure 10d showsthe reduction achieved in the 2BPF tone level. About 4
to 6 dB in tone reduction is achieved when two radials
are present, up to 14 dB when only a single radial is
present.
The corresponding solutions for the exhaust are shown
in figure 11. The m--4 levels shown in figure l la are
reduced to approximately those in the inlet as a result of
the controller reducing the error levels in a RMS sense.However, the reduction achieved is in the exhaust is
lower, ranging from 2 to 4 dB as can be seen on
NASAfrM--2000-210229 9

figurelib. In somecasesthe(4,0)radialis actuallyincreasedbutsinceit was10or moredBbelowthe(4,1)radial,thisdoeseffecttheover-allresultin anacousticsense.
Figure1lc showsthelevelsin theexhaustarenotdrivento theoptimumlevels.Approximately2-3dBtotal2BPFtonePWLreductionis achievedin thepresenceoftworadials,14dBwithonlythe(4,0)radialpresent(figurelid). Theradialmodephasingrequiredto achievereductionresultedin theamplifierlimitingthemagnitude.
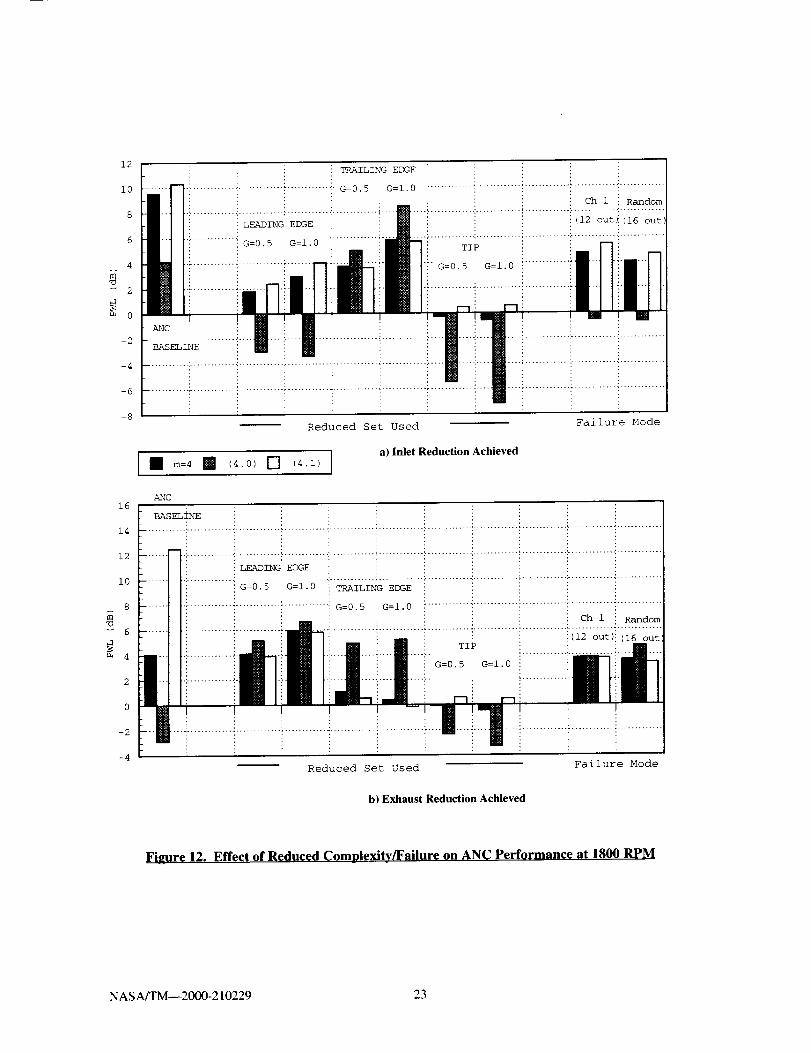
Ofreasonableconcernis thecomplexityof thisoranycurrentANCconcept,alongwiththerobustnessof thesystem,particularlyofactuators.(Noneoftheactuatorsfailedduringthetest). TheANCsystemoutputchannelswerereducedto demonstratetheperformanceof an under-specifiedsystem.Theinputchannelarchitecturewaskeptthesame.Figure12showstheperformancewithreducedactuatorchannelsforasinglefanspeed.
In figure12a,theperformancein theinletfor caseswhereonlytheleadingedgepairs,trailingedgepairs,or thetippairsof actuatorsareusediscomparedtothebaselinecase(allactuators).Since1/2of theactuatorswereusedperformancewiththereducedsetsdrivenatdoublethegainis alsoshownfor comparison.Themosteffectiveactuatorsetin theinletis thetrailingedgeset,obtaining5.8ofthe9.5dBobtainedusingallactuators.Thetipactuatorsdonotcouplewellto thefanmodeswhenusedalone.Thisis notsurprisingsincethesourceisknowntobedistributedradially.
Actuatorfailuremightoccuratvariouspointsin thesystem.Onefailurewasrepresentedby aremovingsystemchannel1,whichresultedinalossof 12specificactuatorstied to thatchannel.Thisresultedin areductionof 4.7 dB comparedto the full systemreductionof 9.5dB. A secondtypeof failurewasrepresentedby nulling8 randompairsof actuators,whichyielded4.0dBof reduction.Thenumberofactuators'lost'couldbeconsideredextremeyetusefulreductionsstilloccurred.
Figure12bshowsthattheexhausttheleadingedgewastheoptimumunder-specifiedset.Thefactthattheinletandexhausthadadifferentoptimumsetmayindicatethata locationnearertothemid-chordmayresultinaset that is optimumfor both directions. Theperformanceof the 'failures'in the exhaustwasapproximatelythesameaswasnotedintheinlet.
Farfield Results
Farfieid directivity for the corresponding 1800 RPM
ANC run is shown in figure 13. A reduction of 13.5 dB
SPL at 41.5 ° and 12.8 at 74.5 ° occurred. Those angles
correspond to the (4,0) and (4,1 ) lobe peaks.
The 2BPF tone PWL was calculated by integrating the
SPL at the single azimuthal angle over a sphere. Thismethod can introduce errors from circumferential
modal interference pattern that varies with azimuthal
angle under certain conditions _3. The integration was
arbitrarily divided at 90 ° to obtain the PWL in the
forward and aft quadrants. These results of these
calculations are shown in figure 14. A farfield
reduction of approximately 4 dB PWL is achieved over
the RPM range. At 1500 RPM a 2 dB increase was
measured. However, the 1500 RPM speed was noted to
unique with respect to the cut-on of (4,1) and this might
explain the increase. Significant reduction is measured
at 1400 RPM where only a single radial exists occurs;as was noted in-duct.
Conclusion
An active control system for ducted fan noise that usesvane actuators has been shown to be feasible. The vane
actuator ANC system reduced total power levels in the
target modes by up to 9 dB in the inlet while at the
same time exhaust power levels were reduced by up to3 dB. The reduction in the 2BPF tone PWL achieved
was 6 and in the inlet and 4 dB in the exhaust. A
simplified control system with just two actuator arraysat different radial locations was demonstrated to
simultaneously reduce tonal power in both inlet and
exhaust. The performance of the simplified control
system worked well.
The requirements of a vane actuator for the ANCF were
a device that could be installed in a vane and produce
displacements of over 0.001 of an inch at 1 kHz. An
actuator based on THUNDER technology was built that
met these requirements. A total of 168 actuators were
installed in 28 vanes. They proved to be very robust,
none of the actuators failed during the six weeks of
testing. The sensitivity of the actuators was uniformacross the batch; with minimal calibration control
modal spillover was kept to around -10 dB.
The control system tested did not have sufficient
control authority to reduce the level of the 2BPF tone to
the level of the broadband background. The main cause
of this was power amplifiers were conservatively
NASA/TM--2000-210229 10

currentlimitedto 150mArmstoprotecttheactuators.Thevaneactuatorsarebelievedtobeabletowithstandin excessof 200mArms.With thesehigherdrivelevels,thevaneactuatorsshouldhavehadsufficientauthoritytofurtherreducetheANCFtones.Thesecondlimitationonperformancewasspillover.Theabilityof theactuatorarraysto controlthefaninteractionmodeswasreducedby thedifferenceinsensitivityof theelementsof thearray. In thistest,onlyminimalcalibrationof theactuatorswasdone,asexactacousticcalibrationwasproblematic.Theacousticcalibrationdevicedesignedfor the vaneactuatorsprovedtobedifficulttouseandsufferedfromacousticcrosstalkbetweenmicrophonecavities.Astheperformanceofthesystemintermsoftheobjectivesof thesetestswasacceptable,noattemptwasmadetoimprovethecalibration(thisisbestdoneonindividualvanesbeforeinstallationin theduct).It isreasonabletoassumethatsomesystemperformancewouldensuefromimprovementsto boththemanufacturingbatchuniformityandtotheacousticcalibrationprocedure.
Thedifferencein relativeperformancein theexhaustductdidnotseemtobeduetolackofcontrolauthorityorcontrolspilloverin theexhaust.Thisis certainlypartlyduetothelowerpowerlevelsin theexhaust;aleastsquarescontrolsystemwill tendtoequalizelevelsbetweeninletandexhaust.Anadditionaleffectmaybethefanductconvergencethatoccursjustbeforetheexitplanewherethecenterbodyincreasesin sizefromahubtipratioof 0.35to 0.5. Theaxialphasespeedofthefaninteractionmodeswill varyastheypropagatethroughthissectionandperhapstheymixinsomeun-modeledwayat theexhaustsensorarrays.As realengineductshavesimilartransitionsin crosssection,furtherinvestigationof thecauseof thisproblemisjustified.Selectedsubsetsof theactuatorswereruntodeterminethefeasibilityof reducingthesystemcomplexity.Theresultsindicatedthatacorrectlyplacedpairof controlactuatorarraysmightcoupleto thesefourmodesin asimilarway,enablingtwoactuatorarraysto controlfourmodes.As engineapplicationshavemanyfaninteractionradialmodecomponents,thisefficiencyofvaneactuatorscouldproveto benecessaryfor thepracticalapplicationofANC.
Analysisof simulatedfailuresshowsthata usefulamountofreductionoccursevenwithmultipleactuatorfailures.
A benefitof vaneactuatorsisthattheyactatthesourceof thedisturbance.If bothfaninteractionandcontrolsourcesareat thesamelocationandarebothdipole
sources,thentheyshouldcouplewiththeductacousticsin thesameway.Fromasmalldefinedregion,thefaninteractiongenerates,andtheactuatorscoupleto,fourindependentacousticmodes,twoin theinletandtwointheexhaust.Similarcouplingby a seriesof wallactuatorarraysmayrequireprohibitiveductlength.
References
' Tyler, J.M., and Sofrin, T.G., "Axial Flow
Compressor Noise Studies," SAE Transactions,
Vol. 70, 1962, pp. 309-332.
-" Heidelberg, L.H., Hall, D.G., Bridges, J.E., and
Nallasamy, M., "A Unique Ducted Fan Test Bed forActive Noise Control and Aeroacoustics Research,"
NASA TM-107213, May t996, also AIAA Paper
96-1740 May 1996.
3 Sutliff, D.L., Nallasamy, M., Heidelberg, L.J., andElliott, D.M, "Baseline Acoustic Levels of the NASA
Active Noise Control Fan Rig," NASA TM-107214,
May 1996, also AIAA-96-1745, May 1996.4 Sutliff, D.L., Hu, Ziqiang, and Pla, Frederic G.,
"Active Noise Control of Low Speed Fan Rotor-stator
Modes," NASA TM-107458, May 1997, also
AIAA-97-1641, May 1997.
5 Thomas, R.H., Burdisso, R.A., Fuller, C.R. and
O'Brien W.F., "Active Control of Fan Noise from a
Turbofan Engine", AIAA Journal 1994, 32( 1) p23-30.
6 Kousen, K.A., and Verdon, J.M., "Active Controlof Wake/Blade-Row Interaction Noise," AIAA
93-4351 1993.
7 Curtis, Alan R. D., "Active Control of Fan Noise
by Vane Actuators," NASA/CR--1999-209156.
8 Heidelberg, L.J., and Hall, D.G. "Inlet AcousticMode Measurements Using a Continuously Rotating
Rake," Journal of Aircraft, 32(4), p761-767, 1995.
9 Simonich, J.C., "Actuator Feasibility Study forActive Control of Ducted Axial Fan Noise," NASA
Contractor Report CR-195412, May 1995.10 U.S. Patent No. 5632841, Thin layer composite
unimorph ferroelectric driver and sensor, May 27, 1997.11 Meyer, H.D. and Envia, E., "Aeroacoustic Analysisof Turbofan Noise Generation," NASA CR-4715,
March 1996.
t2 "Algorithm for Multichannel LMS Adpative
Filtering," Electronics Letters 21 979-981 1985.
_3 Heidelberg, L.J., Sutliff, D.L., and Nallasamy, M.,
"Azimuthal Directivity of Fan Tones Containing
Multiple Modes," NASA TM-107464, May 1997, also
AIAA-97-1587, May 1997.
NASA/TM--2000-210229 11

a t ANCF Side View
b) ANCF located in AAPL Dome
Figure I. Photos of Active Noise Control Fon
NASA/TM--2000-210229 12

ioo
9o
_°?o
/I
/
//'/
/'
/
//i
i 410 i
Drive Voltage, Vrms
a} Displacement vs Volta__e
901.
M']_o
i4c.
,-4
w4
oIo
.
/
////
Y/
///
/
it 23 _¢ 40 5O 67, 70
Drive Current, mArms
b Displacement vs Current
' 0 ,,
!i;i;I ,
i 3 i/ _
i [ Drive Voltage,
I Vrms //.'' "_
6_'3C 700 8'3C 900 i000 1200 1500
Frequency, Hz.
c) Actuator Disnlacement vs Frequency
2000
;o(
9C
vc
m
5c
&l ac
_ 3c
*
/J •
/ •4
f*
j..• Acr_uatzr ','_l_s], Actuaeor _,'_aulza
lC ,!
0 I;._ t:.,; u _ C_ ;.c; 1.2 ± .i _ t ± S 2 Ct ..z 2.4"
Input Volts
140
I
1oo,.-t
_o
Ill Actuator Amplifier Output
Fi.ure 2. VaneActuator Performance
NASA/TM--2000-210229 13
4.5"Tip
PZT-5A Til(Working area
BeCu base
2.5"
a) Actuator Final Design
Vane StructurePerforated Screens
1.5"
Actuators
b} Actuator Vane Installation
(2)
c
Hub
c) Schematic of Actuators in Vane
Suction Side Pressure Side
d_ Photograph of Actuators Installed in Vane
Fieure 3. Vane Actuator Geometry
NASA/TM--2000-210229 14
i Rotating Rake
mode measurements
inlet & exit plane
6x16
VMic Array
Processor
I I
I I
II I
II I
ILl.
4 ft Fan
(16 Blades)
Stator Vanes (28)
half-chord spacing
I
I
6 ch
AA I 6 chFilters
I I
I I I
I I I
I I I
I I I
Ill
4 chDSP
Controller
I _ TachI .... Signal
l
4x84 |_
i vane ]Grid
84 ch lI
I PowerAmplifiers
28 ch II
i IFilters
A28 ch l
I
I i Digital IPhase
Shifter ,
28 ch lI
Fil_ers
Figure 4. Schematic of ANCF Test Rig with ANC Block Diagram
NASA/TM--2000-210229 15

NASA ANCF 48" Fan Mode Power Levels Sets Actuated Individually
28 Vanes @ 2.25" * = 1650 non-synchronous to fan
Rake @ inlet entrance plane Amplifier Gain = 0.5
/=960 Hz (eq 2BPF * :1800)
II(] II O
95 _ 9590 _ 99
% B 9
__':...:-._.>_
_1 _"_'0 o ,_e ' _i_ 1
PgfLtot; 96.4 dB _ _]9 %_ 0 ,,i_o 95.0 dB '_]!%) " PWLto t ; (_) _6 _;
m:4; 95.6 dB m:4; 93.4 dB
non m=4; 88.7 dB non m=4; 88.4 dB
II0 llo
95 _ I%95
% 90 %_ 90
85 B5
80 %0
"<t_ I i'? <2, i _ 2 ,
PWLtot ; 101.2 dB _ (_} _.SIJ- _1 PWLtot ; 99.7 _ _ti_l M%_ _3f_]
m=4; 101.2 dB m=4; 99.2 dB (%)
non m=4; 83.4 dB non m=4; 90.0 dB
c) Hub Leading Edge d) Hub Trailing Edge
Figure 5. Individual Actuator Signatures in Inlet
NASA/TM--2000-210229 16

NASA ANCF 48" Fan Mode Power Levels Sets Actuated Simultaneously
28 Vanes @ 2.25" * = 1650 non-synchronous to fan
Rake @ inlet entrance plane Amplifier Gain Vary
/=960 Hz (eq 2BPF * =1800)
_-_%:::::::::;:::::::: ::: :::: :i:: __oo:::::::::::::i::::i:i:: ::::: :::
85 85
80 80
%%
PWL ; 99.5 dB _q_ ( _ _ PWLtot; 105.1 dB _ _tot _) _ac (r.)
m=4; 98.5 dB m=4; 104.1 dB
non m=4; 92.6 dB non m=4; 98.1 dB
a_Amplifier Gain = 0.25 b) Amplifier Gain = 0.50
i "i''ii :<-.[ "'..'-i.i: •
llo llQ .-. :'F'.'..i F'.;.i.] : •10518 _ 108 "_- : : ""." ":q. "<" i : '
18 :':':. :":" "" : .'_'-: :
:_ % % !' .] :" .. "'..'.i.i "'i.9_ _ 90 _,".."':" " "¢.: : :"_.
85 85 ..'" .-..'.,,." ..
80 80
•.'.....g....:.',:..'_-...
; "_ 108.4 dB _1
107.6 dB _<_ _a_ _ _%_ (_) % u _]PWLto t PWLtot ;
m:4; 106.6 dB (m) m=4; 107.3 dB
non m:4; 100.8 dB non m=4; 101.6 clB
c) _ Gain = 0.75 d_ _ Gain = 1.00
Figmre 6. Combined Actuator Signatures in Inlet
NASA/TM--2000-210229 17

NASA ANCF 48" Fan Mode Power Levels Sets Actuated Individually
28 Vanes @ 2.25" * = 1650 non-synchronous to fan
Rake @ exhaust exit plane Amplifier Gain = 0.5
/=960 Hz (eq 2BPF * =1800)
11o 11 o
105105 _ I%
0 95 _ 9599 _ 90
85 85
80 80
jl!
FWLtot; 88.5 dB _88 _ _ i¢;-_lede ; . -'_ial "'_t,_'_ 0 '
m=4; 85.8 dB (%) _4 tot {%)m=4; 92.7 dB
non m=4; 85.1 dB non m=4; 84.4 dB
• L_Z]_IJilg_._I_ b_ Tip Trailing Edge
_ 9oo
85 85
_ , _-4. f_ , _
PWLto t 95.4 dB _I M%_9 _*_
m=4; 94.9 dB (_) _ tot }_%d_m=4; 96.4 dB (%) _'
non m:4; 86.0 dB non m=4; 83.5 dB
c_ Hub Leading Edge d) Hub Trailing Edge
Figmre 7. Individual Actuator Signatures in Exhaust
NASA/TM--2000-210229 18

NASA ANCF 48" Fan Mode Power Levels
28 Vanes @ 2.25" * = 1650
Rake @ exhaust exit plane
Sets Actuated Simultaneously
non-synchronous to fan
Amplifier Gain Vary
f=960 Hz (eq 2BPF * :1800)
110 II O
_00 _ _00
9O _ 90
85 8S
%0 80
%
,
t_-_ 1 _'_'_J I _ _ ,je J''
PbT_tot; 96.7 _o_ _ u _i0_4_ PWL ; 102.3 dB _
m:4; 95.0 dB (rn) m=4; 100.5 dB (m)
non m=4; 91.8 dB non m:4; 97.7 dB
a) Amplifier Gain = 0.2_ b__ Gain = 0.50
]_o . .i'
ICj%
9fj
%%
i
Cirr:t_f a
PWL ; 104.6tot
m=4; 102.9 dB
.. :!'i:i:,
non m=4; 99.6 dB
c) _ Gain ---0.75
Figure 8. Combined Actuator Si_matures in Exhaust
NASA/TM--2000-210229 19

NASA ANCF 48" Fan Mode Power Levels
28 Vanes @ 2.25" * 2BPF * c : 1800
I°0 - 10090 % 90
85 _ 85
%0 %
%%
PWLtot; 108.5 dB _ h%g_ %% L _io__ PWLtot; 102.3 dB _ _o_ %% t _,_°
m=4; 108.4 dB {_) _,_4_] m=4; 100.8 dB {_) __4_]
non m=4; 93.7 dB non m:4; 97.0 dB
a) Fan Signature ill Inlet b_ ANC On Signature in Inlet
_I0 110
I% _ 105
90 _ 90
85 _
_0 _0
• 105.7 dB I_oj9 103 7 _ htial _%j_ alP_JLtot ' _4_ _ tot "m=4; 105.6 dB (_} m=4; 101.9 dB {%) _J;_
non m=4; 90.6 dB non m=4; 99.1 dB
c) Fan Signature in Exhaust d) ANC On Signature ill Exhaust
Figure 9. Performance of ANC System at 1800 RPM
NASA/TM--2000-210229 20

ii0
105
i00
95
ANC OFF ANC ON
--ll-- m=4 - D-
(4,0) -(_
(4,1) -f/-
........................................... i.......
i i ,i........!........i....} i ! !
90 ........_ ......
I I: [ :
8s ....... -_-........ !---_--,--! ......... ! ......... ::.......:% : I I _ : :
8o
1300 1400 1500 1600 1700 1800 1900
Corrected RPM
aJ Mode 4 Absolute Levels
20
18
16
14
_10
_ 8
6
4
--4_}-- m=4
--O-- 4,0)
4,1)
C,,
0
1300 1400 1500 1600 1700 1800 1900
Corrected RPM
b] Mode 4 Reduction Achieved
ii0
105
i00
95,..a
9O
--'ll--" Off PWL - [_ On PWLFloor - O- Floor
: i '
[ i ': : .:
........}........i''.} .... .........:........}.........
85
80 ' '
1300 1400 1500 1600 1700 1800 1900
Corrected RPM
¢_ 2BPF Absolute Levels
--_- Tone
--O-- Floor
12
10
8
,a 4
2 ................... "--<........ ; ......... : ...................
°I i-2
-4
-6
1300 1400 1500 1600 1700 1800 1900
Corrected RPM
d) 2BPF Reduction Achieved
Figure 10. ANC System Performance in Inlet vs RPM
NASA/TM--2000-210229 21

iio
lO5
ioo
95
(4,0) -_ ]
(41) -_- ]
85 ........ " ......... :.l ....... : ......... :......... : .........
80
1300 1400 1500 1600 1700 1800 1900
Corrected RPM
a) Mode 4 Absolute Levels
14
12
i0
8
4
_2
_i'-_ m=4
--O-- (4,0)
--_ (4,1)
iiiiiii iiiiiiii°iiiii!i!!!!!?i!!_iiiii-2
-4
-6
1300 1400 1500 1600 1700 1800 1900
Corrected RPM
b) Mode 4 Reduction Achieved
ii0
105
-- ioo
95
90
Fan PWL -[[_ ANC PWL
Floor -C _ Floor
....... _.- "i...,..:..i ......... i ........ :......... : .........
85 ....... _- ........
i i :80 , I , I , I , i , i _1300 1400 1500 1600 1700 1800 _900
Corrected RPM
c) 2BPF Absolute Levels
io
8
6
2
--C]-- Tone I-'49"-- Floor
12
_o ........ _....................................... _.........
__-_i:_i__i_i___.......i........_........._........._.........i.......i]-6
-8
1300 1400 1500 1600 1700 1800 1900
Corrected RPM
d) 2BPF Reduction Achieved
Fimtre 11. ANC System Performance in
NASA/TM--2000-210229 22
12
i0
8
6
4
v 2
_o-2
-4
-6
-8
16
14
12
i0
8
_ 6
2
0
-2
-4
TRAILING EDGE
...... _] ............_............._.............:" G=0.5 G=I.0 .............I.............!.............! ..........!.............
...............,....t .........................l]tl-Reduced Set Used
Failure Mode
I m m=4 [] (4,0) [] (4,1) I
a) Inlet Reduction Achieved
_C
BASELIN'E
-.......:..........................._.............:............._.............!i.............:.............!.............:..............:.............! [']i !i''_'_DG_ i i i i i............i.............].............-......ii i............._:o_ o_.o_,_i,_,,_ i i ! _....... [ [-!............. i............. ! ............. i G=0.5 G=:]_.0 !............ _............. ! ............. ?............ ::.............
.......i.............i.............i'm_',................................._i; i ,,_ou_,,_ o,,_
Reduced Set Used
b) Exhaust Reduction Achieved
Failure Mode
Figure 12. Effect of Reduced Complexity/Failure on ANC Performance at 1800 RPM
NASA/TM--2000-210229 23

85
_Uv
u]
80
75
7O
65
6O
55
0
........... [................................. I _ _C Off..... _- ANC On
20 40 60 80 i00 120 140 160
FarField Angle (degrees)
180
Figure 13. Farfield ANC Directivity at 1800 RPM
_o
16
14
12
i0
8
6
4
2
0
-2
-4
1300
................._...................I+_otaloFw__ Aftl_i__:_i_:_:i_i_:_:................._..................iiiii!i!!!iiiiiiii!!!i!!!!!iiiiii!!!!iii[
1400 1500 1600 1700 1800 1900
Corrected RPM
Figure 14. Farfield ANC Performance vs RPM
NASA/TM--2000-210229 24


REPORT DOCUMENTATION PAGE FormApprovedOMB No. 0704-0188
Public reporting burden for this collection of information is estimated to average 1 hour per response, including the time for reviewing instructions, searching existing data sources,
gathering and maintaining the data needed, and completing and reviewing the collection of information, Send comments regarding this burden estimate or any other aspect of this
collection of intormation, including suggestions for reducing this burden, to Washington Headquarters Services, Directorate lot Information Operations and Reports, 1215 Jefferson
Davis Highway, Suite 1204, Arlington, VA 22202-4302, and to the Office of Management and Budget, Paperwork Reduction Proiect (0704-0188), Washington, DC 20503.
1. AGENCY USE ONLY (Leave blank) 2. REPORT DATE
July 20004. TITLE AND SUt_TiTLE
Performance of an Active Noise Control System for Fan Tones
Using Vane Actuators
6, AUTHOR(S)
Daniel L. Sutliff, Alan R.D. Curtis, Laurence J. Heidelberg,
and Paul J. Remington
PERFORMING ORGANIZATION NAME(S) AND ADDRESS(ES)
National Aeronautics and Space Administration
John H. Glenn Research Center at Lewis Field
Cleveland, Ohio 44135 - 3191
9. SPONSORING/MONITORING AGENCY NAME(S) AND ADDRESS(ES)
National Aeronautics and Space Administration
Washington, DC 20546-0001
3. REPORT TYPE AND DATES COVERED
Technical Memorandum
5. FUNDING NUMBERS
WU-522-81-11-O0
8. PERFORMING ORGANIZATIONREPORT NUMBER
E-12348
10. SPONSORING/MONITORINGAGENCY REPORT NUMBER
NASA TM--2000-2 I0229
11. SUPPLEMENTARY NOTES
Prepared for the 6th Aeroacoustics Conference and Exhibit cosponsored by the American Institute of Aeronautics and Astronautics and the
Confederation of European Aerospace Societies, Lahaina. Hawaii, June 12-14, 2000. Daniel L. Sutliff, AYT Corporation, 2001 AerospaceParkway, Brook Park, Ohio 44142: Alan R.D. Curtis, Technology Manager, Materials System, lnc., 521 Great Road, Littleton, Massachusetts
01460: Laurence J. Heidelberg, NASA Glenn Research Center; and Paul J. Remington, Principal Engineer. BBN Technologies, 70 FawcettStreet, Cambridge, Massachusetts 02318. Responsible person. Laurence J. Heidelberg, organization code 5940, (216) 433-3859.
12a. DISTRIBUTION/AVAILABILITY STATEMENT
Unclassified - Unlimited
Subject Categories: 07 and 71 Distribution: Nonstandard
This publication is available from the NASA Center for AeroSpace Information, (301) 621-0390.
!12b. DISTRIBUTION CODE
13. ABSTRACT (Maximum 200 words)
An Active Noise Control (ANC) system for ducted fan noise was built that uses actuators located in stator vanes. The
custom designed actuators were piezoelectric benders manufactured using THUNDER technology. The ANC system was
tested in the NASA Active Noise Control Fan rig. A total of 168 actuators in 28 stator vanes were used (six per vane).
Simultaneous inlet and exhaust acoustic power level reductions were demonstrated for a fan modal structure that con-
tained two radial modes in each direction. Total circumferential mode power levels were reduced by up to 9 dB in the inlet
and 3 dB in the exhaust. The corresponding total 2BPF tone level reductions were by 6 dB in the inlet and 2 dB in the
exhaust. Farfield sound pressure level reductions of up to 17 dB were achieved at the peak mode lobe angle. The perfor-
mance of the system was limited by the constraints of the power amplifiers and the presence of control spillover. Simpler
control/actuator systems using carefully selected subsets of the full system and random simulated failures of up to 7% of
the actuators were investigated. (The actuators were robust and none failed during the test). Useful reductions still
occurred under these conditions.
14. SUBJECT TERMS
Fan noise; Active noise control; Vane actuators
17. SECURITY CLASSIFICATION 18. SECURITY CLASSIFICATIONOF REPORT OF THIS PAGE
Unclassified Unclassified
NSN 7540-01-280°5500
19. SECURITYCLASSIFICATIONOF ABSTRACT
Unclassified
15. NUMBER OF PAGES
3016, PRICE CODE
A0320. LIMITATION OF ABSTRACT
Standard Form 298 (Rev. 2-89)Prescribed by ANSI Std. Z39-18
298-102

