active noise control of low speed fan rotor-stator modes · active noise control of low speed fan...
TRANSCRIPT

C-
NASA Technical Memorandum 107458
AIAA-97-1641
Active Noise Control of Low Speed FanRotor-Stator Modes
Daniel L. Sutliff
AYT Corporation
Brook Park, Ohio
Ziqiang Hu and Frederic G. Pla
General Electric Corporate Research
and Development Center
Schenectady, New York
Laurence J. Heidelberg
Lewis Research Center
Cleveland, Ohio
Prepared for the
3rd Aeroacoustic Conference
cosponsored by the American Institute of Aeronautics and Astronautics
and the Confederation of European Aerospace Societies
Atlanta, Georgia, May 12-14, 1997
National Aeronautics andSpace Administration
https://ntrs.nasa.gov/search.jsp?R=19970017613 2018-07-30T21:38:34+00:00Z


ACTIVE NOISE CONTROL OF LOW SPEED FAN
ROTOR-STATOR MODES
Daniel L. Sutliff*
AYT CorporationBrook Park, Ohio 44142
Ziqiang Hu and Frederic G. Pla*
General Electric Corporate Research and Development Center
Schenectady, New York 12301
Laurence J. Heidelberg*
National Aeronautics and Space AdministrationLewis Research Center
Cleveland, Ohio 44135
Abstract
This report describes the Active Noise Cancellation
System designed by General Electric and tested in theNASA Lewis Research Center's 48 inch Active Noise
Control Fan. The goal of this study was to assess the
feasibility of using wall mounted secondary acoustic
sources and sensors within the duct of a high bypassturbofan aircraft engine for active noise cancellation of
fan tones. The control system is based on a modal control
approach. A known acoustic mode propagating in the fan
duct is canceled using an array of flush-mounted compact
sound sources. Controller inputs are signals from a shaft
encoder and a microphone array which senses the residual
acoustic mode in the duct. The canceling modal signal isgenerated by a modal controller.
The key results are that the (6,0) mode was com-
pletely eliminated at 920 Hz and substantially reduced
elsewhere. The total tone power was reduced 9.4 dB.Farfield 2BPF SPL reductions of 13 dB were obtained.
The (4,0) and (4,1) modes were reduced simultaneously
yielding a 15 dB modal PWL decrease. Global attenuation
of PWL was obtained using an actuator and sensor system
totally contained within the duct.
Introduction
A goal of the NASA Advanced Subsonic Technology
Noise Reduction Program is the reduction in transport
aircraft EPNL by 6 dB relative to 1992 technology. A
component of EPNL is fan tone noise caused by rotor-stator interaction and duct modal propagation. 1
Theoretical and experimental work has shown that
Active Noise Control (ANC) can significantly reduce thetone levels ofducted fans. NASA Lewis Research Center' s
(LeRC) Active Noise Control Fan (ANCF) serves as a testbed to verify proposed ANC technologies. 2,3
A unique characteristic of turbomachinery noise isthe modal structure. The acoustic waveform is three-
dimensional and highly complex, and is best described as
a spinning mode. Knowledge of these spinning modes is
important to identify the generation mechanism and to
successfully apply noise control. Previous work 4 has
shown the potential for modal control to reduce the tonelevels of ducted fans.
This report describes the Active Noise Cancellation
System designed by General Electric (GE) and tested inthe NASA Lewis Research Center's 48 inch Active Noise
Control Fan. The goal of this study is to assess the
feasibility of using wall mounted secondary acoustic
sources and sensors within the duct of a high bypass turbo-
fan aircraft engine for active noise cancellation of fantones.
The GE ANC system is based on a modal control
approach. A known acoustic mode propagating in the fan
duct is canceled using an array of flush-mounted compact
sound sources. The canceling modal signal is generated by
a modal controller. Inputs to the controller are signals
*Senior Member, AIAA."This paper is declared a work of the U.S. Government and is notsubject to copyright protection in the United States."NASA TM-107458

fromashaftencoderandfromamicrophonearraywhichsensestheresidualacousticmodeintheduct.
TheNASAANCFfacilityusesa16-bladedvariable-pitchrotorandcanbeconfiguredwithstatorvanestoprovidespecificmodegenerationandpropagationforactivenoisecontrolresearch.A uniquefeatureontheANCFisthedirectattachmentoftherotorcenterbodytotherigsupportcolumn,eliminatingtheneedforstruts,whichcouldcontaminateacousticmeasurements.Addi-tionally,anInflowControlDevice(ICD)allowsforstatictesting.Thecombinationoflowtip speed(~400ft/sec)andthe48in.diameterproducesfantonesofthesamefrequenciesproducedbyfull sizeadvancedengines.Fig-ure1showsaschematicoftheANCF.TheparametersdescribingtheNASAfanconfigurationusedforthistestaregivenbelowinTableI.
TABLE I
Blade number: 16
Vane number: 26
Exhaust duct diameters:
4-ft OD
2-ft ID
Modes at BPF (m):
All modes cutoff
Modes at 2BPF (m):
(6,0) feo = 651 Hz
(6,1) fco = 983 Hz
Maximum RPM: 1886 rpm
Maximum BPF: 503 Hz
Maximum 2BPF: 1006 Hz
The fan configuration was chosen such that no modes
are cut-on at the Blade Passage Frequency (BPF). The (6,0)mode is cut-on when the fan RPM reaches 64.8 percent of
the maximum speed. The 1053 Hz cut-on frequency forthe second radial mode (6,1) is outside the maximum RPM
range of the test plan.
The target rpm for this system was chosen to corre-
spond to a 2BPF tone of 935 Hz. The system was designed
to operate with a bandwidth of at least 10 percent.
Actuator Array Design and Implementation
Acoustic Array Design
A simulation tool based on a closed-form analyticalsimulation has been developed by R.E. Kraft 5,6 at GE
Aircraft Engines to determine the acoustic modes gener-
ated by an N-element ring source in a cylindrical duct.
This simulation was used to design the acoustic array. The
simulation decomposes the sound field generated by a ring
source into its individual modal components. It assumes
the ring source is composed of a number of"piston-like"
individual sources. Inputs to the simulation are the num-
ber of actuators on thering source, the mode tobe generated,
and source solidity (area of source divided by total ring
area). Results are given in terms of the energy in the mode
to be excited as well as the spillover energy into undesired
higher order modes. The goal of the acoustic array design
was to reach a compromise configuration which minimizes:
• Number and solidity of the actuator elements ........
• Spillover into uncontrolled higher-order modes,
• Energy required by the actuator.
Several configurations were evaluated for the m = 6mode. Results for 24 source combinations are shown in
Ref. 5. The conclusion from this reference is that in order
to maximize the acoustic energy in the m = 6 mode and
minimize the spillover, the number of actuator elementsmust be maximized and the and the solidity must be
minimized. Solidity is the most important factor in the
range of parameters considered.
Practically, for high solidity (greater than 0.50),
increasing the number of actuator elements does not
increase the array effectiveness significantly. For low
solidity (lower than 0.5), increasing the number of actua-
tors significantly increases the effectiveness of the array
by increasing the energy into the m = 6 mode and reducing
the spillover.
The actuator configuration chosen for this work had
16 actuators and a solidity equal to 0.25. This represents
a good compromise between performance and array com-
plexity and size of each element. The main array charac-
teristics are given in Table II.
TABLE II
First two modes generated: 6,-10
Circumferential length: 7.086"
(16.9%)
Energy in m = 6 mode: 29.4%
Energy in m = 6/m = -10: 1.68
Array Element Design
The results of the array design were used as the basis
for a preliminary design of the individual array elements.
Each array element consists of a plate radiator mounted in
a frame. The plate radiator is excited by a Piezoceramic(PZT) thin plate bonded to the plate radiator. The plateradiator is designed 7 so that the resonance frequency of its
first mode corresponds to the design frequency of 935 Hz.
NASA TM-107458 2

Analyticalmodelsandexperimentaldatawereusedtoestimatethewidth,thickness,andmaterialoftheplateradiatorrequiredfora7.086in.lengthandafirst-moderesonancefrequencyof935Hz.Twodesigniterationswereconducted.Thefinalplatedesignconsistsofa0.080in.thickaluminumplateofdimensions7.008-in.by4.488-in.
Theplateradiatorsaremountedin a0.50-in.thickaluminumframeandclampedusinga22-holeboltpattemtorquedto100in.-lb.A seriesoftestswereconductedtoinvestigatevariationsinresonancefrequencyfordifferentradiatorplatesandvariousassemblyprocesses.FourpairsofplateradiatorsandPZTactuatorswereused.Variationsinresonancefrequencyandamplitudewerelimitedto6Hzand1dB,respectively.Dampingratiovariationswerealsosmall.
A5percentvariationintheplatefirstmoderesonancefrequency,withnosignificantchangeindampingratioanda 20Hz,3-dBbandwidthwasobtainedusingavariableclampingforceontheframeandtheuseof (1)1/8-in.compliantgasketsoneachsideof theplate(2)1/16-in.gaskets,and(3)bareframe(nogaskets).
Anrpmbandwidthofatleast10percentwasdesireable.Toincreasethebandwiththedampingratiowasincreased.Acommercialstructuraldampingmaterialwasalsotestedto finetuneplateradiatorsandcontroltheirdamping.Dampinglayerthicknessesof1/2-in.by2-in.and1-in.by2-in.weretested.Thedampingratiosforuntreated,l/2-in.by2-in.treated,and1-in.by2-in.treatedplateswere1.1,1.5and2.2percent,respectively.Thefirstmodereso-nancefrequencydecreasedfrom907to854to807Hzwithincreasingdampingratiodueto theincreasingmassloading.
Finally,itwasshownthattheelectriccircuitdrivingthePZTactuator(amplifierandmatchingcircuits)affectstheresonancefrequencyof theassemblybyasmuchas5percentforthedesignusedinthisstudy.Thisshowsthatit isfeasibletotunetheactuatorresonancefrequencyanddampingbyadjustingtheimpedanceof thematchingcircuit.
It wasconcludedthattheadditionofdampingmate-rialwasthemosteffectiveandsimplewaytotuneplateradiatorsandcontroltheirdampingforthisprogram.A1-in.by2-in.externaldampinglayerwasappliedtoalltheplateradiatorswhichraisedtheirdampingfactorfromanaverageofabout0.5percentto~2percent.
Longtermreliabilitytestingfor theplateradiator/PZTactuatorcombinationwasconducted.Theplateradiatorwasrunsuccessfullyfor340hratasoundpres-
surelevelof130dB(PZTactuatordrivenat80Vrms),andfor 170hrat134dBmeasured50.8mmawayfromthecenterofthediaphragm.Figure2showsadiagramofthefinalarrayelementconfiguration.
Modal Control Algorithm
Modal Control Strategy
A modal control strategy was developed at GE CRD
for the active control of fan noise. This approach has the
potential to be simpler than the time- or frequency-domain
approaches. It allows each acoustic mode propagating in
the fan duct to be controlled yielding a much better controlover the far-field noise radiation than the standard time- or
frequency-domain approaches.
The basic principle is as follows. The composite
primary and canceling sound field is sensed by an array of
error sensors located in the engine duct. A modal decom-
position is performed using a spatial Fourier transform to
extract the amplitude and phase of each mode to be
canceled. This signal is then used to adjust the amplitude
and phase of each "canceling mode" using an LMS algo-
rithm. An inverse spatial Fourier transform is then per-
formed on the "canceling mode" signal to generate the
canceling signals for each individual canceling source.
One of the advantage of the modal approach is its
simplicity and its ability to control modes individually.
This approach blends the effectiveness of existing control
algorithms with the physical understanding of duct acous-
tics to provide an efficient and simple control scheme. The
controller size is independent of the number of error
sensors and canceling sources since it is reduced to a set of
independent single-input, single-output controllers - onefor each mode to be canceled.
This approach considerably reduces the complexity
of the controller compared to conventional time-domain
or frequency domain control schemes. Increased resolu-
tion can be achieved by simply increasing the number of
sensors and actuators. As with the time- and frequency-
domain approaches, one critical element is the ability of
the sensors and actuators to maintain known phase and
amplitude characteristics. This requires on-line or off-line
actuator and sensor system identification to be performed
depending on their amplitude and phase stability.
The controller design was performed assuming the
following design variables and assumptions:
• The fan duct is annular,
• The primary noise source is tonal and due to rotor/stator interactions,
NASA TM-107458 3
• Onemodeatonefrequencymustbecanceled,• A 16-sourcecircumferentialarrayofwall-mounted
plateradiatorsisusedasthecancelingsource,• Errorsensingis performedwitha circumferential
microphonearray,• A tachometersignalis availableasa frequency
referencesignal,• Primary(fan)andsecondary(cancelingarray)sources
donotaffecteachother,• Onlyonecircumferentialmodeis cut-onin the
frequencyrangeofinterest,• Soundpropagationin theductislinear,• Littlesoundreflectionattheductopening.
Theseassumptionsareappropriatetofull-scaletur-bofanengineswiththeexceptionofthenumberofmodes.
Modal Control Concept
The fan noise is generated by interactions between
rotor blades and stator vanes. The primary noise is tonal
and propagates upstream and downstream of the fan ductin the form of circumferential and radial modes. For the
purpose of this work, only circumferential modes are
considered. For a given fan rotational speed f2(s) (s is the
Laplace variable) and duct geometry, the modal composi-tion of the sound field is well known.
This information is used by the controller to generate
a canceling sound field using an array of secondary
sources. The total noise E(q, s) (q is the circumferential
angle) in the mode of interest (mode m) at the microphone
array is equal to the sum of the primary fan noise D(q, s)
and the secondary canceling noise Y(q,s) for that mode.
The goal of the control system is to adjust the amplitude
and phase of the mode generated by the secondary sources
in order to minimize the amplitude of mode m in the duct.
Modal Control Algorithm
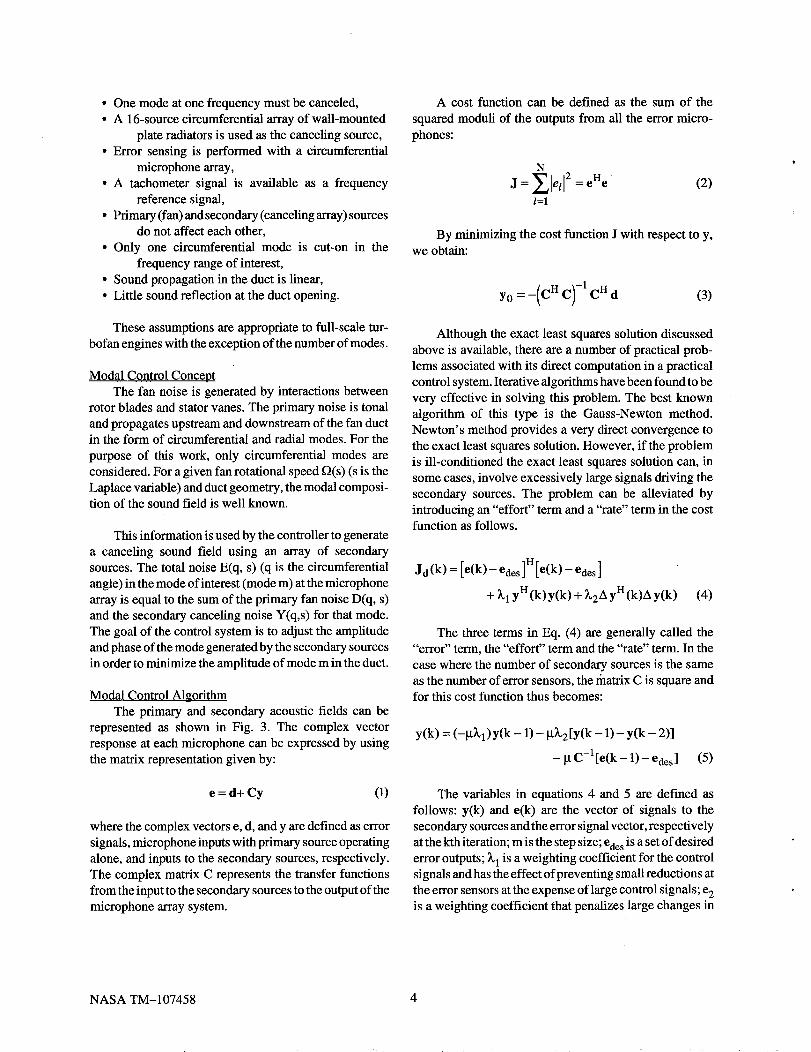
The primary and secondary acoustic fields can be
represented as shown in Fig. 3. The complex vector
response at each microphone can be expressed by using
the matrix representation given by:
e = d+ Cy (i)
where the complex vectors e, d, and y are defined as error
signals, microphone inputs with primary source operating
alone, and inputs to the secondary sources, respectively.
The complex matrix C represents the transfer functions
from the input to the secondary sources to the output of the
microphone array system.
A cost function can be defined as the sum of the
squared moduli of the outputs from all the error micro-
phones:
N
J=Zle/12=e"e/=1
(2)
By minimizing the cost function J with respect to y,we obtain:
y0=-(cHc)-IcHd (3)
Although the exact least squares solution discussed
above is available, there are a number of practical prob-
lems associated with its direct computation in a practical
control system. Iterative algorithms have been found to be
very effective in solving this problem. The best known
algorithm of this type is the Gauss-Newton method.
Newton's method provides a very direct convergence to
the exact least squares solution. However, if the problem
is ill-conditioned the exact least squares solution can, in
some cases, involve excessively large signals driving the
secondary sources. The problem can be alleviated by
introducing an "effort" term and a "rate" term in the costfunction as follows.
Jd(k) = [e(k)-ede s]I-I[e(k)- edes ]
+ )_lyH (k) y(k) + )_2A yH (k)A y(k) (4)
The three terms in Eq. (4) are generally called the
"error" term, the "effort" term and the "rate" term. In the
case where the number of secondary sources is the same
as the number of error sensors, the rhatrix C is square andfor this cost function thus becomes:
y(k) = (-[d'_'l)y(k - 1) - bt_ 2 [y(k -1)- y(k - 2)]
-- _ C -l[e(k - 1) - ede s] (5)
The variables in equations 4 and 5 are defined as
follows: y(k) and e(k) are the vector of signals to the
secondary sources and the error signal vector, respectively
at the kth iteration; m is the step size; edes is a set of desired
error outputs; 9_1is a weighting coefficient for the control
signals and has the effect of preventing small reductions at
the error sensors at the expense of large control signals; e 2is a weighting coefficient that penalizes large changes in
NASA TM-107458 4

thecontrolvariableswhichcansometimeshaveadestabi-lizingeffectoniterativealgorithms.
Modal solution
Let us define a spatial modal vector as:
1
.(2rcm'_
Vm: te'" (6)
where m is the circumferential mode order and N is the
number of actuators and sensors evenly positioned around
the duct. The spatial modal vectors V are orthogonal and
satisfy the following relationship:
¥/H Ym = forl= (7)
where 1 and m are integers smaller than N.
The output vector from the microphone array in theduct can be written as a summation of several modes.
Since the primary goal is to control one single circumfer-
ential mode (m = 6), the output from the controller to the
actuator can be expressed as:
y(k) = yM(k)¥M (8)
where YM(k) is a complex number representing the modalcontroller output at the kth iteration.
In Newton's algorithm, the system transfer function
C has to be provided to update the input to the actuators.
The easiest way to measure the transfer function is to send
a signal to the actuators and to measure the microphone
outputs without the primary noise sources. The transfer
function can be easily calculated as:
VMC=Xcal/Ycal=(Xcal/Ycal)_MM =CMVM yn (9)
where C M = Xcal/Yca1 is mth modal transfer functioncoefficient. Its inverse is given as
C-1= Ycal/Xcal = (1/CM)V M vH = C_ VM V H (10)
By multiplying both sides of Eq. (5) by the modal
vector V M, we get:
V n y(k) = (1 - [.t_ 1 ) VH y(k - 1) - _t_,2 V H [y(k - 1)
- y(k - 2)1 = _tVMn C -1 [e(k - 1) - ede s ] (11)
The above vector equation can be Simplified to the
following scalar equation:
YM(k) = (1 - _,l)YM (k - 1) - la_,2 [y(k - 1)
- y(k - 2)1 = I.tC_ [e M (k - 1) - edesM ] (12)
Sensor and Actuator Calibration
Any difference among the actuator channels (both in
amplitude and phase) must be compensated for since we
want to generate a single spatial mode from the actuator
array. These differences can be caused by differencesbetween the actuator mechanical and electronic elements.
The exact modal information needs to be extracted
from the sensor array, any difference (magnitude and
phase) among sensor input channels also has to be com-
pensated for. These differences can be caused by differ-
ences between sensors and/or sensor electronics (all the
way to the controller digital input). The responses and
gains of the sensors can be assumed to be linear and not to
change during the test period allowing the sensor calibra-tion to be conducted off-line.
Time-domain averaging is used in the data acquisi-
tion process to minimize the effect of broadband noise.
Time-domain averaging is possible since the test signal is
periodic and stationary, and because the signal generation
and acquisition processes are synchronized to the blade
passage frequency through a shaft encoder (synchronous
sampling).
Controller hardware/software implementation
Figure 4 shows ablock diagram of the system integra-tion on the ANCF.
The controller hardware includes an industrial rack
mount 486-DX2-66 PC, a Motorola DSP96002 signal
processing board, a 32-channel ADC input board, and a
16-channel DAC output board. The software was imple-
mented in C, and the 96000 Assembly language. The
software has a user-friendly, menu-driven interface which
allows the easy setup of important control parameters such
as the m-order of the mode to be canceled, convergence
constants. The user can also operate the system either in a
NASA TM-107458 5

manualor an automatic mode and start the various calibra-
tion procedures from the menu interface. Live displays of
individual signals, modal signals, and performance
indexes are available for use during the testing process.
The speed of rotation of the shaft is obtained using an
optical encoder. The encoder signal is used to generate a
"frame signal" at the 2BPF (around 1 kHz) which is usedas an absolute frame reference and to initialize the control-
ler. A sampling signal at 4 times 2BPF is derived from the
frame signal using an off the shelf frequency multiplier in
order to synchronously trigger the data input and output
processes.
A custom-designed I/O signal conditioning box was
used for this test. It includes 16 inputs for the microphone
array, 16 inputs for the feedback sensors on the array
elements, and 16 outputs for the canceling array. The I/O
box performs the following functions:
• 32-input microphone signal conditioning includ-
ing on all channels: microphone preamplifier and power
supply, 0 to 40 dB adjustable gain, and active 4-pole low-
pass and high-pass filters programmable using plug-in
resistor packs.
• 16-output array element signal conditioning
including on all channels: adjustable gain and active
4-pole low-pass reconstruction filter programmable using
plug-in resistor packs.
Additional specifications include: SNR greater than
48 dB, cross-talk less than -48 dB, and Common Mode
Rejection Ratio (CMRR) greater than 80 dB, test-channel
output with dial-in channel selector, connector for ribboncable to I/O boards in the ANC controller.
The amplifier array consists of 8 stereo audio ampli-
tiers with custom step-up transformers and impedance
matching inductors to drive the PZT elements.
System Integration
Actuator Array IntegrationThe actuator array was mounted on a 12-in. long spool
section of the NASA fan duct. Flats were machined on the
spool to mount each array element. Each element was
resiliently mounted on the ring using a 4-bolt pattern
torqued to 30 in.-lb for easy mounting and removal.
Testing was performed to determine the amount ofstructure-borne cross-talkbetween actuators. Initial results
showed an unacceptably high amount of cross-talk
(-10 dB) between adjacent actuators primarily as a result
of the matching resonances between actuators, the low
damping of the diaphragms, and the low resiliency of the
initial mounting technique. The problem was resolved by
doubling the thickness of the vibration isolation gasket,
putting a tygon jacket around each mounting screw, and
using vibration absorbers between the actuator frame and
the mounting bolt.
A 30-mil perforated steel plate was cut to dimension
to fit into a 30-mil 5 3/16-in. groove machined inside the
ring spool by NASA. The perforated plate ensures smooth
flow over the actuators and provides additional protectionfor the actuators.
The feedback microphone array was implemented
using 16 off the shelf Knolls microphones with custom
signal conditioning circuits similar to the microphones
used in the NASA Fan rotating rake measurement system.
Calibration showed that the microphone response was
accurate up to 135 dB with fairly fiat amplitude and phase
response over the frequency range of interest. Each micro-
phone in the 16-microphone array was packaged in a
porous shell adapter which was flush mounted in the
NASA fan ring.
A microphone/canceling source calibrator was
designed and fabricated. The calibrator is used to perform
amplitude and phase calibration of each microphone and
canceling source up to a frequency of 3 kHz using a
Shroeder calibration sequence. The calibrator consists of
a plastic housing with a circular piezoceramic bender
element generating the calibration acoustic signal and
separating the calibrator in two chambers.
The calibration process was designed to compensate
the amplitude and phase differences among 16 input
sensor and 16 output channels. The calibration process
was implemented in the following way:
1. Calibrate the feedback microphones in the backchambers of the actuators.
A calibration signal was sent to each actuator from the
controller to drive the actuator in the selected frequency
range. A transfer function was measured between every
• feedback microphone and the microphone inside the cali-
brator (as a reference). Each feedback microphone input
was multiplied by the inverse of its transfer function to
compensate for the phase and amplitude differences amongall channels.
2. Calibrate the actuators using the feedback
microphones.
NASA TM-107458 6

Acalibrationsignalwassenttoeachactuatorfromthecontrollertodrivetheactuatorin theselectedfrequencyrange.Atransferfunctionwasmeasuredbetweenthecali-brationsignal(asareference)andeachfeedbackmicro-phoneinput(microphonesensitivityandphasewascompensated).Eachactuatoroutputwasmultipliedbytheinverseofitstransferfunctiontocompensateforthephaseandamplitudedifferences among all channels during
controller operation.
3. Calibrate the input sensors.
A calibration signal was sent to the calibrator from the
controller to drive each actuator in the selected frequency
range. A transfer function was measured between the
control microphone and the microphone inside the cali-
brator (as a reference). Each feedback microphone input
was multiplied by the inverse of its transfer function to
compensate for thephase and amplitude differences among
all channels during controller operation.
The speaker calibration process was initially designed
to compensate for actuator sensitivity and phase variation
among all channels for both on-line and off-line operation.
This procedure was instituted when it was observed that
actuator sensitivity varied with different input levels for
an initially selected PZT material. A feedback sensor was
designed to monitor the sensitivity change during opera-
tion and to allow on-line compensation. It was found that
actuator non-linearity was not an issue when using thefinal selection for PZT material, and, combined with the
difficulty of implementing on-line calibration within the
tight test schedule, it was decided not to implement on-linecalibration in the software, and the calibration was accom-
plished off-line as described above.
The first resonance frequency of the piezoceramic
bender element is around 900 Hz. It can be driven by an
audio amplifier or directly from a signal generator. A
reference microphone is mounted in the front calibration
chamber facing the opening. An O-ring on the chamber
opening allows airtight contact between the calibration
chamber and the sensor or actuator being calibrated. Tests
conducted with an instrumentation microphone showed
that the transfer function (both magnitude and phase)
between the reference microphone and the calibration
microphone was flat up to around 3 kHz.
Results
Test Bed
The GE ANC Modal Control System was testedinstalled in the NASA Lewis Research Center's 48 inch
ANCF facility. 2,3 The primary measurement device on
the ANCF is the Rotating Rake. The Rotating Rake is an
implementation of a technique originally conceived by
T.G. Sofrin 8 whereby a rake containing radially distrib-
uted pressure transducers rotates in the circumferential
direction at a precise fraction of the fan rotational speed.Each circumferential acoustic mode is known to rotate at
a unique frequency 5 in the rotor reference frame so that a
Doppler shift is induced in the rake reference frame.Further reduction of the data into radial modes is accom-
plished through a least squares curve fit 9.
The ANCF is located in the NASA LeRC's
Aeroacoustic Propulsion Laboratory 10 (AAPL), a hemi-
spherical anechoic (to 125 Hz), test facility. Farfield
measurements are taken from 28 microphones at a radius
of 50 ft in the ANCF horizontal plane. The SPL data from
these microphones are corrected to 40 ft, standard dayconditions.
Test Conditions
The test of the GE ANC system occurred over the
period of July to September 1995. The primary ANC Ring
configuration was the exhaust installation. The primary
ANCF configuration was 26 vanes with a blade pitch of
50 percent. The spacing between the rotor trailing edge
and the stator leading edge, measured at the hub, was
2.25 in. The system was tested over a fan corrected rpmrange of 1585 to 1804. With 16 blades and 26 vanes, the
BPF is cutoff over this range.
At 2BPF, in the exhaust, the (6,0) mode begins to
propagate at 1222 corrected rpm and the (6,1) mode
propagates at and above 1845 corrected rpm. Therefore, in
the target configuration, only a single mode propagates
over the range tested. The ANC control system was
designed to target the 2BPF tone and thus operated over a
frequency range of 860 to 980 Hz. Secondary studies were
done with the ANC ring installed in the inlet.
In addition, one study was done with the ring in the
exhaust, with 28 stator vanes, over a fan corrected rpmrange of 1481 to 1704. At 2BPF the (4,0) and (4,1) modes
are cut-on. This was beyond the design criteria of this
ANC system but was done to investigate the possibilities
of controlling higher order radials. It is realized that
achieving acceptable results in control of two radials with
a single ring actuator requires proper phasing between the
fan generated radials.
Data Summary_
Reduced data obtained with the rotating rake are
presented in the following figures. A data point was taken
NASA TM-107458 7

atagivenrpmwiththecontrolon,followedbyadata pointwith the control off.
The control off and control on power levels in the
(6,0) mode versus corrected rpm are shown in Fig. 5(a) for
the exhaust. The general control off levels are around
114 dB PWL, dropping to 107 dB PWL at 1800 rpm. A
reduction of at least 15 dB occurs over the entire rpm range
tested. The results are particularly outstanding around
1700 rpm (920 Hz), with 25 to 30 dB PWL reduction. This
implies cancellation of the entire mode.
Figure 5(b) shows the results are again excellent
around 920 Hz with the ANC ring installed in the inlet.
Complete cancellation of the mode occurs. Above
1720 rpm the transducer output reached the maximum
safe output allowed for this test and therefore the optimumreduction could not be achieved.
The 2BPF total tone power (PWL) reduction is shown
in Fig. 6. The total tone power is the sum of the power of
all modes in a given harmonic. The maximum possible
PWL reduction can be obtained by mathematically elimi-
nating the (6,0) mode from the control off modal decom-
position. This is also shown on Fig. 6. A general trend of
4 tO 8 dB total PWL reduction, with a maximum of 9 dB
reduction is seen in the exhaust. This is out of a possible
14 dB. The single run taken with the ANC ring in the inlet
shows 2 to 4 dB reduction. As reported in the baselinestudies for this fan,2,3 the 11-segmented ICD generates a
strong m =-1 mode in the inlet. This limits the amount oftotal reduction obtainable in the inlet, about 8 to 12 dBPWL.
Mode power structure obtained from the rotating rake
is plotted in three-dimensional bar graph format with
circumferential mode index along one horizontal axis,
radial mode index along the other, and mode PWL as bar
height. Along the back wall the total power in eachcircumferential mode is shown. The control off mode
structure is presented in Fig. 7(a). This is the acoustic
characteristic of the fan at 2BPF. Ideally, the only mode
that would exist is the (6,0) due to rotor stator interaction,
but, typically, neighboring modes are also excited, per-
haps due to spacing or to blade-to-blade imperfections.
Also, other physical obstructions can cause periodic flow
disturbances which generate modes.
An example is the ICD (Inflow Control Device)
which excites the m = -1 mode. The total tone power at2BPF of 113.0 dB is the sum of each circumferential
mode. This mode is not very large, but its contribution
limits the PWL reduction that can be obtained by eliminat-
ing the (6,0) mode. If the (6,0) mode were totally elimi-
nated, the remaining power would be 101.4 dB. This
means the maximum reduction possible is 11.6 dB PWL.
The same format is shown in Fig. 7(b) with the ANC
system operating. The (6,0) mode has been completely
eliminated, a 30 dB SPL reduction. There are small
increases in a few of the other modes. The total power is
104.2 dB, a 8.8 dB PWL reduction out of a possible11.6 dB.
Figure 8(a) shows the mode structure of a similarcontrol off case. The (6,0) mode and the noise floor are
comparable to the case shown in Fig. 7(a). The control on
results are not as favorable, as seen in Fig. 8(b). The (6,0)
mode while greatly reduced, has a small remnant. A larger
problem is the more numerous and larger spillover modes.
The total PWL reduction is 4.4 dB, not as high as the
previous case.
A database of the complete mode structure was
obtained and analyzed for each point. The amount of
reduction achieved at a given configuration varied. These
two cases were chosen to represent the results. The higher
levels of reduction occur when the modal spillover is low,
as in Fig. 7. Higher spillover prevented full realization of
the reduction in some runs, as seen in Fig. 8. The severity
of spillover varied with calibrations (system identifica-
tion). In particular, the transfer function of the feedback
microphones in the back chambers of the actuator exhib-ited variation.
The modal structure generated by ANC system with
the fan off is presented in Fig. 9. The outputs of the
transducers were higher than during the standard runs, in
this case 119 dB PWL. The spillover modes are generally
down 20 to 30 dB or more. The sum of the spillover modal
power is 10 dB below the total PWL. In a sense, this is the
signal-to-noise ratio of the ANC system.
The farfield data confirm the reduction. A typical
control on/off directivity comparison is shown in Fig. 10.A 13 dB SPL reduction occurs in the (6,0) mode lobe at
125 percent. The ANC ring is installed in the aft and
therefore only SPL data from 90 to 180 percent are
relevant. Integrating these two curves would yield a 2.0 dB
PWL reduction. However great care must be taken with
this number as the integration may not be accurate due to
azimuthal variations in SPL directivity that can occur
when multiple mode levels are present.
Although not designed to cancel other than spinning
modes with only a single radial, the ANC system was
operated to cancel the m = 4 mode, which is generated
when 28 stator vanes are installed in the rig. Up to 15 dB
NASA TM-107458 8

PWLreductionoccursinthetotalm=4modepowerlevelasshowninFig.11(a).
Atm=4,2radialsarecut-on,the(4,0)and(4,1).The(4,1)cuts-onjustbelow1480rpm.Figurell(b) showscancellationoccursin bothradialsovertherpmrangetested.Thetransducerscanminimizeonlythewallpres-sure,whichinthiscaseisthesuperpositionofthe(4,0)and(4,1)wallpressure.Thisisafunctionofspacingbetweenallcomponentsofthesystem,sincethephasespeedvarieswiththecutoffratio.
Figures12(a)and(b)showatypicalmodepowermapforthe28vanecontroloffandoncases.Atthisfrequencythe(4,0)iscompletelyeliminatedand(4,1)is reduced9dB.Spilloveralsooccurs,limiting the total PWL reduc-
tion to 2.0 dB out of a possible 10.8 dB.
Conclusions and Recommendations
An active noise cancellation concept for a high-
bypass turbofan was demonstrated. The system is based
on a ring of flush mounted sources and a modal control
approach. All sensors are contained within the fan duct.
The design condition (single radial) key results are
that the (6,0) was completely eliminated at the 920 Hz
design frequency and substantially reduced over a 15 per-
cent speed range. The total tone power was reduced 9.4 dB
(out of a possible 14 dB) (SPL) were obtained. Farfieldreductions in the mode 6 lobe of 13 dB (SPL) occurred.
The results indicate that global attenuation of PWL at the
target frequency was obtained in the aft quadrant using an
ANC actuator and sensor system totally contained withinthe duct.
A fan configuration with two radials present, which
was beyond the design condition, was tested. The (4,0)
and (4,1) modes were reduced simultaneously, yielding a15 dB PWL decrease. The reduction in m = 4 occurred
over a 12 percent rpm range. This system was not designed
to reduce multiple radials, but good results were obtained.
Further investigation may determine the limits extending
a system of this type to multiple radials.
The quality of the results depended on precise mode
generation. High spillover into spurious modes generated
by the ANC actuator array caused less than optimum
levels of PWL reduction. The variation in spillover is
believed to be due to the actuator calibration procedure,
but must be confirmed in subsequent tests. Another pos-
sibility is structure-borne cross-talk between actuators.
Further investigation of the cause of spurious mode
spilloveris recommended, particularly as this might impact
the accuracy requirements of the ANC actuator calibra-
tion and stability requirements of continuous operation.
Continuation of the development of an integrated
analytical simulation that can be used to model the fan
noise source and propagation, the coupling of the ANC
actuators to the duct, the control system sensor signal
pickup, and the control system algorithm data processing,
is recommended. Incorporation of the effects of passivetreatment into this simulation will further enhance its
value as a design and evaluation tool in future studies.
In this study, ANC suppression was demonstrated for
a single cut-on radial mode at the target spinning mode
order. In order to develop ANC systems that will find
eventual practical application in an aircraft engine fan
duct, it will be necessary to tackle the problem of multiple
cut-on radial modes in future efforts. The ability to under
specify the number of circumferential actuator rings
required to reduce multiple radials may be indicated by
this study.
Acknowledgments
The authors would like to acknowledge the contribu-
tions of Scott Sommerfeldt and Yong-Cheol Park (of Penn
State University at the time of this contract) to the devel-
opment of the control system algorithm, software, andhardware.
References
1. Tyler J.M., and Sofrin T.G., "Axial Flow CompressorNoise Studies," SAE Transactions, Vol. 70, 1962,
pp. 309-332.
2. Heidelberg, L.H., Hall, D.G., Bridges, J.E., and
Nallasamy, M., "Ducted Fan Test Bed for ActiveNoise Control and Aeroacoustics Research", NASA
TM-107213, May 1996, also AIAA Paper 96-1740
May 1996.
3. Sutliff, D.L., Nallasamy, M., Heidelberg, L.J., andElliott, D.M, "B aseline Acoustic Levels of the NASA
Active Noise Control Fan Rig", NASA TM-107214,
May 1996, also AIAA-96-1745, May 1996.
4. Sutliff, D.L., and Nagel, R.T.,"Active Control of Far-
field Noise from a Ducted Propeller,"AIAA Journal,
Vol. 33, No. 2, February 1995, pp. 231-236.
5. Kraft R. E. and Kontos K. B., "Theoretical Implications
of Active Noise Control for Turbofan Engines,"
AIAA Paper 93-4355, Oct. 1993.
NASA TM-107458 9

6. Kraft,R.E.,"ActiveControlofFanNoise:FeasibilityStudy.Vol.6:TheoreticalAnalysisforCouplingofActiveNoiseControlActuatorRingSourcestoanAnnularDuctwith Flow,"NASACR-198514,September1996.
7. Pla,F.G.andRajiyahH., "ActiveControlof FanNoise-FeasibilityStudy.Vol.2:CancelingNoiseSourceDesignofanAcousticPlateRadiatorUsingPiezoceramicActuators,"NASACR-195440,March1995.
8. Cicon,D.E.,Sofrin,T.G.,andMathews,D.C.,"Investigationof ContinuouslyTraversingMicro-phoneSystemfor ModeMeasurement,"NASACR-16804,Nov.1982.
9. Hall,D.G.,Heidelberg,L.,andKonno,K.,"AcousticModeMeasurementsintheInletofaModelTurbofanusingaContinuouslyRotatingRake:DataCollection/AnalysisTechniques,"NASATM-105963,Jan.1993;alsoAIAAPaper93-0599,Jan.1993.
10.Cooper,B.A.,"A LargeHemi-AnechoicChamberEnclosureforCommunity-CompatibleAeroacousticTestingofAircraftPropulsionSystems,"JournaloftheInstituteof NoiseControlEngineeringof theUSA,Jan/Feb1994.
NASATM-107458 10

0_>
o
tmoo
ACTUATORS (16)
PZT T_n_ate
MICROPHONES (16)
rotor/stator planes
(o = 0.307)
inlet exit plane
location location
(hub-to-tip ratio,ROTATING RAKE (o = 0.5)
o = 0.0)
CANTILEVERED
CENTER BODY
48" diameter fan
overall inlet & exhaust ducts i/d = 1
FIGURE 1. Schematic of Active Noise Control Fan showing GE ANC Installation.

0.5 in
Damping
Duct Interior
30-mil Perforated Plate
0.75 in
Back Chamber
Feedback Sensor 30-mil 2-in x 2-in PZT Actuator
a) Element Schematic
Feedback Sensor
Frame
Back Chamber
Back Plate
Radiator Plate
Duct Interior
Perforated plate
Ring Structure
b) Installation Schematic
FIGURE 2. Ring Element Actuator
NASA TM-107458 12

r.,¢l
>
[
....14_t_Oo
%O
A/D e'( t _ Ci.p ut C spk y(t) D/A
[: Sy.......... ...................................................... "-1 IDF_"_''_1---f-:a:--f................. ..................................
e(k)
!
eu(k)
Spatial modaldecomposition
Equation 12
Input gain and phasecompensation (off-line)
v,,(_) .. VMY
m
Spatial modalreconstruction filter
Speaker gain and phasecompensation (on-line)
TDA: Time Domain Average
FIGURE 3. Modal Control System - Signal Flow Block Diagram

>
0
4_
O0
4_
• •
• •
• •
• •
• •
• •
• •
• •
AmplifiersActuator Array
Actuator Array Feedback/-
\Shaft Encoder
Error Microphone Array
FIGURE 4. GE Active Noise Cancellation System Block Diagram as installed in NASA LeRC ANCF

120
,.., 105 .............................. r............................... : ...............................
a,_ 1009590ii iiii iiiI i ii iiii.iiii iiii
85
80 I i
1550 1600 1650 1700 1750 1800 1850
Corrected RPM
a) Mode (6,0) Power Levels in Exhaust
120
115
110
,-, 105
100
95
_. max trans............................................. iSfft_i
..............i...............i...............i.......l__mu_==o:
85 .............................. ; ............... ' ............... ' ..............................
80 ........ I .... I .... I .... I ....
1550 1600 1650 1700 1750 1800 1850
!
lucer
Corrected RPM
b) Mode (6,0) Power Levels in Inlet
FIGURE 5. Effect of ANC: Mode (6,0) PWL vs RPM
NASA TM-107458 15

DNV ol anp qA_d ouo& d_l_ l_l o& u! uo!lanpaH "9 _IHflDI_I
(ZH) £ouonboaq
000I 066 086 0L6 096 096 0¢6 0_6 0Z:6 016 006 068 088 0L8 098 098
' ' I ' ' I ' I ' I ' I ' I i I ..... I ' 0
..................i.................._.........i.........i........i.........i........i................................................_........
......................,.............................. ,.........,.........,........................:: i : i i i ! i ! "I i i
................. ! .......
........._,.........i..........,._.....i........."...._ ....i.....__ ....._........_........_........._.........i........
.................."' ......."'"\"'_ ............................!'"I" ".... ........-'.........................................................oI
....................................•kL-............................11........................................................................... _L• 1:2-_ 1_
....................................... ".""'x"":_" ...... :'"'l"! ......... .."........ ":......... i......... i......... _......... _........ ":........ _Ii ! i ",¢ _:r_ i ....
......... :......... :......... :........ :.......... :.,_.... _rt.•...... i......... : ........ -......... :.................. J......... '_........ "........ _I
• ' t {........ . ....... _......... _......... :......... ; ....... {).,_. ..... _:,,,. ..... • ......... :..... _ ....................... ' ...... ..'........ 17[, , , _ . , _ , , ,: : : : "_ : : : : : : "(3 -
: : : : : : : : : -- _I
oIq!SSOd
tuntu!xelAI
-'0-- ZSflVHX_I -'0"--
±_t"-lNI
aolenlov fi'u!):I DNV
jo uo!lgoo'-I
970
L oe-,_
t_
0
6 '_
oO
0
I
<

lls
110
105
_: 1%
95
90
8S
115
I10
105
_%_9s _
a,%
115
110
_oo_
90
85
FIGURE 7. Modal Stucture Control Off/On with m=6 as ANC Target
Exhaust, 2BPF, 1688 RPMc, 920 Hz (Low Modal Spillover)
NASA TM-107458 17

115
110
IOS
,,_ 100
9_
9O
_5
115
II0
lOS
100
FIGURE 8. Modal Stueture Control Off/On with m=6 as ANC Target
Exhaust, 2BPF, 1690 RPMc, 920 Hz (High Modal Spillover)
NASA TM-107458 18

PWLto t = 119.4 dB
(w/o m=6; 108.9 dB)
FIGURE 9. Modal Stucture Generated by ANC System with m=6 Target
Exhaust, 2BPF, Fan Off, 920 Hz
NASA TM-107458 19

90
85
80
75r_
70
65
60
1
I
!
I il l
I........... -_-*..... i.i ......... : ....t,
i _ i: •i11 I
!
'.ll ......................... ! _.'.4
+ Control Off
- •- Control On
20 40 60 80 100 120 140 160
FarField Angle (degrees)
a) Absolute Farfieid Levels
180
14
12
10
8
6
4
2
0
-2
-4
-6
-8
-10
0 20 40 60 80 100 120 140 160
FarField Angle (degrees)
b) Reduction in Fairfield SPL
180
FIGURE 10. Farfield SPL Directivity with ANC in Exhaust
NASA TM-107458 20

120 : :
115 ..............;............... ;...............................................................
9°....... iiiiiiiiiiiii85 .............. !...........
80 , , , , I T I I I t r ' ' ' I .... r .... I ....
1450 1500 1550 1600 1650 1700 1750
.-. 105
100
95
Corrected RPM
a) Mode m=4 Total
1(4,0) Control Off - [] • (4,0) Control On |
120 -'O-- (4,1) Control Off - O • (4,1) Control On
115 ............................. ,............... , ...............................................
I
............................ i...............i...............:...............110 i "_
95 .............. _-.............. !............... !............... : ...... ,,-.......................,.,'_ _ -::o--o::- _ : ,.P
90 ...... ld .... :....t.)--."- .... : ............... : ..... -'-U .... _'_'"x .... _...............! , ! i : _ :
85 .............. ; ............... ; ............... ; ............... ; ............ _'; ...............I • • : :
80
1450 0 1500 1550 1600 1650 1700 1750
.-, 105
100?:
Corrected RPM
b) (4,0) & (4,1) Mode Levels
FIGURE 11. Effectiveness of ANC with 2 Radials in Duct
Mode 4 PWL vs RPM
NASA TM-107458 21

115,
llo,
105,
FIGURE 12. Modal Stueture Control Off/On with m=4 ANC Target
Exhaust, 2BPF, 1704 RPMc, 920 Hz
NASA TM-107458 22


Form ApprovedREPORT DOCUMENTATION PAGE OMBNo.0704-0188
Publicreportingburdenforthiscollectionof informationis estimatedtoaverage1 hourperresponse,includingthetimeforreviewinginstructions,searchingexistingdatasources,gatheringandmaintainingthedataneeded,andcompletingandreviewingthecollectionofinformation.Sendcommentsregardingthisburdenestimateoranyotheraspectofthiscollectionof information,includingsuggestionsforreducingthisburden,to WashingtonHeadquartersServices,Directoratefor InformationOperationsandReports,1215JeffersonDavisHighway,Suite1204,Arlington,VA 22202-4302,endtothe Officeof ManagementandBudget,PaperworkReductionProject(0704-0188),Washington,DC 20503.
1. AGENCY USE ONLY (Leave blank)
4. TITLE AND SUBTITLE
2. REPORT DATE
May 1996
Active Noise Control of Low Speed Fan Rotor-Stator Modes
3. REPORTTYPE AND DATES COVERED
Technical Memorandum
5. FUNDING NUMBERS
6. AUTHOR(S)
DanielL. Sutliff, Ziqiang Hu, Fredenc G. Pla, and LaurenceJ. Heidelbe_
7. PERFORMING ORGANIZATION NAME(S) AND ADDRESS(ES)
National Aeronautics and Space Administration
Lewis Research Center
Cleveland, Ohio 44135-3191
9. SPONSORING/MONITORING AGENCY NAME(S) AND ADDRESS(ES)
National Aeronautics and Space Administration
Washington, DC 20546-0001
WU-538-03-11
8. PERFORMING ORGANIZATIONREPORT NUMBER
E-10744
10. SPONSORING/MONITORINGAGENCY REPORT NUMBER
NASA TM-107458
AIAA-97-1641
11. SUPPLEMENTARY NOTES
Prepared for the 3rd Aeroacoustic Conference cosponsored by the American Institute of Aeronautics and Astronautics and the Confed-
eration of European Aerospace Societies, Atlanta, Georgia, May 12-14, 1997. Daniel L. Sutliff, AYT Corporation, 2001 Aerospace
Parkway, Brook Park, Ohio 44142 (work funded by NASA Contract NAS3-27571); Ziqiang Hu and Frederic G. Pla, General Electric
Corporate Research and Development Center, Schenectady, New York 12301; Laurence J. Heidelberg, NASA Lewis Research Center.
Responsible person, Daniel L. Sutliff, organization code 5940, (216) 433-6290.
12a. DISTRIBUTION/AVAILABILITY STATEMENT
Unclassifted - Unlimited
Subject Categories 07 and 71
This publication is available from the NASA Center for AeroSpace Information, (301) 621-0390.
12b. DISTRIBUTION CODE
13. ABSTRACT (Maximum 200 words)
This report describes the Active Noise Cancellation System designed by General Electric and tested in the NASA Lewis
Research Center's 48 inch Active Noise Control Fan. The goal of this study was to assess the feasibility of using wall
mounted secondary acoustic sources and sensors within the duct of a high bypass turbofan aircraft engine for active noise
cancellation of fan tones. The control system is based on a modal control approach. A known acoustic mode propagating
in the fan duct is canceled using an array of flush-mounted compact sound sources. Controller inputs are signals from a
shaft encoder and a microphone array which senses the residual acoustic mode in the duct. The canceling modal signal is
generated by a modal controller. The key results are that the (6,0) mode was completely eliminated at 920 Hz and
substantially reduced elsewhere. The total tone power was reduced 9.4 dB. Farfield 2BPF SPL reductions of 13 dB were
obtained. The (4,0) and (4,1) modes were reduced simultaneously yielding a 15 dB modal PWL decrease. Global attenua-
tion of PWL was obtained using an actuator and sensor system totally contained within the duct.
14. SUBJECT TERMS
Ducted fans; Engine noise; Aircraft noise; Aeroacoustics; Active noise control
17. SECURITY CLASSIFICATIONOF REPORT
Unclassified
18. SECURITY CLASSIFICATIONOF THIS PAGE
Unclassified
19. SECURITY CLASSIFICATIONOF ABSTRACT
Unclassified
15. NUMBER OF PAGES24
16. PRICE CODE
A03
20. LIMITATION OF ABSTRACT
NSN 7540-01-280-5500 Standard Form 298 (Rev. 2-89)Prescribed by ANSI Std. Z39-18298-102