advanced noise control fan a 20-year … noise control fan a 20-year retrospective ... journal of...
TRANSCRIPT
National Aeronautics and Space Administration
www.nasa.gov
ADVANCED NOISE CONTROL FANA 20-Year Retrospective
Dan Sutliff / Acoustics BranchNASA Glenn Research Center
Cleveland, OhioUSA
1
https://ntrs.nasa.gov/search.jsp?R=20170001638 2018-07-10T12:40:04+00:00Z
National Aeronautics and Space Administration
www.nasa.gov
Outline
2
BACKGROUND
OVERVIEW
SAMPLE DATABASE
UNIQUE CONFIGURATIONS
NOISE REDUCTION CONCEPTS EVALUATED
MEASUREMENT TECHNOLOGIES EVALUATED
CONCLUSION
National Aeronautics and Space Administration
www.nasa.gov 3
BACKGROUND
National Aeronautics and Space Administration
www.nasa.gov
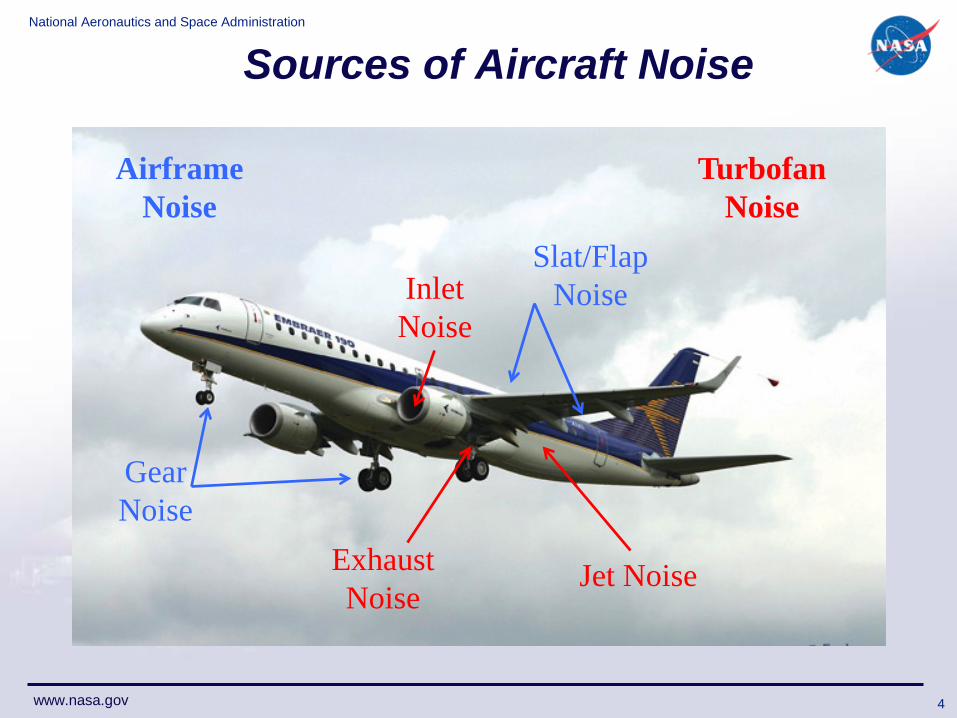
Sources of Aircraft Noise
Inlet Noise
Exhaust Noise
Gear Noise
Slat/Flap Noise
Jet Noise
Airframe Noise
Turbofan Noise
4
National Aeronautics and Space Administration
www.nasa.gov
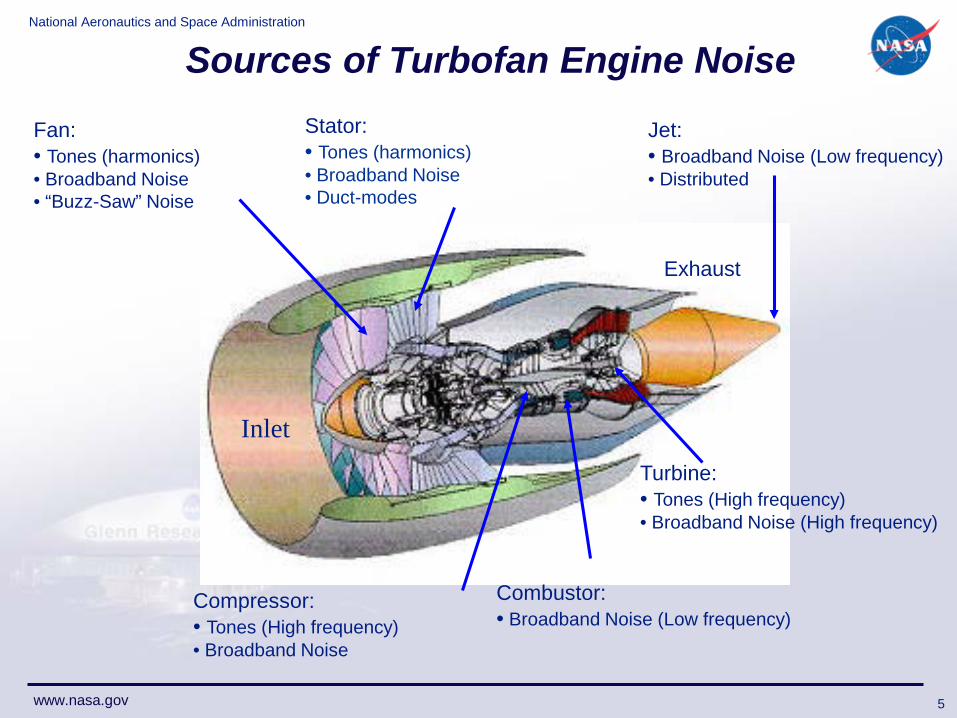
Sources of Turbofan Engine Noise
Compressor:• Tones (High frequency)• Broadband Noise
Jet:• Broadband Noise (Low frequency)• Distributed
Turbine:• Tones (High frequency)• Broadband Noise (High frequency)
Combustor:• Broadband Noise (Low frequency)
Stator:• Tones (harmonics)• Broadband Noise• Duct-modes
Exhaust
Inlet
Fan:• Tones (harmonics)• Broadband Noise• “Buzz-Saw” Noise
5
National Aeronautics and Space Administration
www.nasa.gov
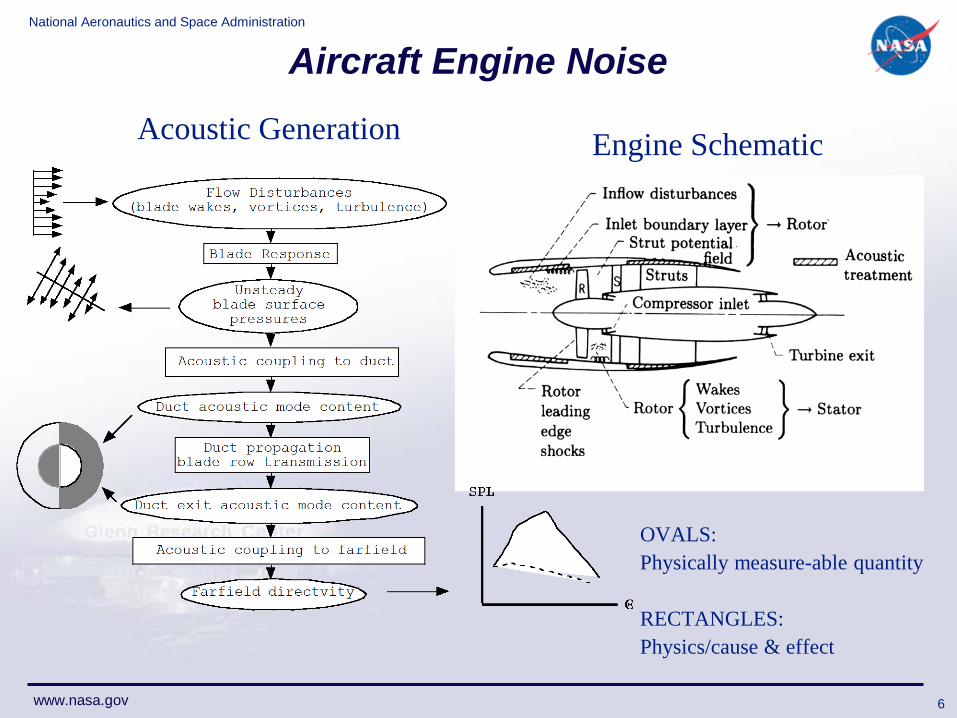
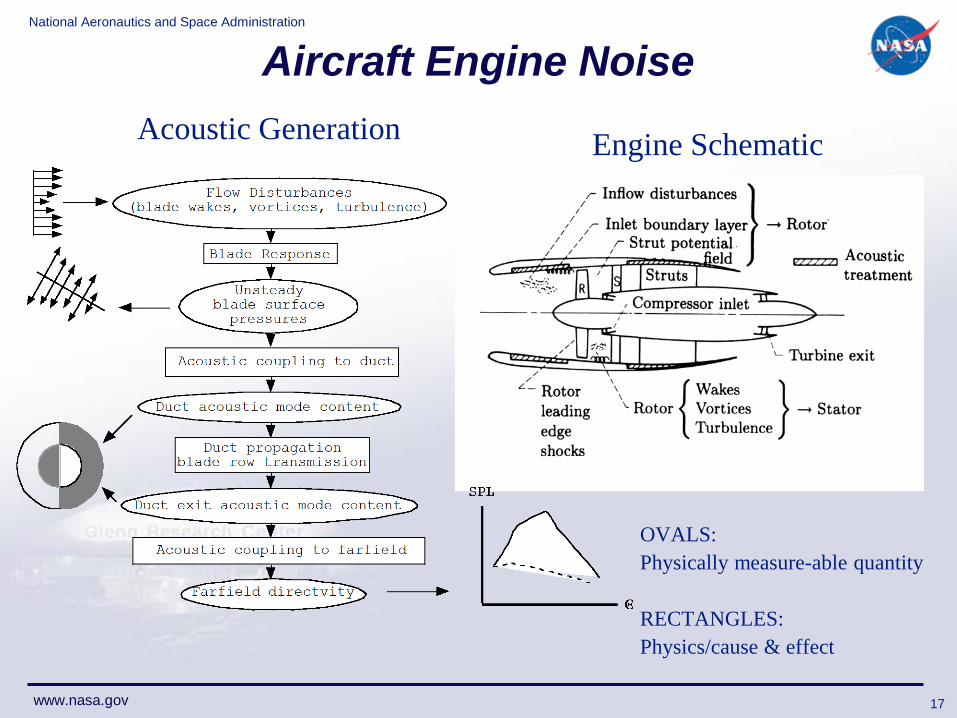
Aircraft Engine Noise
Engine SchematicAcoustic Generation
OVALS: Physically measure-able quantity
RECTANGLES: Physics/cause & effect
6
National Aeronautics and Space Administration
www.nasa.gov 7
OVERVIEW
National Aeronautics and Space Administration
www.nasa.gov
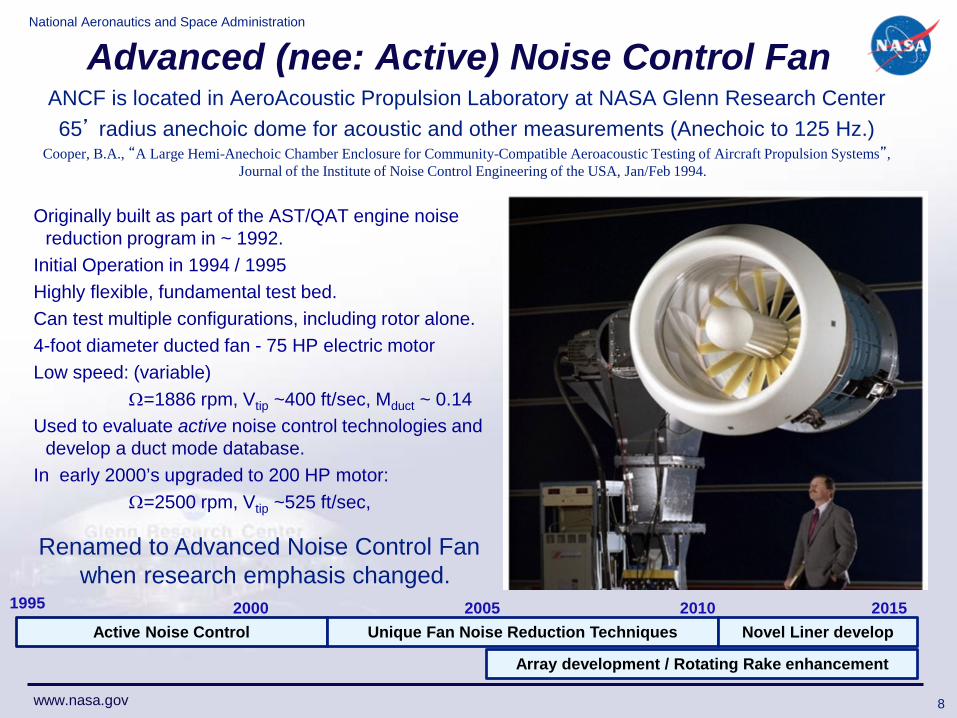
Advanced (nee: Active) Noise Control FanANCF is located in AeroAcoustic Propulsion Laboratory at NASA Glenn Research Center65’ radius anechoic dome for acoustic and other measurements (Anechoic to 125 Hz.)
Cooper, B.A., “A Large Hemi-Anechoic Chamber Enclosure for Community-Compatible Aeroacoustic Testing of Aircraft Propulsion Systems”, Journal of the Institute of Noise Control Engineering of the USA, Jan/Feb 1994.
Originally built as part of the AST/QAT engine noise reduction program in ~ 1992.
Initial Operation in 1994 / 1995Highly flexible, fundamental test bed.Can test multiple configurations, including rotor alone.4-foot diameter ducted fan - 75 HP electric motorLow speed: (variable)
Ω=1886 rpm, Vtip ~400 ft/sec, Mduct ~ 0.14Used to evaluate active noise control technologies and
develop a duct mode database. In early 2000’s upgraded to 200 HP motor:
Ω=2500 rpm, Vtip ~525 ft/sec,
8
Renamed to Advanced Noise Control Fan when research emphasis changed.
1995 2005 2010 2015Active Noise Control Unique Fan Noise Reduction Techniques
Array development / Rotating Rake enhancement
Novel Liner develop2000
National Aeronautics and Space Administration
www.nasa.gov
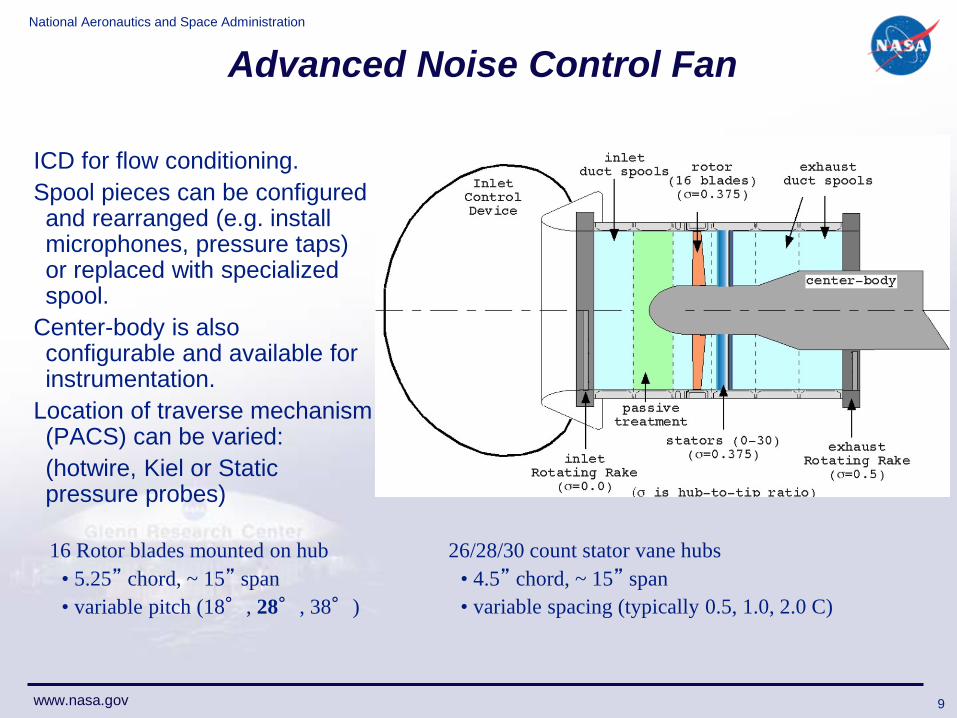
Advanced Noise Control Fan
ICD for flow conditioning.Spool pieces can be configured and rearranged (e.g. install microphones, pressure taps) or replaced with specialized spool.
Center-body is also configurable and available for instrumentation.
Location of traverse mechanism (PACS) can be varied: (hotwire, Kiel or Static pressure probes)
16 Rotor blades mounted on hub• 5.25” chord, ~ 15” span• variable pitch (18°, 28°, 38°)
26/28/30 count stator vane hubs • 4.5” chord, ~ 15” span• variable spacing (typically 0.5, 1.0, 2.0 C)
9

National Aeronautics and Space Administration
www.nasa.gov
ANCF Test Bed Measurement Locations
Measurement Capabilities• In-Duct Mode Levels (RR)• Rotor Wakes (HW)• Stator Vane Pressures• Duct Wall Pressures• Farfield Directivity
10
ICD for flow conditioning.
Spool pieces can be configured and rearranged (e.g. install microphones, pressure taps) or replaced with specialized spool.
Center-body is also configurable and available for instrumentation.
Location of traverse mechanism can be varied: (hotwire, Kiel or Static pressure probes)
National Aeronautics and Space Administration
www.nasa.gov
Data Acquisition Systems
Typical Measurements:• Farfield; Rotating Rake (unique in-duct mode measurements)• Hot-film; Dynamic & Static Pressure; Mounted Microphone
Probe measurements can be radially/circumferentially traversed.
3x32 channel Nicolet Odyssey Data Recorder.• 100 Ksamples/sec sample rate (50 kHz if externally sampled)
16 channel Nicolet Odyssey High Speed Data Recorder.• 10 Msamples/sec sample rate (1 Msamples/sec if externally sampled)
2-channel Dantec CTA w/ flow calibrator (expandable to 4 ch).
ESP/ESCORT data systems for steady state measurements.
11
National Aeronautics and Space Administration
www.nasa.gov
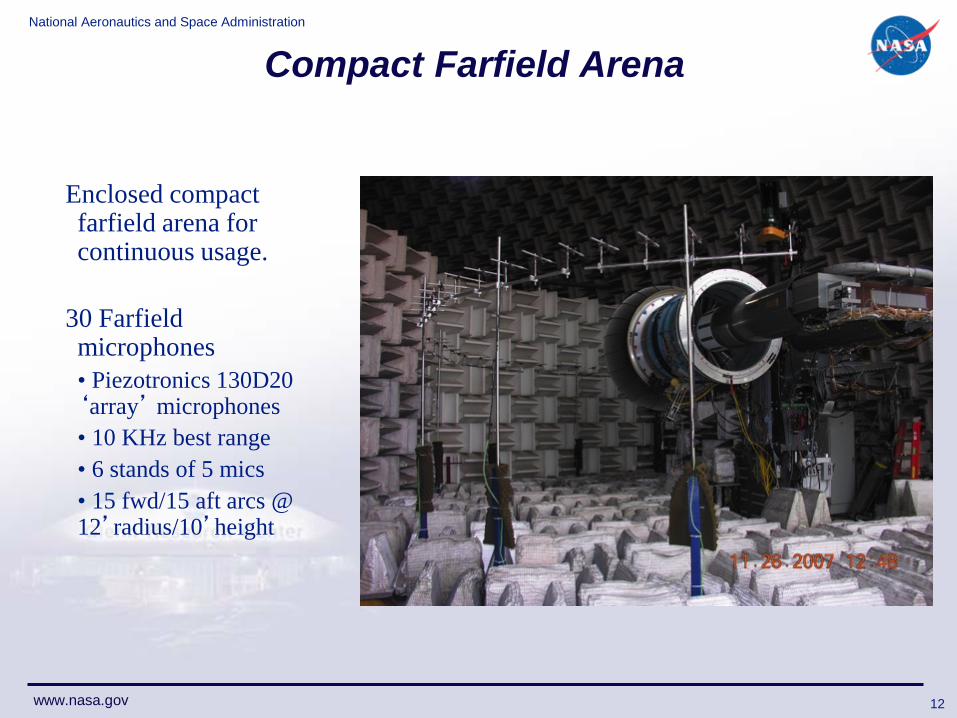
Compact Farfield Arena
Enclosed compact farfield arena for continuous usage.
30 Farfield microphones• Piezotronics 130D20 ‘array’ microphones• 10 KHz best range• 6 stands of 5 mics• 15 fwd/15 aft arcs @ 12’radius/10’height
12
National Aeronautics and Space Administration
www.nasa.gov
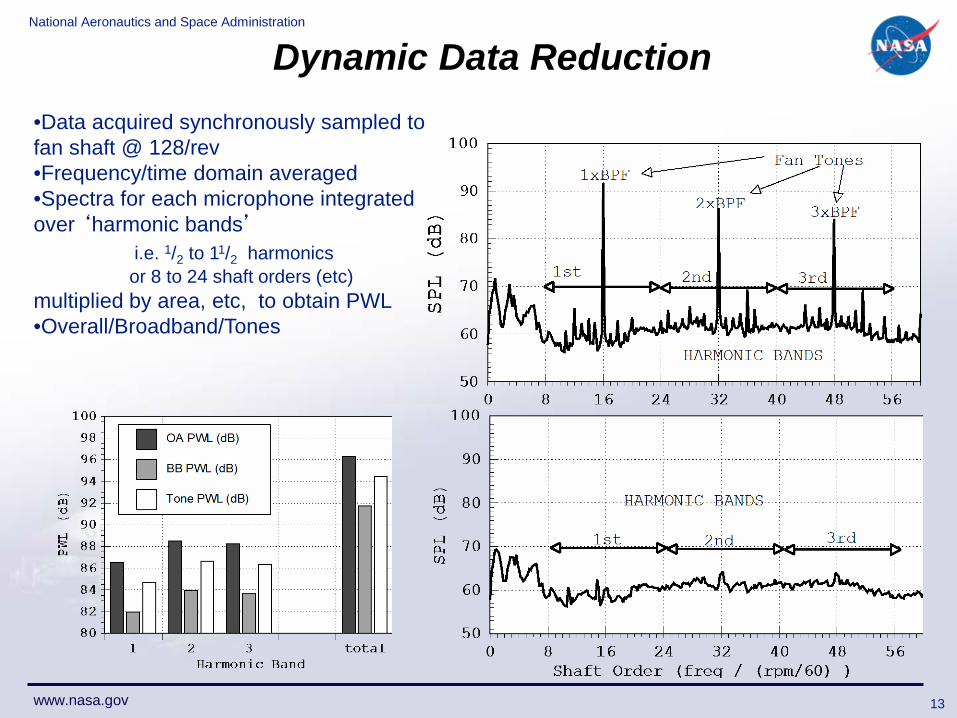
Dynamic Data Reduction•Data acquired synchronously sampled to fan shaft @ 128/rev •Frequency/time domain averaged•Spectra for each microphone integrated over ‘harmonic bands’
i.e. 1/2 to 11/2 harmonicsor 8 to 24 shaft orders (etc)
multiplied by area, etc, to obtain PWL•Overall/Broadband/Tones
13
National Aeronautics and Space Administration
www.nasa.gov
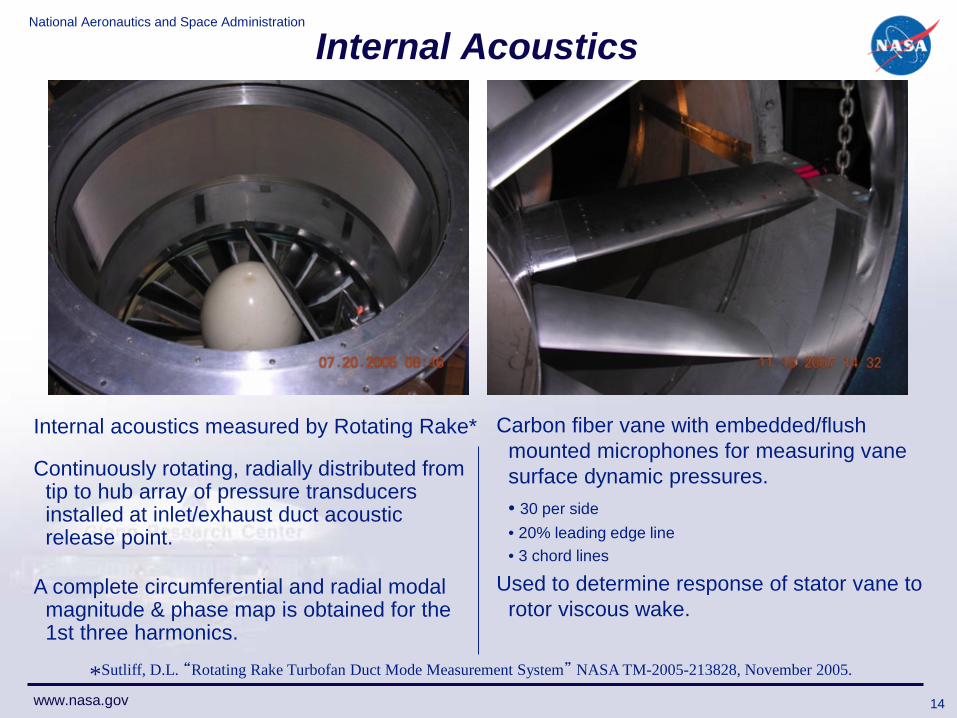
Internal Acoustics
Internal acoustics measured by Rotating Rake*
Continuously rotating, radially distributed from tip to hub array of pressure transducers installed at inlet/exhaust duct acoustic release point.
A complete circumferential and radial modal magnitude & phase map is obtained for the 1st three harmonics.
*Sutliff, D.L. “Rotating Rake Turbofan Duct Mode Measurement System” NASA TM-2005-213828, November 2005.
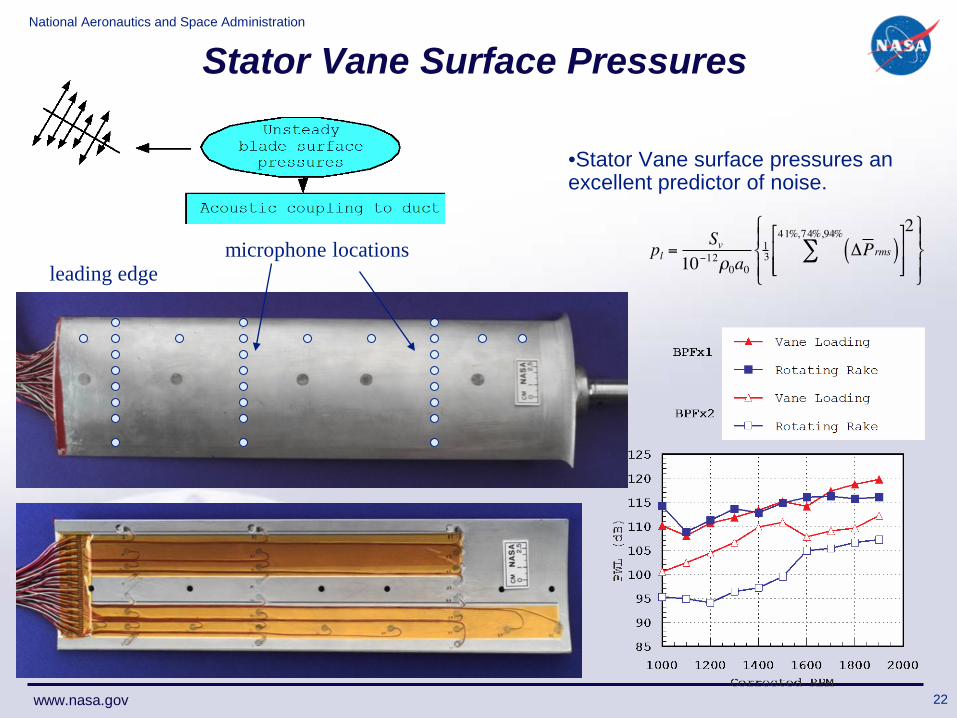
Carbon fiber vane with embedded/flush mounted microphones for measuring vane surface dynamic pressures.• 30 per side • 20% leading edge line• 3 chord lines
Used to determine response of stator vane to rotor viscous wake.
14
National Aeronautics and Space Administration
www.nasa.gov
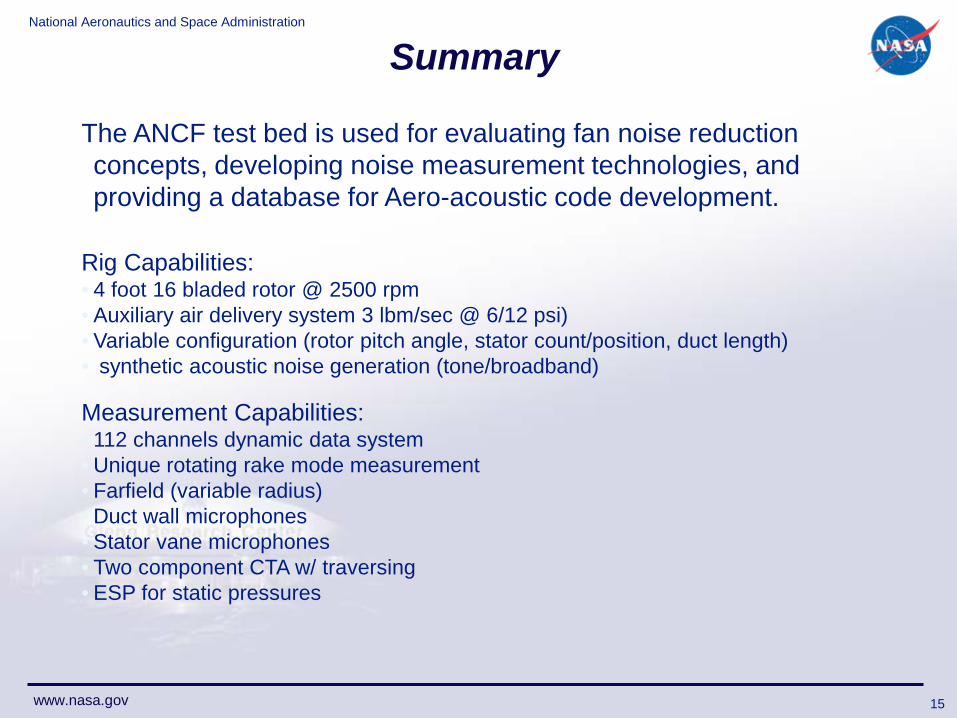
Summary
The ANCF test bed is used for evaluating fan noise reduction concepts, developing noise measurement technologies, and providing a database for Aero-acoustic code development.
Rig Capabilities:• 4 foot 16 bladed rotor @ 2500 rpm• Auxiliary air delivery system 3 lbm/sec @ 6/12 psi)• Variable configuration (rotor pitch angle, stator count/position, duct length)• synthetic acoustic noise generation (tone/broadband)
Measurement Capabilities:• 112 channels dynamic data system• Unique rotating rake mode measurement• Farfield (variable radius) • Duct wall microphones• Stator vane microphones• Two component CTA w/ traversing• ESP for static pressures
15
National Aeronautics and Space Administration
www.nasa.gov
SAMPLE DATABASE
16
National Aeronautics and Space Administration
www.nasa.gov
Aircraft Engine Noise
Engine SchematicAcoustic Generation
OVALS: Physically measure-able quantity
RECTANGLES: Physics/cause & effect
17
National Aeronautics and Space Administration
www.nasa.gov
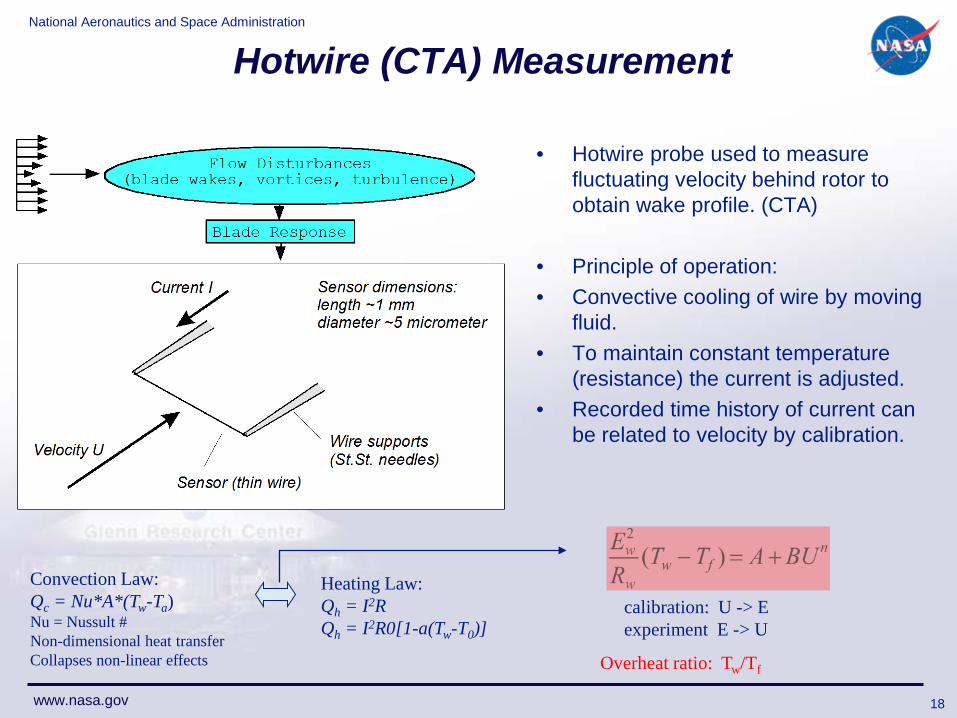
Hotwire (CTA) Measurement
• Hotwire probe used to measure fluctuating velocity behind rotor to obtain wake profile. (CTA)
• Principle of operation: • Convective cooling of wire by moving
fluid.• To maintain constant temperature
(resistance) the current is adjusted.• Recorded time history of current can
be related to velocity by calibration.
Convection Law:Qc = Nu*A*(Tw-Ta)Nu = Nussult #Non-dimensional heat transferCollapses non-linear effects
Heating Law:Qh = I2RQh = I2R0[1-a(Tw-T0)]
calibration: U -> Eexperiment E -> U
Overheat ratio: Tw/Tf
18
National Aeronautics and Space Administration
www.nasa.gov
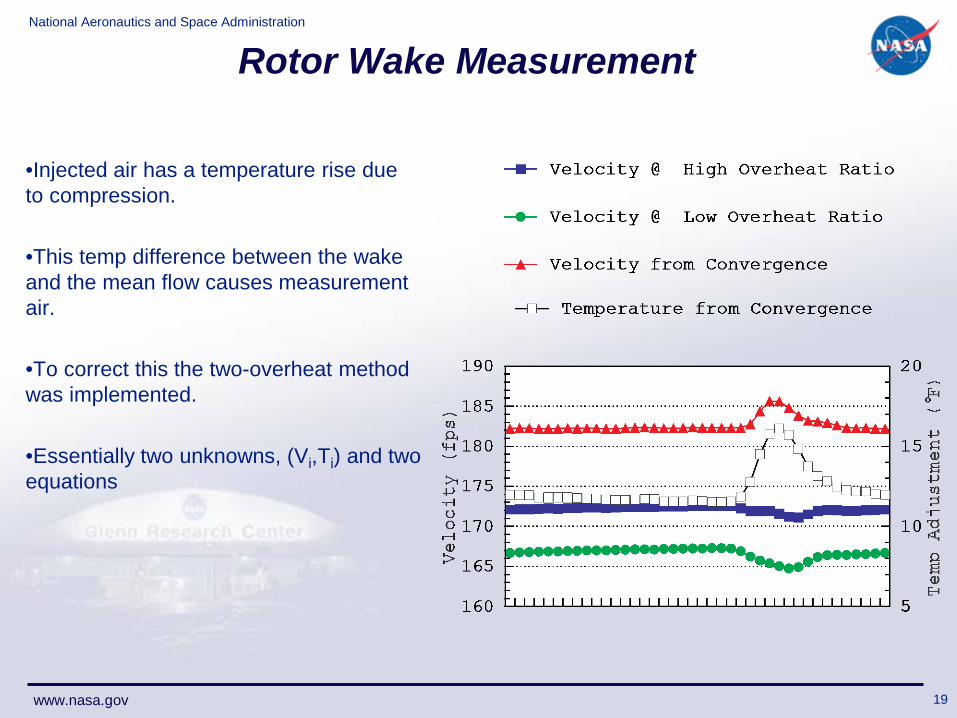
Rotor Wake Measurement
•Injected air has a temperature rise due to compression.
•This temp difference between the wake and the mean flow causes measurement air.
•To correct this the two-overheat method was implemented.
•Essentially two unknowns, (Vi,Ti) and two equations
19
National Aeronautics and Space Administration
www.nasa.gov
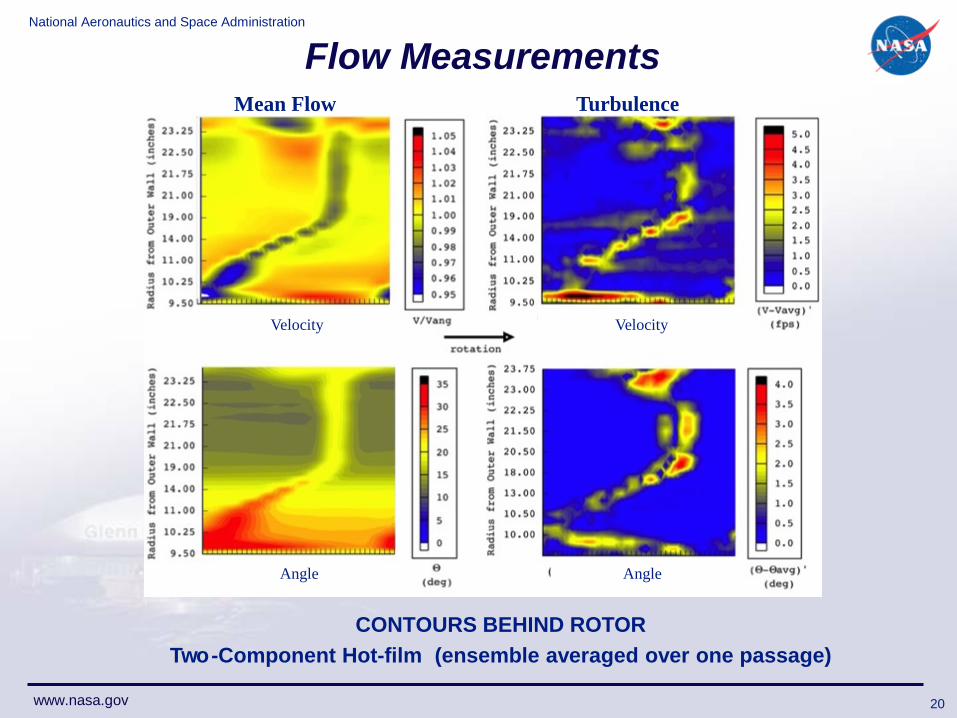
Flow Measurements
CONTOURS BEHIND ROTORTwo-Component Hot-film (ensemble averaged over one passage)
Mean Flow Turbulence
Velocity Velocity
Angle Angle
20
National Aeronautics and Space Administration
www.nasa.gov
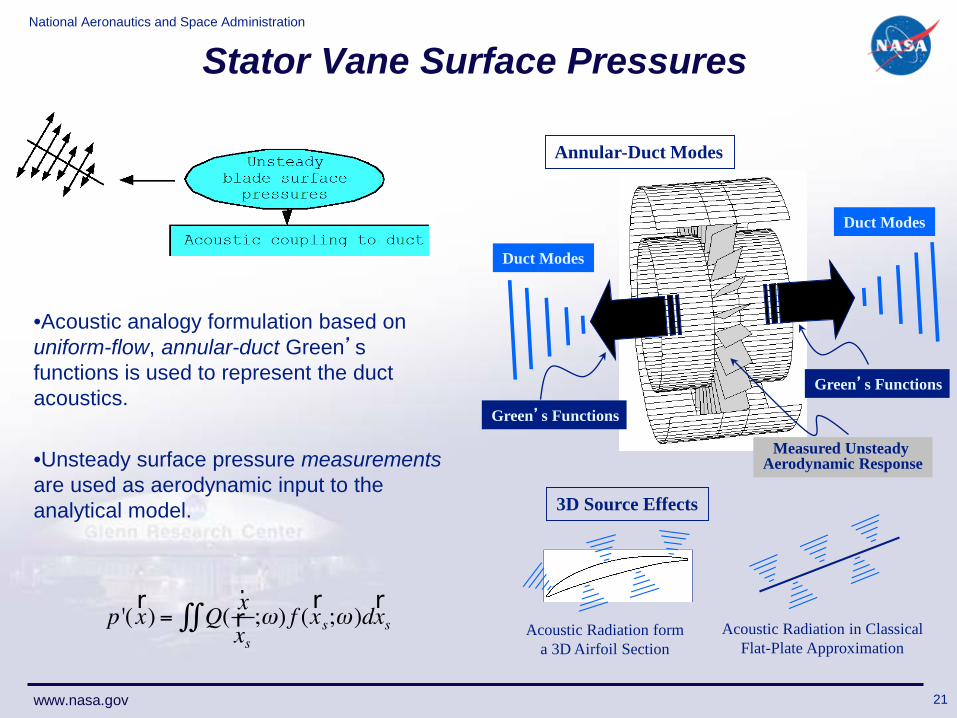
Stator Vane Surface Pressures
•Acoustic analogy formulation based on uniform-flow, annular-duct Green’s functions is used to represent the duct acoustics.
•Unsteady surface pressure measurementsare used as aerodynamic input to the analytical model.
Acoustic Radiation forma 3D Airfoil Section
Acoustic Radiation in Classical Flat-Plate Approximation
3D Source Effects
Annular-Duct Modes
Measured Unsteady Aerodynamic Response
Green’s Functions
Duct Modes
Duct Modes
Green’s Functions
21
National Aeronautics and Space Administration
www.nasa.gov
Stator Vane Surface Pressures
•Stator Vane surface pressures an excellent predictor of noise.
microphone locationsleading edge
22
National Aeronautics and Space Administration
www.nasa.gov
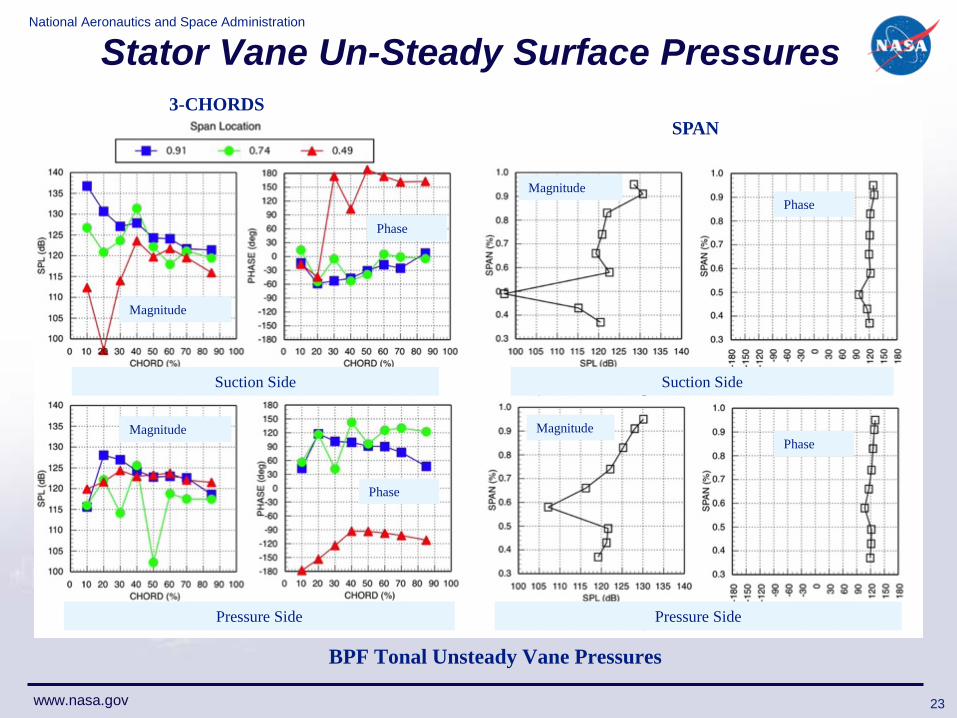
Stator Vane Un-Steady Surface Pressures
BPF Tonal Unsteady Vane Pressures
Suction Side
Pressure Side
Suction Side
Pressure Side
Magnitude
Magnitude
Magnitude
MagnitudePhase
Phase
Phase
Phase
3-CHORDS SPAN
23
National Aeronautics and Space Administration
www.nasa.gov
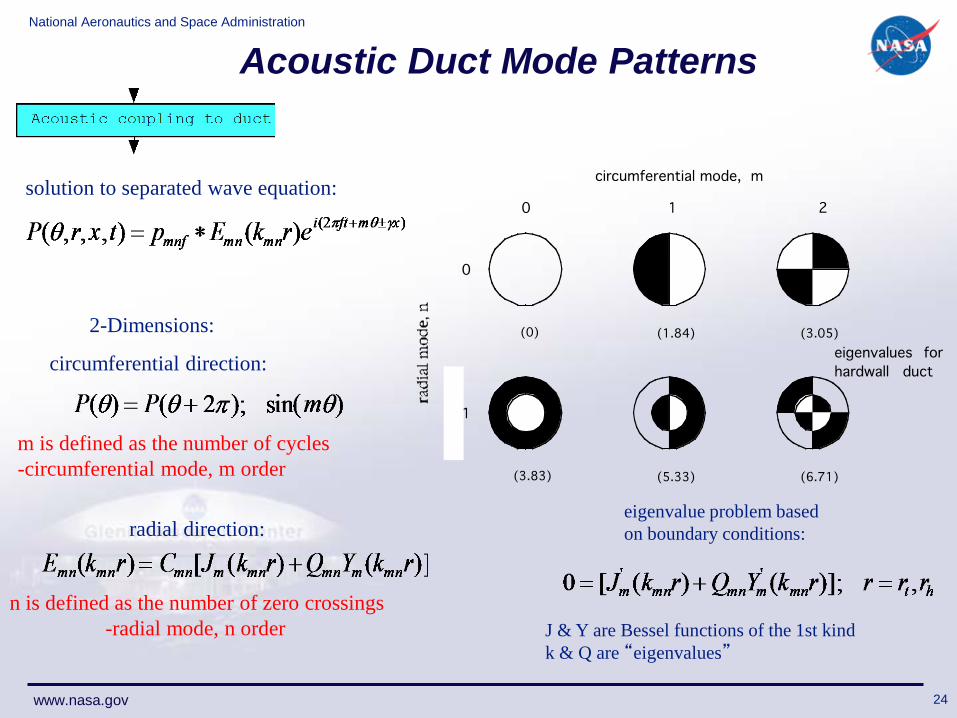
Acoustic Duct Mode Patterns
solution to separated wave equation:
circumferential direction:
m is defined as the number of cycles-circumferential mode, m order
radial direction:
n is defined as the number of zero crossings-radial mode, n order
eigenvalue problem based on boundary conditions:
J & Y are Bessel functions of the 1st kindk & Q are “eigenvalues”
2-Dimensions:
24
National Aeronautics and Space Administration
www.nasa.gov
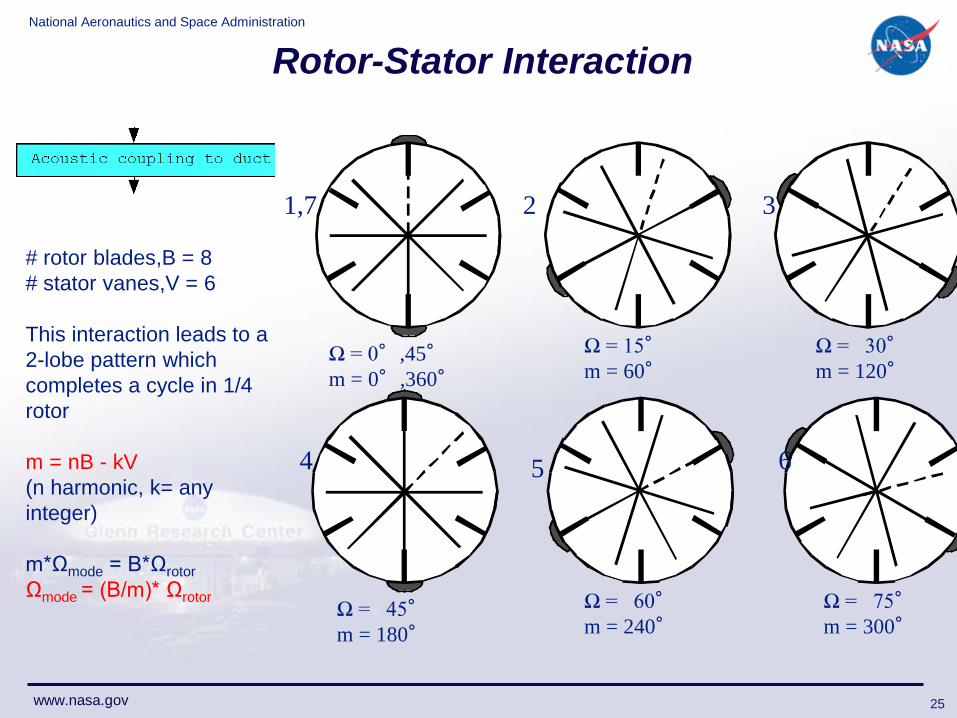
Rotor-Stator Interaction
# rotor blades,B = 8# stator vanes,V = 6
This interaction leads to a 2-lobe pattern which completes a cycle in 1/4 rotor
m = nB - kV(n harmonic, k= any integer)
m*Ωmode = B*ΩrotorΩmode = (B/m)* Ωrotor
Ω = 0°,45°m = 0°,360°
Ω = 15°m = 60°
Ω = 30°m = 120°
Ω = 45°m = 180°
Ω = 60°m = 240°
Ω = 75°m = 300°
1,7 32
4 65
25
National Aeronautics and Space Administration
www.nasa.gov
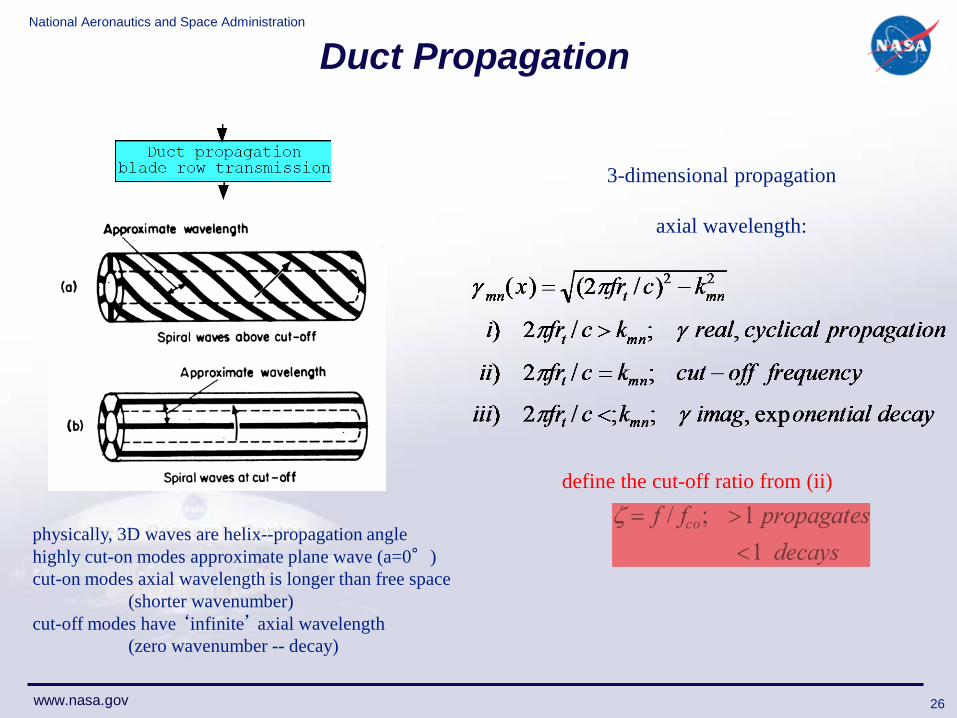
Duct Propagation
3-dimensional propagation
axial wavelength:
define the cut-off ratio from (ii)
physically, 3D waves are helix--propagation anglehighly cut-on modes approximate plane wave (a=0°)cut-on modes axial wavelength is longer than free space
(shorter wavenumber)cut-off modes have ‘infinite’ axial wavelength
(zero wavenumber -- decay)
26
National Aeronautics and Space Administration
www.nasa.gov
Rotating Rake Concepts
Continuously rotating, radially distributed from tip to hub array of pressure transducers installed at inlet/exhaust duct acoustic release point.
• Rake electronically very accurately synchronized to fan shaft- 1/100th fan speed, i.e. 18 rpm- +/-0.2° absolute error
• Signals brought across rotating boundary via telemetry- 7 inlet, 6 exhaust transducers
KEY CONCEPT: Each m-order rotates at a different spin rate.• The rotating rake imparts a unique Doppler shift depending on spin rate, hence
m-order.• Radial modes in a given m-order complex curve fit using least-squares fit to the
derived duct E-functions.
A complete circumferential and radial modal magnitude & phase map is obtained for the 1st three harmonics
27

National Aeronautics and Space Administration
www.nasa.gov
Duct Modes / Rotating Rake
Modal Plots with 14 Stator Vanes at 1-Chord; 1800 RPMc
Single R/S Mode
Two R/S Modes
Numerical R/S values
Cut-on Modes(even if below measurement noise floor)
BPF-Inlet
3BPF-Inlet
BPF-Exhaust
3BPF-Exhaust
Cut-off
Cut-off
28

National Aeronautics and Space Administration
www.nasa.gov
Farfield Measurements
• Acoustic pressure in farfield is the ultimate metric.
• Integrate over volume to get total power (PWL).
• FAA requires detailed weighting for EPNL.
farfield microphones(15 fwd @ 8’ / 30 aft @ 12’)
29
National Aeronautics and Space Administration
www.nasa.gov
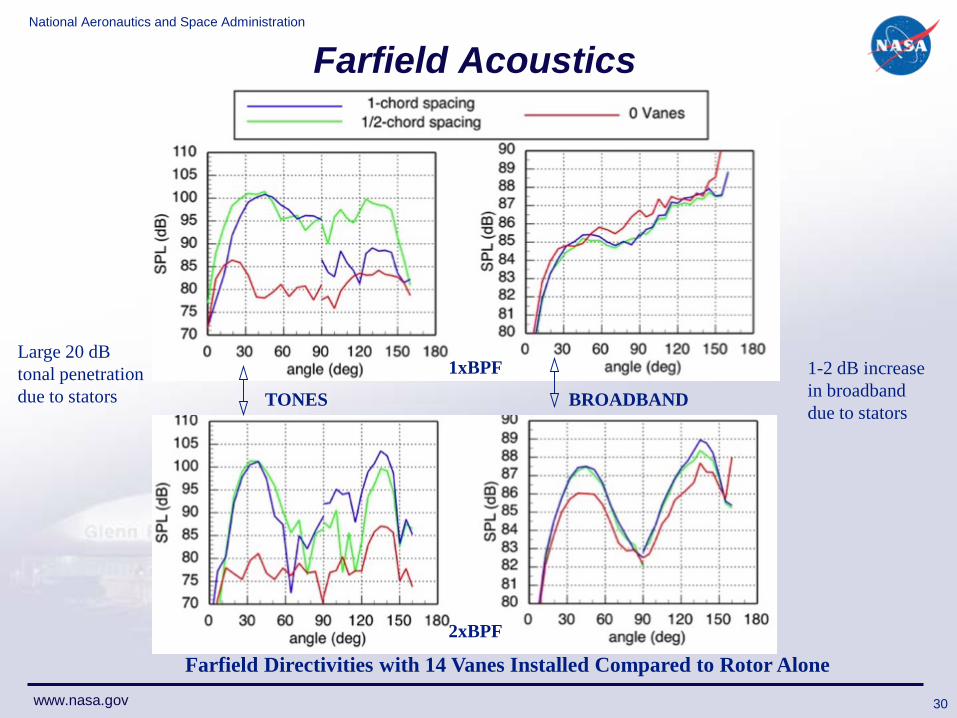
Farfield Acoustics
Farfield Directivities with 14 Vanes Installed Compared to Rotor Alone
TONES BROADBAND
Large 20 dB tonal penetration due to stators
1-2 dB increase in broadband due to stators
1xBPF
2xBPF
30
National Aeronautics and Space Administration
www.nasa.gov 31
UNIQUE CONFIGURATIONS
National Aeronautics and Space Administration
www.nasa.gov
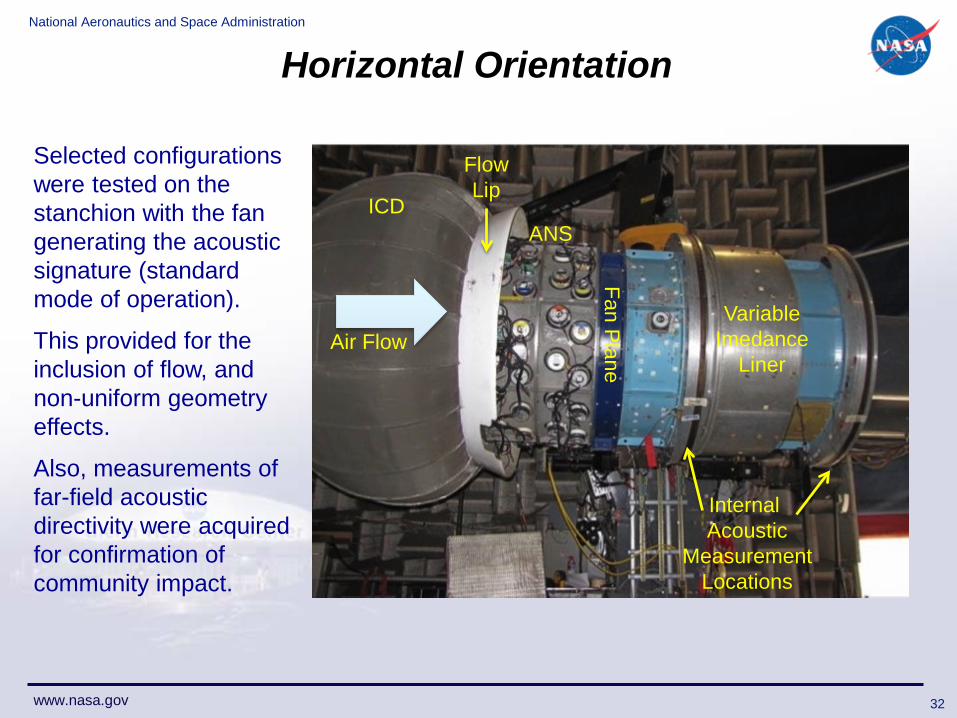
Horizontal Orientation
ICD
FlowLip
ANS
Fan Plane
Internal Acoustic
MeasurementLocations
VariableImedance
LinerAir Flow
Selected configurations were tested on the stanchion with the fan generating the acoustic signature (standard mode of operation).
This provided for the inclusion of flow, and non-uniform geometry effects.
Also, measurements of far-field acoustic directivity were acquired for confirmation of community impact.
32
National Aeronautics and Space Administration
www.nasa.gov
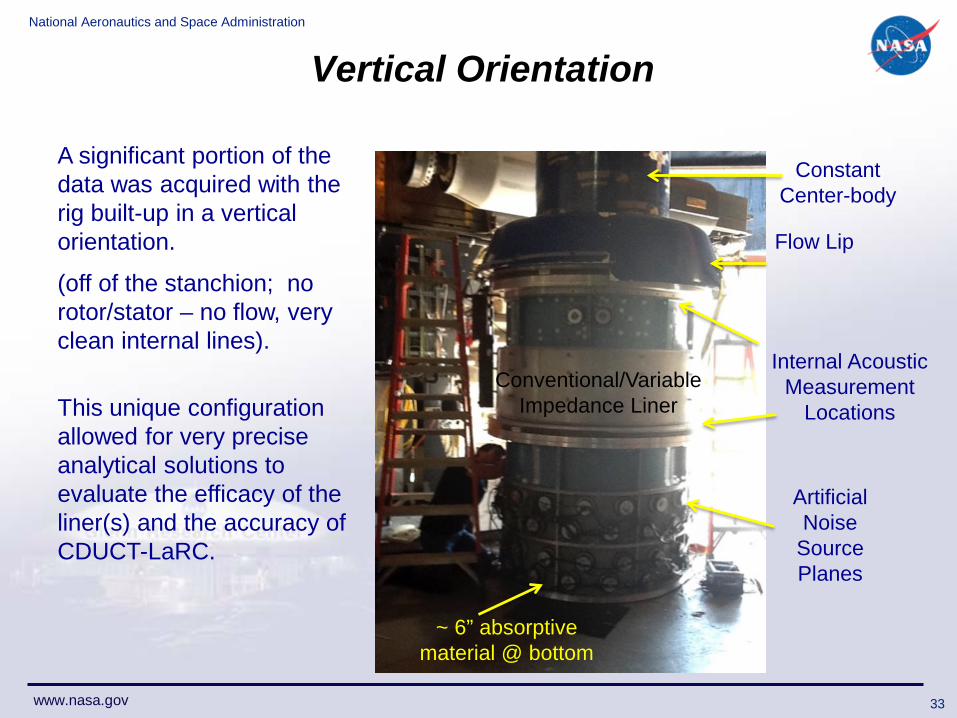
Vertical Orientation
Flow Lip
Artificial Noise
Source Planes
Internal AcousticMeasurement
LocationsConventional/Variable
Impedance Liner
ConstantCenter-body
A significant portion of the data was acquired with the rig built-up in a vertical orientation.
(off of the stanchion; no rotor/stator – no flow, very clean internal lines).
This unique configuration allowed for very precise analytical solutions to evaluate the efficacy of the liner(s) and the accuracy of CDUCT-LaRC.
~ 6” absorptive material @ bottom
33

National Aeronautics and Space Administration
www.nasa.gov
Configurable Fan Artificial Noise Source(s)
Initially 32 channels (upgrade to 64).
4 rows of 16 drivers each
Generate noise source in S/W. Each channel independent.
Labview VI’s or 2x32 channels of FIR filters to ‘shape’ output.
Use of phase delays to simulate modal vs random sources.
Use of time delays to simulate rotating vs stationary sources.
General Range:250 Hz < freq < 1500 Hz
|m| < 6; n<4
34
National Aeronautics and Space Administration
www.nasa.gov
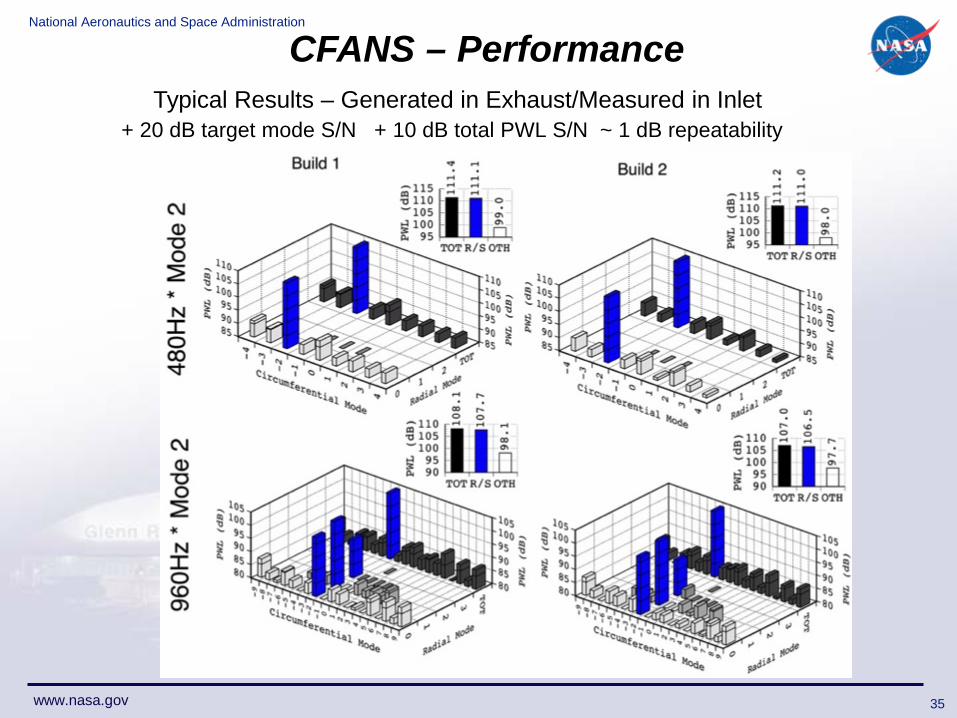
CFANS – Performance
+ 20 dB target mode S/N + 10 dB total PWL S/N ~ 1 dB repeatabilityTypical Results – Generated in Exhaust/Measured in Inlet
35
National Aeronautics and Space Administration
www.nasa.gov 36
NOISE REDUCTION CONCEPTS EVALUATED
National Aeronautics and Space Administration
www.nasa.gov
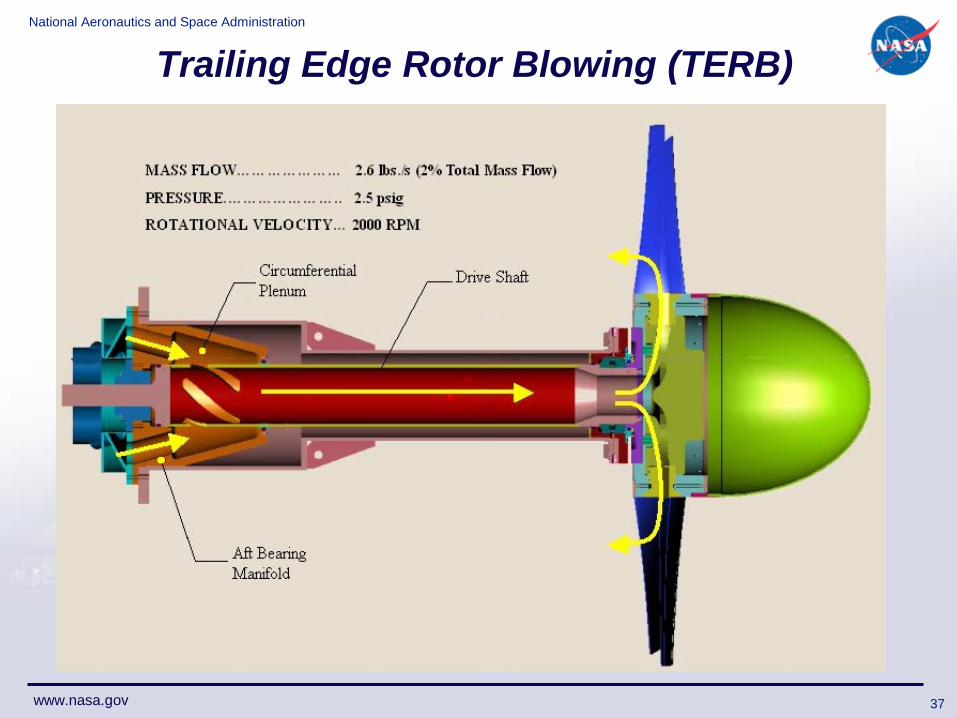
Trailing Edge Rotor Blowing (TERB)
37
National Aeronautics and Space Administration
www.nasa.gov
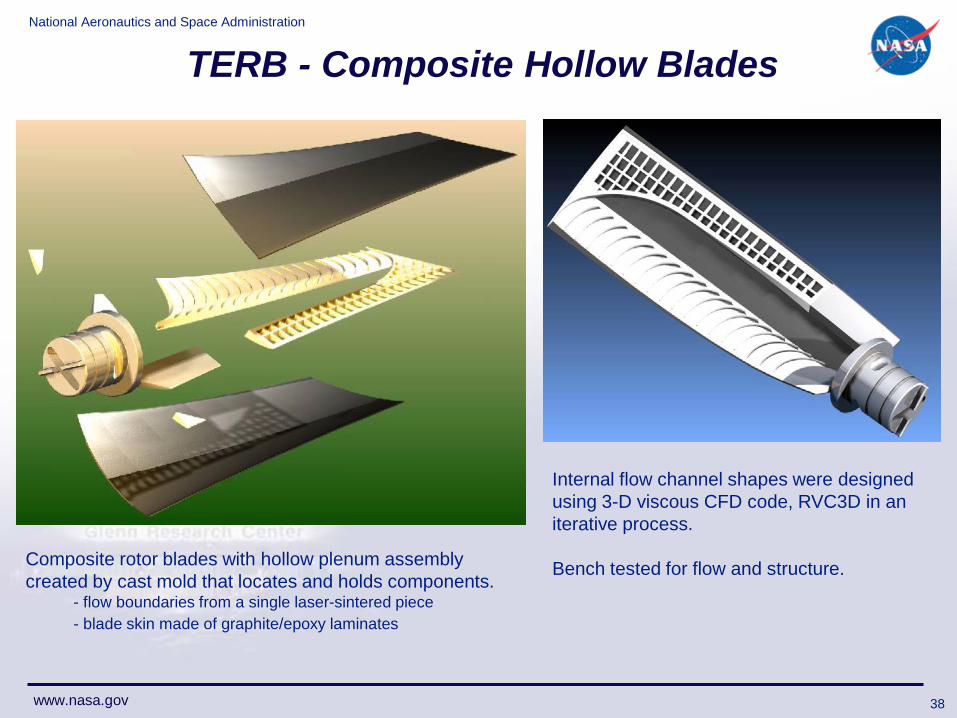
TERB - Composite Hollow Blades
Composite rotor blades with hollow plenum assembly created by cast mold that locates and holds components.
- flow boundaries from a single laser-sintered piece- blade skin made of graphite/epoxy laminates
Internal flow channel shapes were designed using 3-D viscous CFD code, RVC3D in an iterative process.
Bench tested for flow and structure.
38
National Aeronautics and Space Administration
www.nasa.gov
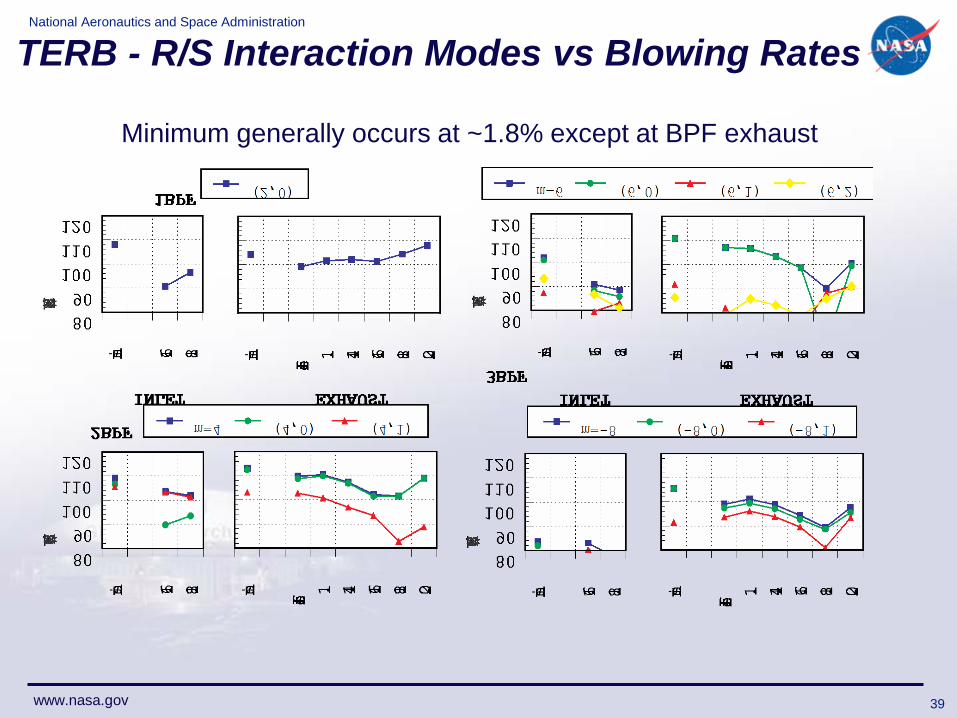
TERB - R/S Interaction Modes vs Blowing Rates
Minimum generally occurs at ~1.8% except at BPF exhaust
39
National Aeronautics and Space Administration
www.nasa.gov
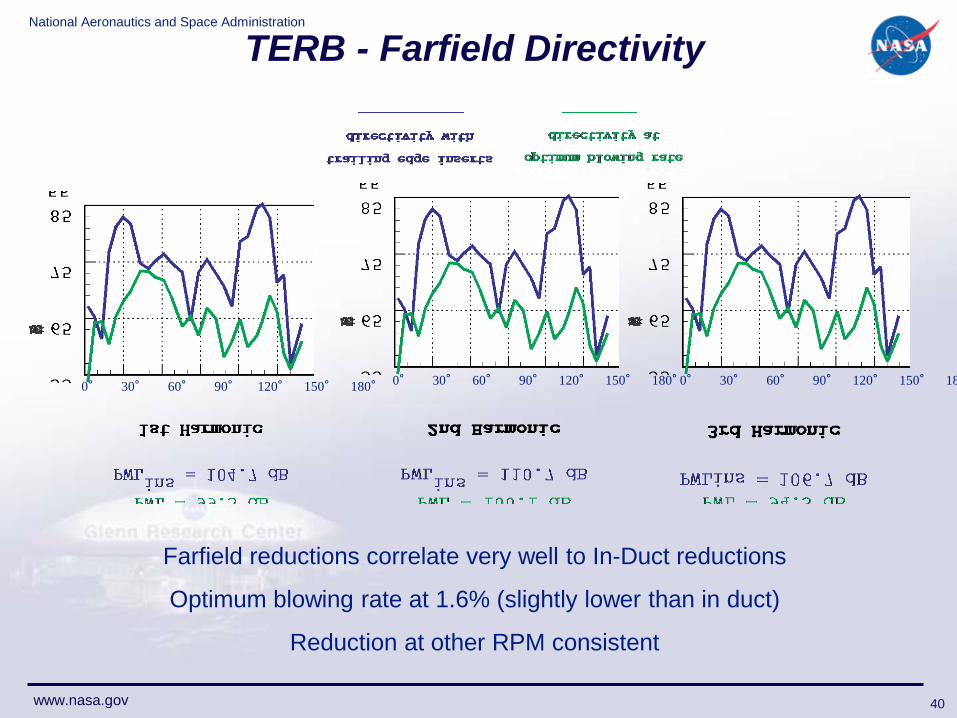
TERB - Farfield Directivity
Farfield reductions correlate very well to In-Duct reductions
Optimum blowing rate at 1.6% (slightly lower than in duct)
Reduction at other RPM consistent
0° 30° 60° 90° 120° 150° 180°
40
0° 30° 60° 90° 120° 150° 180° 30° 60° 90° 120° 150° 180°
National Aeronautics and Space Administration
www.nasa.gov
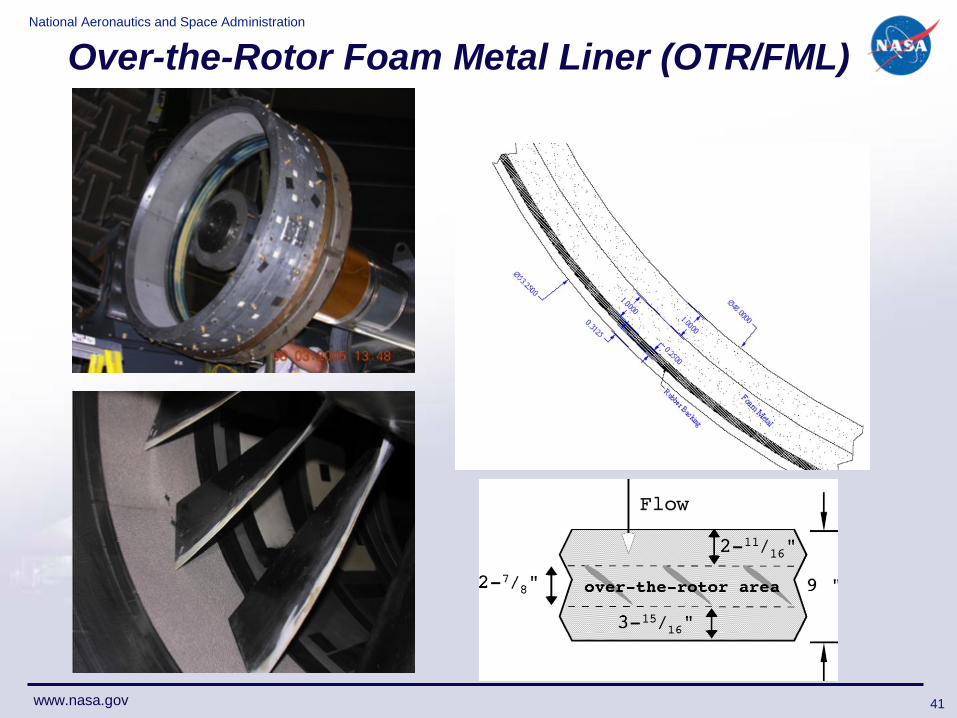
Over-the-Rotor Foam Metal Liner (OTR/FML)
41
National Aeronautics and Space Administration
www.nasa.gov
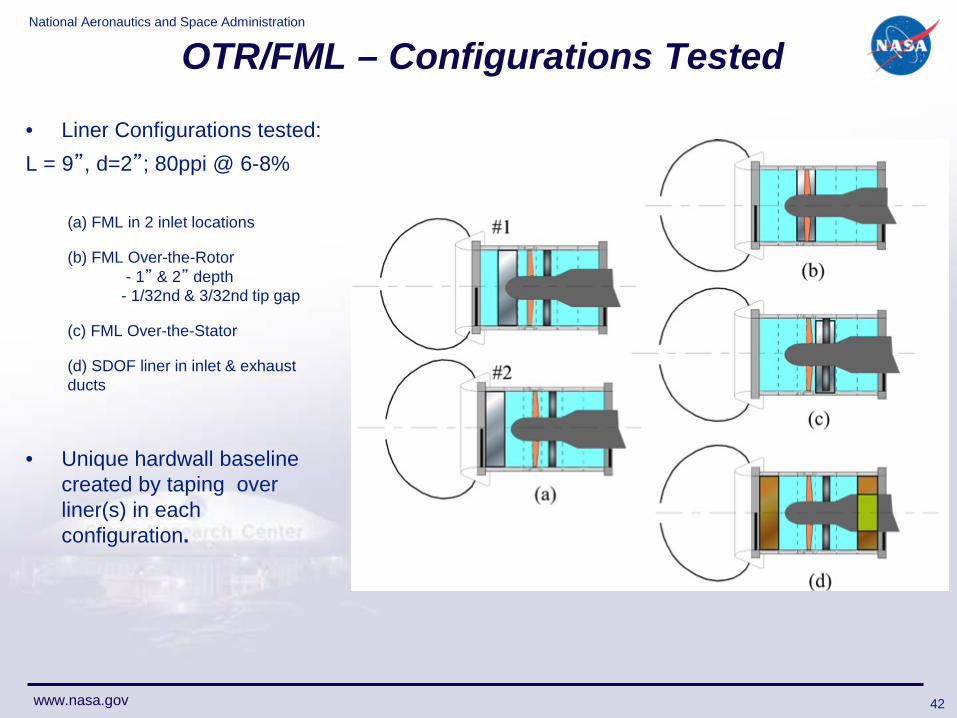
OTR/FML – Configurations Tested
• Liner Configurations tested:L = 9”, d=2”; 80ppi @ 6-8%
(a) FML in 2 inlet locations
(b) FML Over-the-Rotor - 1” & 2” depth
- 1/32nd & 3/32nd tip gap
(c) FML Over-the-Stator
(d) SDOF liner in inlet & exhaust ducts
• Unique hardwall baseline created by taping over liner(s) in each configuration.
42
National Aeronautics and Space Administration
www.nasa.gov
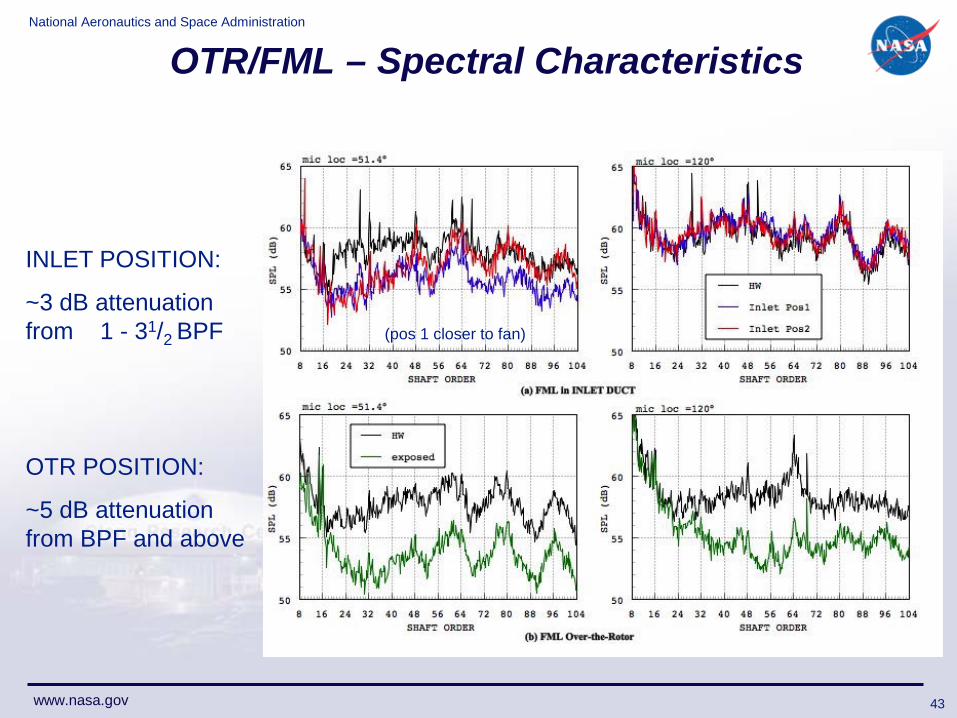
OTR/FML – Spectral Characteristics
INLET POSITION:
~3 dB attenuation from 1 - 31/2 BPF
OTR POSITION:
~5 dB attenuation from BPF and above
(pos 1 closer to fan)
43
National Aeronautics and Space Administration
www.nasa.gov
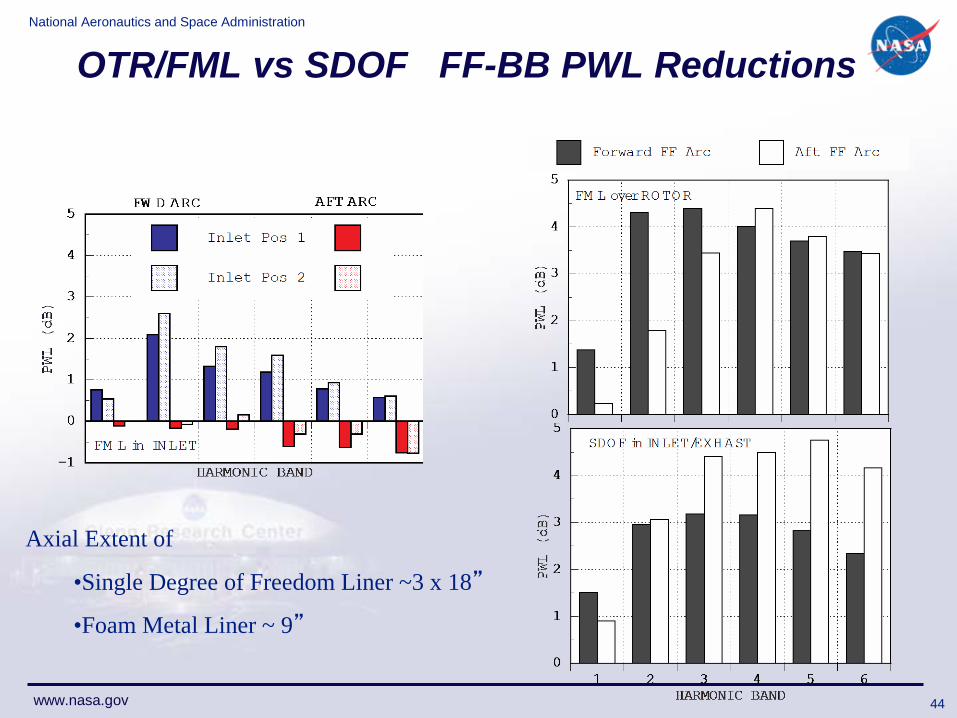
OTR/FML vs SDOF FF-BB PWL Reductions
Axial Extent of
•Single Degree of Freedom Liner ~3 x 18”
•Foam Metal Liner ~ 9”
44
National Aeronautics and Space Administration
www.nasa.gov
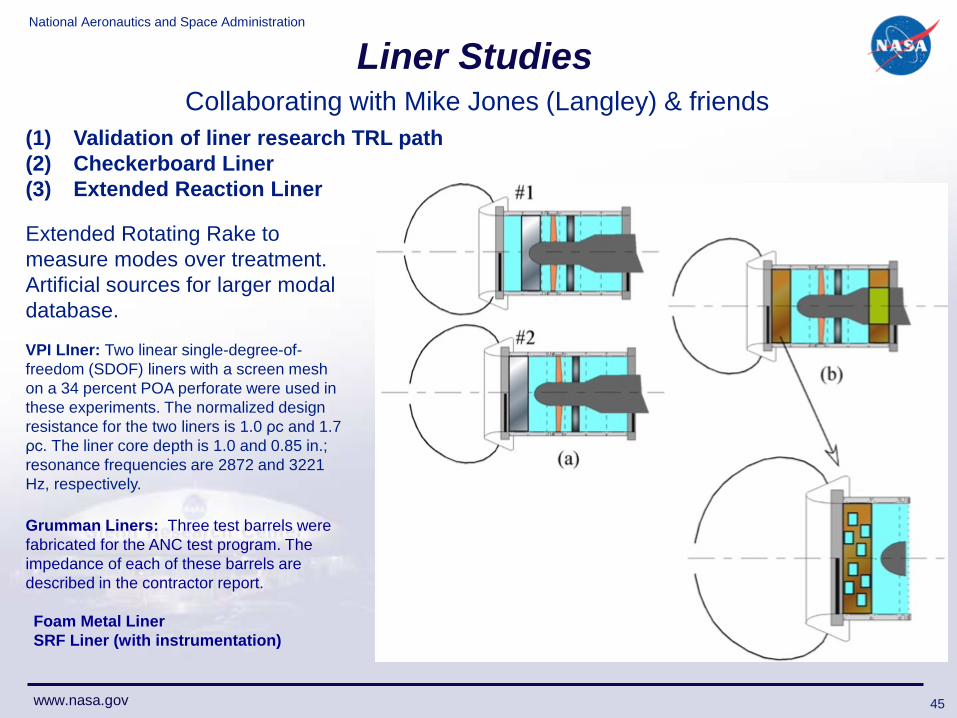
Liner Studies
VPI LIner: Two linear single-degree-of-freedom (SDOF) liners with a screen mesh on a 34 percent POA perforate were used in these experiments. The normalized design resistance for the two liners is 1.0 ρc and 1.7 ρc. The liner core depth is 1.0 and 0.85 in.; resonance frequencies are 2872 and 3221 Hz, respectively.
Grumman Liners: Three test barrels were fabricated for the ANC test program. The impedance of each of these barrels are described in the contractor report.
Foam Metal LinerSRF Liner (with instrumentation)
(1) Validation of liner research TRL path(2) Checkerboard Liner(3) Extended Reaction Liner
Collaborating with Mike Jones (Langley) & friends
Extended Rotating Rake to measure modes over treatment.Artificial sources for larger modal database.
45
National Aeronautics and Space Administration
www.nasa.gov
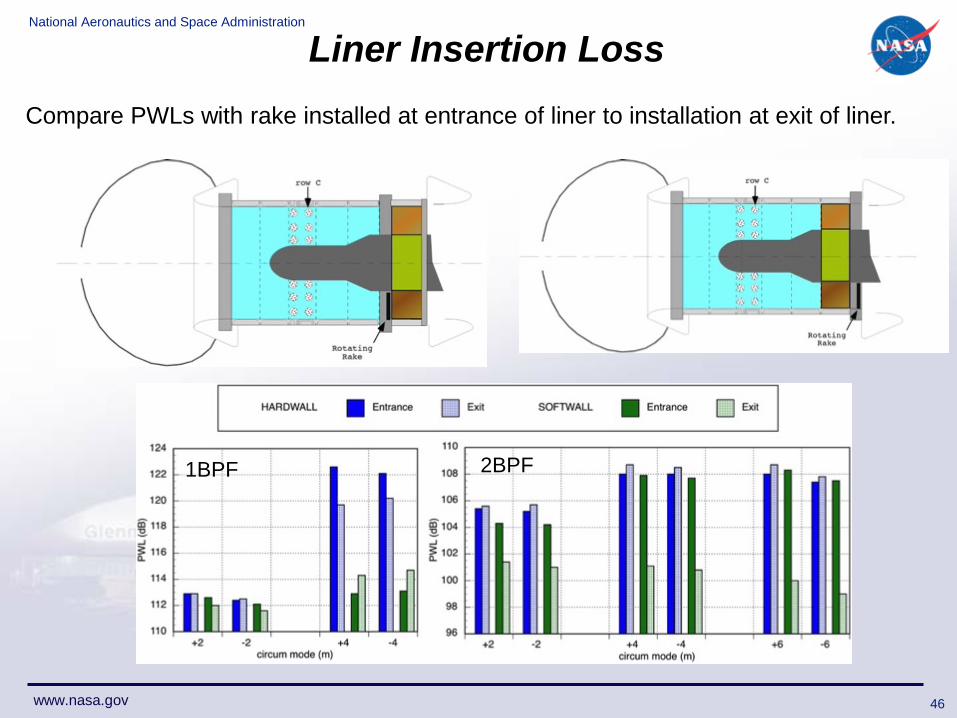
Liner Insertion Loss Compare PWLs with rake installed at entrance of liner to installation at exit of liner.
1BPF 2BPF
46
National Aeronautics and Space Administration
www.nasa.gov
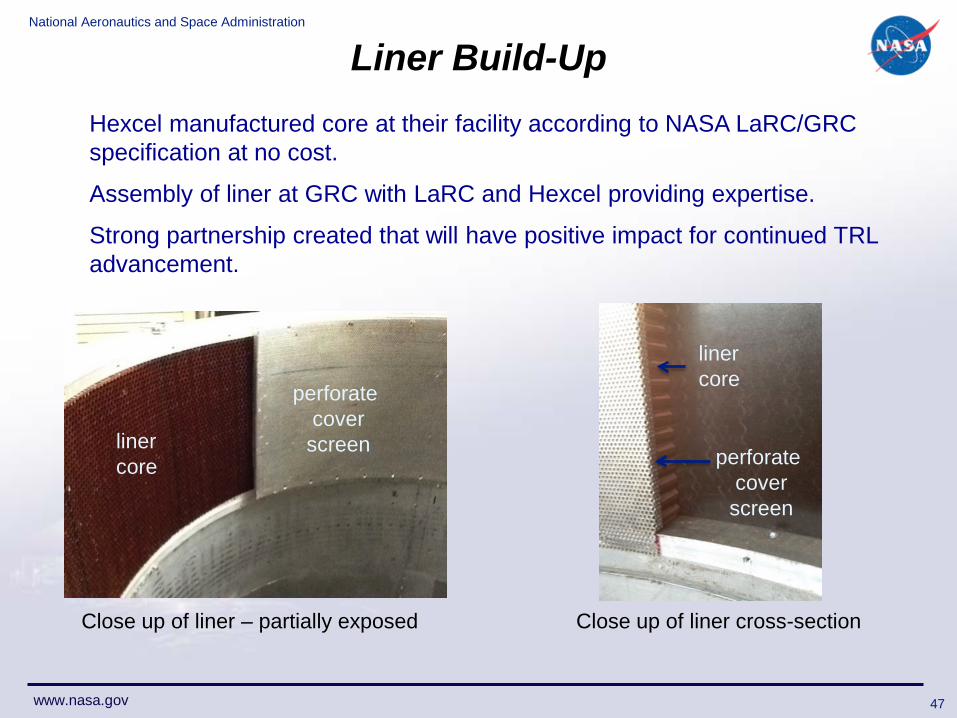
Liner Build-Up
Close up of liner – partially exposed
liner core
perforate cover
screen
Close up of liner cross-section
liner core
perforate cover
screen
Hexcel manufactured core at their facility according to NASA LaRC/GRC specification at no cost.
Assembly of liner at GRC with LaRC and Hexcel providing expertise.
Strong partnership created that will have positive impact for continued TRL advancement.
47
National Aeronautics and Space Administration
www.nasa.gov
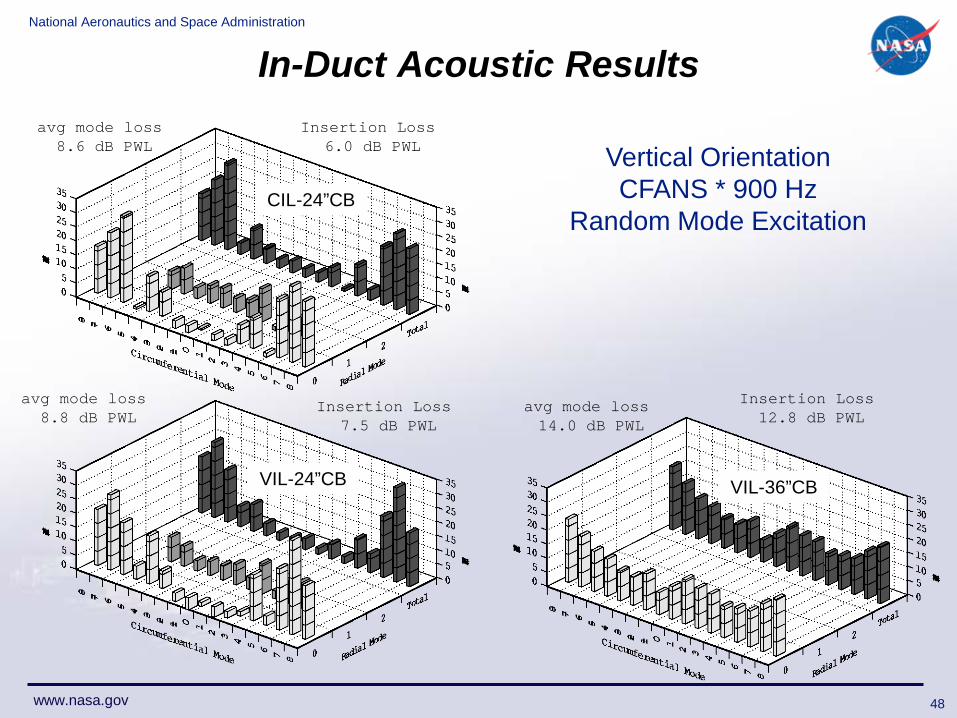
In-Duct Acoustic Results
Vertical OrientationCFANS * 900 Hz
Random Mode ExcitationCIL-24”CB
Insertion Loss 6.0 dB PWL
Insertion Loss 7.5 dB PWL
Insertion Loss 12.8 dB PWL
avg mode loss 8.6 dB PWL
VIL-24”CB VIL-36”CB
avg mode loss 8.8 dB PWL
avg mode loss 14.0 dB PWL
48
National Aeronautics and Space Administration
www.nasa.gov
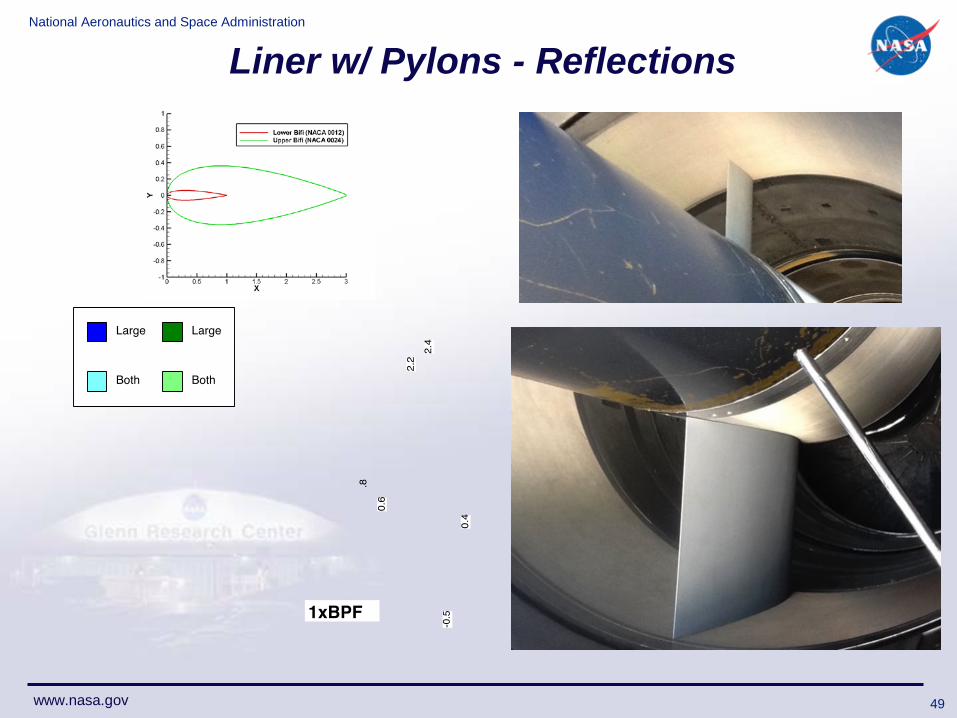
Liner w/ Pylons - Reflections
49
National Aeronautics and Space Administration
www.nasa.gov
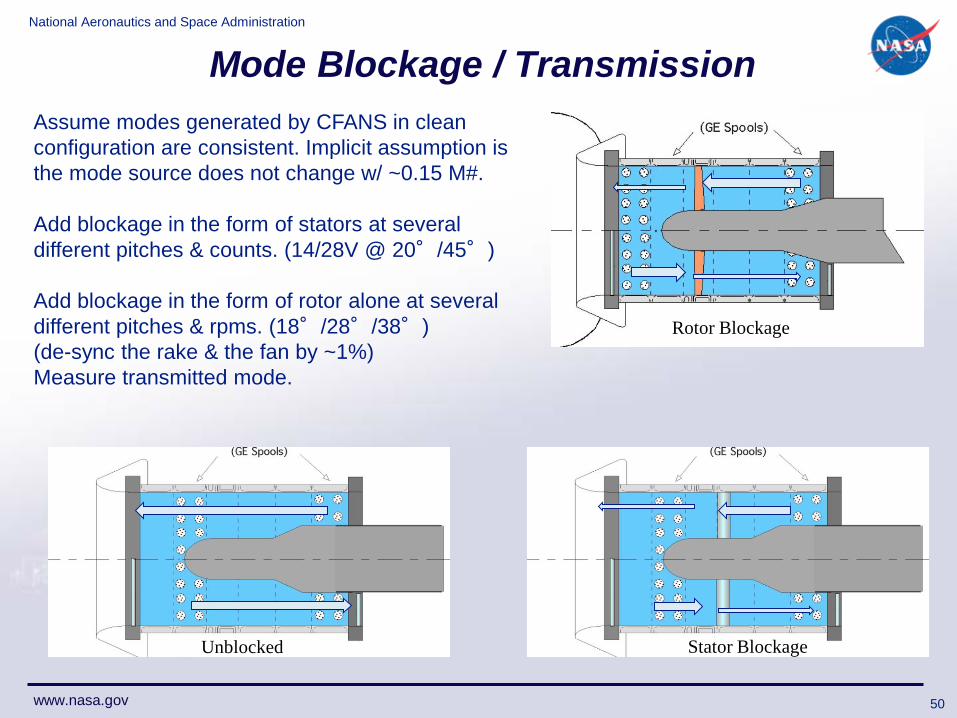
Mode Blockage / TransmissionAssume modes generated by CFANS in clean configuration are consistent. Implicit assumption is the mode source does not change w/ ~0.15 M#.
Add blockage in the form of stators at several different pitches & counts. (14/28V @ 20°/45°)
Add blockage in the form of rotor alone at several different pitches & rpms. (18°/28°/38°)(de-sync the rake & the fan by ~1%)Measure transmitted mode.
50
Rotor Blockage
Stator BlockageUnblocked
National Aeronautics and Space Administration
www.nasa.gov
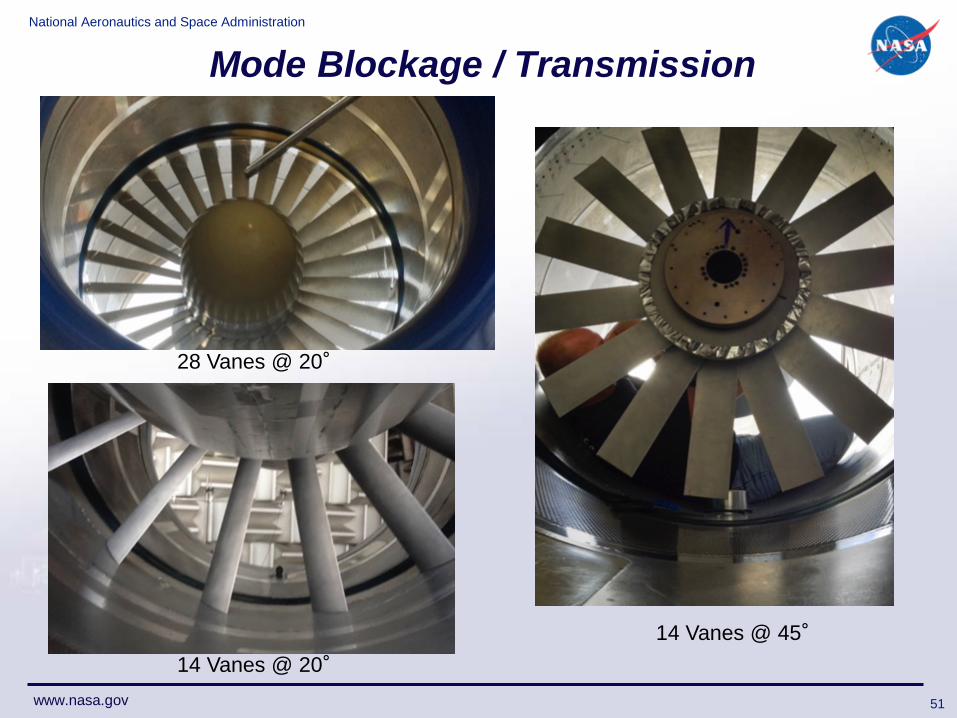
Mode Blockage / Transmission
14 Vanes @ 45°
28 Vanes @ 20°
14 Vanes @ 20°
51
National Aeronautics and Space Administration
www.nasa.gov
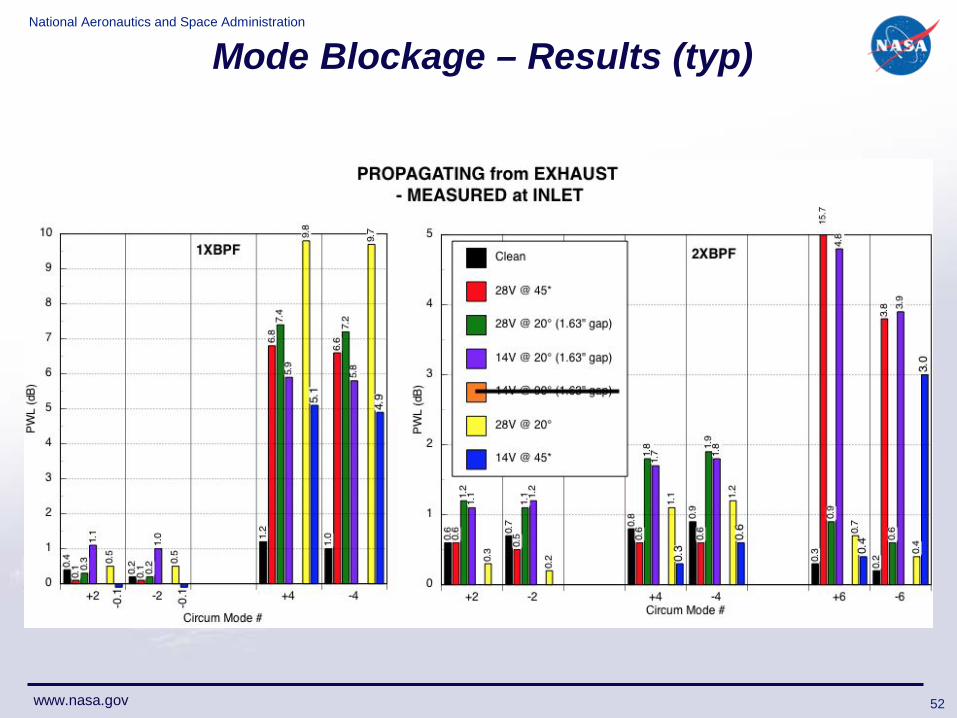
Mode Blockage – Results (typ)
52
National Aeronautics and Space Administration
www.nasa.gov
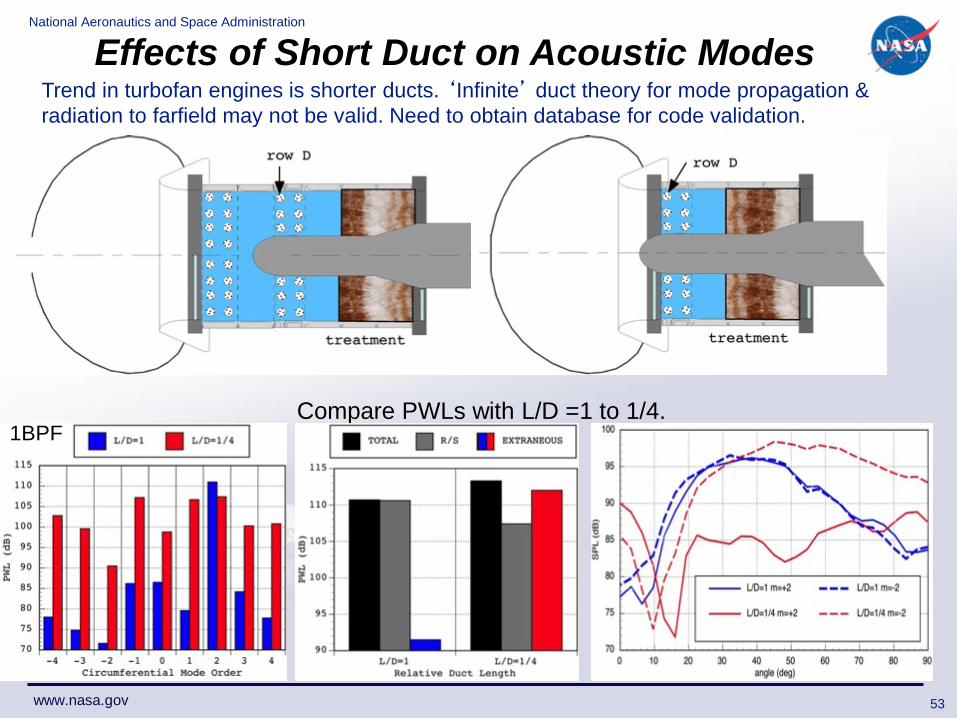
Effects of Short Duct on Acoustic Modes
Compare PWLs with L/D =1 to 1/4.1BPF
53
Trend in turbofan engines is shorter ducts. ‘Infinite’ duct theory for mode propagation & radiation to farfield may not be valid. Need to obtain database for code validation.
National Aeronautics and Space Administration
www.nasa.gov
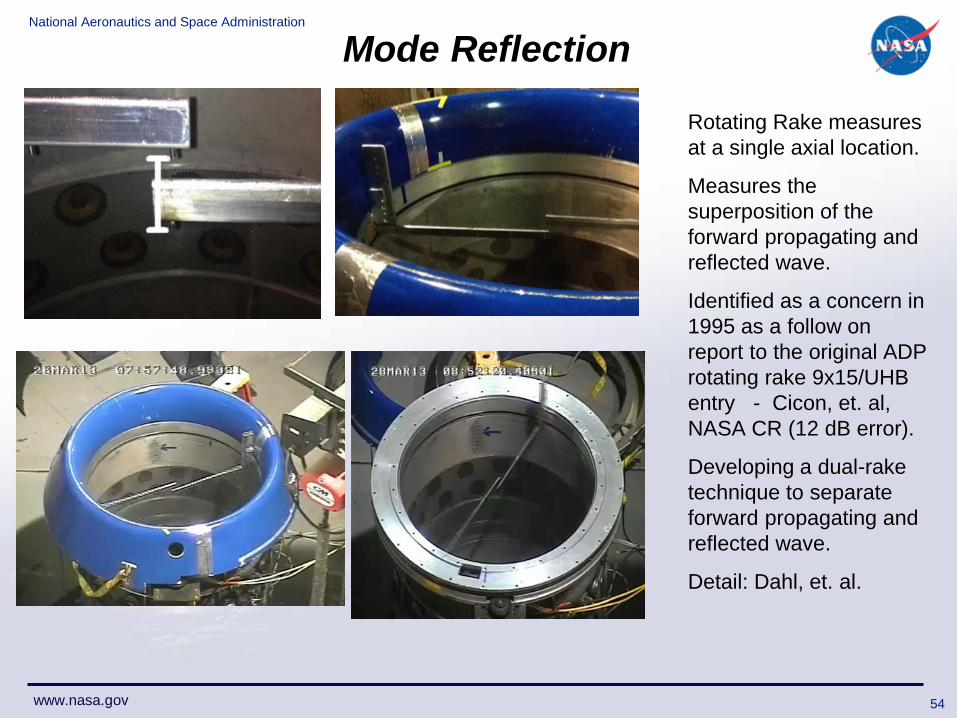
Mode Reflection
Rotating Rake measuresat a single axial location.
Measures the superposition of the forward propagating and reflected wave.
Identified as a concern in 1995 as a follow on report to the original ADP rotating rake 9x15/UHB entry - Cicon, et. al, NASA CR (12 dB error).
Developing a dual-rake technique to separate forward propagating and reflected wave.
Detail: Dahl, et. al.
54
National Aeronautics and Space Administration
www.nasa.gov
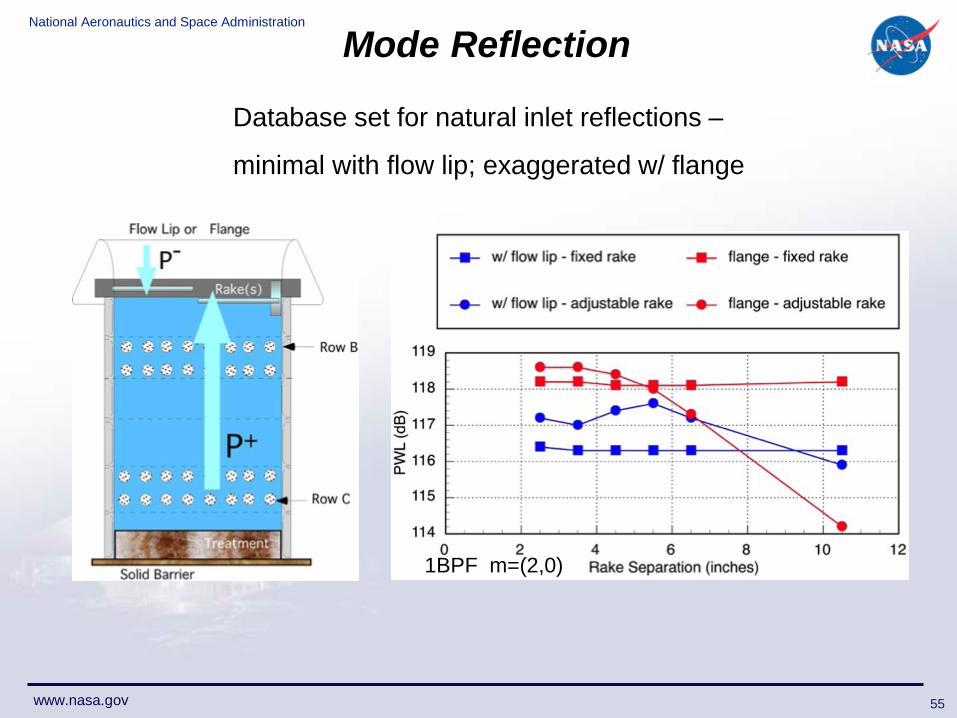
Mode Reflection
Database set for natural inlet reflections –
minimal with flow lip; exaggerated w/ flange
1BPF m=(2,0)
55
National Aeronautics and Space Administration
www.nasa.gov
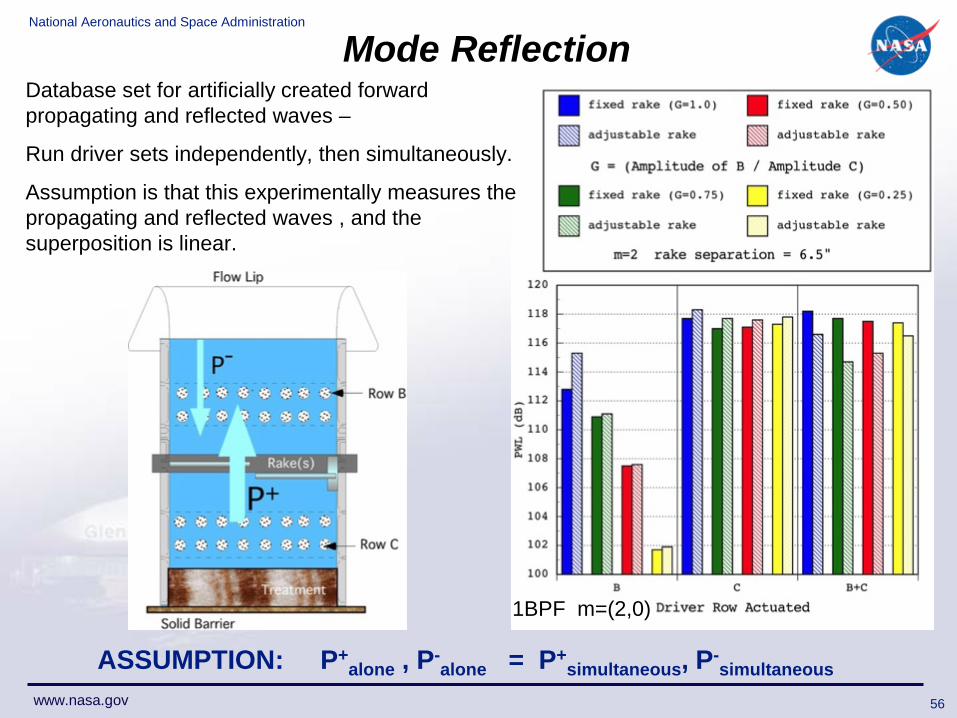
Mode ReflectionDatabase set for artificially created forward propagating and reflected waves –
Run driver sets independently, then simultaneously.
Assumption is that this experimentally measures the propagating and reflected waves , and the superposition is linear.
1BPF m=(2,0)
56
ASSUMPTION: P+alone , P-
alone = P+simultaneous, P-
simultaneous
National Aeronautics and Space Administration
www.nasa.gov 57
MEASUREMENT TECHNOLOGIES
EVALUATED
National Aeronautics and Space Administration
www.nasa.gov
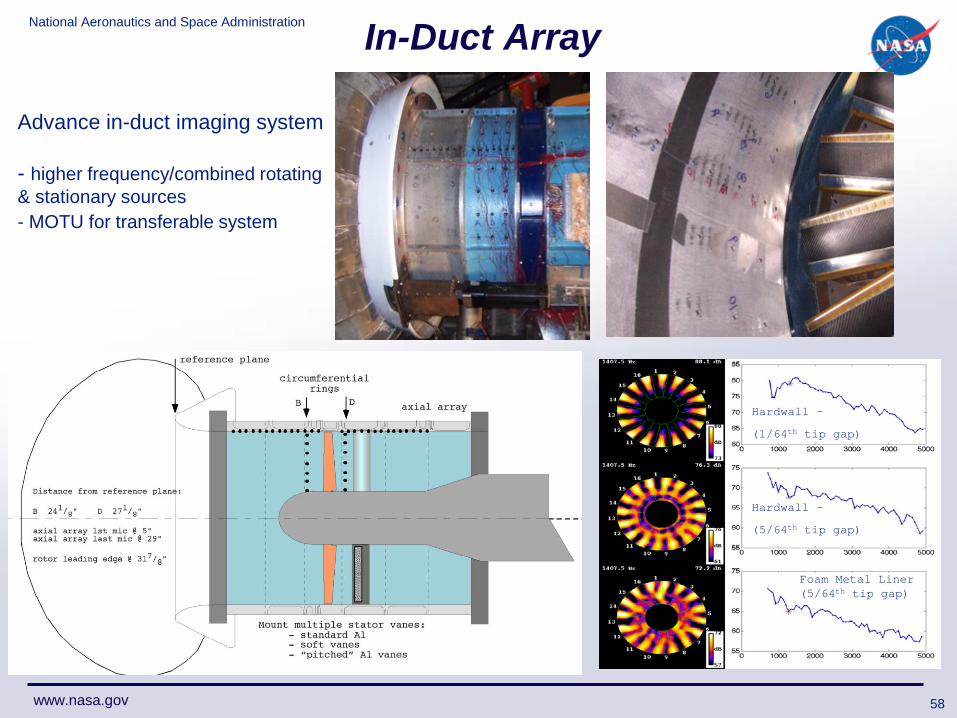
In-Duct Array
Hardwall –
(1/64th tip gap)
Advance in-duct imaging system
- higher frequency/combined rotating & stationary sources - MOTU for transferable system
58
Hardwall –
(5/64th tip gap)
Foam Metal Liner (5/64th tip gap)
National Aeronautics and Space Administration
www.nasa.gov
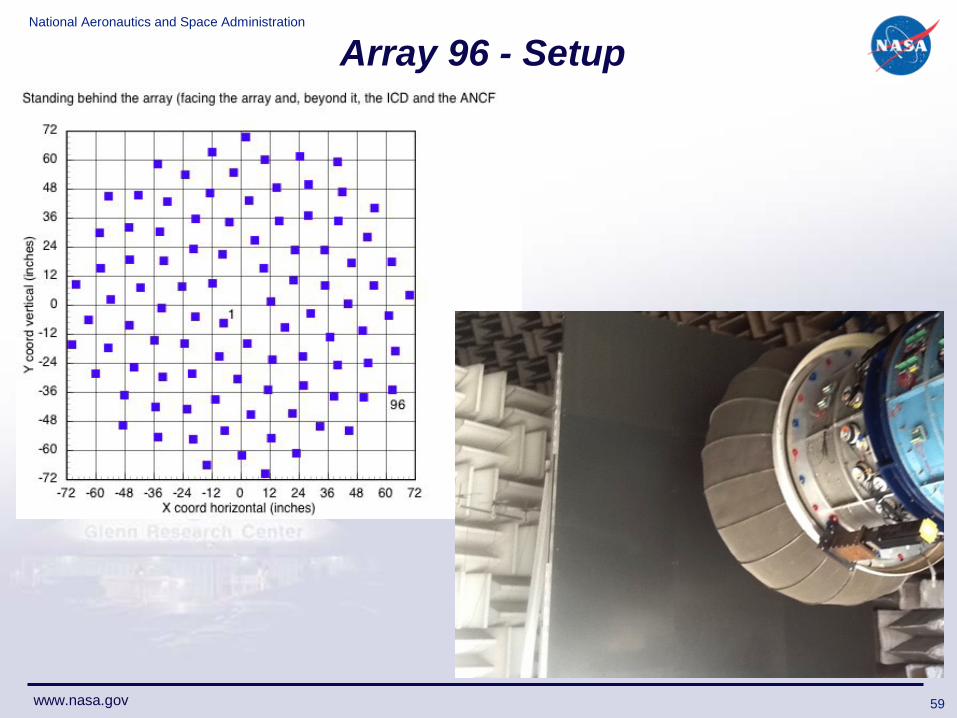
Array 96 - Setup
59
National Aeronautics and Space Administration
www.nasa.gov
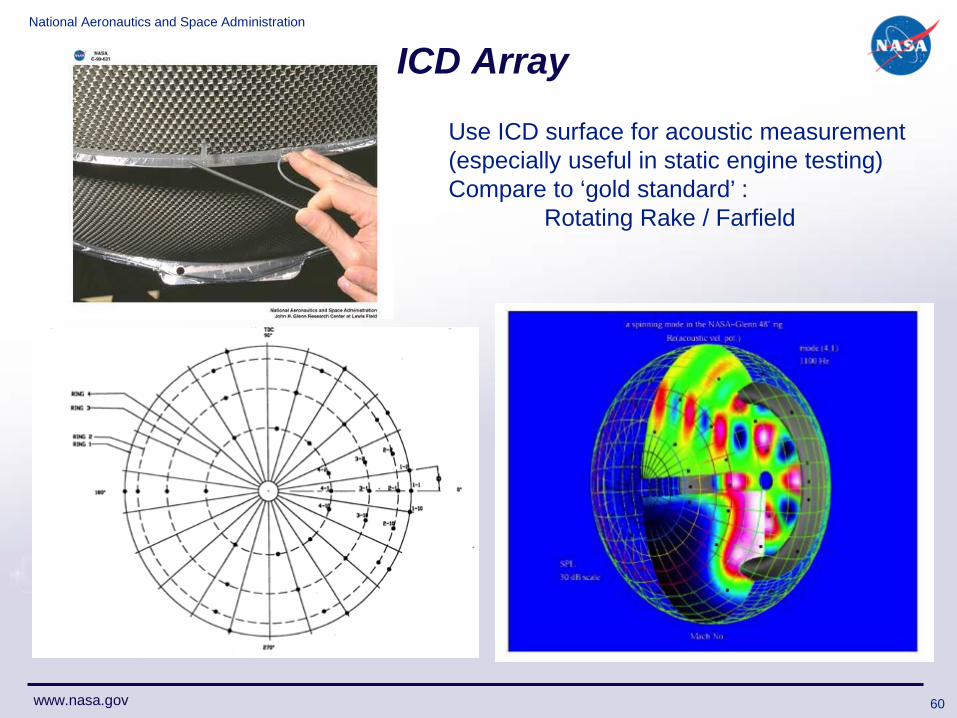
ICD Array
60
Use ICD surface for acoustic measurement(especially useful in static engine testing)Compare to ‘gold standard’ :
Rotating Rake / Farfield
National Aeronautics and Space Administration
www.nasa.gov 61
CONCLUSION
National Aeronautics and Space Administration
www.nasa.gov
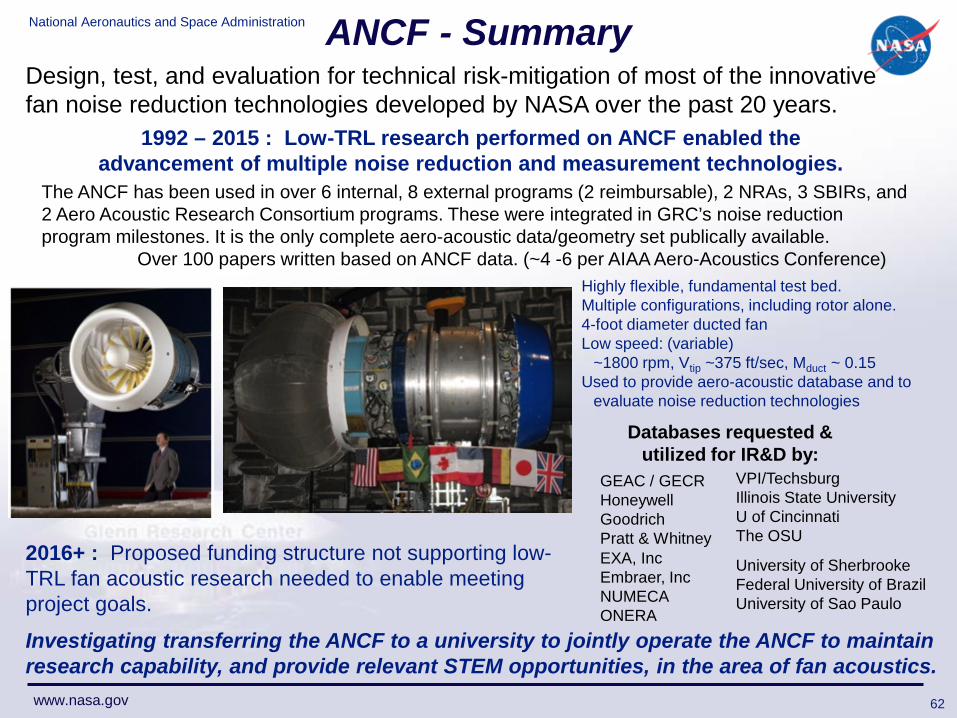
ANCF - SummaryDesign, test, and evaluation for technical risk-mitigation of most of the innovative fan noise reduction technologies developed by NASA over the past 20 years.
1992 – 2015 : Low-TRL research performed on ANCF enabled the advancement of multiple noise reduction and measurement technologies.
Investigating transferring the ANCF to a university to jointly operate the ANCF to maintain research capability, and provide relevant STEM opportunities, in the area of fan acoustics.
Highly flexible, fundamental test bed. Multiple configurations, including rotor alone.4-foot diameter ducted fanLow speed: (variable)
~1800 rpm, Vtip ~375 ft/sec, Mduct ~ 0.15Used to provide aero-acoustic database and to
evaluate noise reduction technologies
EXA, IncEmbraer, IncNUMECAONERA
GEAC / GECRHoneywellGoodrichPratt & Whitney
VPI/TechsburgIllinois State UniversityU of CincinnatiThe OSU
2016+ : Proposed funding structure not supporting low-TRL fan acoustic research needed to enable meeting project goals.
62
Databases requested & utilized for IR&D by:
University of SherbrookeFederal University of BrazilUniversity of Sao Paulo
The ANCF has been used in over 6 internal, 8 external programs (2 reimbursable), 2 NRAs, 3 SBIRs, and 2 Aero Acoustic Research Consortium programs. These were integrated in GRC’s noise reduction program milestones. It is the only complete aero-acoustic data/geometry set publically available.
Over 100 papers written based on ANCF data. (~4 -6 per AIAA Aero-Acoustics Conference)

National Aeronautics and Space Administration
www.nasa.gov
References• ANCF DESCRIPTION:“Artificial Noise Systems for Parametric Studies of Turbo-machinery Aero-acoustics”,
International Journal of Aeroacoustics, DLS and BE Walker (to be published 2016).“A Mode Propagation Database Suitable for Code Validation Utilizing the NASA Glenn
Advanced Noise Control Fan and Artificial Sources”, AIAA 2014-0719, DLS“The Advanced Noise Control Fan Baseline Measurements”, AIAA-2009-0624, J McAllister, RA
Loew, JT Lauer, & DLS. “The Advanced Noise Control Fan”, AIAA-2006-3150, RA Loew, JT Lauer, J McAllister, & DLS.
• SIGNIFICANT NOISE REDUCTION TECHNOLOGIES:“Low-Speed Fan Noise Attenuation from a Foam-Metal Liner”, AIAA Journal of Aircraft, July-
Aug 2009, DLS and M.G. Jones.“Low-Speed Fan Noise Reduction with Trailing Edge Blowing”, International Journal of
Aeroacoustics, 2002, Vol 1 No 3, DLS, EB Fite, E Envia, & DL Tweedt.
• ROTATING RAKE:“Rotating Rake Turbofan Duct Mode Measurement System”, International Journal of
Aeroacoustics, June 2007, DLS.
63