performance monitoring of public works and government
TRANSCRIPT
PWGSC/TPSGC
Performance Monitoring of Public Works and Government Services Canada’s Engineering
Assets
Ross Coupé UVic MPA Candidate
[November 20, 2010]

Coupé ii
EXECUTIVE SUMMARY
Background Though Public Works and Government Services Canada (PWGSC) primarily manages office buildings and other real estate assets, it is also responsible for a small collection of bridges, dams and highways, collectively known as the engineering assets. These assets are managed by the Engineering Asset Strategy Sector (EASS) division of PWGSC. EASS is currently studying its assets and strategizing ways to run or divest these assets going forward. One of the areas of improvement EASS has identified is the lack of performance monitoring policy for the engineering assets. As they are vastly different from office buildings, the engineering assets have been explicitly excluded from existing PWGSC performance monitoring policies. It is this policy gap that the following report seeks to fill.
Performance Monitoring Performance monitoring is the process of identifying and providing accurate and timely performance information on a specific entity or entities. Monitoring performance provides managers with valuable information about the condition of their assets and the impacts that their assets have. If done properly, performance monitoring can highlight potential problems or specific problem areas of an asset. Though performance monitoring does have its limitations, it is widely used by asset managers around the world, and is considered by many to be a best practice of asset management (you can’t fix what you don’t know). Typically performance is monitored using specific indicators; actual, recordable data through which performance can be measured. Performance monitoring is only one part of the larger performance management system used to make an asset operate at a desired level or achieve strategic goals. Information gathered under a performance monitoring system must then be assessed, reported on, and used to inform/influence the decision making process in order to make performance monitoring worthwhile. Though the report does not address the aspects of performance management beyond the monitoring phase, its recommendations do take into account the ultimate uses of performance information.
Recommendations
Suggested Indicators Because indicators are the conduit through which information flows into an organization, a performance monitoring scheme is only as good as its indicators. It is extremely important to monitor indicators that can correctly reflect an asset’s performance without being too difficult or cost prohibitive to gather. If poorly chosen, indicators can obscure
Coupé iii
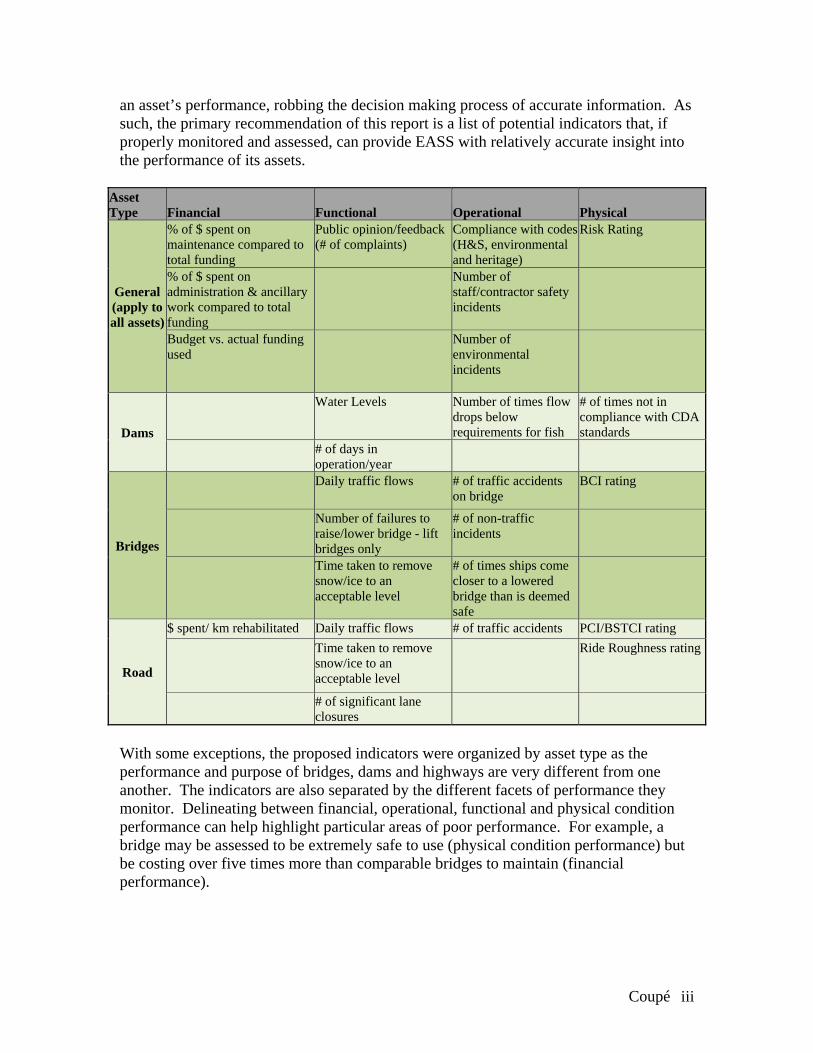
an asset’s performance, robbing the decision making process of accurate information. As such, the primary recommendation of this report is a list of potential indicators that, if properly monitored and assessed, can provide EASS with relatively accurate insight into the performance of its assets.
Asset Type Financial Functional Operational Physical
General (apply to all assets)
% of $ spent on maintenance compared to total funding
Public opinion/feedback (# of complaints)
Compliance with codes (H&S, environmental and heritage)
Risk Rating
% of $ spent on administration & ancillary work compared to total funding
Number of staff/contractor safety incidents
Budget vs. actual funding used
Number of environmental incidents
Dams
Water Levels Number of times flow drops below requirements for fish
# of times not in compliance with CDA standards
# of days in operation/year
Bridges
Daily traffic flows # of traffic accidents on bridge
BCI rating
Number of failures to raise/lower bridge - lift bridges only
# of non-traffic incidents
Time taken to remove snow/ice to an acceptable level
# of times ships come closer to a lowered bridge than is deemed safe
Road
$ spent/ km rehabilitated Daily traffic flows # of traffic accidents PCI/BSTCI rating
Time taken to remove snow/ice to an acceptable level
Ride Roughness rating
# of significant lane closures
With some exceptions, the proposed indicators were organized by asset type as the performance and purpose of bridges, dams and highways are very different from one another. The indicators are also separated by the different facets of performance they monitor. Delineating between financial, operational, functional and physical condition performance can help highlight particular areas of poor performance. For example, a bridge may be assessed to be extremely safe to use (physical condition performance) but be costing over five times more than comparable bridges to maintain (financial performance).

Coupé iv
Other Recommendations Beyond the suggested indicators described above, the report provides some further recommendations to enhance EASS’ performance monitoring. 1. Adoption of attached Performance Monitoring Policy
Appendix E provides a draft policy that incorporates the performance indicators set out in Section 5 of this report. It also places responsibility for the administration of the policy with the Director of EASS to ensure that the engineering asset’s performance is not lost in PWGSC’s broader asset performance monitoring. For consistency’s sake, this policy document mirrors the PWGSC Asset Performance Monitoring Policy already in place.
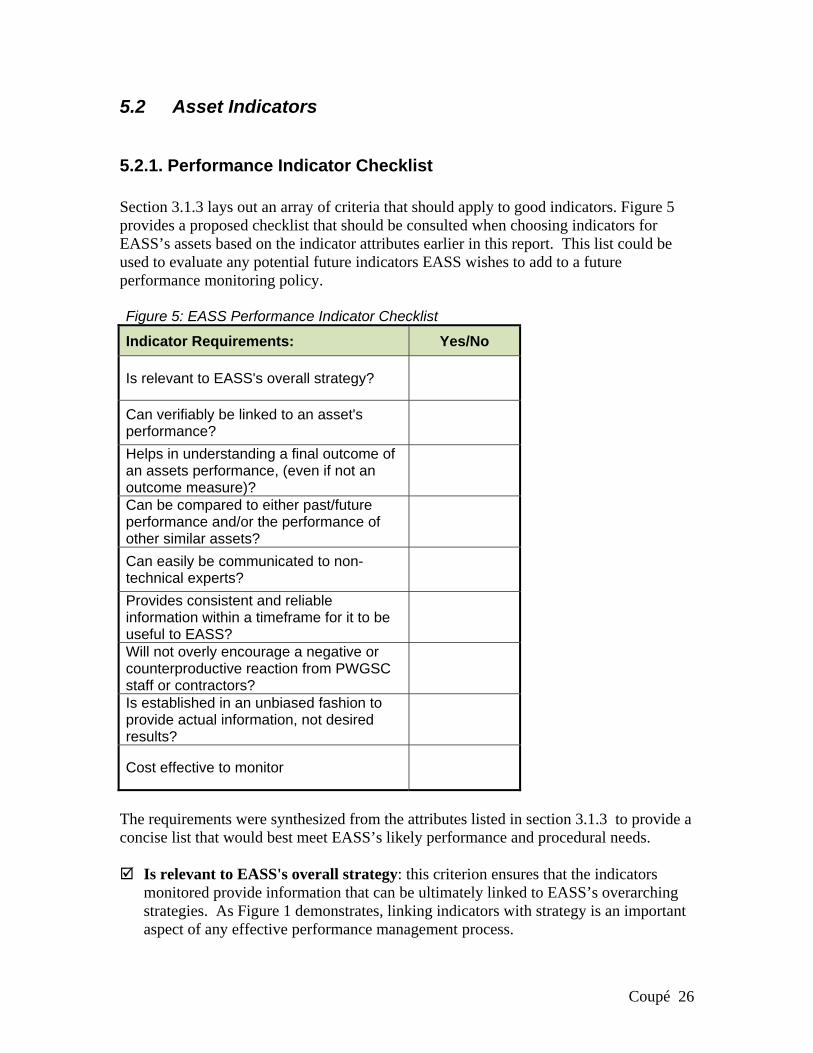
2. Other Indicators Though this reports sets out a number of recommended indicators, it does not preclude the use of other indicators as well. As asset operators and managers, EASS staff may find items that should be included in a performance monitoring system, which this report did not address. The checklist in Figure 5 should be followed to ensure that any potential indicator is properly vetted.
Indicator Requirements: Yes/No
Is relevant to EASS's overall strategy?
Can verifiably be linked to an asset's performance?
Helps in understanding a final outcome of an assets performance, (even if not an outcome measure)?
Can be compared to either past/future performance and/or the performance of other similar assets?
Can easily be communicated to non-technical experts?
Provides consistent and reliable information within a timeframe for it to be useful to EASS?
Will not overly encourage a negative or counterproductive reaction from PWGSC staff or contractors?
Is established in an unbiased fashion to provide actual information, not desired results?
Cost effective to monitor

Coupé v
3. Feedback After a comprehensive performance monitoring system is in place for one year, managers and operators should discuss what worked well and what did not. Which indicators provided the most valuable information for managers (and perhaps politicians) and which indicators provided the best medium for operators to communicate their asset’s needs to managers. This feedback session will not only allow for the system to improve, but also demonstrate a commitment to the process itself.
4. Study on effective performance assessment and reporting This report only covers the first stage of effective performance management. A follow-up study on how EASS could assess and report on the information gathered under a performance monitoring policy should be undertaken to ensure that the information is used ultimately to improve the service of the assets for the Canadian public.
Coupé vi
Table of Contents
1 INTRODUCTION..................................................................................................... 1
2 BACKGROUND ....................................................................................................... 1
2.1 Public Works and Government Services Canada ................................................. 1
2.2 Performance Monitoring ...................................................................................... 3
2.2.1. Developing Strategy ...................................................................................... 4
2.2.2. Performance Monitoring and Assessment .................................................... 4
2.2.3. Responding to Performance Results ............................................................. 5
2.3 Why Monitor? ...................................................................................................... 6
2.4 Limitations ........................................................................................................... 8
2.4.1. Indicator Limitations ..................................................................................... 8
2.4.2. Causality ....................................................................................................... 9
2.4.3. Cost vs. Effectiveness ................................................................................... 9
2.4.4. Effects on Staff/Public .................................................................................. 9
2.5 Policy Framework .............................................................................................. 10
3 PERFORMANCE MONITORING PRACTICES .............................................. 11
3.1 General Smart Practices in Asset Performance Monitoring ............................... 11
3.1.1. Effective System Attributes ........................................................................ 11
3.1.2. Inputs vs. Outputs vs. Outcomes ................................................................. 13
3.1.3. Attributes of Effective Indicator ................................................................. 15
3.1.4. Asset-Specific Performance Monitoring ..................................................... 17
3.2 Dam Performance Monitoring ........................................................................... 19
3.3 Bridge Performance Monitoring ........................................................................ 20

Coupé vii
3.4 Highway Performance Monitoring ..................................................................... 21
4 INTERNAL CONSULTATIONS .......................................................................... 23
5 ANALYSIS .............................................................................................................. 24
5.1 Performance Facets ............................................................................................ 24
5.2 Asset Indicators .................................................................................................. 26
5.2.1. Performance Indicator Checklist ................................................................. 26
5.2.2. General Indicators ....................................................................................... 28
5.2.3. Dam Indicators ............................................................................................ 31
5.2.4. Bridge Indicators ......................................................................................... 32
5.2.5. Road Indicators ........................................................................................... 34
5.3 Staff and Management Buy-in ........................................................................... 36
6 CONCLUSION ....................................................................................................... 37
6.1 Recommendations .............................................................................................. 37
Sources: ............................................................................................................................ 39
Appendix A: Definitions ................................................................................................. 43
Appendix B: Engineering Asset Strategy Sector’s Organizational Position ............. 44
Appendix C: List of Engineering Assets ....................................................................... 45
Appendix D: Consultation Matrix ................................................................................. 46
Appendix E: Recommended Policy Document............................................................. 53
Appendix F: Additional Asset Indicator Tables .......................................................... 56

Coupé 1
1 INTRODUCTION Understanding the extent to which an organization is meeting its objectives is one of the most important aspects of operating any organization. A common method for gaining this understanding is monitoring the performance of an organization and its components. Public Works and Government Services Canada (PWGSC) currently monitors the performance of the majority of its assets, such as office buildings and warehouses. However, there is a small group of PWGSC assets whose performance is not formally monitored. Specifically, there is no policy providing a framework for monitoring the performance of the department’s bridges, dams and highways (collectively described as the “engineering assets”). This report focuses on developing a performance measurement framework for the department’s engineering assets. It begins by providing some background information on PWGSC and its Engineering Assets Strategy Sector (EASS), the directorate responsible for the engineering assets. The report then describes what performance monitoring is and how it can be integrated into the broader process of organizational and asset management. The benefits and limitations of performance monitoring, as established in the academic literature, are highlighted and the existing policy framework for performance monitoring is described. Following this background information, the report provides information on smart practices in performance monitoring in general and other jurisdictions’ performance monitoring schemes for assets similar to PWGSC’s engineered assets. This section includes information provided in interviews of other jurisdictions’ asset managers. The views of PWGSC officials currently acting as the owners and operators of the engineering assets are also included in a consultation matrix. The report concludes with analysis, recommendations and a draft performance monitoring policy document for the engineering assets. It should be noted that this report does not deal with the entire EASS portfolio, and is focussed solely on the bridges, dams and highways, which make up the majority of EASS’s major assets. It also does not address monitoring the performance of individual assets, but instead focuses on a general performance monitoring approach for the three asset classes. Appendix A contains a list of definitions of important terms used in this report.
2 BACKGROUND
2.1 Public Works and Government Services Canada Public Works and Government Services Canada (PWGSC) is primarily mandated to provide internal administration of services for the Government of Canada. According to the Department’s 2008/09 performance report, PWGSC is the “government’s principal banker, accountant, central purchasing agent, translation authority, real property manager

Coupé 2
and enabler of access to government services online.” (PWGSC, 2009 b., p. 1) PWGSC is divided into five regions (Atlantic, Quebec, Ontario, Western and Pacific) outside of the National Capital Region. PWGSC’s Real Property Branch is responsible for $7.8 billion worth of real property assets, including 357 buildings owned by the government of Canada (RPB, 2008). These assets are managed at the regional level. Though it does have other responsibilities, the Real Property Branch is primarily focused on providing and managing office space for over 240,000 federal civil servants. In comparison to the department’s real-estate business area with its hundreds of assets, EASS’s portfolio is, relatively, small. EASS is a responsible for 21 major engineering assets, valued at approximately 4 billion dollars, which range from hundreds of kilometres of the Alaska Highway in northern BC, to the JC Van Horne Bridge linking Québec and New Brunswick across Chaleur Bay (EASS, 2008). Most of these assets are over 50 years old and some have been granted various levels of heritage status. With one negligible exception, none of the engineering assets produce revenue. EASS is also responsible for over 90 wharves and wharf sites across the country. For a complete list of the EASS assets please see Appendix C of this report. With the exception of the Esquimalt Graving Dock, all of EASS’s assets are under divestiture directives, meaning that they have been deemed surplus to the department’s needs and should be transferred or deconstructed if possible (PWGSC, 2009). This reality creates a unique set of asset management challenges for the agency. Traditionally the federal government was responsible for building and operating a wide range of infrastructure (from airports to dams). However, this role was changed as government mandates were narrowed and streamlined. The 1985 report of the Ministerial Task Force on Program Review headed by the Honourable Erik Nielsen (the Nielsen Report) recommended that the federal government divest itself of all assets not related to core government functions (Government of Canada, 1985). Since 1985, PWGSC has divested itself of many assets not related to office accommodation and internal government administration. Those assets that were not divested were incorporated into the broader asset portfolios of the regional offices, but remained under divestiture orders. Because the goal was to ultimately divest of the engineering assets, no sustained recapitalization maintenance funding was provided prior to 2007. The combination of the overriding divestiture mandate, a real-estate centric environment, and a lack of stable recapitalization funding led to a degradation of the assets’ condition. The importance of properly managing its engineering infrastructure came to the forefront of government’s attention following the collapse of an overpass in Laval, Québec in 2006. Though not a PWGSC asset, the collapsed overpass was a poignant reminder of what could happen if infrastructure assets were not properly managed. EASS was created in January 2007 to ensure effective and responsible stewardship of PWGSC’s engineering assets. To support EASS’s mission, the government set aside five years funding for the rehabilitation of the assets and for strategic planning for the EASS portfolio. Currently EASS officials are studying the assets, their functions, and the roles

Coupé 3
they play for local communities. Using this information, EASS is producing strategies on how to best manage and/or divest each asset going forward. Eventually an overall portfolio strategy will be developed. One gap that needs to be filled in order to create an overall strategy, and the central reason for this report, is the lack of an overarching performance monitoring policy covering the engineering assets.
2.2 Performance Monitoring Before discussing performance monitoring in the PWGSC/EASS context, a more general examination of this topic is appropriate. This examination provides an overview of performance monitoring, its benefits to an organization and its limitations. In the performance literature, there is a myriad of definitions of performance monitoring and other performance related processes. The meanings of the various performance processes frequently overlap and their definitions become blurred. As such, a clear understanding of the broader performance management process must be established. Performance management is the overall system through which an organization observes, evaluates and reacts to performance according to set goals. The goal of performance management is to “ensure that the organization and all of its subsystems… are working together in an optimum fashion to achieve the results desired by the organization” (McNamara, 2005). According to Smith and Goddard 2002, effective performance management is composed of four different functions: “formulation of strategy; development of performance measurement instruments; interpreting such measures; and encouraging appropriate organizational responses to performance information” (p. 247). This cyclical, four-way breakdown of performance management is common in the performance literature. Poister (1983) in his examination of performance at the state and local government levels, breaks it down into management, data, analysis and action (1983, p. 11). Henry and Dickey (1993) in their study of performance monitoring in the educational system, define their four components as establishing objectives, selecting indicators, comparing program performance, and taking action.1 Other authors (Canadian Chartered accountants, 2006 p. 4, and US GAO, 1997) meld the second and third components of the performance management process into one. This report melds the 3 and the 4 pronged approaches to performance management, breaking down the process into:
1. The Development (and redevelopment) of Strategy 2. Performance Measurement
a. Performance Monitoring b. Performance Assessment
3. Responding to Performance Results 1 Both Poister and Henry & Dickey use the term “performance monitoring” to refer to, what is described in this report as, the performance management process.

Coupé 4
2.2.1. Developing Strategy Developing strategy (or strategic planning) is the first step in performance management and from it flow all other performance management functions. Formulating strategy is largely a goal setting process. It is also the process wherein an organization’s overall management (or in the case of EASS, asset management) influences performance management (Chartered Accountants of Canada, 2006). This function sets performance goals based on a broader organizational mandate, formulates ways to reach these goals and highlights and addresses issues that could prevent the goals from being realized. The effects that past performance management have had on the organization as a whole should re-inform the strategy, and thus create a feedback loop. Without this feedback, a performance management system can become ineffective over time. As noted leadership expert John E. Jones put it; “What gets measured, gets done, what gets measured and fed back gets done well” (Jones in Williamson, 2006, p. 1). Also, the strategy should strive to be informed by the external environment, which may be frequently changing, in order to ensure its continuing relevance (Smith and Goddard, 2002). A road operator setting the overall strategic goal that a section of road is to be safe is an example the goal setting that is essential to developing strategy. Establishing how the operator needs to measure, analyse and respond to the road’s safety falls under the other performance management steps. However, each of these steps must be informed by the strategy, and therefore relate to overall organizational goals. The overarching strategy for the PWGSC’s engineering assets is currently being developed as part of EASS’s strategic planning mandate.
2.2.2. Performance Monitoring and Assessment Performance monitoring and performance assessment cannot be fully understood on their own as they are only components of the larger performance management process. Performance measurement is succinctly defined by the US Government Accountability Office as “the process of developing measurable indicators that can be systematically tracked to assess progress made in achieving predetermined goals and using such indicators to assess progress in achieving these goals.”(US GAO, 1997) Performance monitoring makes up the first part of this definition, the indentifying and gathering of information, but it does not engage in any assessment of the data gathered. For the purposes of this report, performance monitoring is defined as the process of identifying and providing accurate and timely performance information on a specific entity or entities. This definition flows largely from the policy objective of the Real Property Branch’s Asset Performance Monitoring Policy (Real Property Branch, 2009). Recording, investigating and reporting traffic data to provide information on a road’s safety is an example of monitoring performance.

Coupé 5
The evaluation component of performance measurement is called performance assessment.2 The Australian Asset Management Collaborative Group, a group of Australian government organizations committed to improving asset management, defines
performance evaluation as “the systematic, objective assessment of the efficiency, effectiveness and compliance of a service or part of a service”(AAMCoG, 2008). Using the road safety example above, performance assessment would involve assessing whether the number of monitored traffic collisions meets the safety goals set by the department. While this report
will not put forward recommendations on how to assess performance, it will highlight some areas of interest on the topic for EASS. Performance indicators (also referred to as performance measures) are an important component of the performance measurement process. Performance indicators are quantitative or qualitative variables used to assess achievement of an organization’s performance goals (National Performance Review, 1997). They are the actual, recordable items through which performance is measured. In the performance monitoring process these indicators are identified and measured according to the goals set out by the performance strategy. In the performance assessment stage the actual indicator levels are compared by, and assessed through, the goals set out in the performance strategy. Often benchmarks are used to assess the performance of an indicator, by assigning an appropriate performance level, typically numerically. Benchmarks are described as “a numerical point of reference generally historical or current, and if used in a future sense would be understood to be a target” (Canadian Water and Wastewater Association, 2009, p.8). The number of traffic collisions per month is a possible performance indicator for the road safety case described above. What makes for an effective performance indicator, and how it should be analysed, is discussed later in this paper.
2.2.3. Responding to Performance Results The final component of the performance management process is responding to the information and analysis provided by performance measurement. Through this pre-established response the organization takes action to improve its performance. The process may include pre-set rules and procedures on how to respond to various performance measurement results. Building on the road safety example, 50 traffic collisions are monitored in one month, significantly more than the level (20) that has
2 Performance monitoring and performance measurement are not always treated as separate entities, as some definitions exclude performance assessment from the performance measurement process. However, for the purposes of this report, performance assessment has been included as part of the performance measurement process due to the close relationship between the establishment of performance measures (part of monitoring) and their assessment, especially with regards to performance indicators.
Performance Monitoring: the process of identifying and providing accurate and timely performance information on a specific entity or entities.

Coupé 6
been established as safe. According to pre-set procedures, the road organization initiates a study on safety issues of the road. In order to adequately respond to the information gathered through performance monitoring and measurement, this information should inform the refinement of strategy, a return to the first stage of performance management. The best performance management system can be rendered ineffective if the performance does not elicit effective responses, particularly from management, that are ultimately tied into the organizational goals (Smith and Goddard, 2002). Though this report focuses primarily on one component of performance management, it is important to understand the overall processes and how it affects and is affected by the performance monitoring. Figure 1 illustrates the linkages between performance monitoring and these other processes. Figure1: The Performance Management Process
(Adapted from Smith and Goddard, 2002, p 248)
2.3 Why Monitor? It is important to highlight why performance monitoring is used and the benefits it can produce. One of the most commonly discussed benefits is that performance monitoring increases an organization’s focus on outcomes over processes. For public asset managers, engaging in performance monitoring provides a better understanding of how well a particular asset (or portfolio of assets) is ultimately serving the public and/or government. Having focussed the organization on an asset’s performance, it can now more clearly work towards improvement. This focusing effect is one of the reasons

Coupé 7
performance indicators have been described as the “backbone of any asset management framework,” (Bradbury, 2004). Without a focus on performance, “government too often becomes wasteful, ineffective and unresponsive.” (Wholey and Hatry, 1992, p. 605) Through the examination of meaningful and useful indicators, an organization can observe what is and isn’t working. A 1997 US Government study on performance measurement argued that monitoring performance assists an organization to not only detect problems, but also to inform strategies to fix them (National Performance Review, 1997). By identifying and addressing issues that are limiting its ability to reach goals, an organization can improve its efficiency and effectiveness. Performance monitoring provides the information that enables an organization “to asses [sic] its progress and adjust to changing conditions, and helps [the organization] achieve its planned outcomes” (Canadian Chartered Accountants, 2006). Unlike traditional practices where only costs and services were recorded, performance monitoring can inform an organization on how it is performing on a myriad of fronts (Wholey and Hatry, 1992). This is especially useful for government organizations, whose concerns are broader than just the financial bottom line. Performance monitoring is also argued to increase accountability. As performance information is gathered and assessed, it can be shared with stakeholders to demonstrate the results of a policy or action (TAC, 2006). Performance monitoring can foster accountability within a department (i.e. between an asset manager and asset owner), between the department and parliamentarians, and/or between government and the public; depending upon the indicators used and how the information is reported (Smith, 1989). Performance monitoring can also be used to demonstrate accomplishments. As opposed to announcing simply that X amount of money has been spent on a project, performance monitoring allows governments to point to actual changes that have occurred since a program has begun.3 For example, a manager monitoring safety performance of a road could demonstrate that the number of vehicle collisions has decreased since it improved road curve banking, instead of simply reporting on the cost of the bank improvement. Not only does reporting performance demonstrate accomplishments, but it also can help elicit behavioural changes. According to Figlio and Kenny (2009) sharing performance information can influence the behaviour and choices of stakeholders. For example, if a Minister is shown that the safety indicators on a road are largely negative, he/she may be more open to funding options to improve safety.
3 An organization must be careful, however, not to claim a causal relationship between an action and a measured performance indicator without concrete proof of causality.
Coupé 8
2.4 Limitations Though performance monitoring is an important component of organizational and asset management, it does have its limitations.
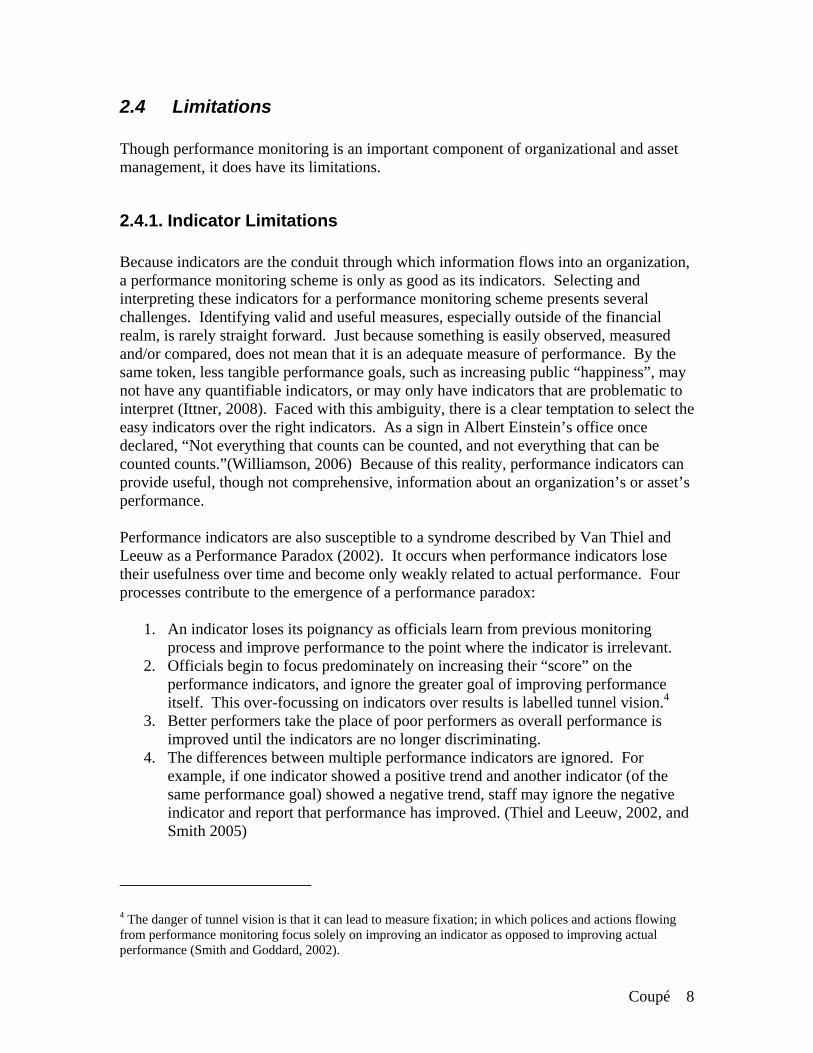
2.4.1. Indicator Limitations Because indicators are the conduit through which information flows into an organization, a performance monitoring scheme is only as good as its indicators. Selecting and interpreting these indicators for a performance monitoring scheme presents several challenges. Identifying valid and useful measures, especially outside of the financial realm, is rarely straight forward. Just because something is easily observed, measured and/or compared, does not mean that it is an adequate measure of performance. By the same token, less tangible performance goals, such as increasing public “happiness”, may not have any quantifiable indicators, or may only have indicators that are problematic to interpret (Ittner, 2008). Faced with this ambiguity, there is a clear temptation to select the easy indicators over the right indicators. As a sign in Albert Einstein’s office once declared, “Not everything that counts can be counted, and not everything that can be counted counts.”(Williamson, 2006) Because of this reality, performance indicators can provide useful, though not comprehensive, information about an organization’s or asset’s performance. Performance indicators are also susceptible to a syndrome described by Van Thiel and Leeuw as a Performance Paradox (2002). It occurs when performance indicators lose their usefulness over time and become only weakly related to actual performance. Four processes contribute to the emergence of a performance paradox:
1. An indicator loses its poignancy as officials learn from previous monitoring process and improve performance to the point where the indicator is irrelevant.
2. Officials begin to focus predominately on increasing their “score” on the performance indicators, and ignore the greater goal of improving performance itself. This over-focussing on indicators over results is labelled tunnel vision.4
3. Better performers take the place of poor performers as overall performance is improved until the indicators are no longer discriminating.
4. The differences between multiple performance indicators are ignored. For example, if one indicator showed a positive trend and another indicator (of the same performance goal) showed a negative trend, staff may ignore the negative indicator and report that performance has improved. (Thiel and Leeuw, 2002, and Smith 2005)
4 The danger of tunnel vision is that it can lead to measure fixation; in which polices and actions flowing from performance monitoring focus solely on improving an indicator as opposed to improving actual performance (Smith and Goddard, 2002).

Coupé 9
2.4.2. Causality Just because a performance monitoring indicates that performance is improving or worsening, it may not definitively attribute this change to a specific policy, action or asset. Extraneous factors, such as weather, can have a significant impact on performance. Wholey and Hatry (1992) argue that though performance monitoring systems do provide useful information, they are not intended to demonstrate causal links. Understanding how an organization or asset is performing is useful, even if one does not understand why it is performing that way. Fortunately for infrastructure asset managers such as EASS, linking performance back to an asset is a much more certain task than it is for linking it back to a social program given the physical nature of infrastructure (McDavid and Hawthorn, 2006).
2.4.3. Cost vs. Effectiveness Balancing what to measure with the cost of measurement is a challenging component of performance monitoring. The more indicators an organization monitors, the more complete a picture of overall performance it will have. However, there is a cost (both in funding and time) associated with every increase in monitoring (Henry and Dickey, 1993). If an organization measures too few indicators, it is less likely to understand its actual performance. Conversely, efficiency gained through performance improvement could be quickly nullified by high costs of over-monitoring. Though the ideal of performance monitoring is “to measure as little as possible, but to ensure to measure things that matter” (Liu, 2009, p. 16); some degree of efficiency and/or effectiveness must be sacrificed in this trade-off.
2.4.4. Effects on Staff/Public Performance data can have serious and unintended effects on an organization’s stakeholders. There is a risk that indicators will be misinterpreted by the public and/or political representatives as causally related to a given policy or action. This could create a knee-jerk reaction and push the organization in a direction contrary to improving actual performance. Staff may be wary about collecting data that they believe will end up reflecting poorly on themselves in the future (Wholey and Hatry, 1992). Staff can impede the performance monitoring process if they fear its results or feel mistrusted. For example, staff can select less revealing indicators to measure, only include well performing aspects to be measured or misrepresent indicators to frustrate the process (Van Thiel and Leeuw, 2002). Collecting too much information can also have negative impacts on stakeholders. Not only can recording and reporting too much information drive up costs, but it can also limit understanding. In a study on performance measurement in public leisure facilities,
There is a cost (both in funding and time) associated with every increase in monitoring.

Coupé 10
Yi-De Liu observed that profligate information can make data reporting more complicated and less accessible to staff and the public (Liu, 2009).
2.5 Policy Framework Performance monitoring is not a new or revolutionary idea for the Government of Canada or PWGSC. A substantial policy framework encouraging and requiring performance monitoring exists at multiple levels of the federal government. The 1997 Auditor General’s Report to Parliament argued for a greater emphasis on managing for results of government actions to improve public sector management and accountability. The report argued that in order for an organization to manage for results, it needs to know how it is performing (Office of the Auditor General, 1997) . Generally, the Treasury Board Secretariat (TBS)5 has adopted results based management as a government wide management approach. TBS also acknowledges that performance monitoring is a key component of a results based management approach. In its Management Framework, TBS states that:
Managing for results requires attention from the beginning of an initiative to its end. It means clearly defining the results to be achieved, delivering the program or service, measuring and evaluating performance and making adjustments to improve both efficiency and effectiveness. It also means reporting on performance in ways that make sense to Canadians. [emphasis added] (TBS, 2000, p. 11)
TBS also requires that performance monitoring processes must be applied to a department’s management of real property. In the TBS Policy on Management of Real Property, section 6.1.3 states that;
The overall performance of the real property is regularly and systematically assessed for functionality, utilization, and physical and financial performance. Key performance indicators and targets must be developed based on appropriate benchmarks (TBS, 2006).
Responsibility for performance monitoring has been established by TBS policy. The Policy on Investment Planning - Assets and Acquired Services assigns “Deputy Heads” with the task of establishing information systems that allow for the measuring and reporting on performance. (TBS, 2007) PWGSC has also instituted performance monitoring policy, and has set out guidelines for the creation, collection and assessment of performance indicators. The Property Management Framework (Draft) requires that all indicators meet the SMART6 test for
5 TBS serves as the management board for the Government of Canada (TBS, 2000) 6 The SMART test requires targets to be specific, measurable, achievable, relevant and timed (Bird, 2005)

Coupé 11
performance targets and FABRIC7 tests for performance systems, be collected using a Metric Template and be assessed using the Procedure for Assessing Data Quality Pertaining to Performance Management (PWGSC, n.d.) Flowing from the TBS policies and Property Management Framework, PWGSC has developed the Real Property Branch Asset Performance Monitoring Policy. This policy establishes a systemic approach the department will take towards its real property assets. It divides performance into four general categories; financial, operational, functional and strategic value (RPB, 2009). Figure 2 lists the indicators for each of the four monitored performance areas. As these indicators make clear, this policy is focused primarily on real-estate assets. In fact, the policy explicitly excludes engineering assets from its application. (RPB, 2009) This exclusion leaves a notable gap in the overall policy framework, providing no formal guidance for the performance measurement of the engineering assets. The balance of this report aims to provide information and recommendations to help fill this gap. Figure 2: Indicators for the Real Property Branch Asset Performance Monitoring Policy
Financial * Operational Functional Strategic Value
Return on Investment (ROI)
Compliance with Codes
Quantity/quality of space
Importance to portfolio
Unit costs Heritage and environmental requirements
Location requirements
Alignment to strategies (all levels) Unit revenues Health and safety Asset condition
Vacancy rates Accessibility Operating conditions
* financial indicators are currently being re-evaluated
(Source: RPB, 2009)
3 PERFORMANCE MONITORING PRACTICES
3.1 General Smart Practices in Asset Performance Monitoring
3.1.1. Effective System Attributes Poister’s Measuring Performance in Public and Non-Profit Organizations, (2003) arguably the seminal text on performance measurement, provides a comprehensive, step-by-step overview of what is required in order to set up an effective performance systems. The first step of this process is to obtain management’s commitment to monitoring,
7 The FABRIC requires that measurement criteria be Focused, Appropriate, Balanced, Robust, Integrated, and Cost-effective (Her Majesty’s Treasury et al, 2001). FABRIC is discussed in greater detail later in this report.

Coupé 12
measuring and managing performance. If managers do not buy into a performance monitoring program, it is unlikely that they will support its development or enforce/support the program once produced (Poister, 2003). This requirement applies not only to high level (departmental) managers responsible for policies and strategic direction, but also those individuals who are in charge of ground level management (asset managers). The importance of management acceptance of performance monitoring is echoed by the US Government’s National Performance Review. It states that “Clear, consistent, and visible involvement by senior executives and managers is a necessary part of successful performance measurement and management systems” (1997, p. 2). In Canada, the TBS has also listed “leadership” as one of the keys to a successful performance monitoring system (TBS, n.d.). An organization’s culture can also impact the effectiveness of performance monitoring system(s). An organization with a culture that prizes evaluation will help to foster performance monitoring programs by encouraging entrepreneurialism and promoting continuous learning (TBS, n.d.). Without this type of culture, performance monitoring will likely be seen as unimportant or even harmful to the organization, and will not be taken seriously by staff. In an organization with an evaluation culture gathering, sharing, and perhaps even publishing performance information is seen as both productive and useful. However, a positive culture can quickly be eroded by a poorly designed performance monitoring system. If employees are constantly demoralized and antagonized by performance information, or if they believe that the system undermines their professional values, this culture can evaporate and performance monitoring schemes can falter and fail (Bird, 2005). As such, any proposed performance monitoring system should be considered with regards to its impact on staff. As was mentioned in section 2.5, PWGSC emphasises performance monitoring systems should meet the requirements of the FABRIC test. In order to do so the system must be:
Focused on the organisation’s aims and objectives; Appropriate to, and useful for, the stakeholders who are likely to use it; Balanced, giving a picture of what the organisation is doing, covering all
significant areas of work; Robust in order to withstand organisational changes or individuals leaving; Integrated into the organisation, being part of the business planning and
management processes; and Cost Effective, balancing the benefits of the information against the costs.
(Her Majesty’s Treasury et al, 2001, p. 3) An effective performance system would meet all of the test’s criteria and do so in a way that adequately reflected the organization’s unique needs. Attaining a proper balance between the demands of each of the test’s criterion can also make these seemingly simple and straightforward criteria more difficult to achieve (Her Majesty’s Treasury et al, 2001).
A positive culture can quickly be eroded by a poorly designed performance monitoring system

Coupé 13
EASS’s assets are owned ultimately by the Canadian public, and the Canadian public should be deriving a benefit from them. As such, the public’s opinion of and experiences with an asset is a potential source of performance information. If the public is unsatisfied with an asset, it may be a signal that the asset is not delivering on its desired function. Because of the greater customer perspective it provides, including indicators measuring public opinion/feedback on an asset’s performance is the current trend in public and private sector asset management (Transportation Association of Canada, 2006). A report on lifecycle costs and benchmarking prepared for EASS suggests that the number of complaints (per 1,000 persons served by an asset) would be one potential indicator of public opinion/feedback (AECOM, 2010). However, despite providing information from those impacted by an asset, public opinion may be difficult and/or expensive to collect. Also it may not deliver clear information if the public does not identify an asset (and its impacts) with their daily lives. For example, it will likely not be useful to gather public opinion on a distant dam if people do not have knowledge of the effect it has on local water flows. Once performance information is collected, it needs to be used, or risk becoming irrelevant. Reporting on performance is a common way to use performance information, and it increases the accountability of the organization. Performance information can be reported in multiple ways: up the managerial chain, to the political level and/or to the public directly. Regardless of the final target audience, reporting must be undertaken according to policy requirements and must not become focussed on shaming individuals or witch-hunts against staff (AAMCoG, 2006).
3.1.2. Inputs vs. Outputs vs. Outcomes The selection of performance indicators is arguably the most important aspect of establishing an effective performance monitoring system, as they provide the raw performance information. In the performance literature, there are three distinct categories of what indicators can measure: inputs, outputs and outcomes. Input Indicators: These indicators measure the resources dedicated to particular assets
or programs (Dwyer, 2009). For example, monitoring how much funding is allocated to the maintenance of an asset would provide an input indicator.
Output Indicators: These indicators examine the activities or materials an
organization produces. Essentially, outputs are the end product of a program (AAMCoG, 2008). For example, how many kilometres of highway are re-paved during the year would be an output indicator.
Outcome Indicators: These indicators highlight the eventual results of a program for
the public or organization (Dwyer, 2009). For example improvement of the overall safety for bridge users would be an indicator of outcome.
These three areas are interconnected as Figure 3 demonstrates. Inputs (money, resources) are injected into a program or organization. These inputs are used to create outputs

Coupé 14
(goods, services) which in turn enter the public realm. The impact on the external environment of the output is considered an outcome. Figure 3: The Interaction between Inputs, Outputs and Outcomes
Inputs Outputs OutcomesOrganization/
Asset
External Environment
External Environment
When selecting indicators, one should be mindful about whether they are measuring inputs, outputs or outcomes. Information gleaned from an indicator will be limited by which of the three phases it belongs to. Which phase of the asset management process provides the most appropriate measure of performance, is frequently discussed in the literature. Smith argues that, for the public sector, the benefit for society of a program or policy occurs at the outcome level, and, as such, outcome performance indicators should be favoured over input and output indicators (1995). The Transportation Association of Canada (TAC) agrees with Smith’s assertion, and encourages organizations to increase the usage of outcome indicators (TAC, 2006). Focusing on outcomes can also help prevent the common performance monitoring pitfalls of tunnel vision and measure fixation discussed above. Instead of being blinded by targeted levels of production or funding limits, outcome measures provide a broader view
of the external environment that is influenced by an organization or asset (Smith and Goddard, 2002). For example, a bridge manager would get a more comprehensive perspective on actual safety through monitoring outcome measures (such as number of injuries on the bridge) than
output measures (such as number of bolts replaced). By focussing strictly on the bolts, the bridge manager may be missing the bigger safety issues. Though an outcome focus for performance indicators is widely held to be good practice, there are important reservations that should be highlighted. The primary deficiency of using outcome indicators is their nebulous nature. Inputs, such as funding allocated, and outputs, such as number of bolts replaced can be clearly and precisely measured. Outcomes, such as overall health and safety of, or public satisfaction with an asset are much more difficult to describe, quantify and measure. The National Cooperative
Focusing on outcomes can help prevent common performance monitoring pitfalls

Coupé 15
Highway Research Project (NCHRP) argues that output indicators provide important early information on performance (NCHRP, 2006). While inputs and outputs can usually be directly linked to a program/policy/action, a causal link between an action and outcomes are typically more difficult (if not impossible) to prove. Many elements beyond a particular organization or asset, affect an outcome. This reality makes assigning responsibility for an outcome a complex and unclear task (Dwyer, 2009). Outcome indicators, with their often nebulous nature, also have the potential to obfuscate how well an organization or asset is performing. In a 2009 speech, the Secretary to the New Zealand Treasury argued some organizations have minimized or even hidden their output performance by focussing overly on outcome performance (Whitehead, 2009). Using the bridge safety example from above, a bridge manager could use the fact that there have been very few crashes on the bridge to declare the bridge safe, despite the fact that a majority of the bridge’s bolts are old, corroded and likely to fail. The UK government points out that all three levels of indicators are needed to have an effective performance monitoring system. It recognizes that outcome measures are important and that a system should be focussed on outcomes, as improving these is the ultimate goal. However, inputs and outputs also need to be measured to better understand how outcomes are shaped (Her Majesty’s Treasury et al, 2001). Dwyer (2009) echoes this sentiment and also argues for performance monitoring with an outcome focus. Under his theory input and output indicators can be used as well as outcome indicators, so long as they are logically connected to an eventual outcome (Dwyer, 2009).
3.1.3. Attributes of Effective Indicator Beyond the three general levels of indicators discussed in the preceding section, there are criteria that suggest what makes an effective performance indicator. This section examines some common practices and frameworks for selecting effective indicators. In its Choosing the Right Fabric: A Framework for Performance Information document, the UK government not only set out the criteria for an effective performance measurement system (the FABRIC Test discussed above) but also established a set of key attributes for effective performance indicators. The document highlighted that appropriate indicators must be:
relevant to an organization’s goals, not encourage undesirable behaviour, attributable to organizational actions (with clear accountability), well defined and unambiguous, timely, in that the information can be used while still relevant, reliable, in that it is accurate and change responsive, comparable to past performance and/or other organizations’ performance, and provide verifiable information.
(Her Majesty’s Treasury et al, 2001)
Coupé 16
The Canadian Institute of Chartered Accountants (CICA) use largely the same requirements for performance information as the set out in Choosing the Right Fabric. In its Statement of Recommended Practice (SORP-2), CICA requires that performance indicators should be reliable and valid, relevant, and comparable and consistent; all of which are similar to the requirements listed above8 (Canadian Institute of Chartered Accountants, 2006). In addition to these similar requirements, CICA also has established some different ones. Specifically, effective performance indicators must be:
fair, in that the indicator is free from bias, and able to be easily understood by those using and analysing the information
(Canadian Institute of Chartered Accountants, 2006). The British Columbia Provincial government has established a set of key attributes specifically for indicators measuring the performance of capital (physical) assets. In the Province’s Capital Asset Management Framework document, the importance of monitoring performance is recognized. This document also establishes that there are six desirable attributes that asset performance indicators should exhibit (Government of BC, 2002). Though some of these requirements overlap with the UK Government and CICA requirements (e.g., comparative and stable indicators), the Framework provides some new requirements. Asset performance indicators should be:
results oriented to demonstrate consequences (similar to an outcome focus), diverse and balanced, using a mix of outcome and output indicators and
providing a variety of perspectives, and able to withstand scrutiny (Government of BC, 2002).
In the US transportation sector, attributes of effective performance indicators have been established by the National Cooperative Highway Research Program (NCHRP)9. The NCHRP’s Project 20-60: Performance Measures and Targets for Transportation Asset Management document, succinctly sums up that a performance indicator is “suitable for asset management if it helps the organisation make better decisions about where to invest its resources, and if actions taken by the organisation can influence changes in the value of the measure.” (NCHRP, 2006, p. 3) Beyond this overarching requirement, effective performance indicators should also be:
sensitive to policy objectives, easily communicated, feasible to be implemented and analysed, and
8 It should be noted that CICA’s SORP-2 is discussing performance from a reporting context, rather than from a monitoring or measuring context. However, the principles are still applicable as indicators that are monitored must be reported on at some point during the performance management process. 9 NCHRP, administered under the US Transportation Research Board and sponsored by state transportation agencies, researches highway planning, maintenance, construction, etc in the US. (Transportation Research Board, n.d.)

Coupé 17
able to be predicted under different scenarios, depending on various inputs (NCHRP, 2006).
Though NCHRP is discussing performance strictly from the perspective of transportation asset management, these requirements are applicable across multiple asset classes. The Australian Asset Management Collaborative Group (AAMCoG), in its report on asset performance measurement, incorporated many of the conclusions in NCHRP’s Project 20-60, including the above requirements, as recommended best practices (AAMCoG, 2008). The attributes for effective indicators listed in this section are a representative sample of common best practices from diverse jurisdictions with equally diverse interests. Despite this diversity, many common themes do emerge (e.g. the importance of indicator comparability), and should be taken note of. Not all of these attributes will be applicable to every organization’s performance monitoring program. However, these suggested requirements do provide a basis for reviewing any potential indicator. Section 5.2.1 provides an analysis of these requirements as a checklist for EASS’s unique needs.
3.1.4. Asset-Specific Performance Monitoring Though the preceding sections discussed general performance monitoring “smart” practices that are applicable to all types of performance monitoring, more specific “smart” practices are also needed. As EASS is an asset management organization, some attention must be given to smart practices specific to asset performance monitoring. One excellent source for these types of practices is the asset management experts from Australian Asset Management Collaborative Group (AAMCoG). According to the AAMCoG, asset performance should be monitored via four different facets: financial performance, utilisation, function and physical condition, to better highlight specific strengths and weaknesses of an asset (AAMCoG, 2008). Figure 4 demonstrates some questions that performance monitoring information should assist in answering.

Coupé 18
Figure 4: AAMCoG Facets of Asset Performance
Financial Performance
Are the asset's operating costs similar to those for other comparable assets? (use of benchmarking)
Are the energy, cleaning and maintenance costs reasonable?
Are user charges being made, and how do they relate to the total operating costs of the asset (including cost of capital)?
Utilisation
How intensively is the asset used? Could it be used more productively by extending its working hours, or by accommodating additional functions?
Function How well suited is the asset to the activities and functions it supports?
Physical Condition
Is the asset adequately maintained? Is there a maintenance backlog that requires attention? Are major replacements or refurbishments likely to be required during the planning period?
(Adapted from: AAMCoG, 2008, p. 2)
The performance facets described by AAMCoG are somewhat different from the facets monitored under PWGSC’s existing asset performance monitoring policy, namely financial, operational, functional and strategic value (RPB, 2009). The financial aspect of performance is important to monitor, as it provides information on the cost to operate an asset, the ability of an asset to make money and the estimated worth of an asset (typically described through accrual accounting processes and lifecycle costing). Monitoring financial performance can also be used to draw the attention of decision makers to areas that are underfunded (AAMCoG, 2008). The utilization criterion takes into account an organization’s goals for an asset and then uses indicators that show how intensively the asset is being operated to meet these goals. Monitoring utilization allows an organization “to measure the difference between what an asset is capable of delivering and what it actually delivers” (AAMCoG, 2008, p. 10). Monitoring the number of days a year a bridge is inaccessible to traffic due to repairs is an example of a utilization indicator as it provides information as to how intensively the asset was able to be used. The functional performance of an asset addresses how well an asset is carrying out the action(s) that an organization expects from it. Functional performance indicators ultimately provide information on how well an asset is suited to its given tasks (AAMCoG, 2008). For example, how well a road facilitates traffic flow from one point to another, is a measure of functional performance. With infrastructure assets, physical condition is usually monitored in terms of operational efficiency, health and safety and the ability to provide a given service (AAMCoG, 2008). Physical condition is often monitored at the component level of large, engineered assets,

Coupé 19
to provide a more in depth and useful information. In order for physical condition information to provide meaningful insight into an asset, the organization must establish an acceptable condition level for the asset. Typically this is a state, often set out by engineering standards, which allows an asset to perform its allotted task(s) and do so in a manner which is safe for operators and the public (AAMCoG, 2008). Safety Aside from the facets of performance, there are also other smart practices when monitoring specifically for assets. Monitoring safety is one of the most important aspects in an asset performance monitoring system, especially for large infrastructure assets such as bridges and dams. A bridge collapse or a dam failure could cause significant loss of life and damage to property. As such, in the last 50 years there has been an increasing demand from asset managers for greater tools to monitor asset components to provide the earliest hint of serious failure (Curt, Peyras and Boissier, 2010). Not only should an asset performance monitoring system monitor indicators for potential failures, but also the safety hazards faced by operators and users on a daily basis. Two of the most common ways of monitoring this aspect of safety are: recording the number of safety incidents on an asset and monitoring compliance with major workplace safety legislation (such as occupational health and safety codes) (Performance Mangement Team Lead, Ontario Ministry of Transportation, personal communication, April 29 2010, and Senior Engineer, Marine Structures, personal communication, April 14, 2010). Maintenance vs. Improvement There are typically two types of projects that are required on large infrastructure assets, maintenance projects, which generally maintain the asset at a static condition, and major capital projects, which are generally intended to extend the useful life of an asset (A/Director, EAS – A/Director of EASS, personal communication, April 16, 2010). As funding is always limited, the balance between these two types of projects must be carefully balanced. The US Department of Transportation recognizes the importance of balancing maintenance and improvement projects, and monitors the levels of funding spent on the two areas. This allows the asset operators to observe the likely impacts of different funding allocations on an asset’s present functionality and its projected lifespan. (US Department of Transportation, 2002).
3.2 Dam Performance Monitoring In the performance literature, the overriding focus for dam performance monitoring is on safety, due largely to the possible catastrophic impacts of a dam failure. Safety is often cited as the major driver for monitoring the physical condition of a dam, and is typically the largest criterion used when evaluating physical performance information (Curt,
Monitoring safety is one of the most important aspects in an asset performance monitoring system

Coupé 20
Peyras and Boissier, 2010). Despite the importance to monitor safety indicators, dam operators should not lose sight of non-safety related performance. For monitoring all aspects of dam physical condition, there are several agencies, such as the Canadian Dam Association (CDA) which amalgamate knowledge from multiple dam experts and operators into comprehensive recommended practices (Canadian Dam Association, n.d.). Functionally, all dams are structures constructed to impede water flows. However there are multiple reasons for erecting dams. Some dams are in place to provide the needed water pressure for hydro electric generation, others to facilitate water transportation, while still others are in place to provide a reservoir of drinking water for a community. Several common indicators used to provide information on a dam’s functional performance are:
Water Levels: both headwater and tail water levels are commonly monitored for short and long term changes.
Flow: inflow and outflow are especially important to hydroelectric dams that rely on flow levels to provide power.
Wind: dams creating large reservoirs can impact wind patterns which can create significant wind-force pressures on dam structures.
Water Quality: the quality of water in a dam’s reservoir. Reaction to Changes: how a dam (and its components) responds to changes in the
indicators listed above (ASCE, 2000) It should be noted that these use of these indicators will vary, depending on the role of a dam. For example, monitoring wind for a dam with a relatively small reservoir is likely not an efficient use of limited performance funding.
3.3 Bridge Performance Monitoring Bridge performance monitoring is rarely dealt with on its own, as bridges are generally treated as part of a larger transportation system. Ontario, for example, does not separate out functional bridge indicators from its analysis of wider transportation corridors (Performance Management Team Lead - Ontario Ministry of Transportation, personal communication, April 29 2010). As a result of this reality, several of the practices discussed in the following section on Highway performance monitoring (section 3.4) may also be applicable to bridges. However, due to the nature of EASS’s bridges being spread out across the country and administratively separated from provincial transportation systems, it is important to highlight key bridge performance monitoring practices. The monitoring of the physical condition of bridges is the one general exception to bridges being monitored solely as part of a transportation corridor. Similar to dam monitoring, this is largely because of the danger to life and property posed by a bridge failure. One of the most common methods of monitoring physical bridge performance is through a Bridge Condition Index (BCI). A BCI relies on the age, location and type of

Coupé 21
bridge, as well as information derived from regular inspections of the bridge and its components. From these factors, inspectors assign a numerical score to the bridge (by dividing the current value of the bridge by the expected replacement cost), to recommend the level of maintenance and upkeep for the coming year (Ontario Department of Transportation, n.d.). Ontario not only uses BCI at the individual bridge level, but also at the systemic level. The Ontario Ministry of Transportation uses the percentage of bridges with “good” BCI ratings as an indicator of systemic performance of their bridge portfolio (Performance Management Team Lead - Ontario Ministry of Transportation, personal communication, April 29, 2010). Beyond Ontario, at least six other provincial and territorial transportation ministries use the BCI, including BC, Alberta and the Yukon (TAC, 2006). Functionally a bridge provides a transportation link across some type of barrier (river, roadway). Though many of the performance measures used to monitor functionality are monitored at the wider transportation corridor level (i.e. traffic flow) there are some examples of functional indicators specific to bridges. The amount of weight a bridge can safely handle is one such measure. In the US, it is common for jurisdictions to monitor bridge weight limits to provide information on what traffic levels, or which vehicle types, can be accommodated (TAC, 2006). In the US, a rating system is used to determine if a bridge is adequate for its given purpose. The Bridge Sufficiency Rating (BSI) examines factors such as:
traffic volume roadway width structure type roadway alignment and the condition of the road deck and structure
(Washington State Department of Transportation, n.d.) This performance measure is used by States to provide a rationale for federal bridge maintenance funding. Only bridges scoring below a “good” rating are eligible for this Federal finding (Washington State Department of Transportation, n.d.)
3.4 Highway Performance Monitoring There are a number of indices used by road operators to monitor the physical condition of highways. Commonly used tools include:
Riding Comfort Index (RCI) Surface Distress Index (SDI) Pavement Condition Index (PCI) International Roughness Index (IRI) Pavement Quality Index (PQI)
(TAC, 2006, p. 10)
Coupé 22
These indicators usually provide an operator with an easily reportable, numerical score for the condition of the road. Because they are used by multiple jurisdictions, the above indices are effective performance measures for comparing road systems. The frequency and method with which these indicators are measured varies across jurisdictions to allow for the best fit with diverse organizations. For example, Manitoba monitors IRI using laser visual system every two years, while BC uses an infrared system every two years for main highways and every three years for minor highways (TAC, 2006). Safety is a major operational concern of highway operators due to the injury, loss of life and property damage that can be caused by vehicle accidents. The US Federal Highways Authority (FHWA) argues that performance measures that can ultimately be used to improve road safety, not only will help save lives but also provide other benefits such as improved quality of life (Herbel, S., Meyer, M.D., Kleiner, B., Gaines D., 2009). A Transportation Association of Canada (TAC) survey of seven Canadian jurisdictions several common outcome indicators for measuring roadway safety for the travelling public. One of the most common indicators used to monitor road safety is the accident rates per million vehicle kilometres (MVK) (TAC, 2006). Other indicators are used to provide greater detail on the location and severity of the accidents. By recording more detail, the information will likely be able to allow for more appropriate decision making. For example, if an organization knew not only the number of accidents that occurred on a highway, but also where the accidents occurred, the organization could invest most heavily in the areas with higher levels of crashes. Some examples of more specific safety indicators used by Canadian jurisdictions are:
Fatalities per MVK, Injuries per MVK. Property damage only incidents, Percent of incidents involving trucks per MVK, and Rail crossing incidents. (TAC, 2006, p. 8-9)
In the US, the FHWA also recommends a number of highway safety indicators to provide more detailed information:
Number of pedestrian fatalities, Number of speeding-related fatalities, Number of motorcyclist fatalities, Number of run-off-the-road crashes, Number of fixed object crashes, and Number of intersection crashes (Herbel et al., 2009, p.3)
Though effective outcome indicators, accidents are not the only measure of highway safety. Certain road features, such as appropriate signage are well known to improve

Coupé 23
road safety. For example, the number of warning signs installed, the number of medians installed or the number of miles with rumble strips are all output indicators used to provide information of road safety (Herbel et al., 2009). Functionally, highways are similar to bridges in that they facilitate the movement of vehicles from Point A to Point B. As such, highway functional indicators typically monitor traffic volumes, traffic flow, and average speeds (TAC, 2006). Some jurisdictions use more specialized versions of these general indicator types to yield more specific data. For example, an advisory group to the Oregon Department of Transportation has recommended that a volume to capacity ratio be used to compare actual traffic flows with the maximum traffic flows a roadway could handle (Eisele and Lomax, 2004). The State of Alaska relies on a very different indicator and monitors public feedback to assess how its transportation systems are functioning (Alaska Department of Transportation, n.d.). Reliability of a highway system is another functional component of performance. Monitoring the length and frequency of travel time delays is a common method for collecting reliability data (Eisele and Lomax, 2004). Some jurisdictions recognize that delays are a regular part of highway use (i.e. planned construction work) and refine their indicators to provide more specific information. BC, for example, measures the “total duration of unplanned highway closers greater than half an hour” (TAC, 2006, p.12) Environmentally, some US Jurisdictions go so far as to monitor the impacts on wildlife from road construction projects (Performance Management Team Lead - Ontario Ministry of Transportation, personal communication, April 29, 2010).
4 INTERNAL CONSULTATIONS In order to get a better understanding of how EASS’s assets are currently being monitored, interviews were held with officials involved with the operation and management of PWGSC’s bridges, dams and roads. These interviews were also a chance for the officials to share their views on how performance should be monitored and what indicators should (and should not) be used. Appendix D: Consultation Matrix provides a summary of the discussions held with internal PWGSC officials in the form of a consultation matrix. This matrix also provides space to record how an interviewee’s concerns/suggestions were used or rejected in a final policy decision. Through these interviews it was made clear that EASS is currently monitoring the performance of its assets, though in a somewhat patchwork fashion. The most comprehensive performance monitoring system currently in place for EASS is PWGSC’s Risk Framework. This framework applies to all of the engineering assets. It provides decision makers with information on the health and safety, financial and reputational risks associated with the asset, including information drawn from studies and inspections (A/Director, EAS, personal communication, April 16, 2010). The information gathered into the framework is analysed and reported using an easy to

Coupé 24
understand colour coding system (red, yellow, green) which shows which assets require some further attention (PWGSC, 2009). Also this framework is unique to PWGSC, and as such, could not be used to compare EASS’s asset performance with that of other jurisdictions.
Financially, EASS currently monitors and records the funding spent on the assets. Financial updates on maintenance and capital projects costs are provided monthly and at least 5 years of historical costing information is readily available to EASS. Strategic financial goals are provided in the Engineering Asset Management Plans (EAMPS) developed for each asset, and set out funding plans going forward 5-10 years. (EASS Financial Analyst, personal communication, May 4, 2010)
5 ANALYSIS
5.1 Performance Facets For the sake of consistency, a performance monitoring policy for PWGSC’s bridges, roads and dams should follow the structure and format of the RPB Asset Performance Monitoring Policy as closely as possible. However, there are some important differences that should be manifested in an engineering asset specific policy. The PWGSC-wide performance monitoring policy separates asset performance into financial, operational, functional and strategic value facets. This breakdown may not be the most appropriate for EASS’s assets. As all of PWGSC’s bridges, dams and roads have been declared surplus to PWGSC’s needs and added to the divestiture list, assessing their strategic value to PWGSC is problematic. The AAMCoG performance facets, specifically the “utilization” facet (see figure 3), would also be difficult for EASS’s portfolio. Utilization is “a measure of how intensively an asset is being used to meet [an] entity’s service delivery objectives, in relation to the asset’s potential capacity” (AAMCoG, 2006, p. 9). As the engineering assets are mostly scattered across the country as part of systems (roads and rivers) managed by other jurisdictions, increasing the utilization of the asset is typically out of the Department’s control. For EASS, an approach that blends both the PWGSC and AAMCoG’s partitioning of asset performance could be considered for use. Separating asset performance into financial, functional, operational and physical condition components would be more appropriate for EASS’s needs than using either of the two afore mentioned approaches. Figure 6 demonstrates these four components and the types of questions they could assist in answering.

Coupé 25
Figure 6: Four Facets of Asset Performance Financial Performance
Functional Performance
Operational Performance
Physical Condition
Are the asset’s operating costs improving?
How well suited is the asset to the activities and functions it supports?
Is the asset meeting its Health and Safety requirements (for the public and staff)?
Is the asset being maintained adequately?
Are the capital and maintenance costs reasonable?
Are there any problems with the asset meeting the department's or the public's needs?
Is the asset meeting its environmental requirements?
Are there any aspects of the asset that could cause a safety issue?
Are budgeting processes accurate?
Are the public satisfied with the asset?
Is the asset maintained to a standard that is comparable to similar assets? Is the asset using
funding efficiently?
Note: some information in Figure 6 is derived from - AAMCoG, 2006
Coupé 26
5.2 Asset Indicators
5.2.1. Performance Indicator Checklist Section 3.1.3 lays out an array of criteria that should apply to good indicators. Figure 5 provides a proposed checklist that should be consulted when choosing indicators for EASS’s assets based on the indicator attributes earlier in this report. This list could be used to evaluate any potential future indicators EASS wishes to add to a future performance monitoring policy. Figure 5: EASS Performance Indicator Checklist
Indicator Requirements: Yes/No
Is relevant to EASS's overall strategy?
Can verifiably be linked to an asset's performance?
Helps in understanding a final outcome of an assets performance, (even if not an outcome measure)?
Can be compared to either past/future performance and/or the performance of other similar assets?
Can easily be communicated to non-technical experts?
Provides consistent and reliable information within a timeframe for it to be useful to EASS?
Will not overly encourage a negative or counterproductive reaction from PWGSC staff or contractors?
Is established in an unbiased fashion to provide actual information, not desired results?
Cost effective to monitor
The requirements were synthesized from the attributes listed in section 3.1.3 to provide a concise list that would best meet EASS’s likely performance and procedural needs. Is relevant to EASS's overall strategy: this criterion ensures that the indicators
monitored provide information that can be ultimately linked to EASS’s overarching strategies. As Figure 1 demonstrates, linking indicators with strategy is an important aspect of any effective performance management process.

Coupé 27
Can verifiably be linked to an asset's performance: this criterion necessitates that an indicator provide information that can conclusively be attributed to an asset’s performance.
Helps in understanding a final outcome of an asset’s performance: this
requirement allows for not only outcome indicators to be used, but also input and output indicators, so long as they help provide useful information about an asset’s impact on the public (outcome focus). This balance between indicator types allows EASS to maintain focus on the final impact of an asset on the public, without ignoring important asset needs, such as funding levels and maintenance which, though not an ultimate outcome, provides useful information and may help to motivate staff.
Comparable: This criterion may be the most challenging to apply to EASS’s indicators. In a study examining benchmarking for EASS, AECOM has indicated that because of its unique situation, EASS may find it difficult to compare its assets to those managed by other jurisdictions (AECOM, 2010). For example, while EASS manages bridges in isolation spread across the country; most bridges are operated as part of the larger road system. As such, indicators for bridges as part of a larger system may not be applicable to isolated assets. In cases where otherwise useful indicators are unable to be compared across jurisdictions, the indicators should be able to be compared to the historic performance of the asset.
Can easily be communicated to non-technical experts: this criterion is important
because it will allow those evaluating the performance of the wider PWGSC portfolio (senior PWGSC/TBS staff or perhaps even Ministers) to incorporate information on the engineering assets.
Provides reliable information within a useful timeframe: this criterion requires
that all indicators be consistently available for collection. The indicator must also provide information that can be collected and analyzed within a timeframe that the information is still valid and/or useful. As there are some serious dangers related to bridge and dam failure, the faster its performance can be known, the better.
Will not overly encourage a negative or counterproductive reaction: the aim of
this criterion is to prevent, wherever possible, the potential problems with performance monitoring as discussed in Section 2.4. When selecting an indicator, the impacts that it will have on staff and the public should considered as well as how staff and the public will perceive the indicator. This checklist requirement is important to ensure that the performance management process does not create more problems than it solves.
Unbiased: this criterion requires that all indicators be established in a manner which
does not presuppose a desirable outcome. For example, an indicator should not be selected because a manager believes it will consistently portray an asset in a positive

Coupé 28
light. Ensuring unbiased indicators is important to provide clear and valid performance information.
Cost Effective: this criterion requires that benefits that could arise from monitoring
the indicator must outweigh the costs of collecting the information.
5.2.2. General Indicators The indicators discussed in sections 5.2.2, – 5.2.5 have been assembled based on researching other jurisdiction’s practices and current PWGSC practices, and on discussions with relevant PWGSC officials. They have also been evaluated using the checklist in the preceding section. Financial Performance Financially, as none of EASS’s bridges, dams or highways are significant revenue generators (with only limited potential for future revenue), using indicators such as return on investment would be impractical and inappropriate. Instead, the focus of EASS’s financial performance monitoring should be on allocating funding effectively and using the funding efficiently. The historical costs already collected by the Department would serve as an ample source of information for several indicators. How much funding was spent on a particular asset on an annual basis would be one of the most basic indicators available. The information gathered by this indicator would need to be compared to funding levels of other jurisdictions’ assets in order to be worthwhile. This comparison would likely be difficult due to the small size and scattered nature of EASS’s portfolio. Also the uniqueness of some assets, such as St. Andrews Lock and Dam (SALD) which is the only facility of its kind in North America, comparisons with other jurisdictions are made even more difficult. Where inter-asset comparisons are not appropriate, this indicator could be compared with past funding levels on the asset to show changes in its cost to PWGSC. Aside from the amount of funding spent on an asset, useful information can be gained through monitoring how the funds were spent. One of the major concerns raised by PWGSC officials during the interviews was that not enough attention was given to routine maintenance of the assets, and that large capital projects could take-up too large a portion of the funding (A/Director, EAS, personal communication, April 16, 2010, and Project Manager - Ontario Region, personal communication, April 26, 2010). An indicator showing the amount of funding allocated to regular maintenance as a percentage of total funding, would help demonstrate whether or not an asset was receiving adequate maintenance. This indicator would likely require a pre-set goal, such as establishing a certain percentage of funding that should be spent on maintenance. Monitoring this indicator may be somewhat difficult as it may not always be clear what constitutes “regular maintenance.” Though funding is divided between operations and maintenance (O&M) and Capital, there are times when Capital funding is used to conduct needed maintenance, such as painting a bridge (and vice-versa) (Project Manager - Ontario

Coupé 29
Region , personal communication, April 26, 2010). However, as properly maintaining a facility can lower long term costs, it is recommended that this indicator be included in an EASS performance monitoring policy. Another indicator that would provide useful information into how funding is used, would be to monitor the amount of funding spent on ancillary and administrative activities as compared to funding spent on core construction activities (maintenance and capital projects). The Ontario Ministry of Transportation uses this indicator on its bridges and roads to provide insight into how funding is allocated, and to highlight times when funding that could be better spent on core activities, such as paving, is spent on ancillary activities, such as installing traffic lights (Performance Management Team Lead - Ontario Ministry of Transportation, personal communication, April 29 2010). As PWGSC is often a process-oriented organization, this indicator would bring increased focus to the percentage of funding actually used to improve/maintain the assets. This information could be drawn from the historical cost information currently collected by EASS. A final, financial indicator of use to EASS, would be the variances between budgets and expenditures; expressed as a percentage. In order to be effective stewards of its assets, an organization must have reliable financial plans in place. This indicator would provide information as to how accurate EASS budgeting processes and, by extension, the business planning processes are. It also could be derived from the current historical cost information (EASS Financial Analyst, personal communication, May 4, 2010). Functional Performance As the public are the ultimate users/beneficiaries of the engineering assets, an indicator monitoring public satisfaction with the asset should be included in the performance monitoring policy. Though monitoring public feedback on an asset’s performance was seen as important by many PWGSC officials, a concern was raised that direct surveys of asset users may be too cost prohibitive to be worthwhile. One way in which public opinion could be gathered with relative ease would be to monitor the number of complaints submitted annually. PWGSC officials could compile the number of complaints, and what they pertain to, that are sent in directly to the department and to the National Service Call Centre, a 1-800 number the public can use to give feedback on federal government activities (Bridge Expert - CoE, personal communication, April 30, 2010). In order to help facilitate the collection of public feedback, a phone number could be posted near the assets, so that the public will know who they should contact with their concerns. This indicator will likely be more relevant to bridges and roads than dams, as the public is more aware of how transportation infrastructure impact their daily lives. Operational Performance The main indicators for operational performance in the Real Property Branch Asset Performance Monitoring Policy are compliance with relevant codes. These indicators are also recommended to be included in performance monitoring policy for the engineering assets. Compliance with health and safety codes (such as the Canadian Labour Code part
Coupé 30
2), environmental requirements (as assessed through the Environmental Assessment process) and heritage requirements (where appropriate), are the main areas that should be monitored. When recording this indicator, the following information should be included:
whether or not the asset met the appropriate standard (yes or no), the aspect(s) of the asset that prevented it from meeting the standard, and the severity of the failure (high/medium/low)
Much of this information will be gathered through regular inspections and environmental assessments. When contractors are doing the work, information could be gathered by PWGSC staff as part of their existing check-ups on work sites. For example, PWGSC officials could record the number of times contractors failed to abide by agreed to health and safety plans (Bridge Expert - CoE, personal communication, April 30, 2010). Code compliance cannot be the only operational indicators used as they present only a partial picture of performance. For example, a health and safety code may require workers on a bridge to wear life preservers because they are working above water. Even if they are working in an area that is regularly traversed by the public (who are not required to wear life preservers), the workers without life preservers would be monitored as an indicator of unsafe practices (Superintendent of Marine Operations - Western Region , personal communication, April 22, 2010). To provide more fulsome information on operational performance, instances of health and safety and environmental incidents must be monitored. Incidents would likely include worker injuries or actions causing (or having the potential to cause) environmental damage. Even close calls could be recorded as indicators of an unsafe work environment, or danger to the environment. Not only should the indicator record the number of incidents, but also:
a brief description of the incident, the cause of the incident, and the severity of the incident.
Monitoring incidents provides an outcome measure for operational performance, and help to focus attention on the ultimate health and safety and environmental performance of an asset. However, as is the case with many outcome indicators, it is likely that incidents will be partially caused for reasons beyond the control of the asset or EASS. This reality must be noted so that incorrect assumptions are not drawn from the performance monitoring process. Physical Condition As structures vary a greatly between asset types, physical condition performance indicators should generally be developed for a specific class of asset rather than being focussed on assets generally. One exception to this rule is the risk rating developed through EASS’s risk framework. The risk framework provides useful information about the major risks to the assets from the perspective of a divestiture-driven organization.

Coupé 31
The risk rating best fits as an indicator of the physical aspects of performance, such as condition ratings, severity of potential failures and lifespan measurement. A performance monitoring policy would focus more on the actual performance of an asset from the perspective of being good stewards of the asset. Both of these viewpoints are important for EASS to have. The asset risk rating would make a useful indicator that could provide information on an asset’s overall performance. The risk rating also provides an easy to understand, easy to report, colour-coded indicator; red for high risk, yellow for medium risk, green for low risk. (A/Director, EAS, personal communication, April 16, 2010). With so much already being monitored through the risk framework, it would be a mistake to craft any performance monitoring policy without incorporating the information gathered through the risk framework. Care must be taken to ensure that a performance monitoring policy will not supplant the current risk framework, but instead be used to complement it.
5.2.3. Dam Indicators Functional Performance The primary function (and ultimate outcome) of EASS’s dams is to maintain water levels at a level that permits navigation along a water body.10 Because of this fact, it is important to monitor water levels in areas that are affected by a dam’s operations. In order for this indicator to be as effective as possible, a target water level should be established, with which to compare the levels as monitored. Obviously other factors, such as weather, will influence water levels. However, this fact does not preclude the importance of knowing how well water levels were maintained. If, for example, water levels fluctuate wildly due to increasing rainfall, it could be argued that, even though the dam is well maintained, it no longer serves the function it was intended to (Senior Engineer, Marine Structures, personal communication, April 14, 2010). In some cases electronic water level monitoring stations are already in place for EASS’s dams (Project Manager - Ontario Region, personal communication, April 26, 2010). If not directly monitored by PWGSC, the necessary information is likely being monitored by another jurisdiction. The operators of SALD, for example, combine and synthesise hydrograph information collected by multiple sources at multiple locations in an electronic database (Superintendent of Marine Operations - Western Region, personal communication, April 22, 2010). Not only can the water level indicator report on levels over one year, but it can also demonstrate trends and changes in water levels over time. A second functional indicator of dam performance that should be included in an EASS performance monitoring policy is the number of days a dam’s doors, gates and/or curtains
10 Though the official role of EASS’s dams is to maintain water levels for the purposes of commercial navigation, the steady water levels create other benefits (such as less dramatic lake front property fluctuations or flood prevention). However, it is important to note any water level regulation for non-navigational purposes is outside of the department’s mandate.

Coupé 32
are able to be operated, and thus exert some control over water levels. When there is ice on the river, several of EASS’s dams cease to be able to open/close their water control mechanisms (Project Manager - Ontario Region, personal communication, April 26, 2010). As such, the length of time these mechanisms are in operation each year reflects the length of time a dam can successfully react to changes in water levels. With climate change and increasingly erratic weather patterns, this indicator has even more importance. This indicator could be easily monitored by dam operators recording the date when the mechanisms were removed (or rendered immobile), and the date that they were put back into operation. Operational Performance As EASS’s dams are not used for producing hydroelectric power (with the notable exception of Rideau Falls), water flow is not as important a functional factor to monitor as water level. However, water flow should be monitored for its ability to provide useful information about a dam’s environmental performance. There are standards in place about how much river flow is required for certain fish to live in and travel through (Project Manager - Ontario Region, personal communication, April 26, 2010). To help ensure that PWGSC’s dams meet these requirements, monitoring the number of times river flow dropped below the required level should be recorded. Physical Condition Performance PWGSC’s dams are inspected according to standards set by the Canadian Dam Association (CDA). These standards are used across the country, address several components of a dam’s condition, and are viewed as an appropriate level of maintenance for EASS’s dams (Senior Engineer, Marine Structures, personal communication, April 14, 2010). Monitoring compliance levels with relevant CDA standards would provide a useful indicator on dam condition.
5.2.4. Bridge Indicators Functional Performance Just as water levels are the main functional outcome of dams, traffic flow is the main functional outcome of a bridge. Monitoring the number of vehicles that use a bridge on a daily basis is an effective indicator for monitoring traffic flow. If the indicator can include information not only on the number of vehicles using the bridge, but also the types of vehicle traffic (as a proportion of the total traffic), it will be even more informative. Though PWGSC does not directly monitor traffic levels over its bridges, other jurisdictions that manage the transportation infrastructure on either side of the bridge do. Typically this information is willingly shared (sometimes for a small fee) with PWGSC when it is requested (Bridge Expert - CoE, personal communication, April 30, 2010). PWGSC can collect this information, input it into a database and report on observations. Using traffic flow as a performance indicator will also help bridge

Coupé 33
operators and managers to view bridges as part of the wider road system, rather than as isolated structures. Snow and ice can slow or stop traffic flow over a bridge as well as causing potential safety hazards for drivers. An indicator of how well a bridge addresses the issue of snow and ice should be included in EASS’s performance monitoring policy. One of the indicators discussed by NCHRP in its Performance Measures for Snow and Ice Control Operations document is monitoring the time it takes to get a road or bridge to return to a “reasonably near-normal winter condition.” (2009, p.3) In order to be effective, a definition of what is considered an “acceptable condition” for each bridge should be clearly stated. Snow/ice clearing times can easily be compared both over time and with other jurisdictions. However, the monitoring of clearing times may be difficult, especially if contractors do not adequately report their performance (Performance Management Team Lead, Ontario Ministry of Transportation - personal conversation, April 29, 2010). EASS’s bridge portfolio includes two lift bridges, which are raised to facilitate commercial and recreational boating. These bridges have the added function of facilitating ship traffic as well as vehicle traffic. A useful indicator for monitoring this function would be the number of times that the bridge had failed to rise or descend when needed (Project Manager - Ontario Region, personal communication, April 26, 2010). This indicator should not only include the number of failures, but also the lengths of time the bridge was out of service, and the cause for the failure. This indicator could be easily monitored by bridge operators. Operational Performance In terms of health and safety, an effective outcome indicator would be the number of traffic accidents that occur on the bridge. This indicator should include information about the cause for the incident, its severity and the amount of time that it put the bridge out of service. Though this information would probably be onerous for PWGSC officials to monitor directly, the police or responsible ministry of transportation likely records the needed information, which can easily be compiled and analysed by PWGSC. As this is an outcome measure, it must be acknowledged that other factors can impact the number of traffic accidents, beyond the bridge. It may also be useful to monitor the number non-traffic incidents (cyclist/pedestrian crashes, vandalism etc) as deemed useful. An effective safety indicator specifically for lift bridges would be the number of “close calls” where a bridge is not raised before a ship reaches a “safe” distance. A standard is currently in place stating how close a ship can be to a lowered bridge to be considered safe (Project Manager - Ontario Region, personal communication, April 26, 2010). Physical Condition Based on regular, comprehensive inspections, PWGSC rates the condition of its bridges using the Bridge Condition Index (BCI). As rating covers all aspects of a bridge

Coupé 34
condition (both above and below the water), it is an effective, comprehensive indicator. A low BCI rating would indicate poor condition performance, while a high rating would indicate good performance (A/Director, EAS, personal communication, April 16, 2010). This indicator also gives decision makers an easy to understand depiction of the condition of all of the bridges across the portfolio. At least six jurisdictions across Canada (including BC, Alberta and Ontario) also use the BCI to rate the performance of their bridges, this indicator could be easily used to compare EASS’s performance to other jurisdictions (TAC, 2006). Also, as this indicator is primarily monitored by external contractors, there is little chance that it would be manipulated to bias a favourable outcome.
5.2.5. Road Indicators Financial Condition As a measure of funding efficiency, monitoring the funding spent on the road per kilometre per year would suit EASS’s needs. This indicator is already monitored on the Alaska Highway using GIS systems. This indicator is somewhat comparable to other jurisdictions; however, geographic differences should be taken into account when making these comparisons. To add more nuance to dollars-spent-per-kilometre-indicator, asset operators could also record the type of project being undertaken. This would refine comparisons, allowing construction and maintenance projects to be compared with like endeavours. Functional Condition A traffic flow indicator would be similar to the one described in the bridge section. In the case of the Alaska Highway, it is even more important to monitor the amounts of different vehicle types as the highway is a key corridor for the oil and gas industry. Traffic flows, with a breakdown by vehicle type, are currently monitored on the Alaska Highway using electronic traffic counting stations, in a method that is standard across the transportation field (Program Director Alaska Highway, personal conversation, April 16, 2010). A snow/ice removal indicator would also be similar to the one described in the bridge section. Currently contractors are required to record the time it takes to remove snowfall, and this information could form the basis of a functional indicator. A final, functional indicator that should be included in the performance monitoring policy is a measure of the number of times one or more lanes are closed, either for construction or unplanned events. When a road is fully or partially closed, it creates a significant impact on traffic flows, and impedes the function of the asset. The BC Ministry of Transportation and Infrastructure uses this type of indicator but, to avoid counting less significant occurrences, requires that closures be longer than a half an hour before they are recorded, (TAC, 2006). PWGSC should only monitor and record lane closures of significant length for the purposes of a functional performance indicator. The required

Coupé 35
information for this indicator could likely be provided by construction contractors, for planned closures, and the police, for unplanned closures (accidents etc). Operational Performance For EASS’s roads, the number of traffic accidents should be used as a performance indicator in a similar fashion as suggested for its bridges. Currently, PWGSC performs studies using independent contractors to gather this information. However, as staff only collect this information on an accident by accident basis, it is recommended that highway officials develop an ongoing, formal request with the RCMP for the information on the number accidents, their causes and their locations on an annual basis. Physical Condition Currently PWGSC officials monitor the condition of road surfaces based on a pavement condition index (PCI) and a bituminous surface treatment condition index (BSTCI). Similar to the index used for bridges, PCI ratings are derived from several measures, such as: cracking, rutting, potholes, etc. The information for the index is collected manually by a team of road experts driving the highway (Program Director – Alaska Highway, personal communication, April 16, 2010). Currently Alaska Highway officials collect the information for the indexes once a year, and use the resulting rating to make repair/reconstruction decisions. A PCI/BSTCI rating would be a useful performance indicator to include in EASS’s performance monitoring policy. Both BC and the Yukon also use a PCI as a performance indicator, allowing it to be comparable with the jurisdictions surrounding PWGSC’s portion of the Alaska Highway (TAC, 2006). A second physical condition indicator that would provide useful information to EASS would be a rating of the road surface roughness (bumps and dips etc). The rougher the surface, the more detrimental it is to traffic. Alberta uses the international roughness indicator (IRI) using information collected annually to monitor the condition of its transportation system (TAC, 2006). PWGSC also monitors roughness annually when officials are examining other aspects of road condition. While driving the highway, the expert panel ranks the roughness of each section driven, usually in 10km partitions. Though not as sheltered from bias as the use of an electronic profilometer (which would likely involve hiring a contractor), the cost of this method is relatively low while still being viewed as effective (Program Director – Alaska Highway, personal communication, April 16, 2010). Figure 7 provides a summary of the indicators recommended in this section divided by asset type and performance facets. Appendix F includes two additional tables which summarize:
1. The feasibility of implementing each indicator
2. Who should be responsible for gathering each indicator

Coupé 36
Figure 7: Summary of Proposed Indicators
Asset Type Financial Functional Operational Physical
General (apply to all assets)
% of $ spent on maintenance compared to total funding
Public opinion/feedback (# of complaints)
Compliance with codes (H&S, environmental and heritage)
Risk Rating
% of $ spent on administration & ancillary work compared to total funding
Number of staff/contractor safety incidents
Budget vs. actual funding used
Number of environmental incidents
Dams
Water Levels Number of times flow drops below requirements for fish
# of times not in compliance with CDA standards
# of days in operation/year
Bridges
Daily traffic flows # of traffic accidents on bridge
BCI rating
Number of failures to raise/lower bridge - lift bridges only
# of non-traffic incidents
Time taken to remove snow/ice to an acceptable level
# of times ships come closer to a lowered bridge than is deemed safe
Roads
$ spent/ km rehabilitated Daily traffic flows # of traffic accidents PCI/BSTCI rating
Time taken to remove snow/ice to an acceptable level
Ride Roughness rating
# of significant lane closures
5.3 Staff and Management Buy-in According to discussions with officials, an acceptance of performance monitoring appears to already exist amongst those that are involved with the management and operation of the assets. Nearly all of the officials that were interviewed believed that performance monitoring was an important and useful tool in the effective management of the assets. At the asset management level, managers were appreciative of the information that performance monitoring could provide their decision making. At the operations level, performance monitoring was viewed as an effective medium to transfer operators’ concerns to management. In order for this universal acceptance to continue, management must demonstrate that the indicators being recorded are in fact influencing decision making. Reporting back to operations staff on how performance information was used will not only demonstrate management’s commitment to good operation of an asset but also the importance that the organization as a whole assigns to monitoring performance.

Coupé 37
6 CONCLUSION Both external asset management experts and internal PWGSC staff agree that effective performance monitoring is an important and useful endeavour. The key advantage of monitoring performance is that an organization has an established set which can be used to inform the decision-making process. This report has highlighted several likely candidates for effective financial, operational, functional and physical performance indicators. In selecting these indicators, this report paid careful attention to the costs associated with collecting performance information, and tried to strike a balance between the need for relevant information and impacts of its collection. Fortunately, through the various processes already in place, EASS is already collecting a significant amount of the data that this report has highlighted as recommended indicators. By ensuring that the collection of this information is formalized and brought under a coherent policy, EASS will be able to develop a database of performance information that can easily be accessed by decision makers.
6.1 Recommendations 1. Adoption of attached Performance Monitoring Policy
Appendix E provides a draft policy that incorporates the performance indicators set out in Section 5 of this report. It also places responsibility for the administration of the policy with the Director of EASS to ensure that the engineering asset’s performance is not lost in PWGSC’s broader asset performance monitoring. For consistency’s sake, this policy document mirrors the PWGSC Asset Performance Monitoring Policy already in place.
2. Other Indicators
Though this reports sets out a number of recommended indicators, it does not preclude the use of other indicators as well. As asset operators and managers, EASS staff may find items that should be included in a performance monitoring system, which this report did not address. The checklist in Figure 5 should be followed to ensure that any potential indicator is properly vetted.
3. Feedback
After a comprehensive performance monitoring system is in place for one year, managers and operators should discuss what worked well and what did not. Which indicators provided the most valuable information for managers (and perhaps politicians) and which indicators provided the best medium for operators to communicate their asset’s needs to managers. This feedback session will not only allow for the system to improve, but also demonstrate a commitment to the process itself.

Coupé 38
4. Study on effective performance assessment and reporting This report only covers the first stage of effective performance management. A follow-up study on how EASS could assess and report on the information gathered under a performance monitoring policy should be undertaken to ensure that the information is used ultimately to improve the service of the assets for the Canadian public.

Coupé 39
Sources: AAMCoG [Australian Asset Management Collaborative Group] (2008) Public Sector
Asset Performance Measurement and Reporting: Draft http://assetmanagementaustralia.org/PDF/AAMCoG%20Working%20Papers/CIEAM%20-%20APCC%20Assets%20Performance%20Measure.pdf
AECOM (2010) A Study on Life Cycle Cost Structures and Benchmarks (Draft) Burnaby, BC.
Alaska Department of Transportation (n.d.) Departmental Performance. Departmental Website. Accessed August 10, 2010, from http://www.gov.state.ak.us/omb/results/view_details.php?p=157.
ASCE Taskforce (2000) Guidelines for Instrumentation and Measurements for Monitoring Dam Performance. Hydro Power Committee of the Energy Division of the American Society of Civil Engineers.
Bird, S.M, et al. Performance Indicators: Good, Bad, and Ugly. Journal of the Royal Statistical Society. Series A. Statistics in society 168.1 (2005):1-27.
Bradbury, Alison (2004). “Performance Measures Critical for Business” in Road Talk. Volume 10, Issue 2. Ministry of Transportation of Ontario, St. Catharines, ON. http://www.mto.gov.on.ca/english/transtek/roadtalk/rt10-2/rt10-2.pdf
Canada: Accessed March 3, 2010 from, from the Office of the Auditor General of Canada Website:http://www.oag-bvg.gc.ca/internet/English/parl_oag_199710_11_e_8092.html
Canadian Dam Association Website (n.d.) Accessed August 03 2010, from http://www.cda.ca/cda_new_en/about%20CDA/about%20CDA.html
Canadian Water and Waste Water Association and The CWWA Water Efficiency Network (2009). Water Conservation and Efficiency Performance Measures and Benchmarks within the Municipal Sector: An identification of current practices and an assessment of the feasibility of expanding their use. Ontario Ministry of the Environment. http://www.cwwa.ca/pdf_files/Final%20Project%20Report%20MOE%20Performance%20Indicators-%202009-03-31.pdf
Chartered Accountants of Canada (2006) Statement of Recommended Practice: Public Performance Reporting.
Curt, C, Peyras, L, & Boissier, D. (2010). A Knowledge Formalization and Aggregation-Based Method for the Assessment of Dam Performance. Computer-aided civil and infrastructure engineering, 25(3), 171-.

Coupé 40
Dwyer, R J. (2009). Effectiveness Measurement: When Will We Get it Right? Journal of Economics, Finance & Administrative Science, 14(27), 63-.
Eisele, B., and Lomax, T. (2004) ODOT Operations Performance Measures: Final Report. Oregon Department of Transportation. Accessed January 15, 2010, from http://mobility.tamu.edu/resources/odot_op_perf_measures_final.pdf.
Federal Highway Administration (2002). 2002 Status of the Nation's Highways, Bridges, and Transit: Conditions& Performance. Report to Congress - Executive Summary. Accessed June 24, 2010, from http://www.fhwa.dot.gov/policy/2002cpr/pdf/execsummary_book.pdf.
Free Management Library (n.d.) Performance Management: Overall Goal and Basic Steps. Website. Accessed February 12, 2010, from http://managementhelp.org/perf_mng/overview.htm
Government of British Columbia (2002) Capital Asset Management Framework: Guidelines. http://www.fin.gov.bc.ca/tbs/camf_guidelines.pdf.
Government of Canada (May 1985) Real Property: A Study Team Report to the Task Force on Program Review
Her Majesty’s Treasury, Cabinet Office, National Audit Office, Audit Commission and Office for National Statistics (2001) Choosing the Right FABRIC: a Framework for Performance Information. London: Stationery Office. http://archive.treasury.gov.uk/performance_info/fabric.pdf
Herbel, S., Meyer, M.D., Kleiner, B., Gaines D. (2009) A Primer on Safety Performance Measures for the Transportation Planning Process. Federal Highway Administration. Accessed April 10, 2010, from http://tsp.trb.org/assets/BB_FHWA_PerformanceMeasurePrimer_Dec09_FIN.pdf.
Ittner, C D. (2008). Does measuring intangibles for management purposes improve performance? A review of the evidence. Accounting and Business Research, 38(3), 261-272.
Joseph, S W, & Harry, P H. (1992). The Case for Performance Monitoring. Public Administration Review, 52(6), 604-610.
McDavid J., & Hawthorn L.R.L. (2006). Program Evaluation and Performance Measurement: An Introduction to Practice. SAGE Publications: Thousand Oaks, California.
National Performance Review (1997) SERVING THE AMERICAN PUBLIC: Best Practices in Performance Measurement http://govinfo.library.unt.edu/npr/library/papers/benchmrk/nprbook.pdf.
Coupé 41
NCHRP (2006). Performance Measures and Targets for Transportation Asset Management. Accessed March 12, 2010, from http://onlinepubs.trb.org/onlinepubs/archive/NotesDocs/FR1_NCHRP%202060_Summary.pdf
NCHRP (2009). Research Results Digest 335: Performance Measures for Snow and Ice Control. http://onlinepubs.trb.org/onlinepubs/nchrp/nchrp_rrd_335.pdf
Office of the Auditor General (1997) Moving Toward Managing for Results (Chapter 11 in Annual Report of the Auditor General of Canada to the House of Commons). Ottawa.
Ontario Ministry of Transportation (n.d.) Bridge Condition Index. Accessed April 02, 2010, from http://www.mto.gov.on.ca/english/bridges/bci.shtml.
Poister, T. H. (2003). Measuring Performance in Public and Nonprofit Organizations (1st ed.). San Francisco: Jossey-Bass.
Poister, Theodore H. 1983 Performance monitoring / Theodore H. Poister Lexington Books, Lexington, Mass.
PWGSC (n.d.) Procedure for Assessing Data Quality Pertaining to Performance Management
PWGSC (2008) Engineering Assets Portfolio Description
PWGSC (2009) Engineering Assets Strategy Sector 2008/09 Annual report
PWGSC (2009 b). Departmental Performance Report. Accessed January 17, 2010, from http://www.tbs-sct.gc.ca/dpr-rmr/2008-2009/inst/svc/svc-eng.pdf.
RPB (December 30, 2009) Real Property Branch Asset Performance Monitoring Policy. PWGSC.
RPB [Real Property Branch] (2008) Real Property Website. PWGSC http://www.tpsgc-pwgsc.gc.ca/apropos-about/fi-fs/bi-rp-eng.html
Smith, P. (1995). Performance indicators and outcome in the public sector. Public money & management, 15(4), 13-16.
Smith, PC and M Goddard. (2002) Performance management and Operational Research: a marriage made in heaven? Journal of the Operation Research Society 53, 247-2555.
Transportation Association of Canada. (2006) Performance Measures for Road Networks: A Survey of Canadian Use. Accessed January 25, 2010, from http://206.191.29.67/english/pdf/perf-measures-0306.pdf.

Coupé 42
Transportation Research Board (n.d.) National Cooperative Highway Research Program. Webpage. Accessed April 13, 2010 from, http://www.trb.org/NCHRP/NCHRP.aspx.
Treasury Board of Canada Secretariat (n.d.) Ottawa Canada. Accessed February 13, 2010, from http://www.tbs-sct.gc.ca/pol/doc-eng.aspx?id=12042§ion=text
US GAO (1997) Business Process Reengineering Assessment Guide: Glossary http://www.gao.gov/special.pubs/bprag/bprgloss.htm
Washington State Department of Transportation. (n.d.) Bridge Ratings. Department of Transportation Web Page. Accessed April 10, 2010, from http://www.wsdot.wa.gov/Bridge/Reporting/BridgeRatings.htm.
Whitehead, J (2009). Speech to Victoria University School of Government: Michael Fowler Centre, Wellington http://www.treasury.govt.nz/publications/media-speeches/speeches/publicsectorperformance.
Williamson, R. (2006) What Gets Measured Gets Done: Are you measuring what really matters? http://www.swspitcrew.com/articles/What%20Gets%20Measured%201106.pdf
Yi-De, Liu. (2009). Implementing and Evaluating Performance Measurement Initiative in Public Leisure Facilities: An Action Research Project. Systemic Practice and Action Research, 22(1), 15-30.

Coupé 43
Appendix A: Definitions Benchmarking: comparing an asset’s performance to a set level of expected performance, usually based on industry best practices. Engineering Assets: bridges, dams, highways and other infrastructure assets operated by EASS. Performance Management: the overall system through which an organization observes, evaluates and reacts to performance according to set goals. Performance Measurement: “the process of developing measurable indicators that can be systematically tracked to assess progress made in achieving predetermined goals and using such indicators to assess progress in achieving these goals.”(US GAO, 1997) Performance Monitoring: the process of identifying and providing accurate and timely information on a specific entity or entities. Real Property: land and/or immovable improvements to the property (such as buildings), also known as real estate Recapitalization: major renovations or replacement of an asset, increasing its projected life span.

Coupé 44
Appendix B: Engineering Asset Strategy Sector’s Organizational Position
Engineering Assets Sector Strategy (EASS): Governance
Minister of PWGSC
EASS Senior Oversight Committee:Associate Deputy Minster
Assistant Deputy Minister, Real PropertyDirector General, EASS
EASS
MONITORING PERFORMANCE AGAINST TREASURY BOARD APPROVALS
Reports on :
• Funding
• Performance
• Strategy
Deputy Minister ofPWGSC
Engineering Assets Strategy Sector
REGIONS
STRATEGIC PORTFOLIO PLANNING, PROGRAM OF WORK, PERFORMANCE REPORTING
SERVICE DELIVERY AND PERFORMANCE
Treasury BoardSecretariat
Treasury Board
(source: EASS 2009/10 3rd Quarterly Report)
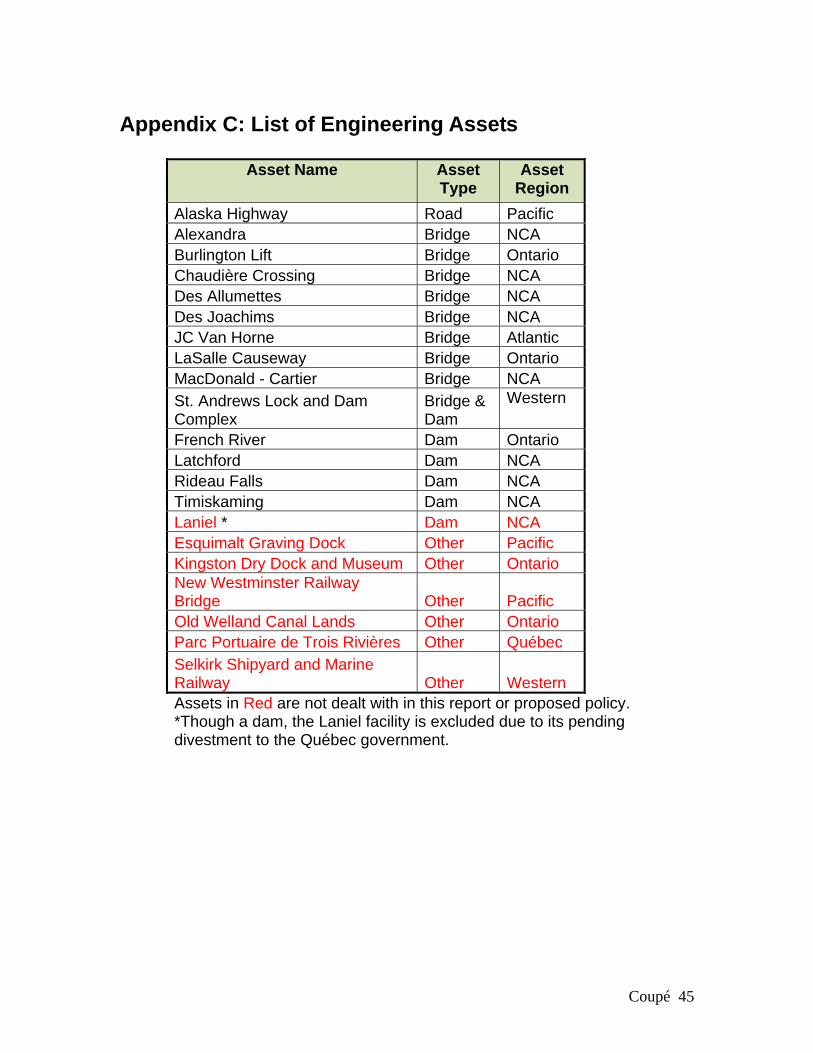
Coupé 45
Appendix C: List of Engineering Assets
Asset Name Asset Type
Asset Region
Alaska Highway Road Pacific Alexandra Bridge NCA Burlington Lift Bridge Ontario Chaudière Crossing Bridge NCA Des Allumettes Bridge NCA Des Joachims Bridge NCA JC Van Horne Bridge Atlantic LaSalle Causeway Bridge Ontario MacDonald - Cartier Bridge NCA St. Andrews Lock and Dam Complex
Bridge & Dam
Western
French River Dam Ontario Latchford Dam NCA Rideau Falls Dam NCA Timiskaming Dam NCA Laniel * Dam NCA Esquimalt Graving Dock Other Pacific Kingston Dry Dock and Museum Other Ontario New Westminster Railway Bridge Other Pacific Old Welland Canal Lands Other Ontario Parc Portuaire de Trois Rivières Other Québec Selkirk Shipyard and Marine Railway Other Western Assets in Red are not dealt with in this report or proposed policy. *Though a dam, the Laniel facility is excluded due to its pending divestment to the Québec government.

Coupé 46
Appendix D: Consultation Matrix
Consultation Report: Comments and Actions Taken
Title: Performance Monitoring of PWGSC's Engineering Assets
Date: April-May 2010
Comments - Questions and Suggestions Responses Comments are summarized and/or paraphrased
Senior Engineer, Marine Structures (Centre of Expertise) April 14 2010
Current Dam Monitoring - Dam safety reviews every 5 years - Comprehensive inspection every 4 years - Inspection policy is appropriate and matches the Canadian Dam Association’s (CDA’s) policy - No EASS dam is run remotely, operators are on site at least every 2 weeks (typically more)
Potential Performance Monitoring - Raised a concern that performance monitoring of the structure itself would be too slow to respond to issues. When something is seen to be wrong by onsite staff, it will be addressed immediately, and not wait for formal performance reporting processes. - CDA regulations provide appropriate guidelines to strive for and/or be bound by – in particular Functional and Physical performance - Risk Framework covers a good deal structural performance
Performance Measures - Water levels: an appropriate performance measure, demonstrates outcome - Adherence to worker safety codes, (specifically Canada Labour Code Part II): an appropriate performance measure - Number of incidents causing harm to the public or property: not an appropriate performance measure - Potential for serious incidents: may have some use as an indicator
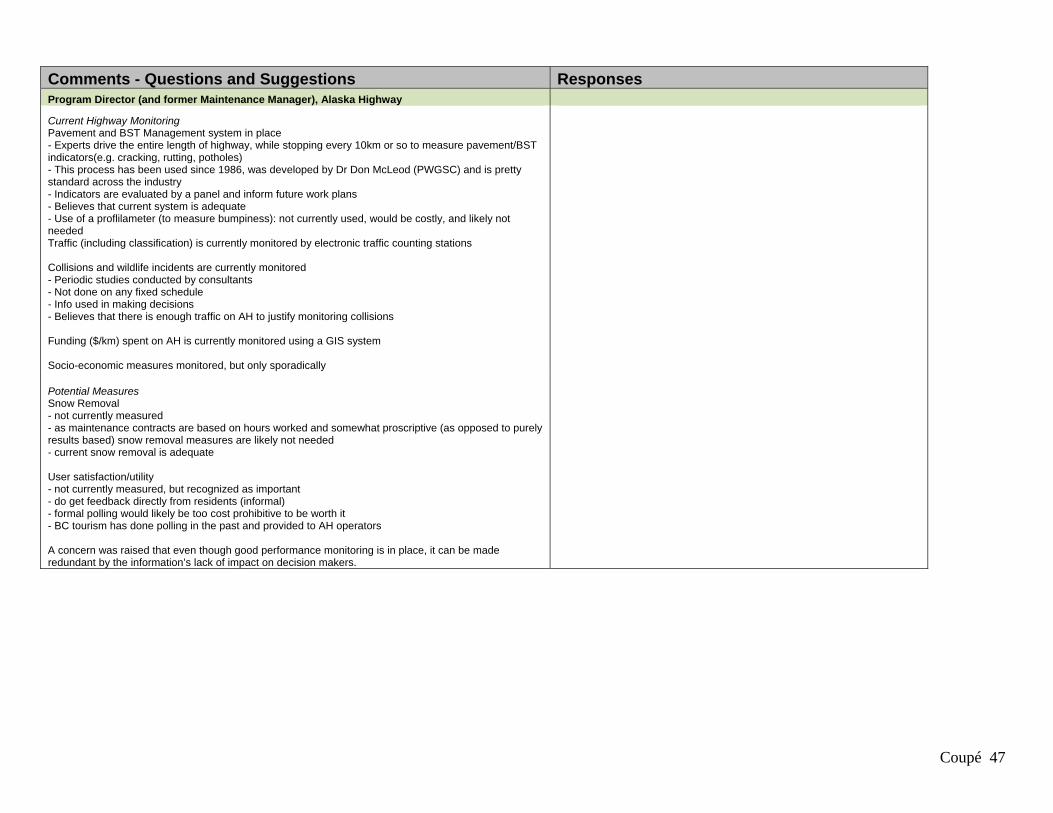
Coupé 47
Comments - Questions and Suggestions Responses Program Director (and former Maintenance Manager), Alaska Highway
Current Highway Monitoring Pavement and BST Management system in place - Experts drive the entire length of highway, while stopping every 10km or so to measure pavement/BST indicators(e.g. cracking, rutting, potholes) - This process has been used since 1986, was developed by Dr Don McLeod (PWGSC) and is pretty standard across the industry - Indicators are evaluated by a panel and inform future work plans - Believes that current system is adequate - Use of a proflilameter (to measure bumpiness): not currently used, would be costly, and likely not needed Traffic (including classification) is currently monitored by electronic traffic counting stations Collisions and wildlife incidents are currently monitored - Periodic studies conducted by consultants - Not done on any fixed schedule - Info used in making decisions - Believes that there is enough traffic on AH to justify monitoring collisions Funding ($/km) spent on AH is currently monitored using a GIS system Socio-economic measures monitored, but only sporadically
Potential Measures Snow Removal - not currently measured - as maintenance contracts are based on hours worked and somewhat proscriptive (as opposed to purely results based) snow removal measures are likely not needed - current snow removal is adequate User satisfaction/utility - not currently measured, but recognized as important - do get feedback directly from residents (informal) - formal polling would likely be too cost prohibitive to be worth it - BC tourism has done polling in the past and provided to AH operators A concern was raised that even though good performance monitoring is in place, it can be made redundant by the information’s lack of impact on decision makers.

Coupé 48
Comments - Questions and Suggestions Responses
A/Director, EAS: April 16 2010 Current Performance Monitoring EASS has limited mandate, until further direction is given by government Acknowledged the importance of monitoring performance - Use Bridge Condition Index (BCI) on EASS bridges - Inspections rate assets - Risk Framework
Possible Performance Measures - # of bridges receiving low ratings on the BCI (comparable across jurisdictions) - Risk Rating (Green, Yellow, Red) through current system (not comparable across jurisdictions - Though BCI and other technical details are included in Risk Rating, they should still be part of the performance report as they may add greater detail and are comparable - Amount of spending on an asset that is directed to preservation – this would likely be difficult to track and may make decision makers nervous but was strongly supported - Monitoring public opinion/satisfaction with assets is important, but is ultimately received though the democratic and political processes - There are reputational risks involved with monitoring the functionality of an asset - All measures will ultimately be public Performance measures should be separated out by asset class and only things that can be changed should be measured. A concern was raised as to how would a performance monitoring system meet changes in political and public expectations
Relationship between risk and performance - should be kept as separate processes, but risk info is an important component of EASS’s asset performance and should be used with other performance indicators - Risk framework includes health and safety, financial and reputational aspects - current focus on risk does not negatively impact performance

Coupé 49
Comments - Questions and Suggestions Responses
Superintendent of Marine Operations - Western Region - April 22 2010 Current Performance Monitoring - Comprehensive Inspections at St Andrews Lock and Dam (SALD) are undertaken on the bridge structure every 2 years, standard bridge inspections occur every year there is no comprehensive inspection, and underwater inspections are undertaken every four years. - Aside from structural soundness, keeping the SALD facility aesthetically pleasing to the public was cited as very important, though not formally monitored. It was suggested that both the manager and operator need to be onside in order to maintain the facility to an acceptable standard. - Site Superintendant currently monitors up-stream water levels daily at multiple locations. This provides the necessary information required to determine when to open or close the frames, or adjust the curtains on the dam. - Water level information is received from electronic hydrographs, accessed by telephone or via the internet by SALD staff , and is then input into and digitally recorded using a SALD computer program - The bridge uses BCI (Bridge Condition Index)
Possible Performance Measures (Dam) - As there is a mandate in place to manage water levels (for navigation purposes), an indicator for recording water level and its stability would be acceptable and appropriate. - A lack of funding for maintenance and aesthetics would create problems and larger funding requirements in the future. This was the case with SALD prior to 1990, where only the immediate concerns were met, and eventually a major construction project was needed to rehabilitate the bridge, dam and facility in general. As such there was some interest in having a performance measure dedicated to funding allotted for maintenance. - Safety: current codes and legislation were seen as appropriate measures. However, total reliance on codes alone may be too onerous as nonsensical requirement (eg wearing a life jacket while working on a bridge deck - while pedestrians cross the bridge freely - simply because the code states that one must wear a life jacket when working on a structure above water). - Number of safety incidents for staff would also work as a safety indicator. In the evaluation stage of this type of indicator consideration must be taken into account on the type of incidents, their causes, and response. - With regards to safety for the public and property, the number of incidents is likely too rare to be of use, but the number of close calls in addition to incidents may work. (Note that reporting close calls are a requirement of Hazardous Occurrence Reporting. Unknown when the last one was submitted.)
Possible Performance Measures (Bridge) - Aside from inspections, there is no performance monitoring on SALD’s road bridge (Inspections are the structural performance measure) - It was stated that PWGSC does not need to monitor the functional performance of the road bridge as it is not within the department’s mandate. All that is required is to provide a safe bridge.

Coupé 50
Comments - Questions and Suggestions Responses
Project Manager - Ontario Region April 26 2010
Current Performance Monitoring - Performance Monitoring is worthwhile, especially in an organization as procedurally oriented as PWGSC- French River Dams: Water levels are measured primarily downstream with one upstream via gauge stations. Flow is currently monitored - Gauges measure the water pressure against the dams - A safety plans is currently being developed for the dams - Safety inspections undertaken, but do not review procedures. For example, no one should work alone at the dams according to the rules, but frequently staff do. - Committee of stakeholders and Ontario Ministry of Natural Resources make decisions on when to open/close gates à PWGSC give input - Bridges: LaSalle and Burlington are lift-bridges, with unique challenges - Traffic flows examined on an ad hoc basis, when studies are requested - Traffic collisions and other accidents on the bridge are currently recorded A concern was raised about the long term maintenance of the assets, and the problems that the current crises oriented environment creates.
Possible Performance Measures (Dam) - Was open to an indicator based on percentage of funding spent on maintenance, but cautioned that it could be risky. Suggested instead to measure minor capital funding - Supported monitoring water levels - A concern was raised that the dam was not able to be operated year round due to ice build up. An indicator monitoring how many days a dam was able to be operated (opening and closing gates) was supported. - Safety: More constant safety monitoring would be useful. Any safety measure would have to be independently monitored to achieve accurate information. Monitoring relevant code compliance and safety incidents = acceptable indicators. - Major incidents and close calls (public/property safety) are rare and may not be the best indicator. Also a fear was raised that not all “close calls” would be reported by staff.
Possible Performance Measures (Bridge) - Raising/Lowering speed would not be an efficient indicator, as it is not a concern of public/operators. The number of times a bridge has failed to lift, the number of total lifts, and cost/lift would be useful measures. Failures do happen and there are major risks involved (shipping contract). - Close calls for lift bridges à if a ship gets too close, possible indicator - Traffic collisions, and pedestrian/cyclist incidents - Regularly monitoring traffic flows over bridge would be useful, and likely cheaper than relying on constant studies - Monitoring # of staff operating assets would be useful and comparable efficiency indicator - Gauging public opinion worthwhile, but statistically tricky

Coupé 51
Comments - Questions and Suggestions Responses
Business Analyst - Atlantic Region April 27, 2010
Current Performance Monitoring - The importance of Performance Monitoring (PM) was recognized - Regular inspections based on established standards currently provide physical condition information - Financial information already recorded - Traffic flows are currently monitored, but by provincial government - Environmental monitoring done every few years through a thorough environmental assessment PM is only one part of what the organization must do to be good stewards. Common sense is integral to success.
Possible Performance Measures - Regular traffic flow monitoring less relevant for JC Van Horne Bridge, as it has a relatively low traffic volume and is in a rural location. - Number of traffic incidents would be a useful measure. Providing info on the causes of crashes may be useful, but may also be onerous to collect - Monitoring the time to remove snow/ice from the bridge deck may provide some useful information, but will likely be cost prohibitive - Monitoring public opinion would be useful. It could be done by having signs with a contact number on or near the bridge, asking for the public’s feedback on the asset - A simple “asset up to environmental codes” would not be very effective. Instead it would need to be more detailed - Monitoring the amount of funding allocated to maintenance vs. capital projects would be problematic as there exists a sizable grey area between the two concepts.
EASS Financial Analyst May 04 2010
Current performance Monitoring - EAMPS provide funding plans for 5-10+ years; BMPs provide funding plans for the less years, but greater detail. - Monthly reporting provided to EASS headquarters monthly - Currently have 5 years of historical cost information - How much funding is lapsed per year is currently monitored and reported on - Banking days provides an opportunity to move funding around to different assets/projects. It is rare that additional $ will be committed to O&M projects - The difference between budgeted amounts and actual amounts are currently monitored - HR costs are budgeted comparably with industry - It was highlighted that good stewardship must be kept in mind, not just cost efficiency.
Potential Performance Measures - Historical costs could provide several performance measures: How much was spent and on what, HR costs, admin vs. construction costs, maintenance funding vs capital funding per asset) - Monitoring how effective planning was compared to actual funding used should be included - Monthly financial performance reports extremely important

Coupé 52
Comments - Questions and Suggestions Responses
Bridge Expert - CoE April 30 2010
Current Performance Monitoring - PM is important as it helps to show how an assets meets a public need - Informal monitoring in trying to minimize operational deficiencies (which are included in inspection report) - Often work is done at night to minimize the operational deficiency of a bridge repair project - Weekly safety inspections checking operational performance - Many aspects of the environment that the NCA bridges are situated in that impact the performance of the bridge (such as traffic lights and urban congestion) - Traffic flows are not monitored directly. Instead they are monitored by the cities or provinces on either side of the bridges. Information is provided about the types of vehicles (trucks vs. cars) and pedestrians/cyclists. A fee is attached to this data for the urban NCA bridges (none for the rural ones) of around $400. Usually this info is requested by PWGSC once a year. - It was stated that 80% of PWGSC’s job is to keep the bridge sage - Public opinion is collected through the National service call centre, where the public can call in to a number à usually on signs when projects are undertaken. Very few calls are made - The number of accidents is not currently monitored on the bridges. However (on the urban bridges) the municipalities do (as well as monitoring fights, drug users, and vandalism). It is unknown what the police monitor on the rural bridges. - Health and Safety: Contractors must provide health and safety plans which is verified by - Bridge condition rating based on the bridge inspection manual, with inspections undertaken every 2 years.
Possible Performance Measures - The amount of time a bridge is out of service could be a good performance measure. However the time of day would need to be considered as a delay during peak travelling times would obviously cause more disruption then during the night. - Records could be kept of the traffic flow data collected from other jurisdictions - Could monitor the number of complaints to the national service call centre - Records could be kept of the # of incidents that occur on the bridges based on local government/police monitoring - Monitoring all of the traffic backups would be too onerous to be useful and effective. - Could monitor the number of times that the contractor fails to meet health and safety plan - It would be important to monitor safety incidents, but this would be difficult. Recoridng the lack of safety incidents would help when management is involved to show the bigger picture, especially if there is a major incident, officials can point to the safety record leading up to the event - The number of media requests about any given asset is a possible indicator, but would only give partial data. - Regular socio-economic monitoring not needed - Possible environmental measures: up to environmental codes (y/n) and # of incidents (spills, debris in the river). These would not be difficult to monitor

Coupé 53
Appendix E: Recommended Policy Document Title: Engineering Asset Performance Monitoring Policy 1. Effective Date XX/XX/2011 2. Cancellations N/A 3. Authority This Policy is issued under the Authority of the Assistant Deputy Minister (ADM) Real Property Branch (RPB), Public Works and Government Services Canada (PWGSC). 4. Context The Engineering Asset Performance Monitoring Policy is established to complement the Real Property Branch Performance Monitoring Policy by providing guidelines for monitoring the performance of the previously excluded engineering assets (bridges, dams and highways). 5. Policy Statement RPB will take a systemic approach to monitoring four facets of the performance of the engineering assets: Financial, Operational, Functional, and Physical. The objective of this policy is to provide accurate and timely information on the performance of bridges, dams and highway assets; to the extent that data is available and meaningful conclusions can be drawn. This will assist RPB staff in recognizing substandard asset performance and performance trends requiring remedial action and facilitate reporting and performance measurement at the program level. In addition, the Engineering Asset Strategy Sector (EASS) will use this information to shape the direction of the Engineering Asset portfolio. 6. Policy Details Financial Performance EASS will annually report on the financial performance of PWGSC owned bridges, dams and highways. EASS will monitor, on an asset by asset basis, the proportion of total asset funding spent on maintenance, the proportion of total asset funding spent on administration, and proportion of budget costs compared to actual costs for all engineering assets. These indicators will be evaluated for alignment with strategies for each asset class. For highway assets, EASS will also monitor the funding spent on rehabilitation and maintenance projects per kilometre of roadway rehabilitated/maintained.

Coupé 54
Operational Performance For all engineering assets EASS will monitor, on an asset by asset basis: compliance with relevant health and safety, environmental and heritage codes; the number and severity of staff/contractor injuries that occur on, or in relation to, an asset; and the number and severity of environmental incidents occurring as a result of asset use, operation or rehabilitation. For dam assets, EASS will monitor the number of times water flow drops below required levels for applicable fish species. For bridge assets, EASS will monitor the number of traffic accidents on the bridge, the number of non-traffic accidents on or in relation to the bridge and, if a lift bridge, the number of times marine traffic has been within an unsafe distance of a lowered bridge. For highway assets, EASS will monitor the number, severity, and location of traffic accidents on the highway. Functional Performance EASS will monitor, on an asset by asset basis, the number of complaints made (both directly to the asset operators and through the National Service Call Centre) for all engineering assets. For dam assets, EASS will monitor water levels in relevant areas and the number of days/year the active components (such as gates) of a dam are in operation. For bridge assets, EASS will monitor the number and types of vehicles travelling across the bridge, the number of times snow and ice are not cleared off bridge decks in an acceptable time-frame and, for lift bridges, the number of times a lift bridge fails to raise or lower. For highway assets, EASS will monitor number and types of vehicles travelling on the highway, the number of times snow and ice are not cleared off the road in an acceptable time-frame and the number of significant lane closures. Physical Performance EASS will include an asset’s risk rating, derived under EASS’s risk framework, as the primary indicator of physical performance. EASS will also monitor each asset’s performance based on physical ratings derived through professionally accepted assessment tools.
Dams: Compliance with applicable Canadian Dam Association (CDA) standards, Bridges: Bridge Condition Index ratings, and Highways: Pavement and Bituminous Surface Treatment Index ratings and ride-
roughness ratings will be monitored. All performance information gathered under the processes described in this section will be reported at minimum, annually. 7. Scope This Policy applies to only bridges, dams and highways owned by PWGSC. It excludes other, more specialized and unique engineering assets.

Coupé 55
Due to the geographic distribution and varying governance structures of the engineering assets, some flexibility is required for the roles, responsibilities and information systems used to monitor all assets. PWGSC, RPB and EASS are continually evaluating performance measurement criteria to apply to each asset class. Performance indicators will be introduced where practical and meaningful to do so, to ensure alignment with the established strategies that are currently being developed for the engineering assets. 8. Responsibilities The Director General of the Engineering Asset Strategy Sector is responsible for amalgamating performance information, reporting on asset and portfolio performance, monitoring and reporting on overall compliance with the policy and ensuring that this policy is implemented. The Regional Asset Managers operating PWGSC’s engineering assets are responsible for gathering performance information and submitting it to the Director General of the Engineering on an annual basis. 9. References Legislation
Federal Real Property and Federal Immovables Act Federal Real Property Regulations
Treasury Board Policies
Management Accountability Framework – Area of Management 14 (Effective Asset Management)
Policy on the Management of Real Property Guide to the Management of Real Property
PWGSC Policies
Real Property Branch Asset Performance Monitoring Policy Engineering Asset Management Plan Policy Real Property Branch Risk Management Framework
10. Enquiries Enquiries regarding the Asset Performance Monitoring Policy should be directed to the Director General of the Engineering Asset Strategy Sector.

Coupé 56
Appendix F: Additional Asset Indicator Tables Indicator Collection Responsibility
Asset Type
Financial Functional Operational Physical
Indicator Responsible Indicator Responsible Indicator Responsible Indicator Responsible
General (apply to all
assets)
% of $ spent on maintenance compared to total funding
EASS Financial Analyst
Public opinion/feedback (# of complaints)
Operator / National call centre
Compliance with codes (H&S, environmental and heritage)
Operator / inspectors
Risk Rating / where the asset is in its lifecycle
EASS HQ
% of $ spent on administration & ancillary work compared to total funding
EASS Financial Analyst
Number of staff/contractor safety incidents
Operator / contractor
Budget vs. actual funding used
EASS Financial Analyst
Number of environmental incidents
Operator / contractor
Dams
Water Levels Operator / other jurisdictions
Number of times flow drops below requirements for fish
Operator # of times not in compliance with CDA standards
Operator / inspector
# of days in operation/year
Operator
Bridges
Daily traffic flows Operator / Province Min.
# of traffic accidents on bridge
Operator / Police BCI rating Operator / inspector
Number of failures to raise/lower bridge - lift bridges only
Operator # of non-traffic incidents
Operator / Police
Time taken to remove snow/ice to an acceptable level
Operator / contractor
# of times ships come closer to a lowered bridge than is deemed safe
Operator
Road
$ spent/ km rehabilitated
Operator Daily traffic flows Operator # of traffic accidents
Operator / Police PCI/BSTCI rating Operator
Time taken to remove snow/ice to an acceptable level
Operator / contractor
Ride Roughness rating
Operator
# of significant lane closures
Operator / contractor

Coupé 57
Recommended Indicators Feasibility Feasibility Rating Easy Medium Difficult
Asset Type
Financial Functional Operational Physical
Indicator Feasibility Indicator Feasibility Indicator Feasibility Indicator Feasibility
General (apply to all
assets)
% of $ spent on maintenance compared to total funding
Currently monitored / easy to report
Public opinion/feedback (# of complaints)
Must collaborate with national call centre service and set up data-base
Compliance with codes (H&S, environmental and heritage)
Monitored through inspections / needs to be formalized
Risk Rating / where the asset is in its lifecycle
Currently monitored / easy to report
% of $ spent on administration & ancillary work compared to total funding
Currently monitored Must classify what is administration / ancillary
Number of staff/contractor safety incidents
Somewhat monitored / will require some self reporting
Budget vs. actual funding used
Currently monitored / easy to report
Number of environmental incidents
requires consultants to self-report
Dams
Water Levels Currently monitored - must be formalized to be recorded
Number of times flow drops below requirements for fish
Requires greater knowledge on fish regulations (DFO)
# of times not in compliance with CDA standards
Currently monitored / less uniform than other indexes
# of days in operation/year
easy to monitor / record
Bridges
Daily traffic flows may require collaboration with provincial agencies
# of traffic accidents on bridge
Requires coordination with police
BCI rating Currently monitored / easy to report
Number of failures to raise/lower bridge - lift bridges only
easy to monitor / record
# of non-traffic incidents
Requires coordination with police
Time taken to remove snow/ice to an acceptable level
requires consultants to self-report
# of times ships come closer to a lowered bridge than is deemed safe
easy to monitor / record
Road
$ spent/ km rehabilitated
Currently monitored / easy to report
Daily traffic flows may require collaboration with provincial agencies
# of traffic accidents
Requires coordination with police
PCI/BSTCI rating Currently monitored / easy to report
Time taken to remove snow/ice to an acceptable level
requires consultants to self-report
Ride Roughness rating
Currently monitored / easy to report
# of significant lane closures
harder to monitor / must define significant