performance improvement plans - ppa
TRANSCRIPT
Performance Improvement Plans
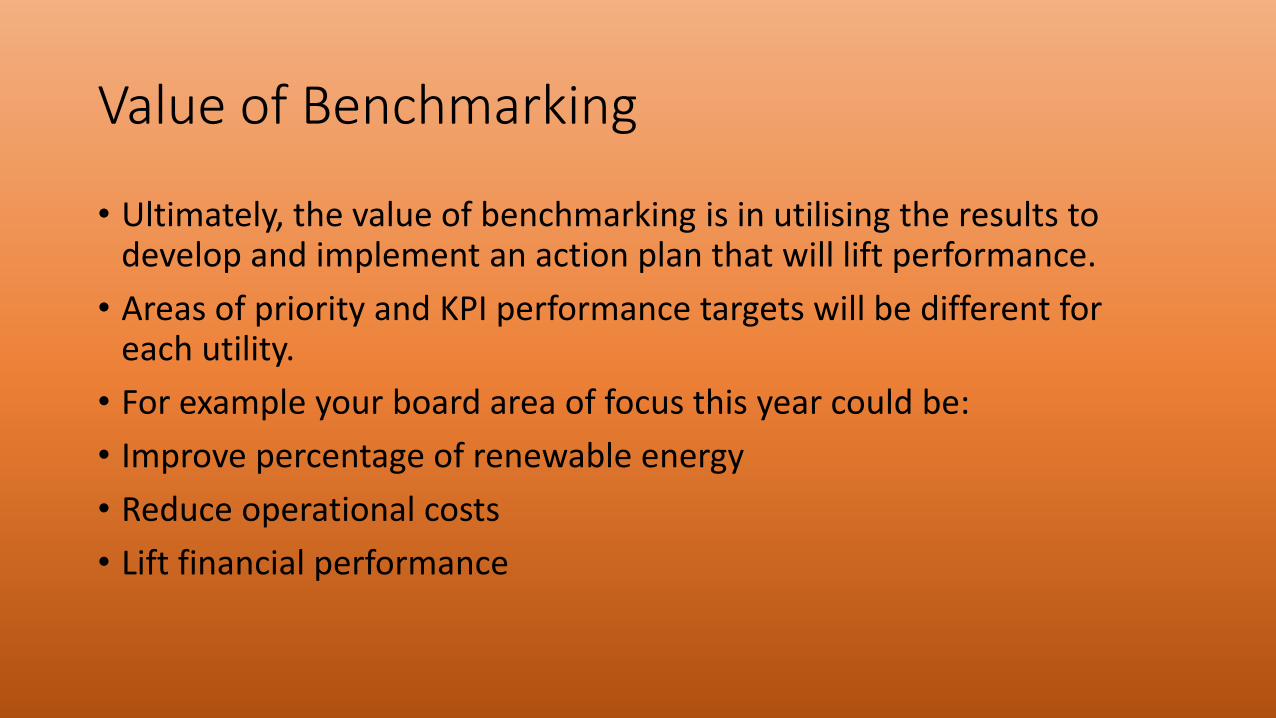
Value of Benchmarking
• Ultimately, the value of benchmarking is in utilising the results to develop and implement an action plan that will lift performance.
• Areas of priority and KPI performance targets will be different for each utility.
• For example your board area of focus this year could be:
• Improve percentage of renewable energy
• Reduce operational costs
• Lift financial performance
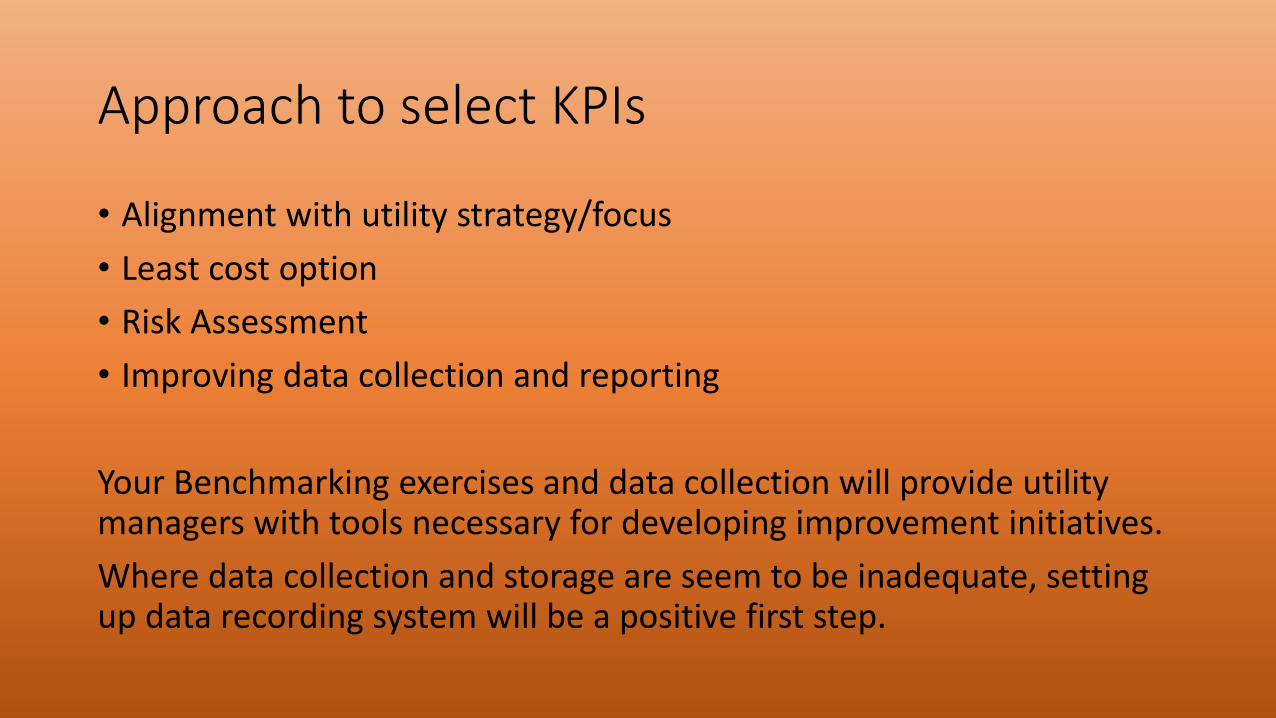
Approach to select KPIs
• Alignment with utility strategy/focus
• Least cost option
• Risk Assessment
• Improving data collection and reporting
Your Benchmarking exercises and data collection will provide utility managers with tools necessary for developing improvement initiatives.
Where data collection and storage are seem to be inadequate, setting up data recording system will be a positive first step.
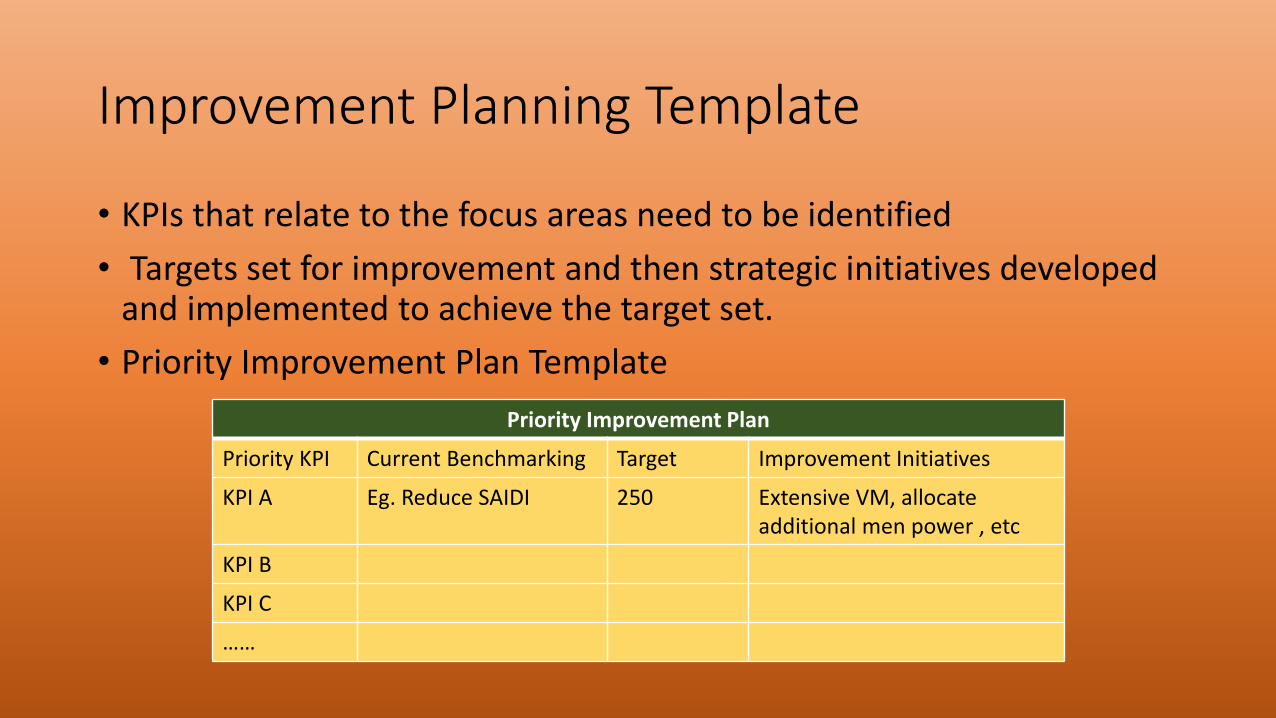
Improvement Planning Template
• KPIs that relate to the focus areas need to be identified
• Targets set for improvement and then strategic initiatives developed and implemented to achieve the target set.
• Priority Improvement Plan Template
Priority Improvement Plan
Priority KPI Current Benchmarking Target Improvement Initiatives
KPI A Eg. Reduce SAIDI 250 Extensive VM, allocateadditional men power , etc
KPI B
KPI C
……
Examples of Improvement
• Each utility will need to consider the initiatives that will best address the KPIs they are targeting within their own context.
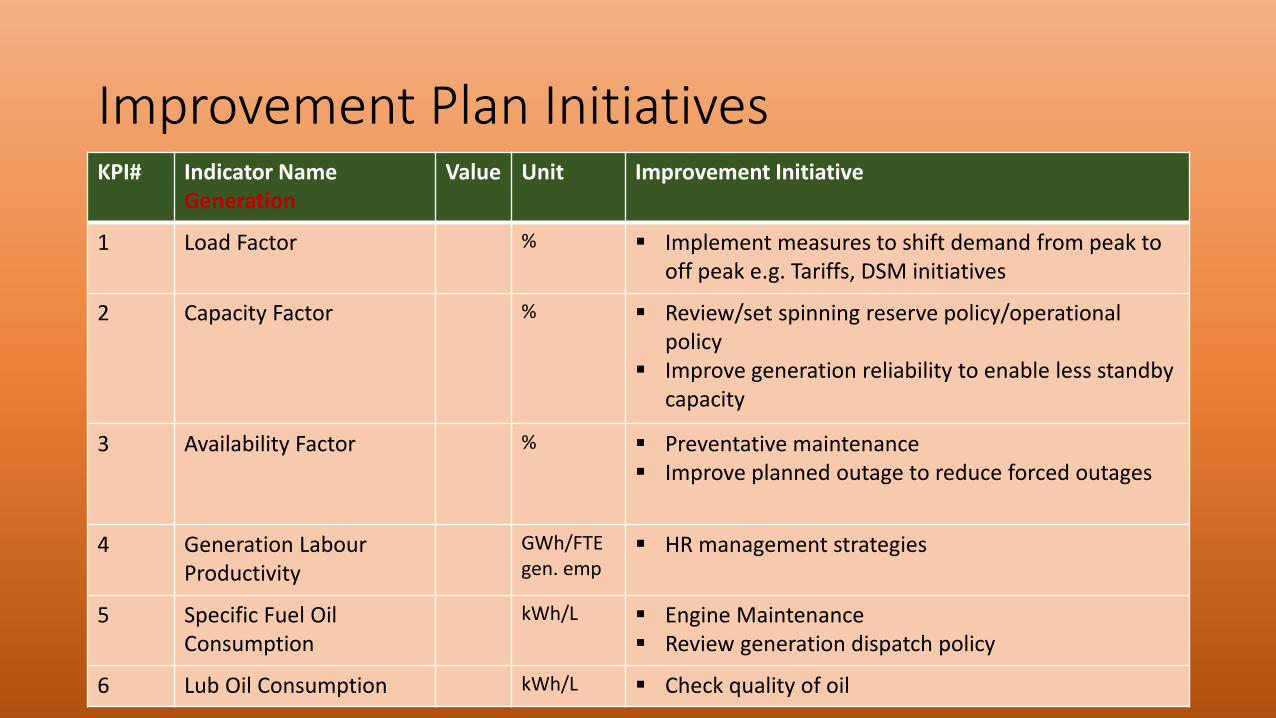
Improvement Plan InitiativesKPI# Indicator Name
GenerationValue Unit Improvement Initiative
1 Load Factor % Implement measures to shift demand from peak to off peak e.g. Tariffs, DSM initiatives
2 Capacity Factor % Review/set spinning reserve policy/operational policy
Improve generation reliability to enable less standby capacity
3 Availability Factor % Preventative maintenance Improve planned outage to reduce forced outages
4 Generation Labour Productivity
GWh/FTE gen. emp
HR management strategies
5 Specific Fuel Oil Consumption
kWh/L Engine Maintenance Review generation dispatch policy
6 Lub Oil Consumption kWh/L Check quality of oil
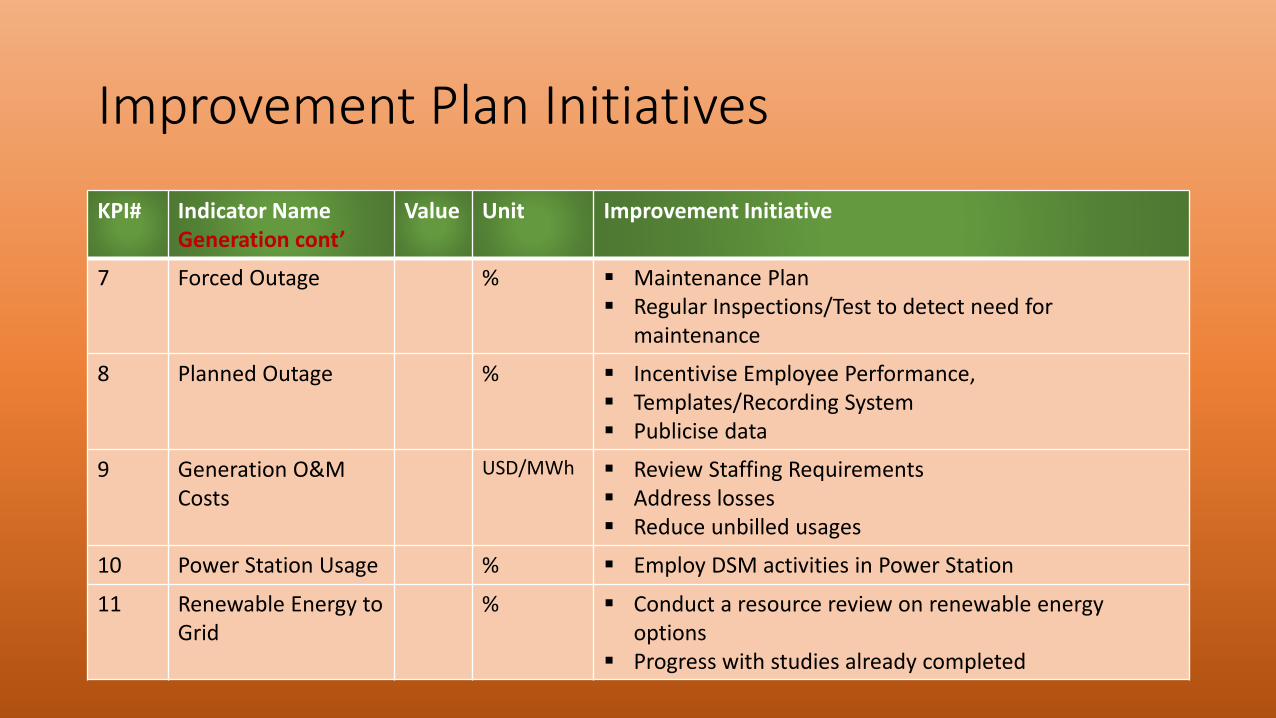
Improvement Plan Initiatives
KPI# Indicator NameGeneration cont’
Value Unit Improvement Initiative
7 Forced Outage % Maintenance Plan Regular Inspections/Test to detect need for
maintenance
8 Planned Outage % Incentivise Employee Performance, Templates/Recording System Publicise data
9 Generation O&M Costs
USD/MWh Review Staffing Requirements Address losses Reduce unbilled usages
10 Power Station Usage % Employ DSM activities in Power Station
11 Renewable Energy to Grid
% Conduct a resource review on renewable energy options
Progress with studies already completed
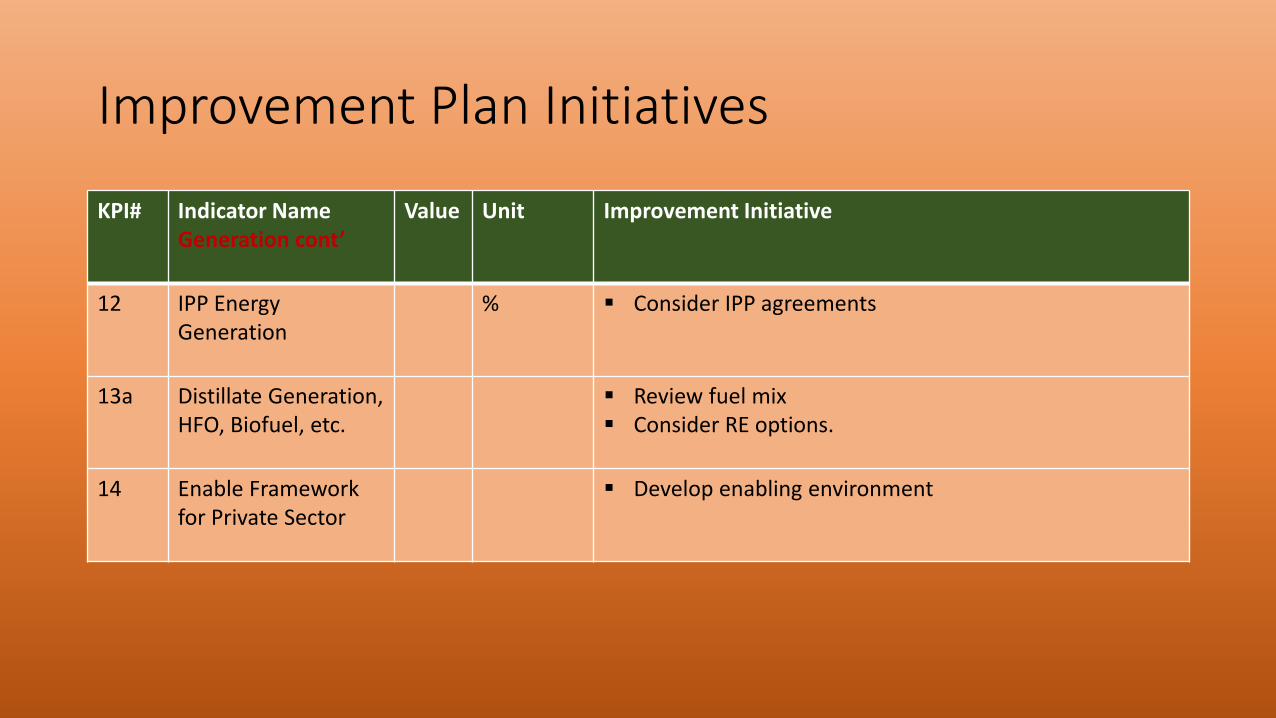
Improvement Plan Initiatives
KPI# Indicator NameGeneration cont’
Value Unit Improvement Initiative
12 IPP Energy Generation
% Consider IPP agreements
13a Distillate Generation, HFO, Biofuel, etc.
Review fuel mix Consider RE options.
14 Enable Framework for Private Sector
Develop enabling environment
Improvement Plan Initiatives
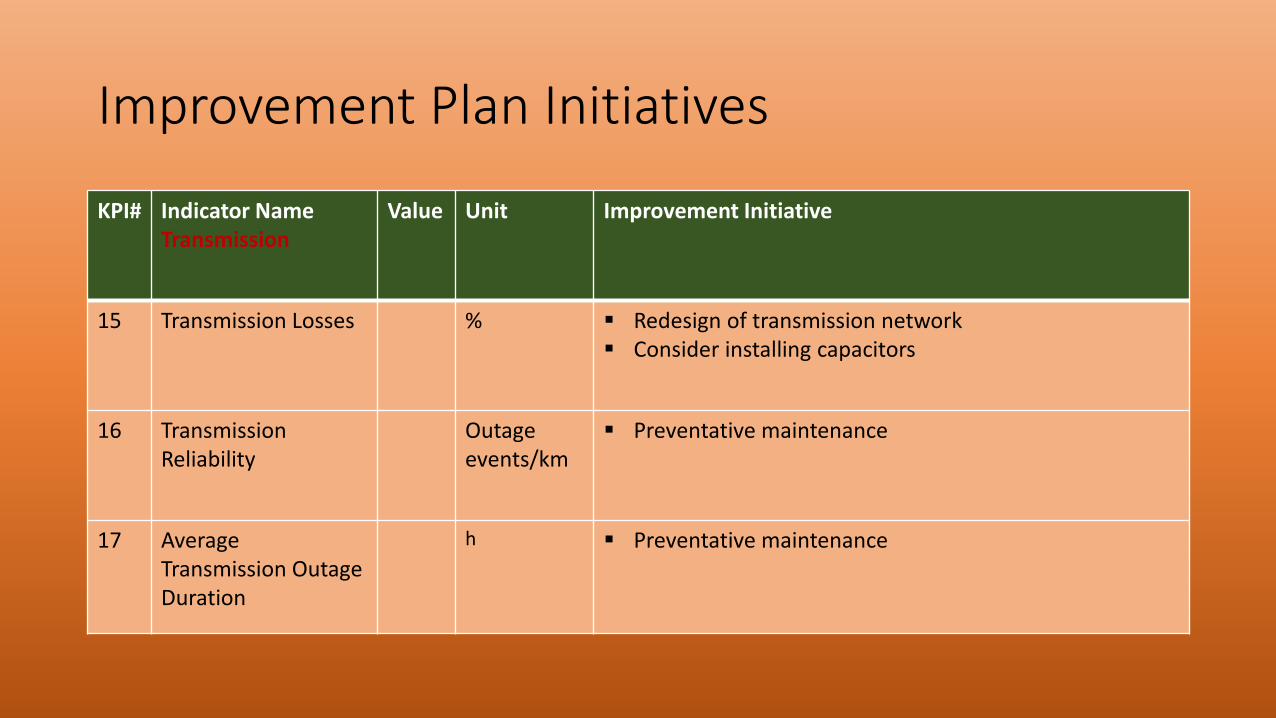
KPI# Indicator NameTransmission
Value Unit Improvement Initiative
15 Transmission Losses % Redesign of transmission network Consider installing capacitors
16 TransmissionReliability
Outageevents/km
Preventative maintenance
17 Average Transmission Outage Duration
h Preventative maintenance
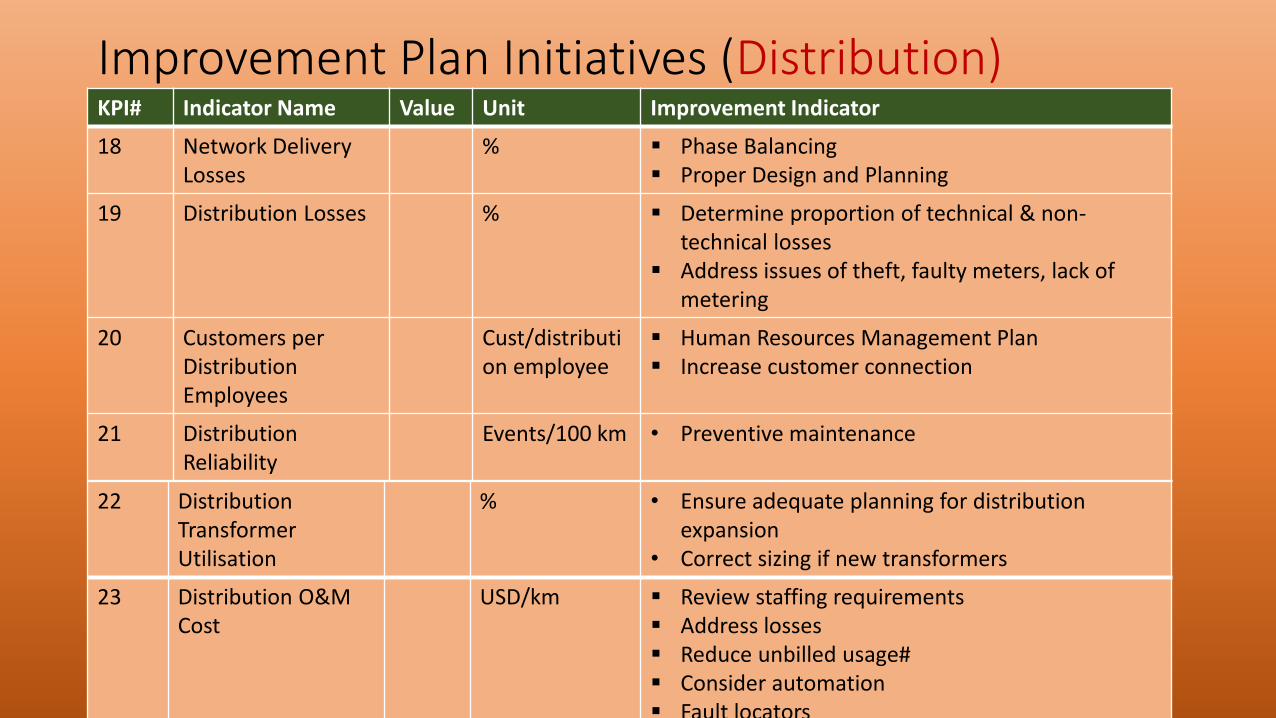
Improvement Plan Initiatives (Distribution)KPI# Indicator Name Value Unit Improvement Indicator
18 Network Delivery Losses
% Phase Balancing Proper Design and Planning
19 Distribution Losses % Determine proportion of technical & non-technical losses
Address issues of theft, faulty meters, lack of metering
20 Customers per Distribution Employees
Cust/distribution employee
Human Resources Management Plan Increase customer connection
21 Distribution Reliability
Events/100 km • Preventive maintenance
22 Distribution Transformer Utilisation
% • Ensure adequate planning for distribution expansion
• Correct sizing if new transformers
23 Distribution O&M Cost
USD/km Review staffing requirements Address losses Reduce unbilled usage# Consider automation Fault locators
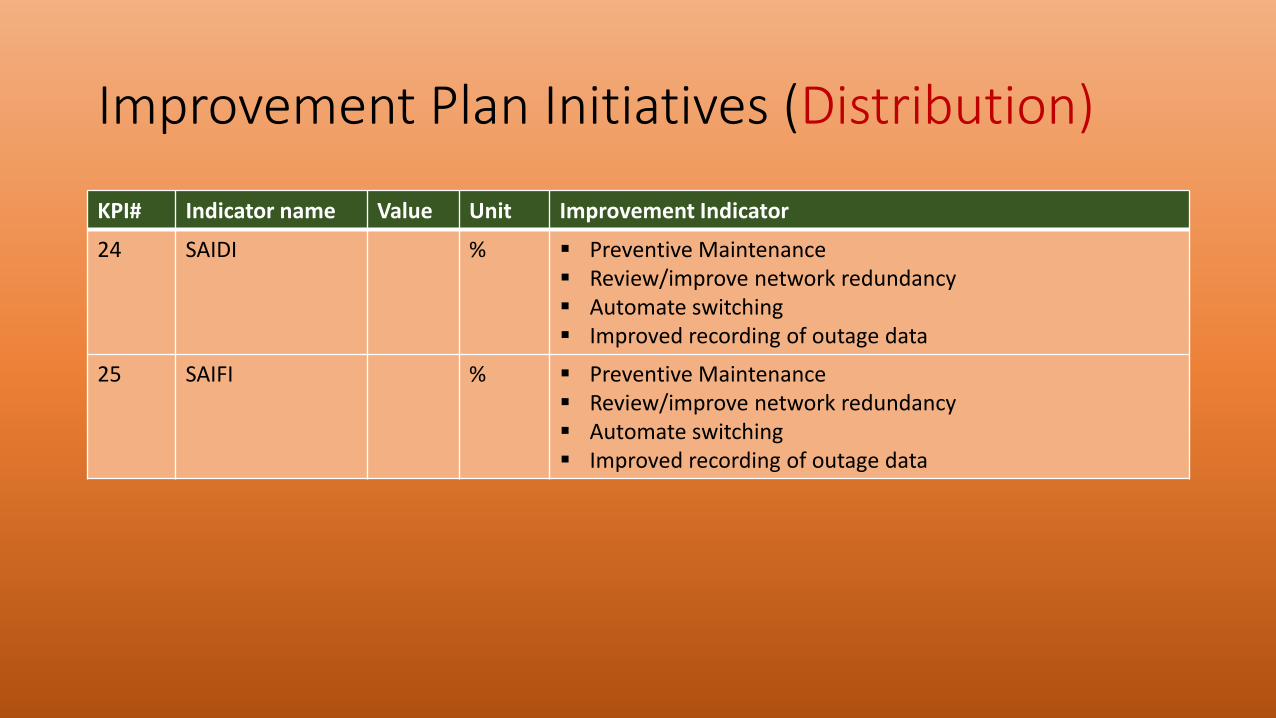
Improvement Plan Initiatives (Distribution)
KPI# Indicator name Value Unit Improvement Indicator
24 SAIDI % Preventive Maintenance Review/improve network redundancy Automate switching Improved recording of outage data
25 SAIFI % Preventive Maintenance Review/improve network redundancy Automate switching Improved recording of outage data
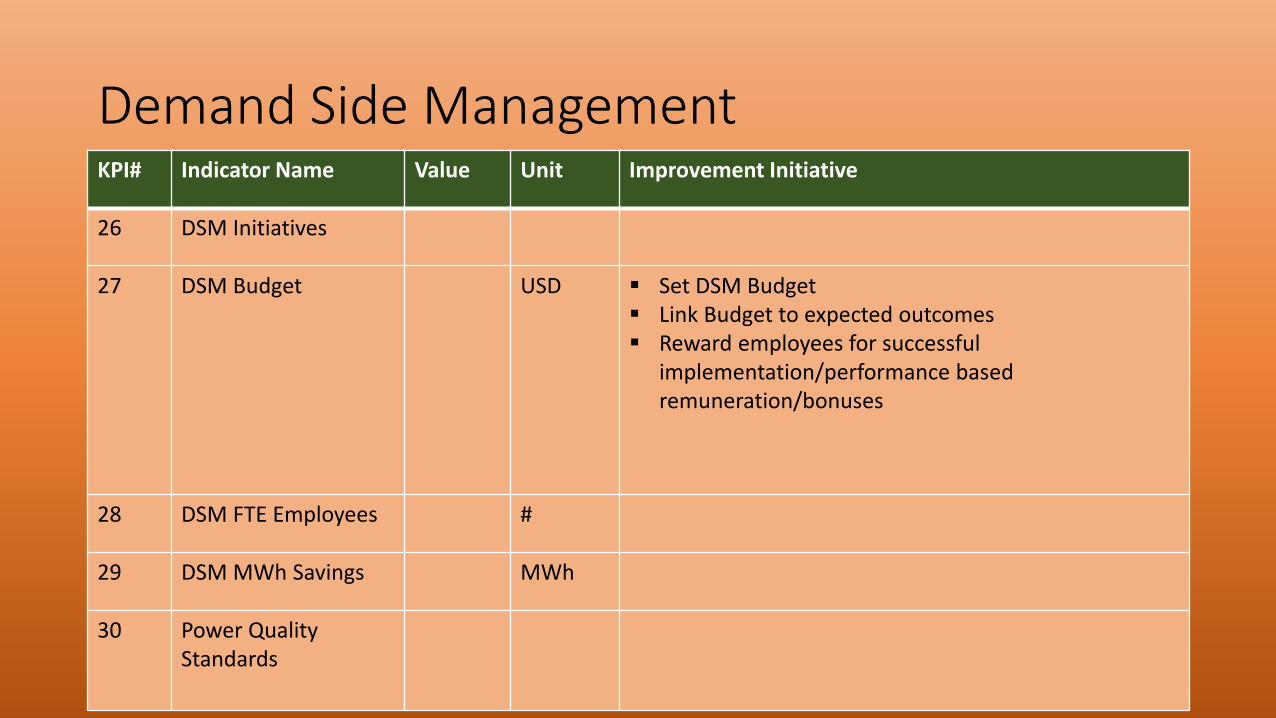
Demand Side Management KPI# Indicator Name Value Unit Improvement Initiative
26 DSM Initiatives
27 DSM Budget USD Set DSM Budget Link Budget to expected outcomes Reward employees for successful
implementation/performance based remuneration/bonuses
28 DSM FTE Employees #
29 DSM MWh Savings MWh
30 Power Quality Standards
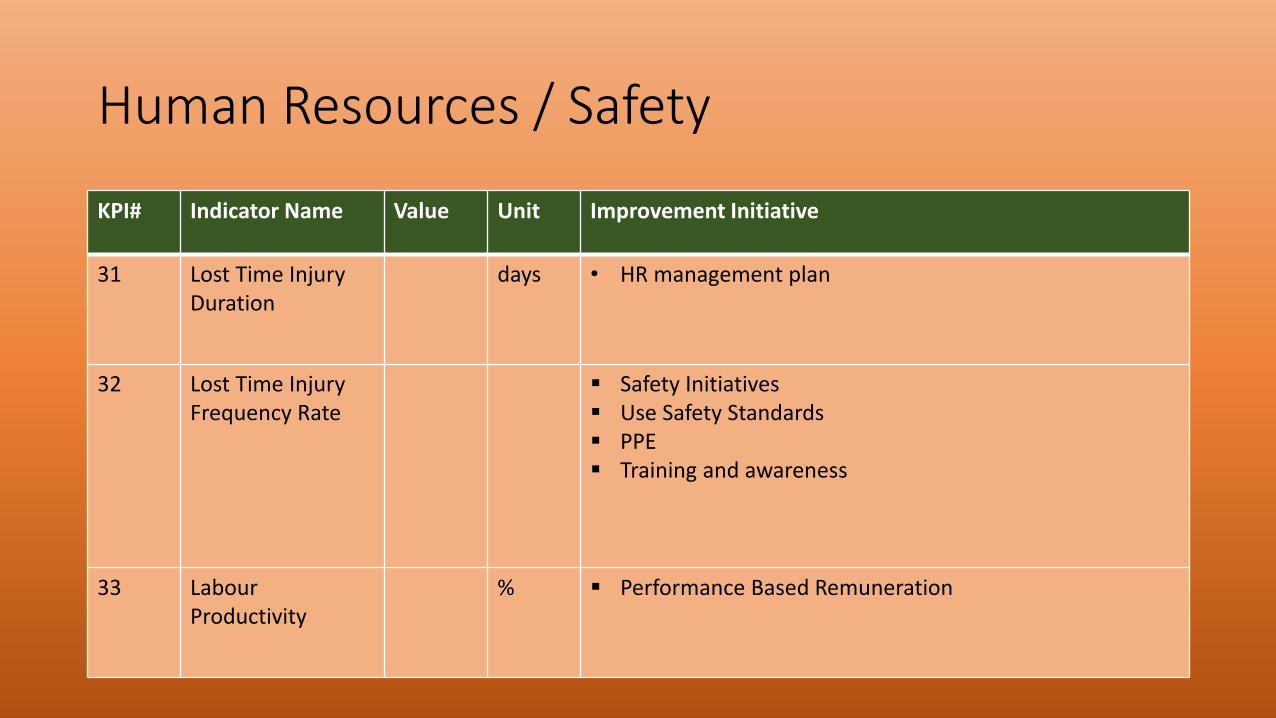
Human Resources / Safety
KPI# Indicator Name Value Unit Improvement Initiative
31 Lost Time Injury Duration
days • HR management plan
32 Lost Time Injury Frequency Rate
Safety Initiatives Use Safety Standards PPE Training and awareness
33 LabourProductivity
% Performance Based Remuneration
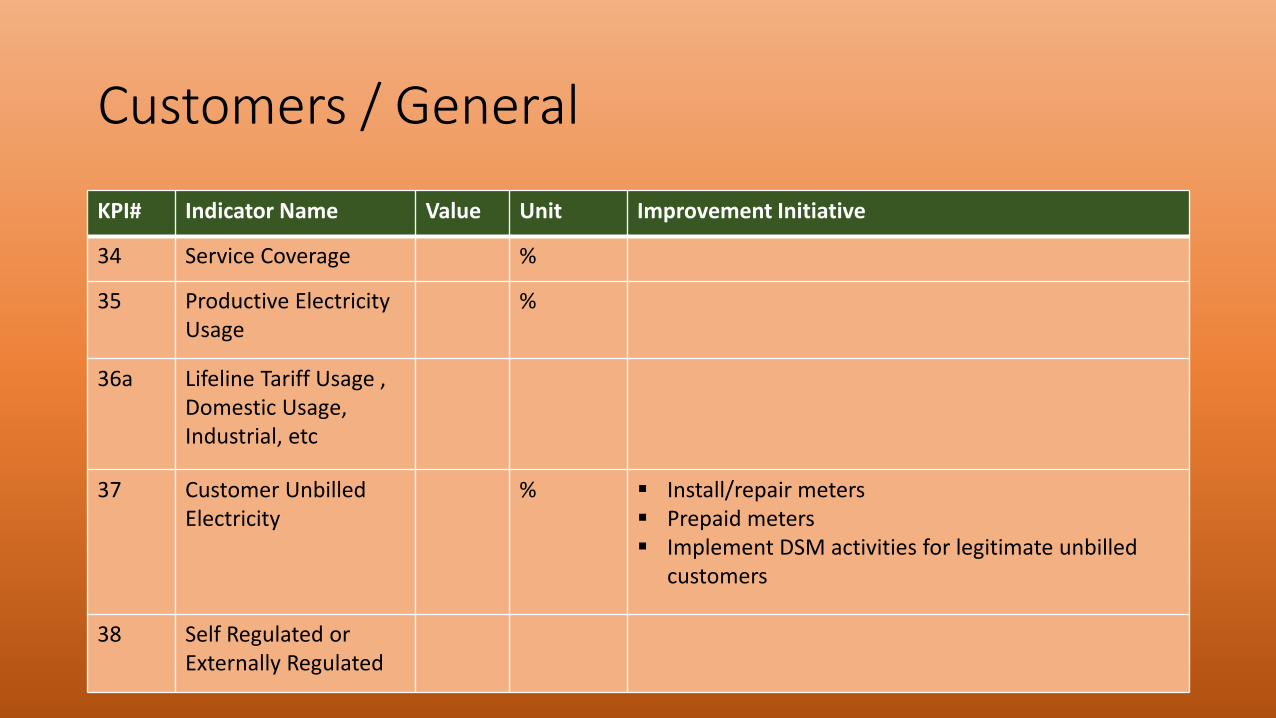
Customers / General
KPI# Indicator Name Value Unit Improvement Initiative
34 Service Coverage %
35 Productive Electricity Usage
%
36a Lifeline Tariff Usage , Domestic Usage, Industrial, etc
37 Customer Unbilled Electricity
% Install/repair meters Prepaid meters Implement DSM activities for legitimate unbilled
customers
38 Self Regulated or Externally Regulated
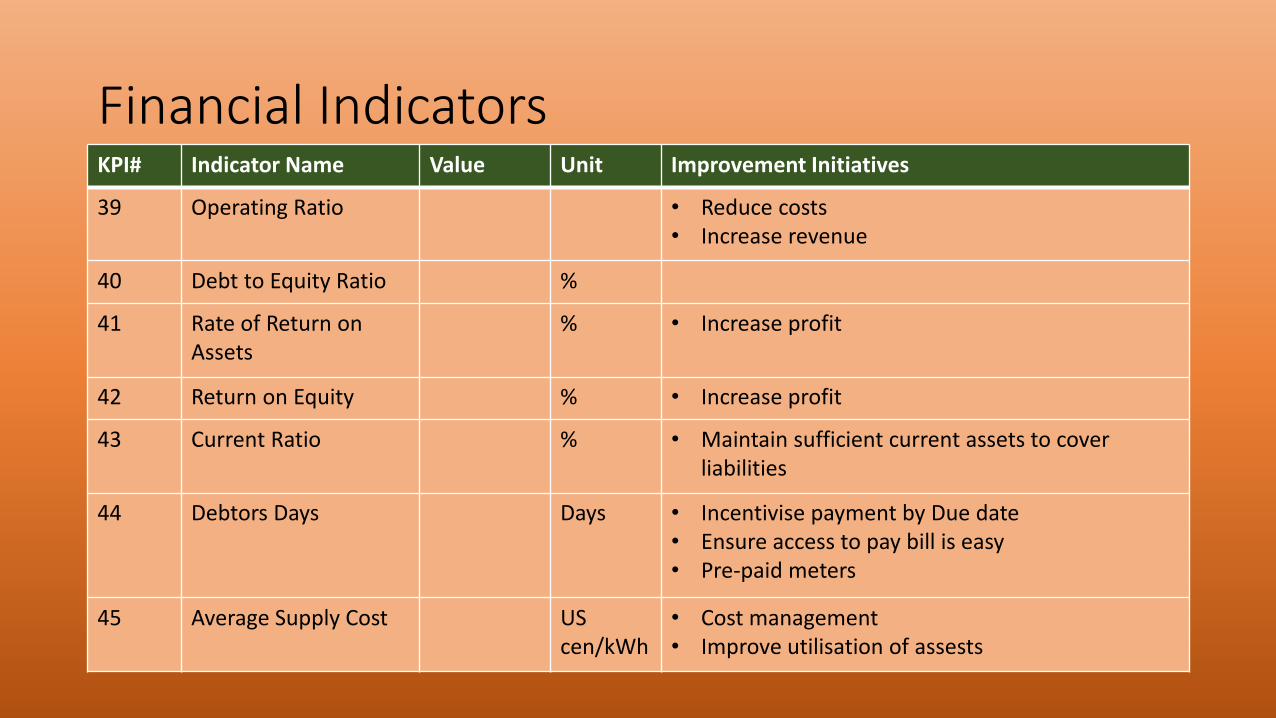
Financial IndicatorsKPI# Indicator Name Value Unit Improvement Initiatives
39 Operating Ratio • Reduce costs• Increase revenue
40 Debt to Equity Ratio %
41 Rate of Return on Assets
% • Increase profit
42 Return on Equity % • Increase profit
43 Current Ratio % • Maintain sufficient current assets to cover liabilities
44 Debtors Days Days • Incentivise payment by Due date • Ensure access to pay bill is easy• Pre-paid meters
45 Average Supply Cost UScen/kWh
• Cost management• Improve utilisation of assests
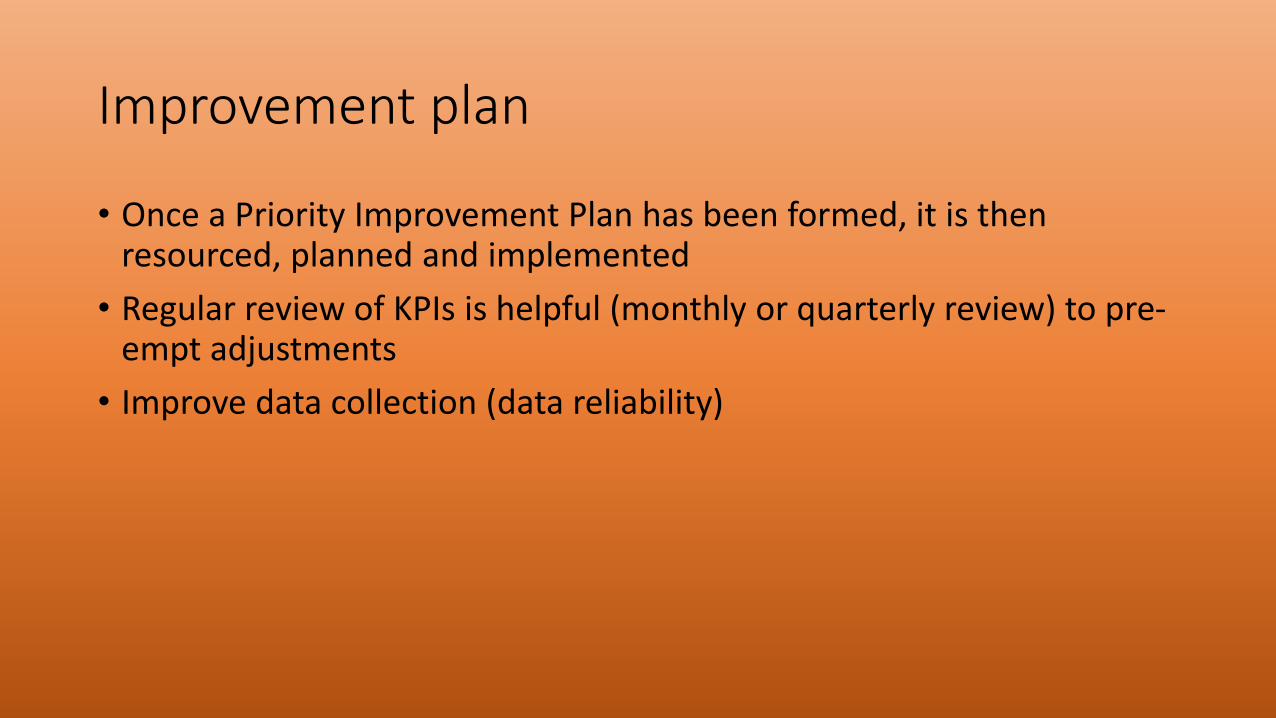
Improvement plan
• Once a Priority Improvement Plan has been formed, it is then resourced, planned and implemented
• Regular review of KPIs is helpful (monthly or quarterly review) to pre-empt adjustments
• Improve data collection (data reliability)
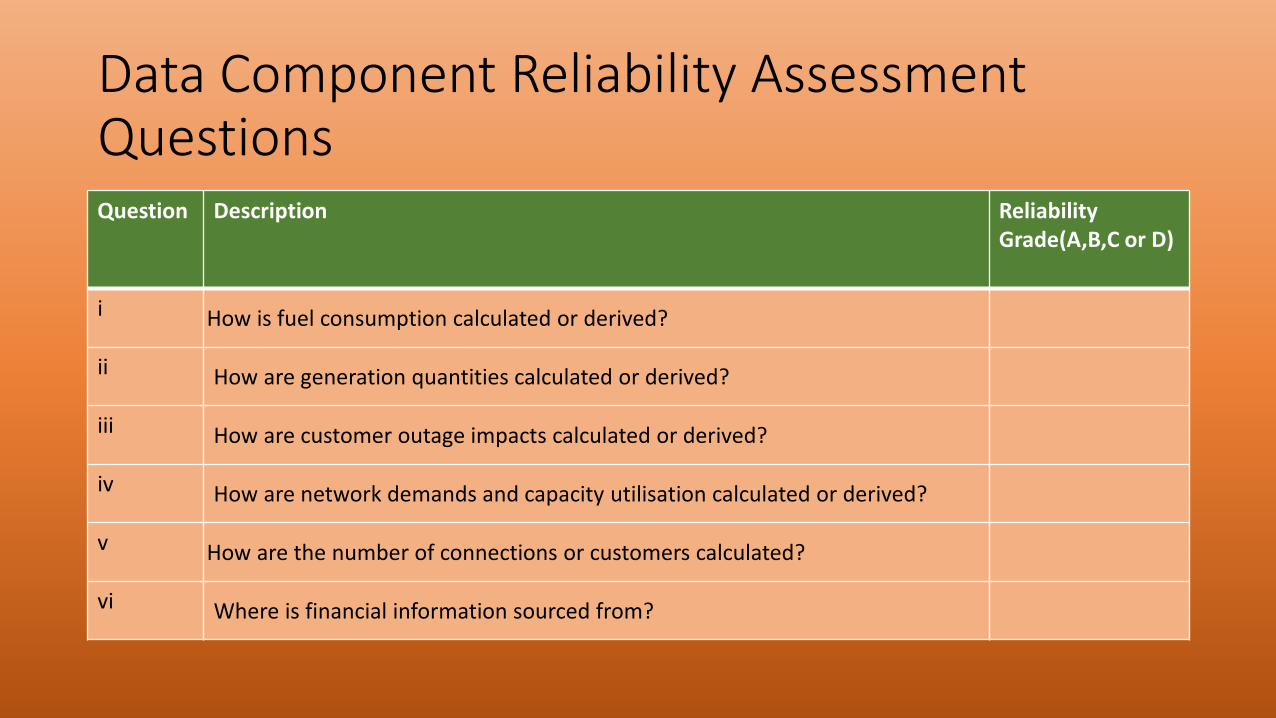
Data Component Reliability Assessment Questions Question Description Reliability
Grade(A,B,C or D)
i How is fuel consumption calculated or derived?
ii How are generation quantities calculated or derived?
iii How are customer outage impacts calculated or derived?
iv How are network demands and capacity utilisation calculated or derived?
v How are the number of connections or customers calculated?
vi Where is financial information sourced from?
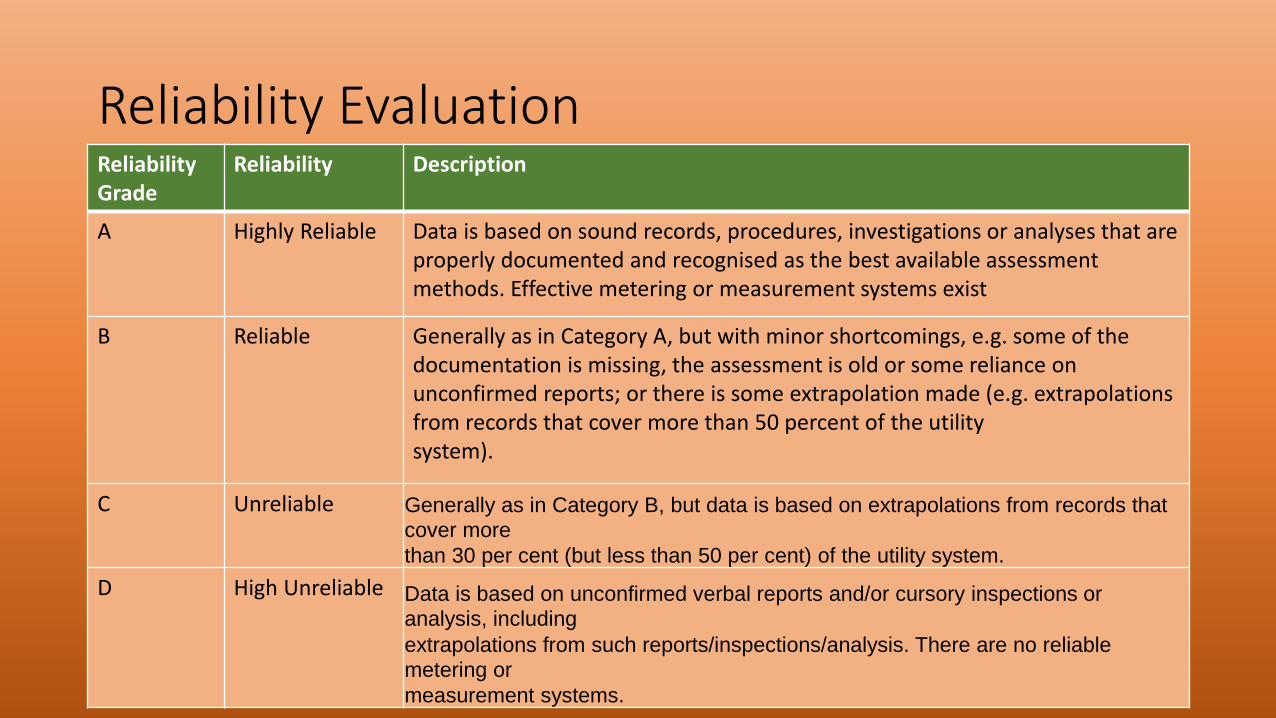
Reliability Evaluation Reliability Grade
Reliability Description
A Highly Reliable Data is based on sound records, procedures, investigations or analyses that are properly documented and recognised as the best available assessment methods. Effective metering or measurement systems exist
B Reliable Generally as in Category A, but with minor shortcomings, e.g. some of the documentation is missing, the assessment is old or some reliance on unconfirmed reports; or there is some extrapolation made (e.g. extrapolations from records that cover more than 50 percent of the utilitysystem).
C Unreliable Generally as in Category B, but data is based on extrapolations from records that
cover more
than 30 per cent (but less than 50 per cent) of the utility system.
D High Unreliable Data is based on unconfirmed verbal reports and/or cursory inspections or
analysis, including
extrapolations from such reports/inspections/analysis. There are no reliable
metering or
measurement systems.
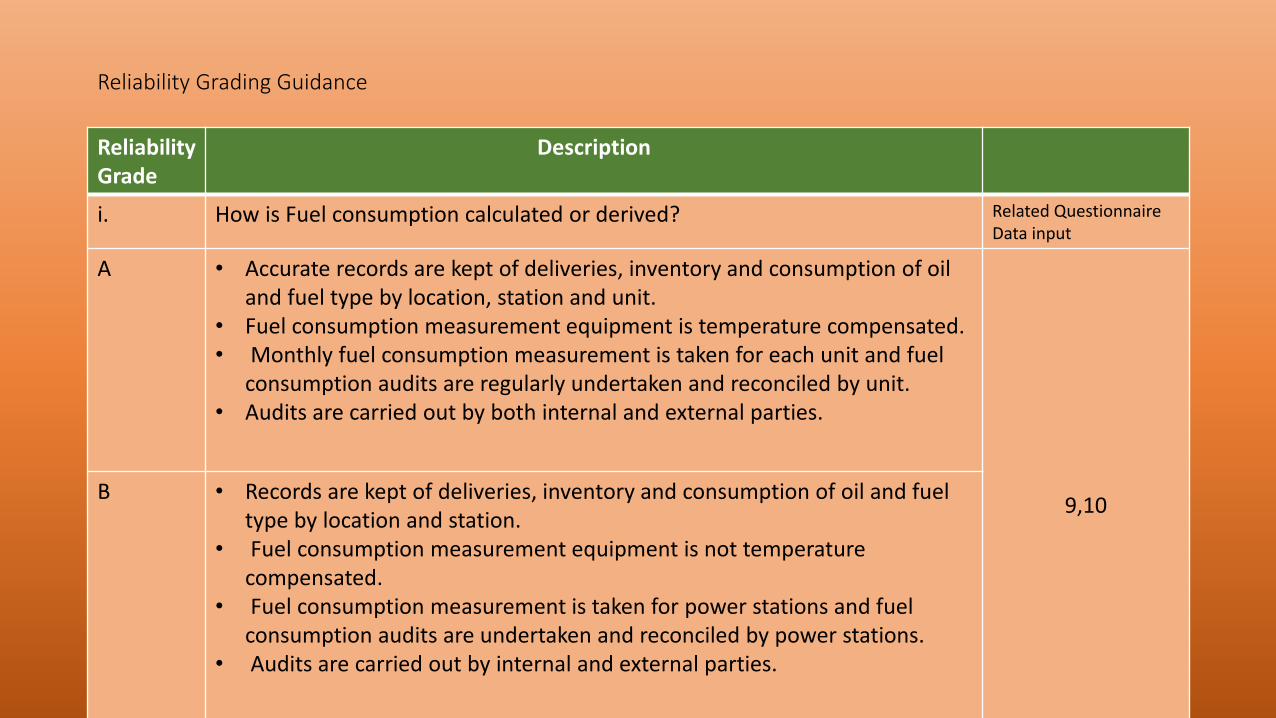
Reliability Grading Guidance
Reliability Grade
Description
i. How is Fuel consumption calculated or derived? Related Questionnaire Data input
A • Accurate records are kept of deliveries, inventory and consumption of oil and fuel type by location, station and unit.
• Fuel consumption measurement equipment is temperature compensated.• Monthly fuel consumption measurement is taken for each unit and fuel
consumption audits are regularly undertaken and reconciled by unit. • Audits are carried out by both internal and external parties.
9,10B • Records are kept of deliveries, inventory and consumption of oil and fuel
type by location and station. • Fuel consumption measurement equipment is not temperature
compensated.• Fuel consumption measurement is taken for power stations and fuel
consumption audits are undertaken and reconciled by power stations.• Audits are carried out by internal and external parties.
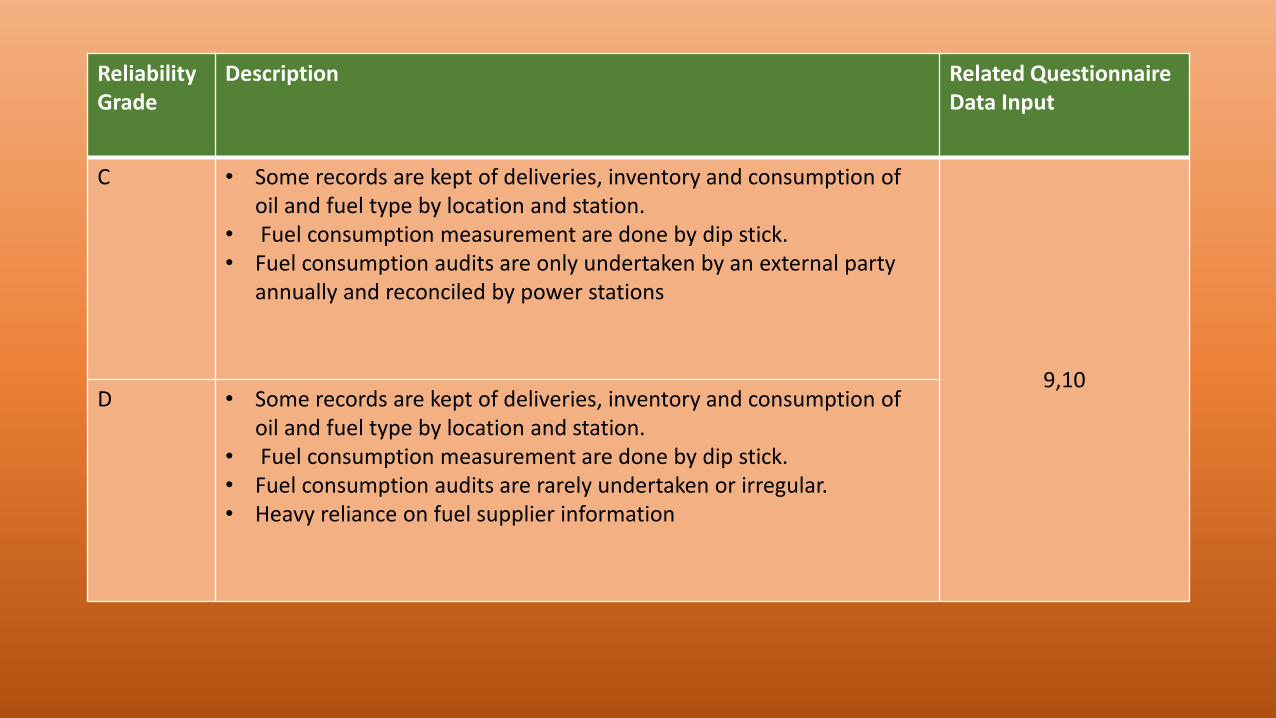
Reliability Grade
Description Related Questionnaire Data Input
C • Some records are kept of deliveries, inventory and consumption of oil and fuel type by location and station.
• Fuel consumption measurement are done by dip stick. • Fuel consumption audits are only undertaken by an external party
annually and reconciled by power stations
9,10D • Some records are kept of deliveries, inventory and consumption of
oil and fuel type by location and station.• Fuel consumption measurement are done by dip stick. • Fuel consumption audits are rarely undertaken or irregular. • Heavy reliance on fuel supplier information
Reliability Grading Guidance
Reliability Grade
Description
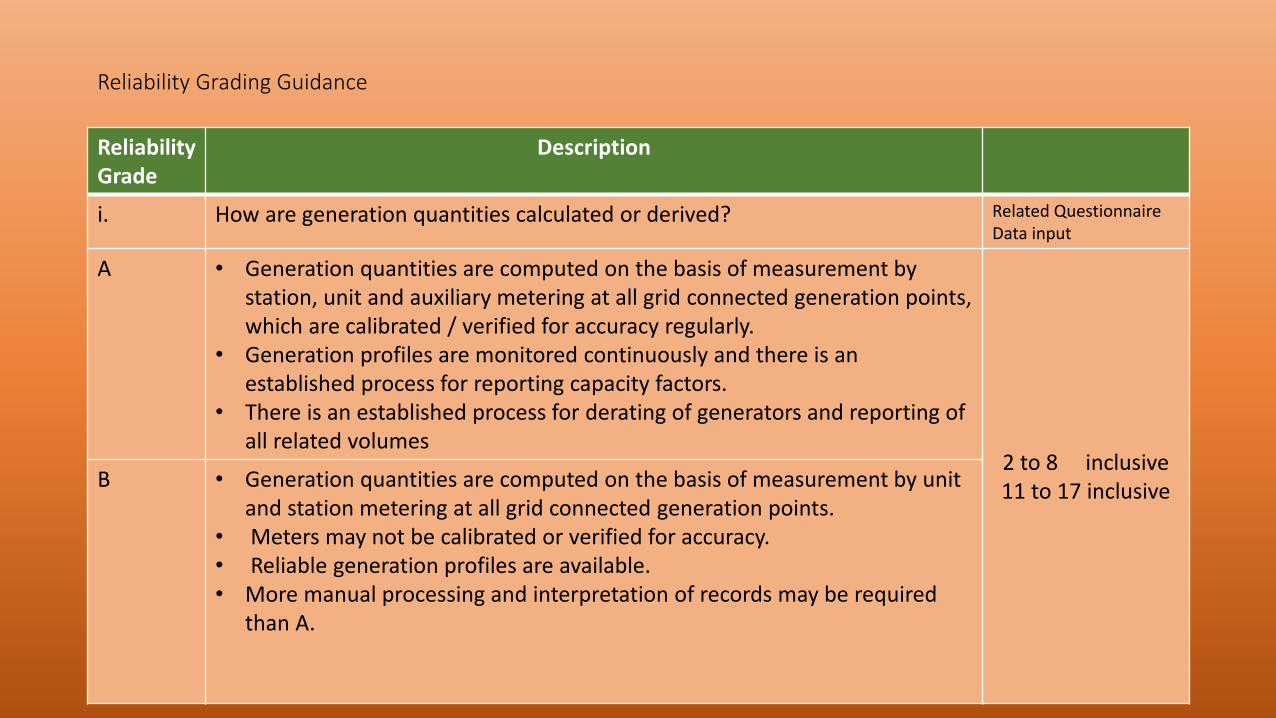
i. How are generation quantities calculated or derived? Related Questionnaire Data input
A • Generation quantities are computed on the basis of measurement by station, unit and auxiliary metering at all grid connected generation points, which are calibrated / verified for accuracy regularly.
• Generation profiles are monitored continuously and there is an established process for reporting capacity factors.
• There is an established process for derating of generators and reporting of all related volumes
2 to 8 inclusive11 to 17 inclusiveB • Generation quantities are computed on the basis of measurement by unit
and station metering at all grid connected generation points.• Meters may not be calibrated or verified for accuracy. • Reliable generation profiles are available.• More manual processing and interpretation of records may be required
than A.
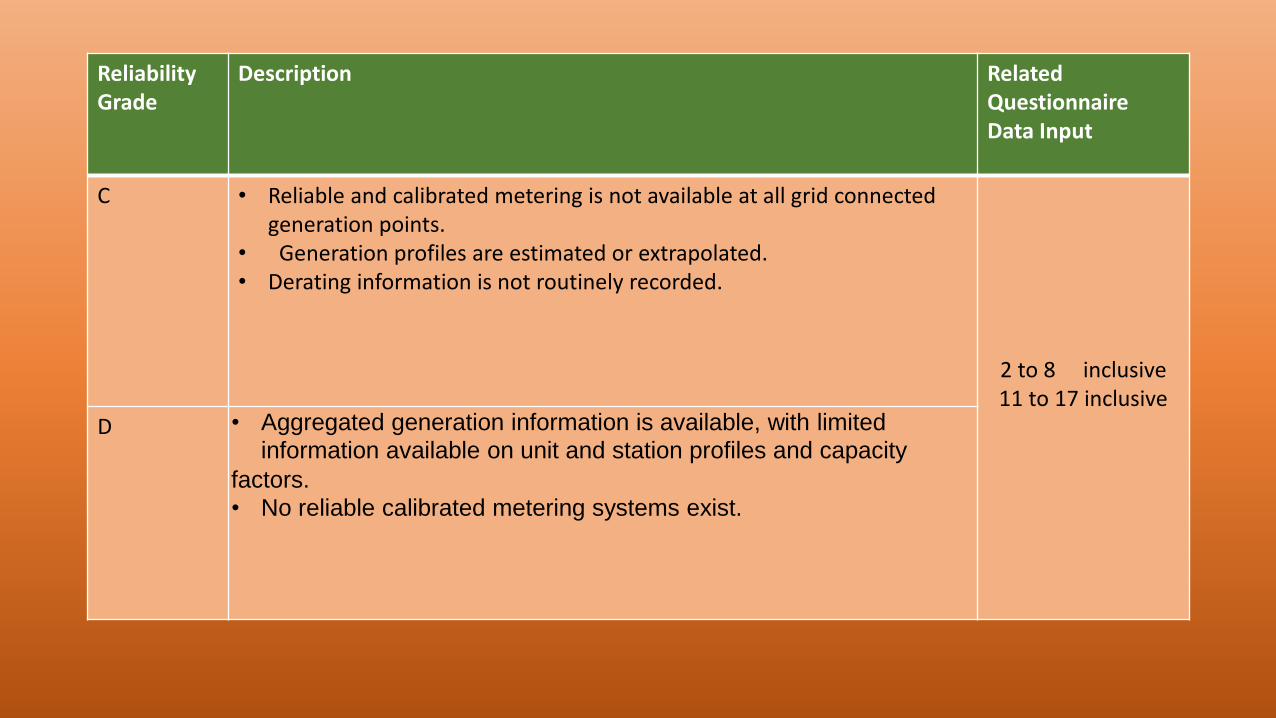
Reliability Grade
Description Related Questionnaire Data Input
C • Reliable and calibrated metering is not available at all grid connected generation points.
• Generation profiles are estimated or extrapolated. • Derating information is not routinely recorded.
2 to 8 inclusive11 to 17 inclusive
D • Aggregated generation information is available, with limited
information available on unit and station profiles and capacity
factors.
• No reliable calibrated metering systems exist.
Reliability Grading Guidance
Reliability Grade
Description
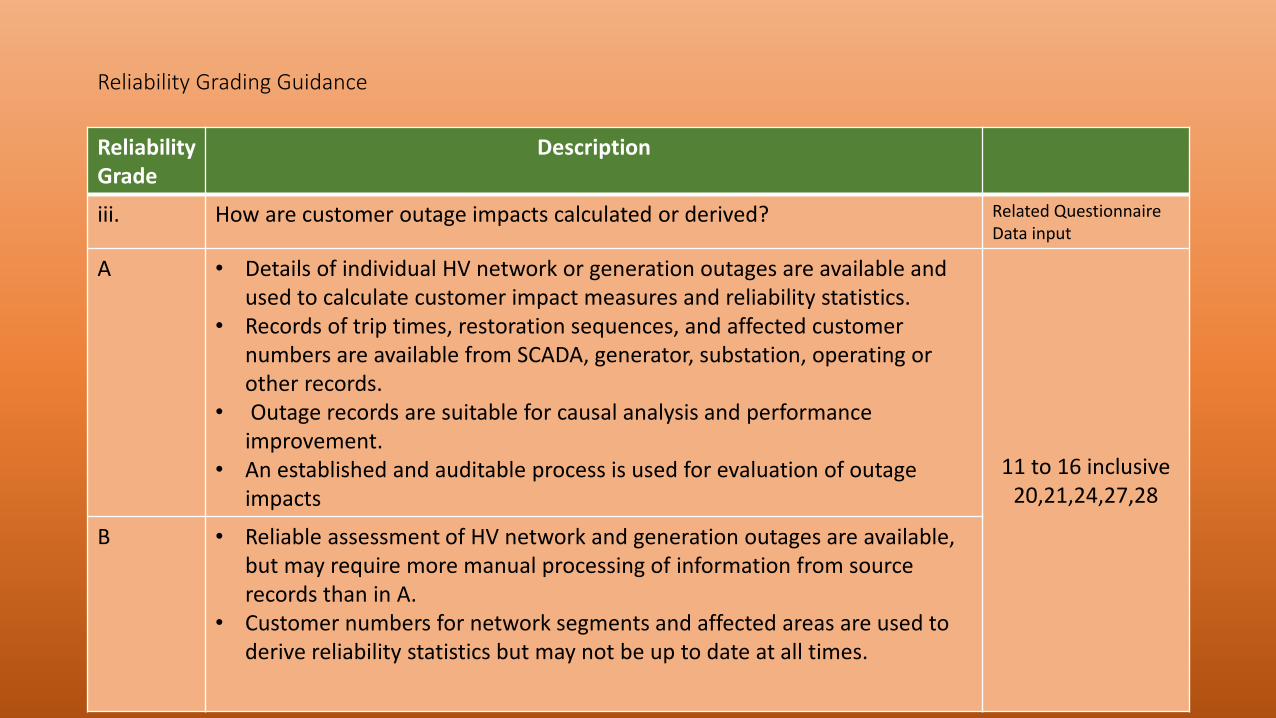
iii. How are customer outage impacts calculated or derived? Related Questionnaire Data input
A • Details of individual HV network or generation outages are available and used to calculate customer impact measures and reliability statistics.
• Records of trip times, restoration sequences, and affected customer numbers are available from SCADA, generator, substation, operating or other records.
• Outage records are suitable for causal analysis and performance improvement.
• An established and auditable process is used for evaluation of outage impacts
11 to 16 inclusive 20,21,24,27,28
B • Reliable assessment of HV network and generation outages are available, but may require more manual processing of information from source records than in A.
• Customer numbers for network segments and affected areas are used toderive reliability statistics but may not be up to date at all times.
Reliability Grade
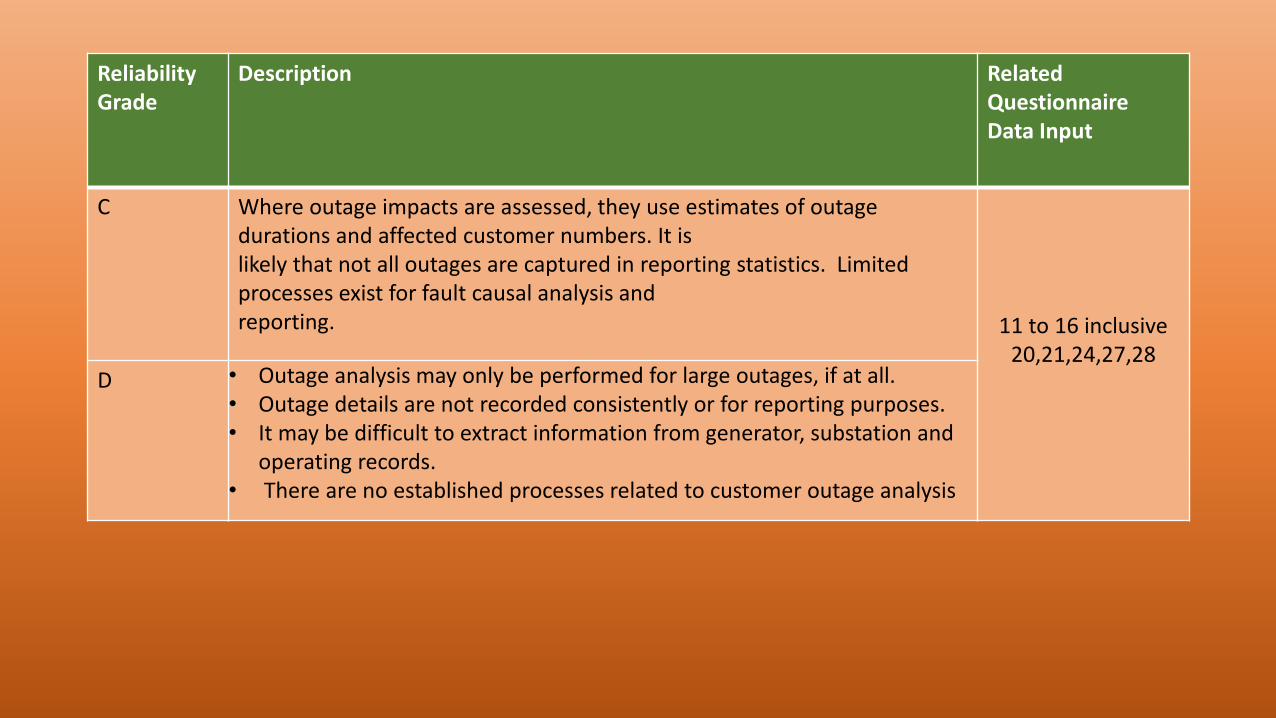
Description Related Questionnaire Data Input
C Where outage impacts are assessed, they use estimates of outage durations and affected customer numbers. It islikely that not all outages are captured in reporting statistics. Limited processes exist for fault causal analysis andreporting. 11 to 16 inclusive
20,21,24,27,28D • Outage analysis may only be performed for large outages, if at all.
• Outage details are not recorded consistently or for reporting purposes.• It may be difficult to extract information from generator, substation and
operating records. • There are no established processes related to customer outage analysis
Reliability Grade
Description
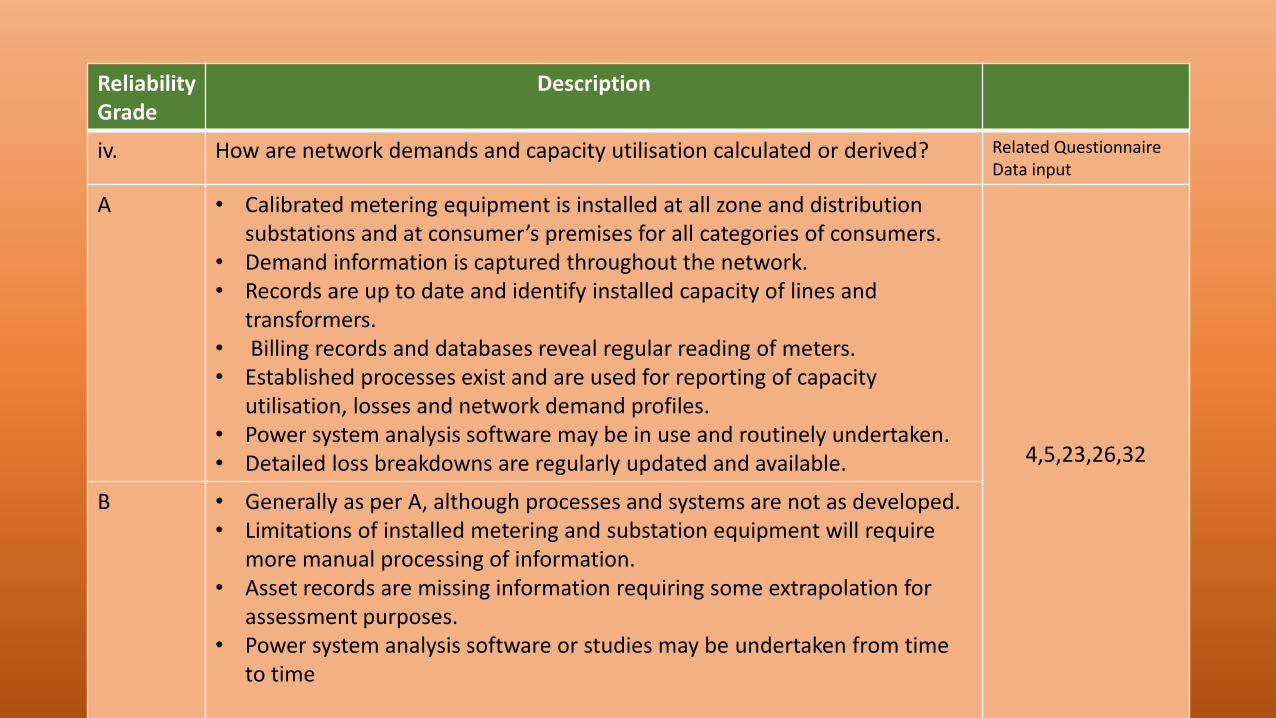
iv. How are network demands and capacity utilisation calculated or derived? Related Questionnaire Data input
A • Calibrated metering equipment is installed at all zone and distribution substations and at consumer’s premises for all categories of consumers.
• Demand information is captured throughout the network. • Records are up to date and identify installed capacity of lines and
transformers. • Billing records and databases reveal regular reading of meters.• Established processes exist and are used for reporting of capacity
utilisation, losses and network demand profiles.• Power system analysis software may be in use and routinely undertaken.• Detailed loss breakdowns are regularly updated and available. 4,5,23,26,32
B • Generally as per A, although processes and systems are not as developed.• Limitations of installed metering and substation equipment will require
more manual processing of information. • Asset records are missing information requiring some extrapolation for
assessment purposes. • Power system analysis software or studies may be undertaken from time
to time
Reliability Grade
Description Related Questionnaire Data Input
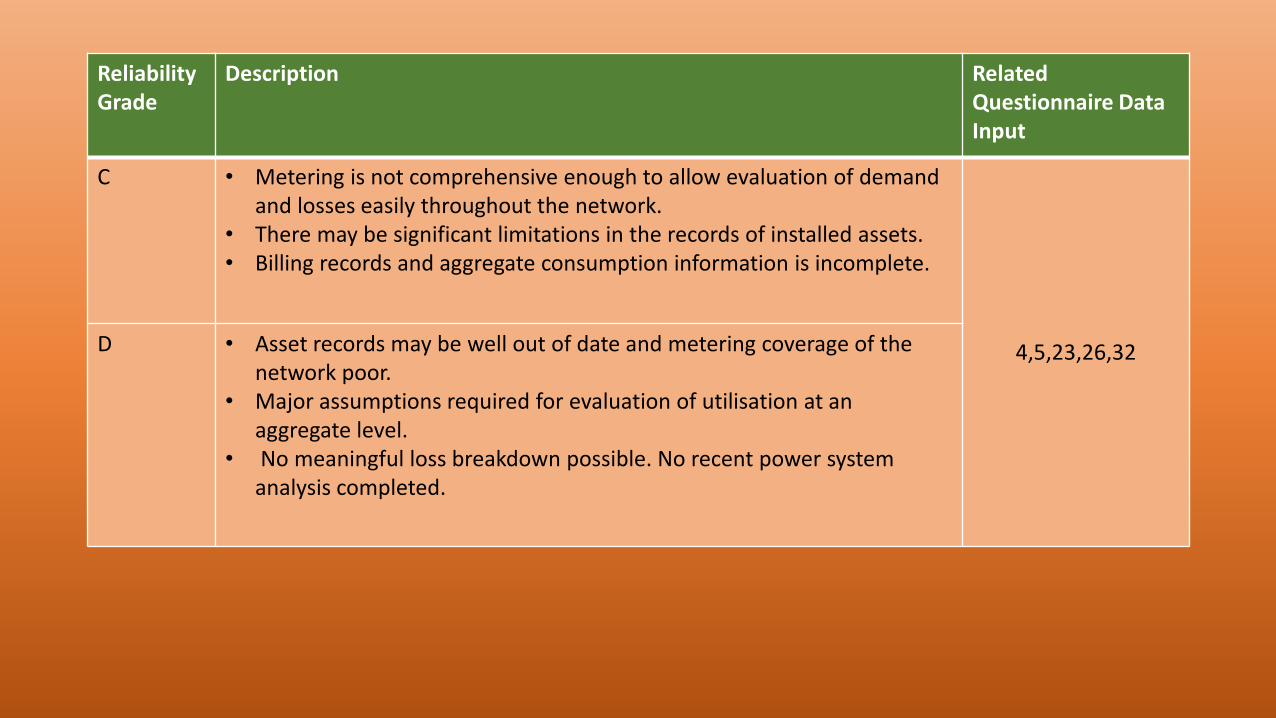
C • Metering is not comprehensive enough to allow evaluation of demand and losses easily throughout the network.
• There may be significant limitations in the records of installed assets.• Billing records and aggregate consumption information is incomplete.
4,5,23,26,32D • Asset records may be well out of date and metering coverage of the network poor.
• Major assumptions required for evaluation of utilisation at an aggregate level.
• No meaningful loss breakdown possible. No recent power systemanalysis completed.
Reliability Grading Guidance
Reliability Grade
Description
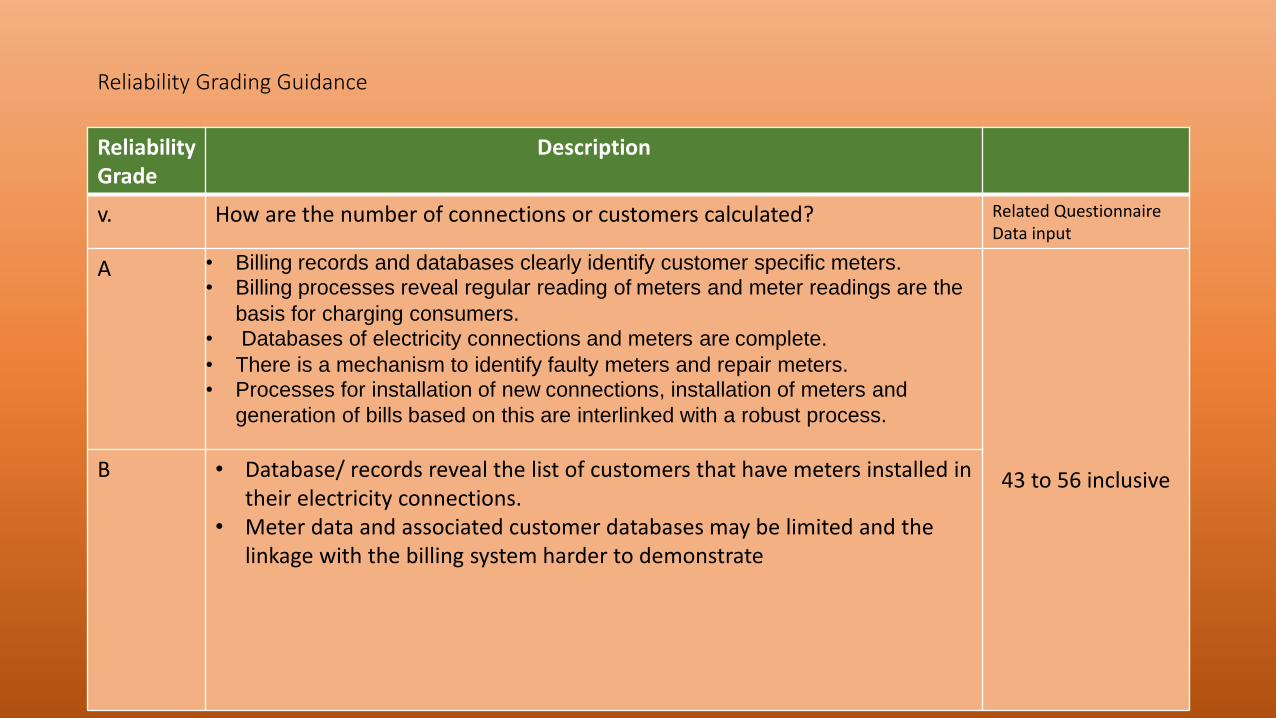
v. How are the number of connections or customers calculated? Related Questionnaire Data input
A • Billing records and databases clearly identify customer specific meters.
• Billing processes reveal regular reading of meters and meter readings are the
basis for charging consumers.
• Databases of electricity connections and meters are complete.
• There is a mechanism to identify faulty meters and repair meters.
• Processes for installation of new connections, installation of meters and
generation of bills based on this are interlinked with a robust process.
43 to 56 inclusiveB • Database/ records reveal the list of customers that have meters installed in their electricity connections.
• Meter data and associated customer databases may be limited and the linkage with the billing system harder to demonstrate
Reliability Grade
Description Related Questionnaire Data Input
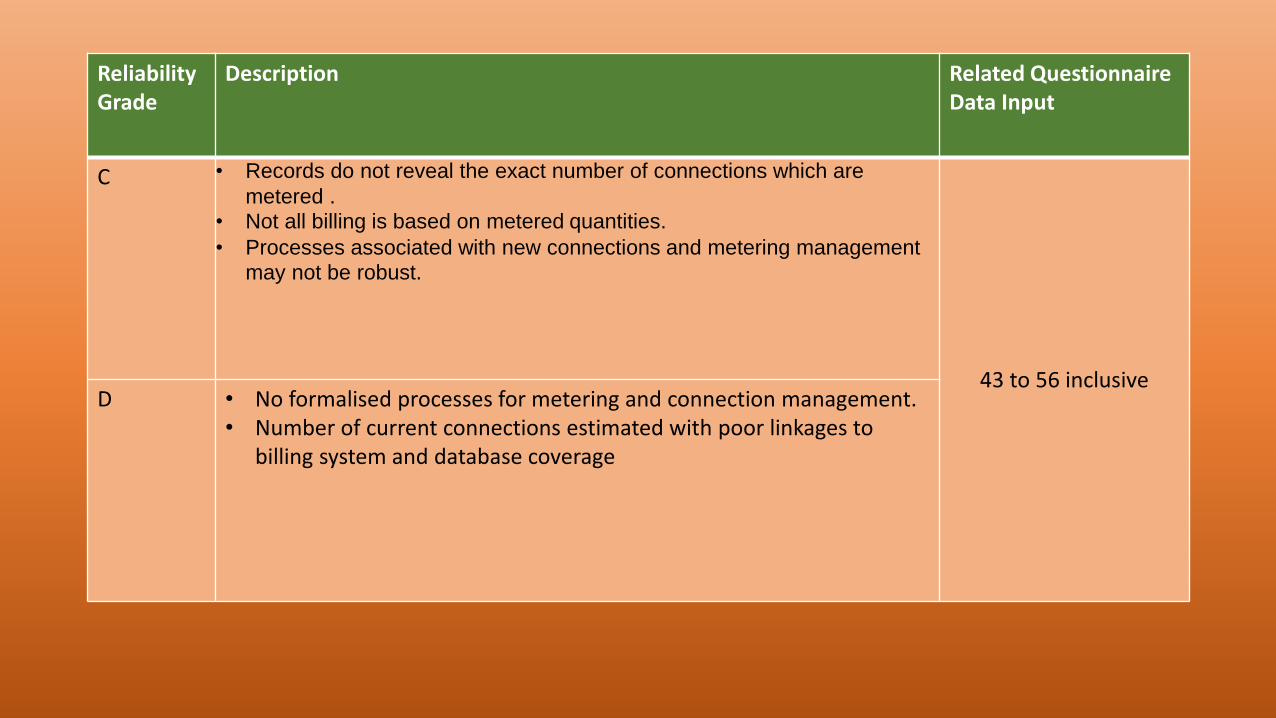
C • Records do not reveal the exact number of connections which are
metered .
• Not all billing is based on metered quantities.
• Processes associated with new connections and metering management may not be robust.
43 to 56 inclusiveD • No formalised processes for metering and connection management.
• Number of current connections estimated with poor linkages to billing system and database coverage
Reliability Grading Guidance
Reliability Grade
Description
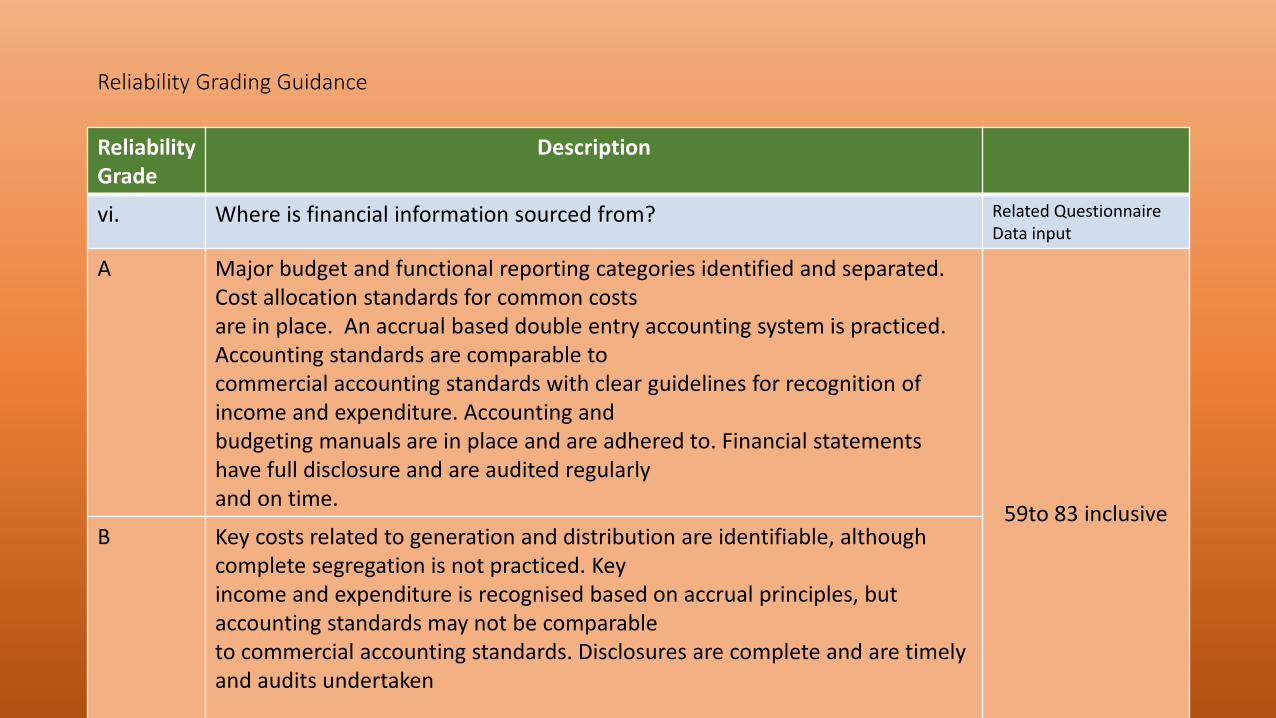
vi. Where is financial information sourced from? Related Questionnaire Data input
A Major budget and functional reporting categories identified and separated. Cost allocation standards for common costsare in place. An accrual based double entry accounting system is practiced. Accounting standards are comparable tocommercial accounting standards with clear guidelines for recognition of income and expenditure. Accounting andbudgeting manuals are in place and are adhered to. Financial statements have full disclosure and are audited regularlyand on time.
59to 83 inclusiveB Key costs related to generation and distribution are identifiable, although
complete segregation is not practiced. Keyincome and expenditure is recognised based on accrual principles, but accounting standards may not be comparableto commercial accounting standards. Disclosures are complete and are timely and audits undertaken
Reliability Grade
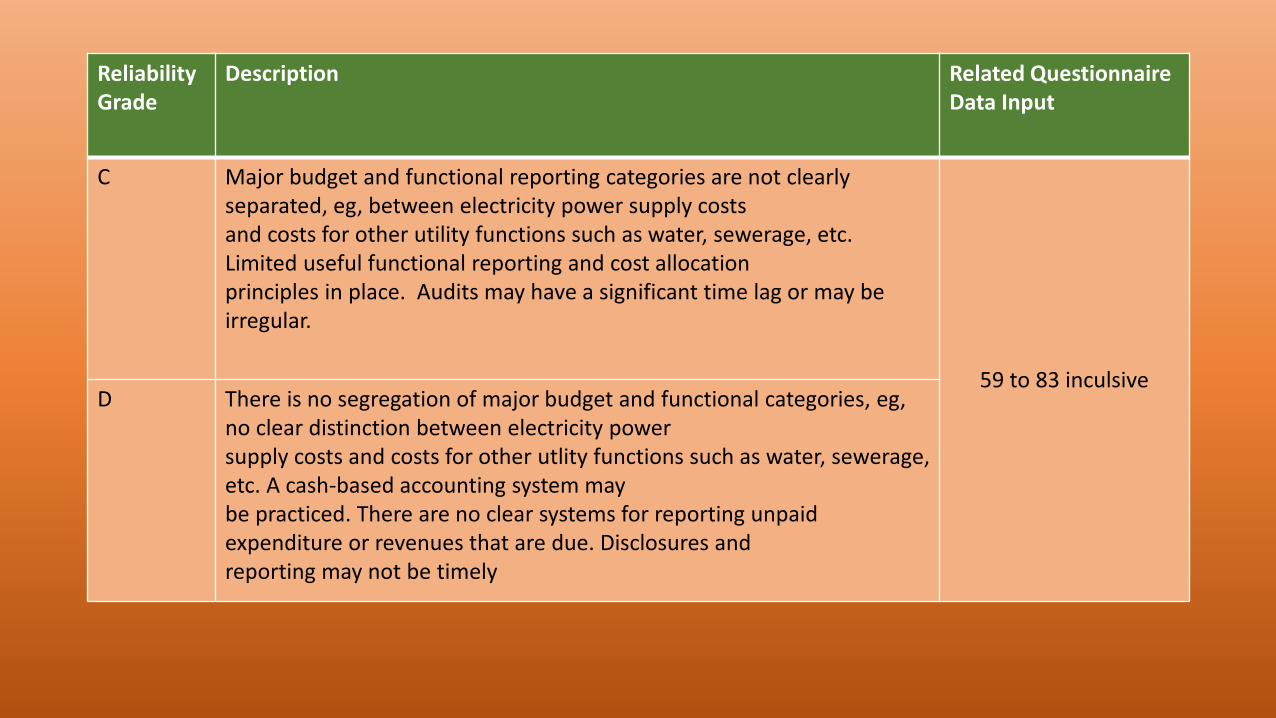
Description Related Questionnaire Data Input
C Major budget and functional reporting categories are not clearly separated, eg, between electricity power supply costsand costs for other utility functions such as water, sewerage, etc. Limited useful functional reporting and cost allocationprinciples in place. Audits may have a significant time lag or may be irregular.
59 to 83 inculsiveD There is no segregation of major budget and functional categories, eg,
no clear distinction between electricity powersupply costs and costs for other utlity functions such as water, sewerage, etc. A cash-based accounting system maybe practiced. There are no clear systems for reporting unpaid expenditure or revenues that are due. Disclosures andreporting may not be timely
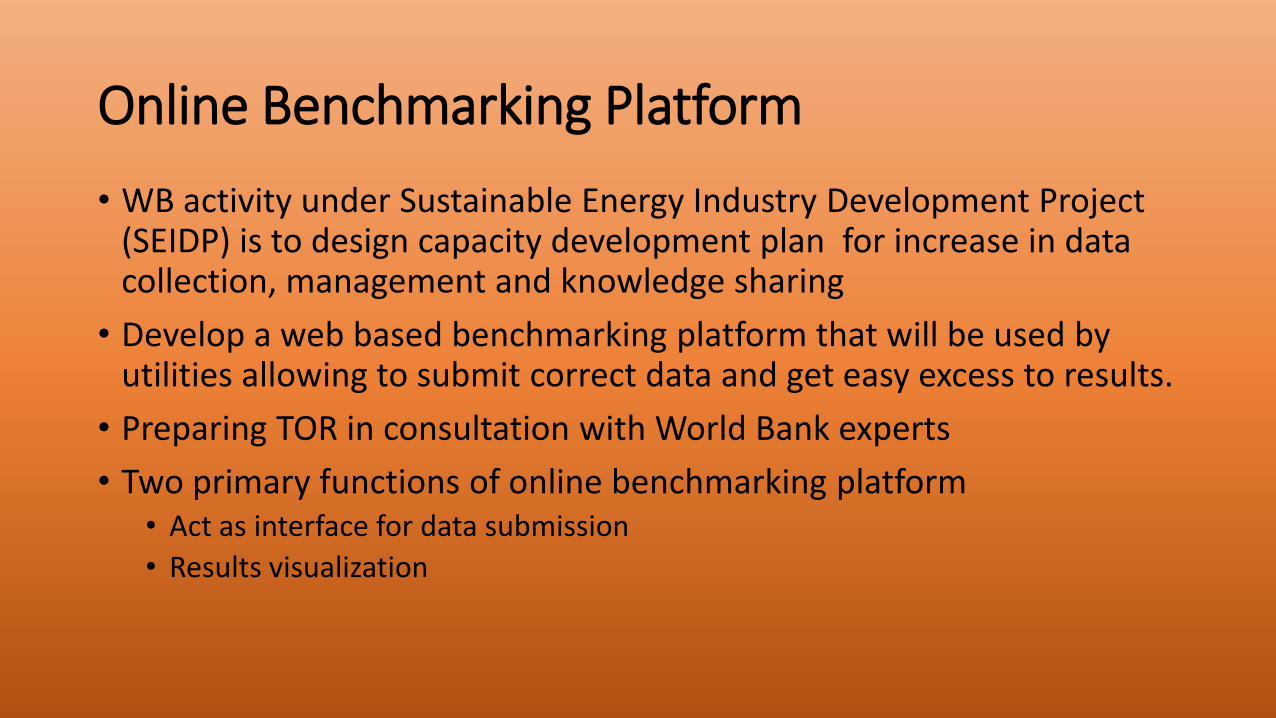
Online Benchmarking Platform
• WB activity under Sustainable Energy Industry Development Project (SEIDP) is to design capacity development plan for increase in data collection, management and knowledge sharing
• Develop a web based benchmarking platform that will be used by utilities allowing to submit correct data and get easy excess to results.
• Preparing TOR in consultation with World Bank experts
• Two primary functions of online benchmarking platform• Act as interface for data submission
• Results visualization
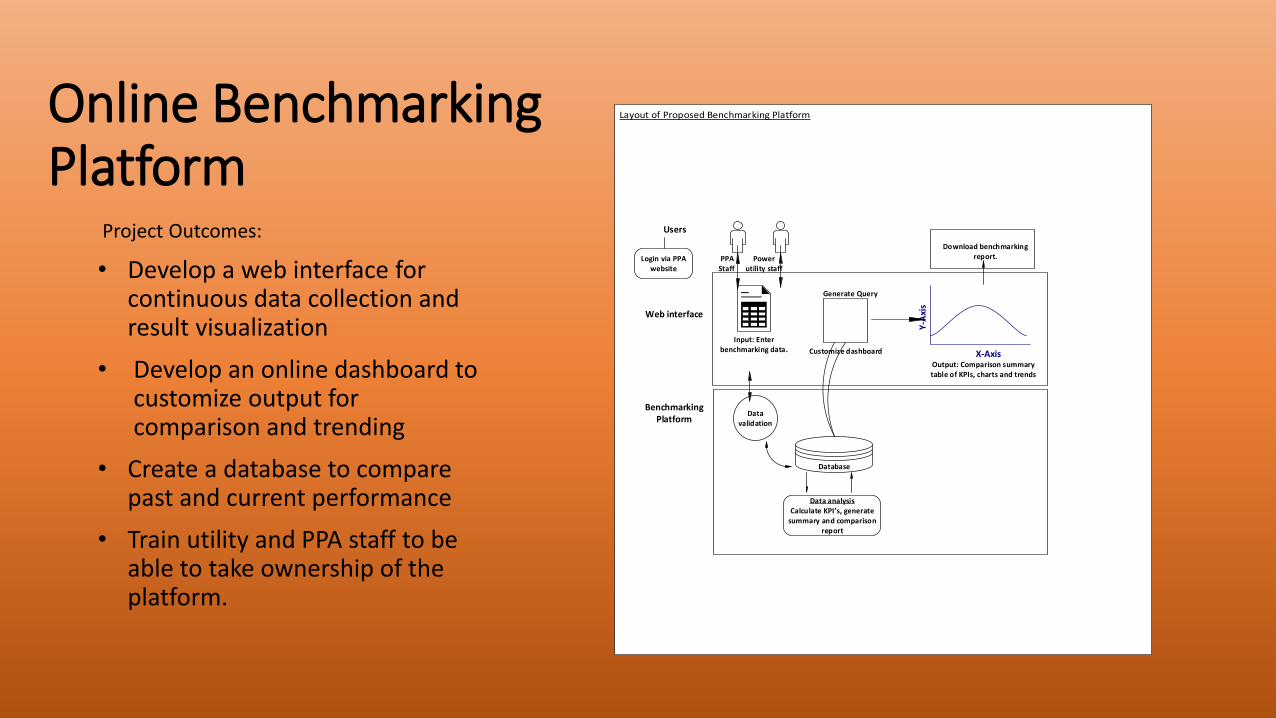
Online Benchmarking Platform
Project Outcomes:
• Develop a web interface for continuous data collection and result visualization
• Develop an online dashboard to customize output for comparison and trending
• Create a database to compare past and current performance
• Train utility and PPA staff to be able to take ownership of the platform.
Users
Input: Enter benchmarking data.
Web interface
Login via PPA website
Y-A
xis
X-AxisOutput: Comparison summary table of KPIs, charts and trends
Benchmarking Platform
Data validation
Data analysisCalculate KPI s, generate
summary and comparison report
Database
Customize dashboard
Generate Query
Download benchmarking report. PPA
StaffPower
utility staff
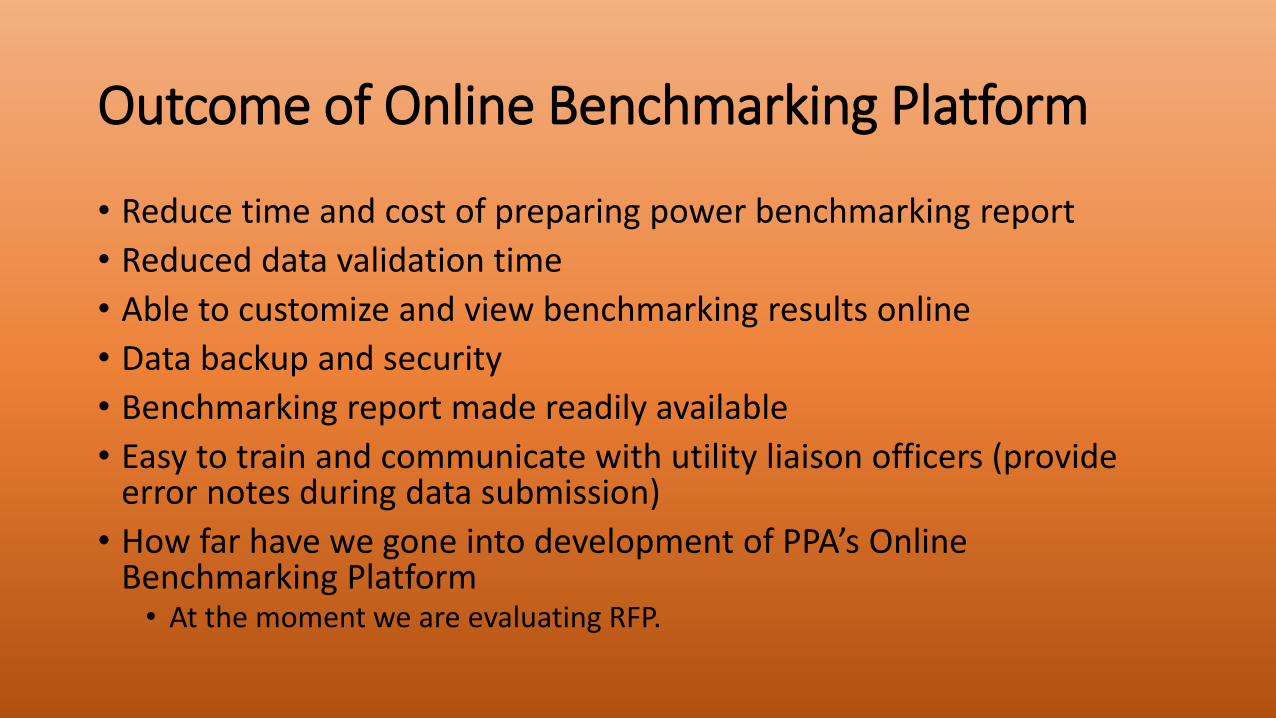
Outcome of Online Benchmarking Platform
• Reduce time and cost of preparing power benchmarking report
• Reduced data validation time
• Able to customize and view benchmarking results online
• Data backup and security
• Benchmarking report made readily available
• Easy to train and communicate with utility liaison officers (provide error notes during data submission)
• How far have we gone into development of PPA’s Online Benchmarking Platform• At the moment we are evaluating RFP.
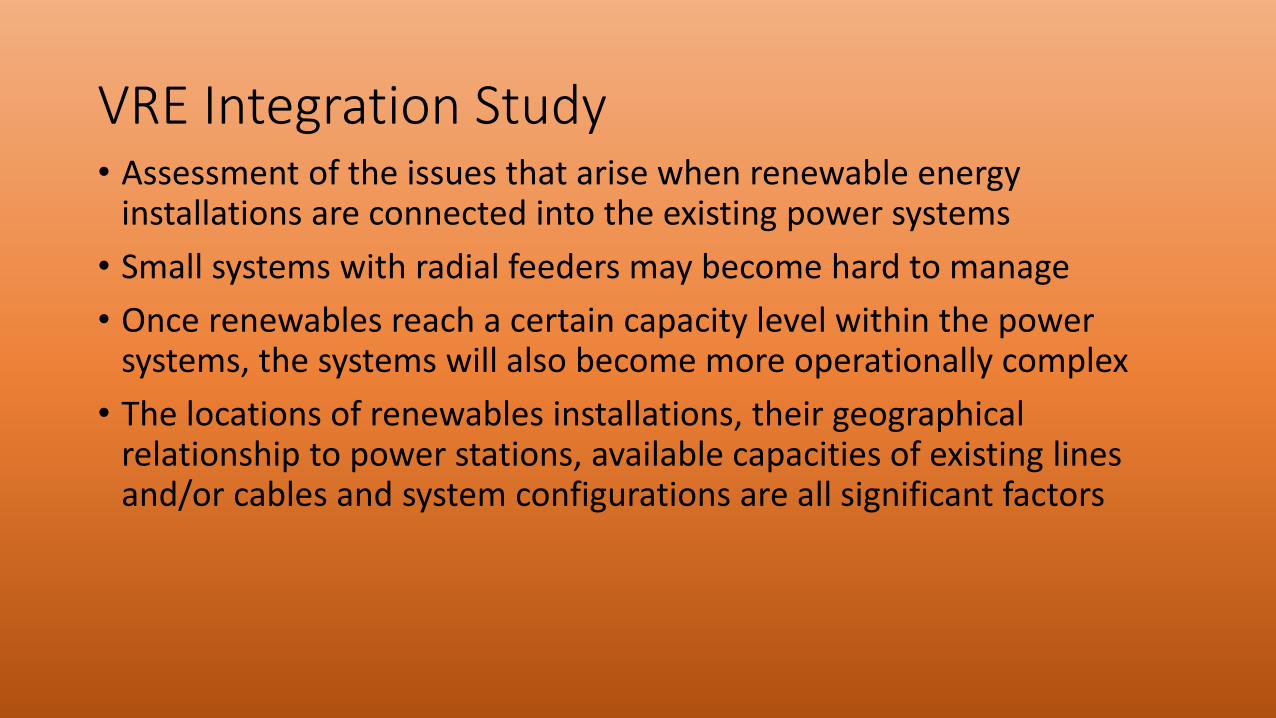
VRE Integration Study• Assessment of the issues that arise when renewable energy
installations are connected into the existing power systems
• Small systems with radial feeders may become hard to manage
• Once renewables reach a certain capacity level within the power systems, the systems will also become more operationally complex
• The locations of renewables installations, their geographical relationship to power stations, available capacities of existing lines and/or cables and system configurations are all significant factors
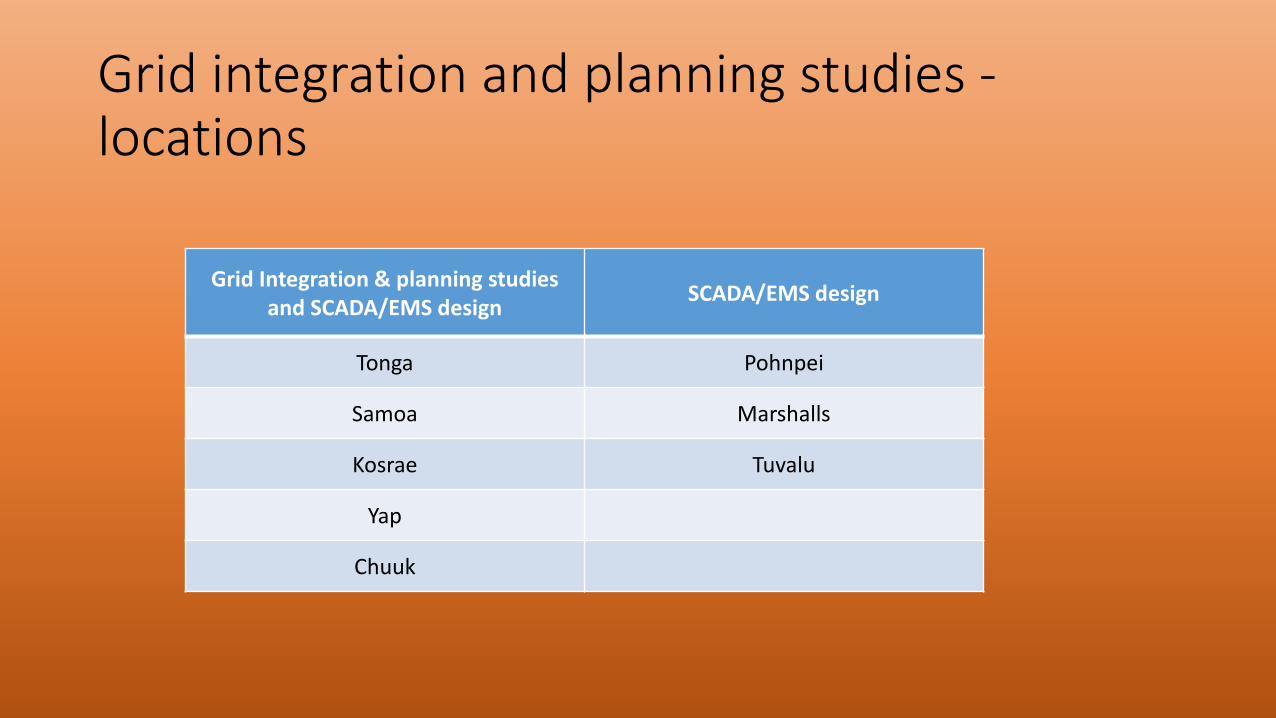
Grid integration and planning studies -locations
Grid Integration & planning studies and SCADA/EMS design
SCADA/EMS design
Tonga Pohnpei
Samoa Marshalls
Kosrae Tuvalu
Yap
Chuuk
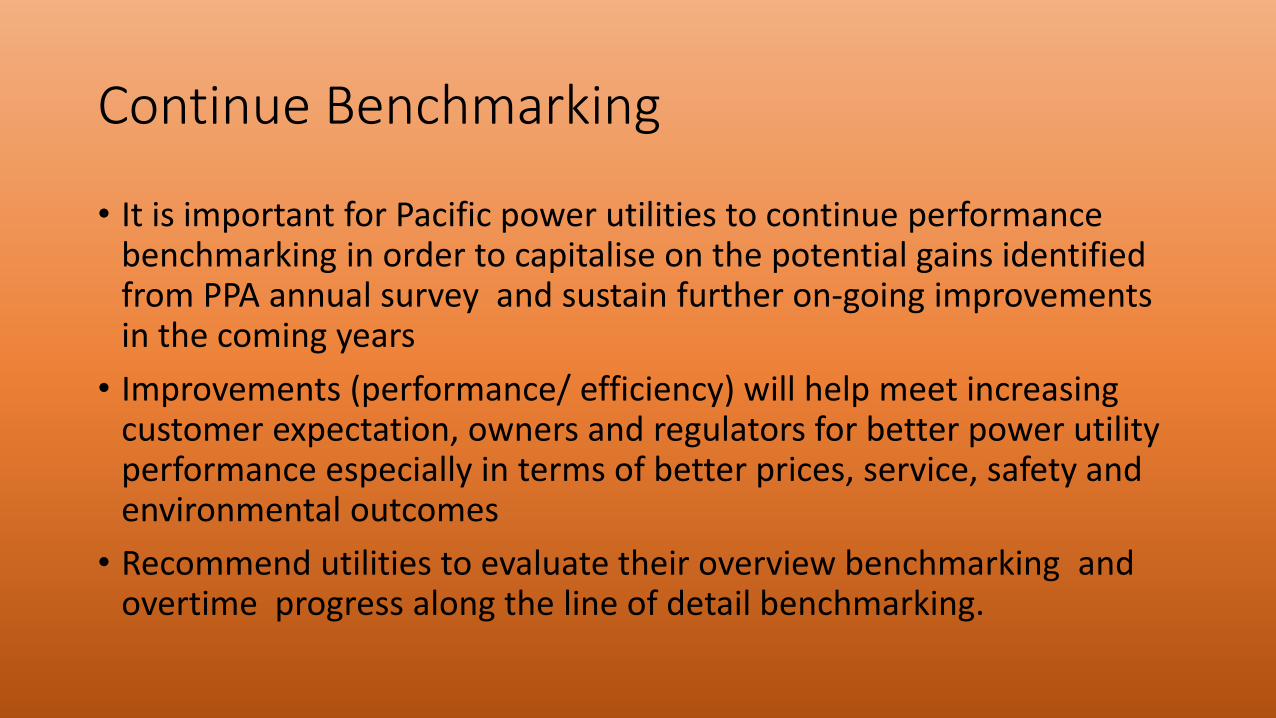
Continue Benchmarking
• It is important for Pacific power utilities to continue performance benchmarking in order to capitalise on the potential gains identified from PPA annual survey and sustain further on-going improvements in the coming years
• Improvements (performance/ efficiency) will help meet increasing customer expectation, owners and regulators for better power utility performance especially in terms of better prices, service, safety and environmental outcomes
• Recommend utilities to evaluate their overview benchmarking and overtime progress along the line of detail benchmarking.

Thank You