performance evaluation of two silt fence geosynthetic
TRANSCRIPT

University of Central Florida University of Central Florida
STARS STARS
Electronic Theses and Dissertations, 2004-2019
2014
Performance Evaluation of Two Silt Fence Geosynthetic Fabrics Performance Evaluation of Two Silt Fence Geosynthetic Fabrics
During and After Rainfall Event During and After Rainfall Event
Gregg Dubinsky University of Central Florida
Part of the Environmental Engineering Commons
Find similar works at: https://stars.library.ucf.edu/etd
University of Central Florida Libraries http://library.ucf.edu
This Masters Thesis (Open Access) is brought to you for free and open access by STARS. It has been accepted for
inclusion in Electronic Theses and Dissertations, 2004-2019 by an authorized administrator of STARS. For more
information, please contact [email protected].
STARS Citation STARS Citation Dubinsky, Gregg, "Performance Evaluation of Two Silt Fence Geosynthetic Fabrics During and After Rainfall Event" (2014). Electronic Theses and Dissertations, 2004-2019. 4715. https://stars.library.ucf.edu/etd/4715

PERFORMANCE EVALUATION OF TWO SILT FENCE GEOSYNTHETIC FABRICS
DURING AND AFTER RAINFALL EVENT
by
GREGG STEVEN DUBINSKY, E.I.
B.S. University of Central Florida, 2012
A thesis submitted in partial fulfillment of the requirements
for the degree of Masters of Science in Environmental Engineering
in the Department of Civil, Environmental, Construction Engineering
in the College of Engineering & Computer Science
at the University of Central Florida
Orlando, Florida
Spring Term
2014
Major Professor: Manoj Chopra

ii
© 2014 Gregg Steven Dubinsky

iii
ABSTRACT
Silt fence is one of the most widely used perimeter control devices and is considered an
industry standard for use in the control of sediment transport from construction sites. Numerous
research studies have been conducted on the use of silt fence as a perimeter control, including a
number of studies involving controlled laboratory flume tests and outdoor tests performed in the
field on construction sites with actual monitored storm events. In field tests, due to the random
and uncontrollable nature of real storm events and field conditions, studies have shown difficulty
in evaluating silt fence performance. These field studies have shown the need for performance
testing of silt fence in a more controlled environment, which can also simulate the actual use and
performance in the field. This research, which is a continuation of ongoing research on silt fence
fabrics at UCF Stormwater and Management Academy, was conducted in order to evaluate silt
fence performance under simulated field conditions. Presented in this thesis are evaluation of
two silt fence fabrics, a woven (ASR 1400) fabric and nonwoven (BSRF) fabric. Both fabrics
were installed separately on a tilted test bed filled with a silty-sand soil and subjected to
simulated rainfall.
Previous field studies on the performance of silt fence fabrics have evaluated the
turbidity and sediment removal efficiencies only after the rain event, with the assumption that the
efficiency values represent the true overall performance of silt fence. The results of this study
revealed that the turbidity and suspended sediment performance efficiencies of silt fence were
significantly affected by the time of sampling. The performance efficiencies during rainfall
remained less than 55 percent, however, after the rainfall event ended, the performance
efficiencies increased over time, reaching performance efficiency upwards of 90 percent. The

iv
increase in efficiency after rainfall was due to the constant or decreasing ponding depth behind
the silt fence, increased filtration due to fabric clogging, and sedimentation of suspended
particles.
The nonwoven fabric was found to achieve higher removal efficiencies and flow-
through rates both during and after the rain event when compared with the woven fabric.
However, over the entire test duration (during and after rainfall combined), the projected overall
efficiencies of both fabrics were similar. The projected overall average turbidity performance
efficiencies of the woven and nonwoven silt fence fabrics was 80 and 78 percent, respectively.
Both fabric types also achieved comparable overall average suspended sediment concentration
efficiencies of 79 percent.
This result leads to the conclusion that silt fence performance in the field is dependent
on three main processes: filtration efficiency occurring during the rain event, filtration and
sedimentation efficiency occurring after the rainfall event, and flow-through rate of the silt fence
fabrics. Decreases in the flow-through rate lead to increases in the overall efficiency. This thesis
quantifies the different mechanisms by which these processes contribute to the overall efficiency
of the silt fence system and shows how these processes are affected by different conditions such
as the degree of embankment slope and rainfall intensity.

v
Dedicated to my family and friends, in memory of my father, Leon

vi
ACKNOWLEDGMENTS
The author would like to expresses his gratefulness to his major advisor Dr. Manoj
Chopra for his encouragement and overall guidance throughout his graduate education at the
University of Central Florida. In addition, he would also like to thank Dr. Ikiensinma Gogo-
Abite for his contribution to the research through helpful discussion and advice and for serving
on his graduate thesis committee. The author further extends gratitude to Dr. Andrew Randall
and Dr. Dingbao Wang for also serving on his graduate thesis committee.
The author would like to express thanks to the staff and students of the Stormwater
Management Academy. In particular, he would like to thank Mike Hardin, Christopher Hickson,
Mario Samson, and Sean Ram.
vii
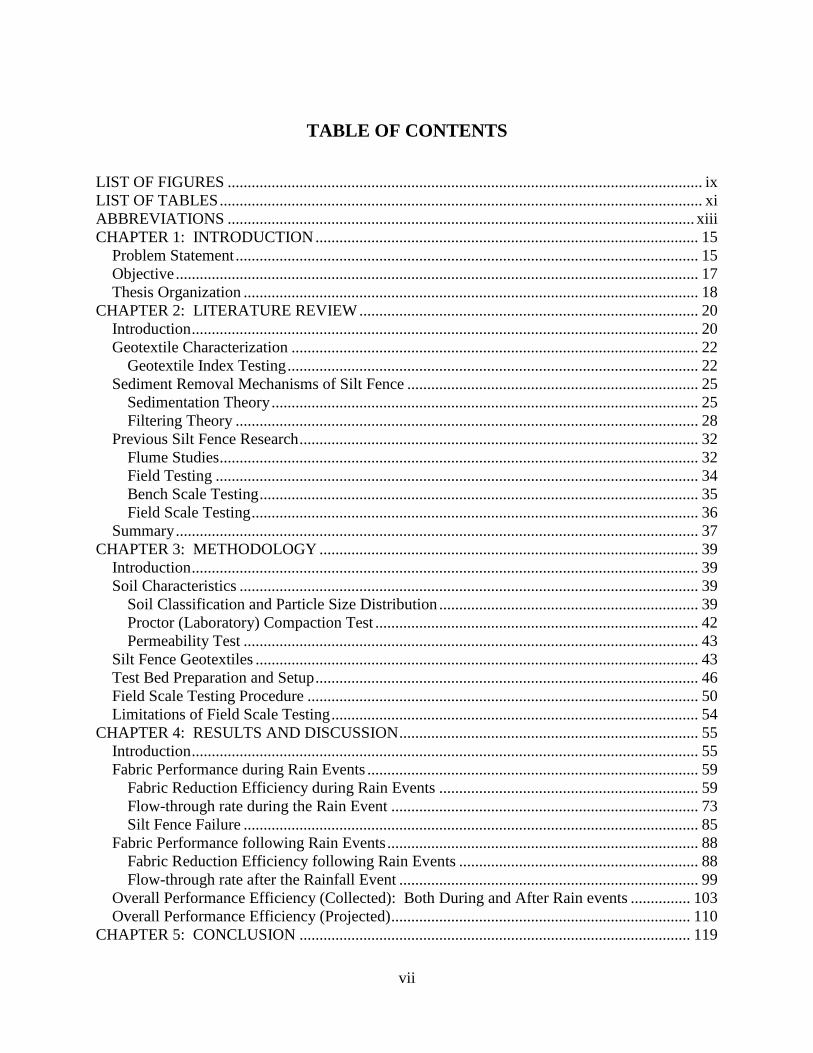
TABLE OF CONTENTS
LIST OF FIGURES ....................................................................................................................... ix LIST OF TABLES ......................................................................................................................... xi ABBREVIATIONS ..................................................................................................................... xiii CHAPTER 1: INTRODUCTION ................................................................................................ 15
Problem Statement .................................................................................................................... 15
Objective ................................................................................................................................... 17 Thesis Organization .................................................................................................................. 18
CHAPTER 2: LITERATURE REVIEW ..................................................................................... 20 Introduction ............................................................................................................................... 20
Geotextile Characterization ...................................................................................................... 22 Geotextile Index Testing ....................................................................................................... 22
Sediment Removal Mechanisms of Silt Fence ......................................................................... 25 Sedimentation Theory ........................................................................................................... 25 Filtering Theory .................................................................................................................... 28
Previous Silt Fence Research .................................................................................................... 32 Flume Studies ........................................................................................................................ 32
Field Testing ......................................................................................................................... 34 Bench Scale Testing .............................................................................................................. 35 Field Scale Testing ................................................................................................................ 36
Summary ................................................................................................................................... 37 CHAPTER 3: METHODOLOGY ............................................................................................... 39
Introduction ............................................................................................................................... 39 Soil Characteristics ................................................................................................................... 39
Soil Classification and Particle Size Distribution ................................................................. 39 Proctor (Laboratory) Compaction Test ................................................................................. 42
Permeability Test .................................................................................................................. 43 Silt Fence Geotextiles ............................................................................................................... 43 Test Bed Preparation and Setup ................................................................................................ 46 Field Scale Testing Procedure .................................................................................................. 50
Limitations of Field Scale Testing ............................................................................................ 54 CHAPTER 4: RESULTS AND DISCUSSION ........................................................................... 55
Introduction ............................................................................................................................... 55 Fabric Performance during Rain Events ................................................................................... 59
Fabric Reduction Efficiency during Rain Events ................................................................. 59
Flow-through rate during the Rain Event ............................................................................. 73 Silt Fence Failure .................................................................................................................. 85
Fabric Performance following Rain Events .............................................................................. 88 Fabric Reduction Efficiency following Rain Events ............................................................ 88 Flow-through rate after the Rainfall Event ........................................................................... 99
Overall Performance Efficiency (Collected): Both During and After Rain events ............... 103 Overall Performance Efficiency (Projected) ........................................................................... 110
CHAPTER 5: CONCLUSION .................................................................................................. 119

viii
APPENDIX A: ANALYSES OF SOIL TESTING ................................................................... 122 Soil Particle Distribution ........................................................................................................ 123 Compaction Testing ................................................................................................................ 124 Constant Head Permeability Testing ...................................................................................... 126
APPENDIX B: STATISTICAL ANALYSES OF PERFORMANCE EFFICIENCY .............. 127 Statistical Difference between Initial and Repeat Tests ......................................................... 128 Statistical Analysis of woven fabric performance efficiency verse nonwoven fabric
performance efficiency ........................................................................................................... 129 Performance Efficiency Based on Embankment Slope .......................................................... 131
Performance Efficiency Change of Test 1 to Test 2 ............................................................... 132 Change in Efficiency from During Rainfall to After Rainfall ................................................ 134
APPENDIX C: STATISTICAL ANALYSES OF FLOW-THROUGH RATE ........................ 135
Change in Flow Through Rate with Change in Embankment Slope ...................................... 136 Change in Flow Through Rate from Test 1 to Test 2 ............................................................. 137 Change in Flow-Through Rate due to Change in Rainfall Intensity ...................................... 138
Change in Flow Through Rate from During Rainfall to After Rainfall ................................. 139 APPENDIX D: MISCELLANEOUS ........................................................................................ 140
Time Dependent Efficiency and Flow Rate Results ............................................................... 141 Change in Performance Efficiency and Discharge Concentration with Time ........................ 152
LIST OF REFERENCES ............................................................................................................ 155

ix
LIST OF FIGURES
Figure 1 Mechanism of particle accumulation: (a) All pipes are opened (series filtration), (b) Few
pipes are obstructed (series and parallel filtration), (c) Filter cake formation above
completely obstructed pipes (Faure et al. 2006) .......................................................... 29 Figure 2 Particle size distribution curve ................................................................................... 41 Figure 3 Woven (ASR 1400) silt fence installed on a tilted test bed (Gogo-Abite 2012) ... 44
Figure 4 Nonwoven (BSRF) silt fence installed on a tilted test bed ...................................... 45 Figure 5 Pictures of test bed modifications (a) plywood for depth, and (b) visqueen to
protect plywood (Gogo-Abite 2012)......................................................................... 47 Figure 6 Test bed setup (a) woven fabric, rain gages, and meter stick installed, (b) test bed
compaction, (c) rainfall simulator and tilted test bed with nonwoven fabric
installed ....................................................................................................................... 49
Figure 7 Sample field test matrix for 10 percent slope (repeated for 33 and 10 percent
slopes) .......................................................................................................................... 50 Figure 8 Field scale testing: Downstream collection system ....................................................... 52
Figure 9 Woven fabric volume-weighted mean turbidity performance efficiency with
embankment slope ...................................................................................................... 65
Figure 10 Woven fabric volume-weighted mean SSC performance efficiency with
embankment slope ...................................................................................................... 65 Figure 11 Nonwoven fabric volume-weighted mean turbidity performance efficiency with
embankment slope ...................................................................................................... 67 Figure 12 Nonwoven fabric volume-weighted mean SSC performance efficiency with
embankment slope ...................................................................................................... 67 Figure 13 Trend of decreasing flow-through rate with increasing upstream SSC for both
woven and nonwoven fabrics .................................................................................... 77 Figure 14 Nonwoven fabric change in flow rate with change in ponding depth between Test 1
and Test 2 on a 33 percent slope .................................................................................. 81 Figure 15 Filter cake formation on nonwoven (a) untested fabric (b) cake formation after
completion of Test 1 (c) cake formation after completion of Test 2 ........................... 83 Figure 16 Silt fence failures: (a) pullout of fabric from middle stake on 33% slope (b)
overtopping on 33% slope (c) corner stake failure on 33% slope (d) corner stake
tear on 25% slope ....................................................................................................... 86 Figure 17 Time dependent average turbidity reduction efficiency and downstream value on
10 percent slope .......................................................................................................... 94 Figure 18 Woven fabric time dependent efficiency values and ponding depth on 25 percent
slope and 25 mm/h rainfall intensity ........................................................................ 96 Figure 19 Conceptual example of how the concentration gradient in ponding volume may change
over time after rainfall ends ......................................................................................... 98 Figure 22 Maximum dry unit weight of silty-sand soil .............................................................. 124 Figure 23 Time dependent average turbidity performance efficiency and downstream value on 25
percent slope............................................................................................................... 152 Figure 24 Time dependent average turbidity performance efficiency and downstream value on 33
percent slope............................................................................................................... 153

x
Figure 25 Time dependent average SSC performance efficiency and downstream value on 10
percent slope............................................................................................................... 153 Figure 26 Time dependent average SSC performance efficiency and downstream value on 25
percent slope............................................................................................................... 154
Figure 27 Time dependent average SSC performance efficiency and downstream value on 33
percent slope............................................................................................................... 154

xi
LIST OF TABLES
Table 1 ASTM Specifications for Silt Fence Fabrics ................................................................... 23 Table 2 Summary of soil particle classification analyses ....................................................... 40 Table 3 Comparison of woven and nonwoven fabrics ............................................................. 45 Table 4 Woven fabric test volume-weighted mean turbidity and SSC results during the rain
event ............................................................................................................................. 61
Table 5 Nonwoven fabric test volume-weighted mean turbidity and SSC results during the
rain event ..................................................................................................................... 62 Table 6 Woven fabric turbidity and SCC performance efficiency from Test 1 to Test 2 .... 70 Table 7 Nonwoven fabric turbidity and SSC performance efficiency from Test 1 to Test 2
...................................................................................................................................... 72 Table 8 Summary results for flow-through rate of woven and nonwoven fabrics during the
rain event ..................................................................................................................... 74 Table 9 Average flow-through rate occurring during the rain event between Test 1 and Test
2 for both woven and nonwoven fabrics .................................................................. 79
Table 10 Woven fabric test volume-weighted mean turbidity and SSC results after the rain
event ............................................................................................................................. 90
Table 11 Nonwoven fabric test volume-weighted mean turbidity and SSC results after the
rain event ..................................................................................................................... 91 Table 12 Average flow-through rates during and after rain events ...................................... 100
Table 13 Estimated average hydraulic detention time of the ponding volume ................... 101 Table 14 Overall performance efficiency of woven silt fence (collected samples) ............ 105
Table 15 Overall performance efficiency of nonwoven silt fence (collected samples) ...... 106 Table 16 Summary of volume-weighted mean turbidity and SCC performance efficiency
.................................................................................................................................... 108 Table 18 Projected overall woven fabric performance efficiency .............................................. 112
Table 19 Projected overall nonwoven fabric performance efficiency ........................................ 113 Table 20 Summary of overall projected performance efficiency ............................................... 115 Table 21 Discharge water volume both during and after rainfall ............................................... 117 Table 22 Materials finer than 75-μm by washing analysis ......................................................... 123
Table 23 Sieve analysis ............................................................................................................... 123 Table 24 Hydrometer analysis .................................................................................................... 123 Table 25 Maximum dry unit weight for silty-sand ..................................................................... 125 Table 26 Silty-sand soil permeability ......................................................................................... 126 Table 27 Wilcoxon rank sum test: Woven fabric significant p-values between initial and repeat
tests ............................................................................................................................. 128 Table 28 Wilcoxon rank sum test: Nonwoven fabric significant p-values between initial and
repeat tests .................................................................................................................. 128 Table 29 Wilcoxon rank sum test: Significant p-values for nonwoven fabric having greater
performance efficiency than woven fabric during the rain event .............................. 129 Table 30 Wilcoxon rank sum test: Significant p-values for nonwoven fabric having greater
performance efficiency than woven fabric after the rain event .................................. 129

xii
Table 31 Wilcoxon rank sum test: Significant p-values for nonwoven fabric having an overall
greater performance efficiency than woven fabric..................................................... 129 Table 32 Wilcoxon rank sum test: Significant p-values for woven and nonwoven fabric having
significantly different projected overall performance efficiency ............................... 130
Table 33 Single factor ANOVA: Woven fabric statistical difference of volume-weighted
mean efficiency between different slopes .............................................................. 131 Table 34 Single Factor ANOVA: Nonwoven fabric statistical difference of volume-weighted
mean efficiency between different slopes .................................................................. 131 Table 35 Wilcoxon rank sum test: Woven fabric statistical difference of turbidity performance
efficiency between Test 1 and Test 2 ......................................................................... 132 Table 36 Wilcoxon rank sum test: Woven fabric statistical difference of sediment performance
efficiency between Test 1 and Test 2 ......................................................................... 132
Table 37 Wilcoxon rank sum test: Nonwoven fabric statistical difference of turbidity
performance efficiency between Test 1 and Test 2 .................................................... 133 Table 38 Wilcoxon rank sum test: Nonwoven fabric statistical difference of sediment
performance efficiency between Test 1 and Test 2 .................................................... 133 Table 39 Wilcoxon rank sum test: Woven fabric statistical difference of perormance
efficiency during and after rainfall ......................................................................... 134 Table 40 Wilcoxon rank sum test: Nonwoven fabric statistical difference of performance
efficiency from during rainfall to after rainfall .......................................................... 134
Table 41 Wilcoxon rank sum test: Woven fabric statistical difference for flow through rate
between slopes .......................................................................................................... 136
Table 42 Wilcoxon rank sum test: Nonwoven fabric statistical difference for flow through rate
between slopes ........................................................................................................... 136
Table 43 Wilcoxon rank sum test: Statistical difference of flow-through rate between Test 1 and
Test 2 .......................................................................................................................... 137
Table 44 Single factor ANOVA: Woven fabric statistical difference of flow-through rate
based on different rainfall intensities ..................................................................... 138 Table 45 Single factor ANOVA: Nonwoven fabric statistical difference of flow through rate
based on different rainfall intensities ......................................................................... 138 Table 46 Wilcoxon rank sum test: Statistical difference of flow through rate between during and
after the rain event ...................................................................................................... 139 Table 47 Woven fabric time dependent efficiency and flow-through rate results on 10% slope 141
Table 48 Woven fabric time dependent efficiency and flow-through rate results on 25% slope 143 Table 49 Woven fabric time dependent efficiency and flow-through rate results on 33% slope 144 Table 50 Nonwoven fabric time dependent efficiency and flow-through rate results on 10% slope
.................................................................................................................................... 146
Table 51 Nonwoven fabric time dependent efficiency and flow-through rate results on 25% slope
.................................................................................................................................... 148 Table 52 Nonwoven fabric time dependent efficiency and flow-through rate results on 33% slope
.................................................................................................................................... 150

xiii
ABBREVIATIONS
AOS = apparent opening size (mm)
AR = after rainfall
bTB = test bed width (m)
dp = particle diameter (m)
DR = during rainfall
E = efficiency (%)
EFF = effluent
g = gravitational constant (m/s2)
INF = influent
K = hydraulic conductivity (cm/s)
mg/L = milligrams per liter
n = number of samples taken during the rain event
NTU = nephelometric turbidity unit
m = number of samples taken after the rain event
PD = ponding depth at face of silt fence (cm)
q = flow-through rate of silt fence (L/m2/h)
S = embankment slope (%)
SSC = suspended sediment concentration (mg/L)
t = time (h)
T = turbidity (NTU)
TS = total solids (mg/L)
V = volume of water (L)
vc = critical settling velocity (cm/min)
vs = particle settling velocity (m/s)
WMEC = weighted mean influent concentration (mg/)
WMET = weighted mean effluent turbidity (NTU)
WMIC = weighted mean influent concentration (mg/L)
WMIT = weighted mean influent turbidity (NTU)
ρ = density (kg/m3)
τ = hydraulic detention time (min)

xiv
μ = dynamic viscosity (kg/m/s)

15
CHAPTER 1: INTRODUCTION
Problem Statement
According to the United States Environmental Protection Agency (USEPA 2012), soil
erosion is the largest contributor to nonpoint source pollution in the United States. It is estimated
that over 4 billion tons of sediment are discharged into ponds, rivers, and lakes in the United
States each year and approximately 10 percent of this amount is due to erosion occurring from
land undergoing construction activities or land development (FDEP 2008). Eroded sediment can
cause a number of environmental and economic problems. Eroded sediments that carry nutrients
such as phosphorus and nitrogen can lead to the development of algal blooms and lake
eutrophication. If the eroded sediments are small and remain suspended in the water body, they
can block sunlight from penetrating the water body, disrupting photosynthesis. If, however, the
eroded sediments are large, they may settle to the bottom of the water body, reducing its storage
capacity and possibly increasing its flood frequency (Harbor 1999).
On construction sites, the erosion rate and the potential for sediment discharge are
greatest during the active construction phase of the project (Owens et al. 2000). Active
construction causes increase in the erosion rates when compared to the pre- and post-
construction conditions due to the loss of protective vegetative cover. Due to large erosion rates
during active construction, the soil loss from these sites over even a short period can rival losses
that would have taken decades to erode naturally (EPA 2007). For this reason it is important to
limit the sediment load that has the potential to be discharged from the construction site during
the active phase. A number of technologies including both erosion and perimeter control are

16
used for this purpose. However, silt fence in particular, is considered an industry standard for
use on construction sites (Faucette et al. 2008)
Numerous research studies have been conducted on the use of silt fence as a perimeter
sediment control. Majority of studies involve controlled laboratory flume tests (Britton et al.
2000, Farias et al. 2006, Risse et al. 2008) and outdoor tests performed in the field on
construction sites with real monitored storm events (Barrett et al. 1995, Faucette et al. 2008).
Although flume studies have shown that silt fence performs well in removing sediment from
concentrated flows, these tests do not correctly simulate the field conditions of the use and
performance of silt fence. In the field, the composition of the eroded soil is different from the
parent soil and will contain more silt and less sand particles due to the higher erosion rate of
these particles in comparison to sand particles (FDEP 2008). Rainfall collision with the ponding
volume upstream of the silt fence will also disrupt settling within the pond during rainfall. These
difference between the flume tests and actual field conditions lead to an overestimation of the silt
fence performance.
The field studies evaluated the discharge concentration through the silt fence by
comparing either to the known erosion rate of the soil or to the upstream concentration in the
ponding volume after the rain event. Evaluating silt fence on a time dependent basis during
rainfall however is not possible during these tests. For this reason, and due to the random and
uncontrollable nature of real storm events and field conditions, it has been difficult to evaluate
silt fence performance in the field. Both flume and field studies have shown the need to further
evaluate silt fence in conditions which cannot only simulate the actual use and performance of
silt fence in the field but can do so in a controlled environment.

17
Objective
The research presented in this thesis has been conducted in order to evaluate silt fence
performance under varying field conditions. The study was performed on a tilted test bed filled
with a silty-sand soil (AASHTO classification type A-2-4) set to different degrees of slope and
subjected to varying intensities of simulated rainfall. The research is a continuation of previous
research project conducted by Gogo-Abite and Chopra (2013) at UCF Stormwater Laboratory.
Performance evaluation was completed on two silt fence fabrics, a woven (ASR 1400) fabric and
a nonwoven (BSRF) fabric. These silt fence fabrics were installed separately on the tilted test
bed and subjected to simulated rainfall events of 27, 76, and 127 mm/h (1, 3, 5 in/h) and to
differing embankment slopes of 10, 25, and 33 percent.
The objective of this study is to evaluate the performance of both silt fence fabrics
under field conditions and to quantify the turbidity and suspended solids performance efficiency
as well as the flow-through rates of the fabrics under different embankment slope and rainfall
intensity. Additional objective will also be to compare the performance of both silt fence fabrics.
The woven fabric used in this study is the traditional monofilament geosynthetic typically used
on construction sites. Previous studies on this fence have shown its inability to achieve required
water quality performance targets (Barrett et al. 1995, Faucette et al. 2008, Gogo-Abite and
Chopra 2013). The nonwoven fabric was designed to reduce turbidity and suspended solids and
permit a greater flow-through rate of the fabric than the traditional woven monofilament silt
fence (Risse et al. 2008). The performance efficiency of the nonwoven fabric should be greater
than the woven fabric due to the pore sizes of both fabrics. Previous studies by Gogo-Abite and
Chopra (2013) show that the apparent opening sizes (AOS) of the woven and nonwoven fabrics

18
are 0.70 mm and 0.21 mm, respectively. This thesis aims to study if the difference in AOS
between the silt fence materials causes a significant difference in the performance efficiency. It
is also of interest to see if any removal occurs by filtration at all with the woven fabric, as the
AOS of this fabric is actually larger than 100 percent of the soil particle sizes used in the study.
The study further seeks to evaluate silt fence on a time dependent basis and determine if
a difference in performance exists between removal encountered during and after rainfall. It will
be interesting to see if changes in the embankment slope and rainfall intensity affect the removal
mechanisms occurring for each of these processes over the entire duration of treatment.
Thesis Organization
The research was conducted in order to investigate the performance of silt fence
materials under field scale conditions and to quantify the differences in performance occurring
both during and after rainfall events. In order to present the research, an introduction is
presented in Chapter 1 that discusses the significance of the study, objectives of the research, and
the thesis organization.
Provided in Chapter 2 is a review of literature related to silt fence. The review
discusses index properties of geotextiles that are relevant to silt fence, the theory that forms the
basis for the types of filtration and sedimentation that occurs in silt fence treatment, and a review
of previous flume, field, bench-scale, and field-scale studies that have been completed on silt
fence.

19
After the literature review, the methodology is discussed in Chapter 3. In this chapter,
details of the properties of the soil type, the properties of the silt fence, the field scale testing
procedure, and the limitations of this testing procedure are presented.
Following the methodology, the results of the field scale performance testing of silt
fence fabrics is presented in Chapter 4. The chapter is divided into three main sections;
discussions on the performance evaluation of silt fence during the rain event, after the rain event,
and over the entire duration of treatment.
The fifth and final chapter presents summary, conclusions, and recommendations of the
field scale results of the study.

20
CHAPTER 2: LITERATURE REVIEW
Introduction
Erosion and soil losses from unprotected construction sites are one of the leading
sources of sediments found in water bodies across the U.S. (Hayes et al. 2005). Due to the
natural vegetative cover being remove from the soil, it is not uncommon for these sites to have
soil erosion rates as high as 2 to 40,000 times greater than the preconstruction conditions (Harbor
1999). The increase in erosion has led to approximately 80 million tons per year of sediment
being deposited to lakes, rivers and waterways in the United States due in part to inadequate
preventive measures during the construction phase (Harbor 1999).
To control sediment transfer from construction sites, the prevention of erosion should
be the primary focus. The common erosion control practices are temporary seeding, mulching,
geotextile matting, chemical stabilization, and many other erosion control practices (USEPA
2011). These practices are the first line of defense in controlling sediment detachment from the
exposed soil in construction sites by preventing erosion. The last line of defense in controlling
sediment emissions from leaving the construction site are perimeter controls. These devices are
used on the perimeters of construction sites and are used to intercept concentrated runoff water
and remove its sediment. Thus, retaining the sediments on site and keeping them from entering
offsite areas such as water bodies, roadways, and storm drains. Some of the sediment control
measures include silt fence, filter socks, temporary diversion berms, temporary fill diversions,
temporary slope drains, and floating turbidity barriers (FDEP 2008).

21
Of the perimeter control devices, silt fence is considered the current industry standard
for perimeter control on construction sites (Faucette et al. 2008). Silt fence is defined as, “a
temporary sediment barrier consisting of a filter fabric stretched across and attached to
supporting posts and entrenched” (FDEP 2008). The supporting posts are usually made of wood,
at least 2.5 x 5.0 centimeter (1 x 2 inch) in cross sectional area, and are a minimum of 0.9 meter
(3 feet) in length. The posts are buried a minimum of 0.3 meter (1 foot) into the ground, but they
may not exceed 0.9 meter (3 feet) in height above the surface. This maximum height
requirement is because larger fence heights may cause the silt fence to impound a volume of
water great enough to cause the stakes to fail. The stake posts are then installed at a maximum of
3 meter (10 feet) apart if the fence is used without a wire support. If no wire support is used,
then the stakes are spaced a maximum of 1.8 meter (6 feet) apart.
In most cases, silt fence is installed around the perimeter of the construction site so that
it can intercept all runoff water which has the potential to flow off of the site. The silt fence
works by first acting as a physical barrier that reduces the velocity of the runoff water. Then,
depending on the type of silt fence geotextile and the soil characteristics, the silt fence filters the
sediment from the concentrated runoff water. As the silt fence starts to filter the sediment, the
particles begin to clog the fabric, decreasing the ability of the silt fence to transmit water. When
the flow-through rate of the silt fence starts to decrease, the runoff water starts to pond upstream
of the silt fence, creating a ponding volume of accumulated runoff. Then, depending on the
flow-through rate of the fabric, the suspended particles within the ponding volume may settle out
of suspension before the water is discharged through silt fence. Thus, silt fence removes

22
sediment by two mechanisms, filtration through the fabric and sedimentation of suspended
particles.
The remainder of this literature review discusses the types and properties of geotextiles
used in silt fence applications, the theory of the sediment removal mechanisms of silt fence, and
previous research which has been completed on silt fence.
Geotextile Characterization
ASTM (1987) defines geotextile as “any permeable textile used with foundation, soil,
rock, or any other geotechnical engineering related material as an integral part of a manmade
product, structure, or system.” Silt fence therefore qualifies as a geotextile. These permeable
textiles can be categorized as either woven or nonwoven. The woven geotextiles have relatively
uniform rectangular openings and are manufactured by weaving synthetic fibers into flexible and
porous fabrics (Koerner 2012). The fibers are interwoven perpendicular to each other; the
horizontal elements are referred to as weft fibers and the longitudinal elements are referred to as
warp fibers (Zhang et al. 2013). Unlike woven fabrics, which have relatively uniform openings,
the pore structure and morphology of nonwoven geotextiles can be highly complex (Rawal and
Saraswat 2011). These geotextiles are manufactured by needle punching or melt bonding (Lamy
et al. 2013) with their fibers oriented in multidirectional and random arrangements (Fisher and
Jarrett 1984).
Geotextile Index Testing
With the broad use of silt fence geotextiles in the industry, it is necessary to determine
the properties of individual fabrics in reference to other fabrics and to recommended values. In

23
this regard ASTM D6461 (2007) has provided a list of current standard test methods in order to
determine the index properties of silt fence fabrics. These index properties which are of interest
in silt fence are: grab-tensile strength, ultraviolet (UV) stability, apparent opening size (AOS),
and fabric permittivity. The recommended specifications for these index properties for silt fence
are listed in Table 1. The details of these tests were not discussed in this thesis, however, a brief
discussion of how these parameters affect silt fence performance in the field is discussed below.
TABLE 1 ASTM SPECIFICATIONS FOR SILT FENCE FABRICS
Property Direction ASTM Test Methods Units ASTM D6461
Grab strength Machine
D 4632 N 400
X-Machine 400
Permittivity D 4491 sec-1 0.05
AOS D 451 mm 0.6
Ultraviolet stability D 4355 % Retained
strength
70% after 500 h of
exposure
Permittivity is an indicator of the amount of water that can pass through a geotextile and
is defined as the “volumetric flow rate of water per unit cross sectional area per unit head under
laminar flow conditions, in the normal direction through a geotextile” (ASTM D4491 2009).
Permittivity has been shown to be a good indicator of the clogging potential for nonwoven
geotextiles where less clogging of the geotextile is observed with increasing permittivity
(Aydilek and Edil 2003). However, permittivity is not a good indicator of the potential flow-
through rate of the geotextile that will be encountered in the field (Weggel and Ward 2012). In
the field, the permittivity of silt fence has been shown to decrease due to the impingement of
sediment on the fabric.

24
The AOS of the fabric is a measure of the largest pore sizes of the fabric. AOS is found
by running beads of a certain diameter through the fabric; and the AOS is the bead size for which
5% or less of the beads pass through. AOS may give an indication of the particle size that can be
removed through filtration by the fabric. However in the field, pressure brought on by ponding
water induces tensile strain on the silt fence that can result in larger pore openings (Gogo-Abite
and Chopra 2013). Since AOS has been shown to have a proportional linear relationship to
tensile strain (Wu et al. 2008), AOS may not give an accurate representation of the sediment
removal potential of silt fence fabrics in the field.
UV stability is a very important property for silt fence. It is not uncommon for silt
fence to remain on construction sites for long periods of time. Sunlight has been shown to be a
dominant degradation factor for many geotextiles (Suits and Hsuan 2003), and as such, solar
radiation has the potential to degrade silt fence, reducing its ability to function properly. Solar
radiation, in the form of photons, has energies, which range from 300 to 390 kJ/mol. Making
them sufficiently strong enough to degrade polymer carbon (C-C) and hydrogen (C-H) bonds of
the silt fence fabric, which range from 340 to 420 kJ/mol (Suits and Hsuan 2003). For this
reason, UV stabilizers are added to protect polymers and prolong their lifetimes when they are
used in exposed applications. In silt fence, ultraviolet ray inhibitors and stabilizers are used, and
must be designed to provide a minimum of 6 months solar radiation protection (FDEP 2008).
Even when silt fences are UV stabilized, it has still been shown that their tensile strength and
strain at break continue to decrease with exposer to UV, however, the rate of degradation is
greatly reduced (Dierickx and Van Den Berghe 2004).

25
Sediment Removal Mechanisms of Silt Fence
The two major mechanisms of sediment removal by silt fence occurs by particle
sedimentation by gravity and by filtration of particles through the fabric. Knowledge of both
sedimentation and filtration theory is necessary in order to understand the mechanisms of
sediment removal by silt fence. Discussed in the following two sections is the basic theory
behind these mechanisms.
Sedimentation Theory
One of the most important, cost effective, and widespread treatments of suspended
solids removal from water is by sedimentation (Barrett et al. 1995). Sedimentation during silt
fence treatment occurs due to the formation of a ponding water volume caused by the flow rate
of runoff water being greater than the flow rate of water through the silt fence. The ponding
water volume, which is concentrated with eroded sediments, acts as a small dynamic
sedimentation pond. Sedimentation will occur if the suspended particles in the pond are large
and dense enough to settle out by gravitational forces in a time that is less than the critical
settling velocity of the system (Howe et al. 2012). The critical particle settling velocity is related
to both the ponding depth and the hydraulic detention time and is given by the following
expressions in Equations 1 and 2:
𝑣𝑐 =𝑃𝐷
𝜏 (1)
𝜏 = 3(104)∗𝑃𝐷
𝑞∗𝑆 (2)

26
where 𝑣𝑐 is the critical settling velocity (cm/min); PD is the ponding depth at the fence face
(cm); τ is the hydraulic detention time (min); q is the flow-through rate of the fence (L/m2-hr);
and S is the slope percent of the ground which is in contact with the ponding water volume (%).
The hydraulic detention time refers to the amount of time it would take for the entire ponding
volume to flow through the silt fence.
In order for sedimentation to occur, the particle settling velocity must be greater than
the critical settling velocity. The particle settling velocity is dependent on a number of factors,
one of which is the type of particle suspension within the pond. In total, there are four particle
suspension classifications, however only two are relevant to silt fence. They are, Type 1
(Discrete) particle settling and Type III (Hindered) settling.
Type I Particle Settling
Type 1 particle settling occurs in dilute solutions where individual particles do not
interact with each other. Under these conditions each individual particle settles based on their
own size and density (Howe et al. 2012). Assuming laminar flow conditions, the settling
velocity is given by Stokes’ Law as
𝑣𝑠 = 𝑔∗𝑑𝑝
2∗(𝜌𝑝− 𝜌𝑤)
18∗ 𝜇 (3)
where 𝑣𝑠 is the particle settling velocity (m/s); g is the gravitational constant (m/s2); 𝑑𝑝 is the
particle diameter (m); 𝜌𝑝 is the density of particle (kg/m3); 𝜌𝑤 is the density of water (kg/m3);
and 𝜇 is the dynamic viscosity (kg/m-s). Based on Equation 3, settling velocity is proportional to
both the particle diameter and density. For this reason it is unlikely that very small particles such

27
as silts and clays will be removed by settling in silt fence applications due to their low settling
velocities (Arjunan et al. 2006).
Type III Settling
In the literature it is common for stokes law to be referred to in discussions on silt fence
in conjunction with sedimentation mechanisms even when the solids concentrations are large.
Under high concentrations however, solutions are not dilute enough, and particle interactions
restrict the settling potential of the solution. Under these conditions, Type 1 settling and stokes
law are not justified, and the governing settling mechanism is instead Type III, or hindered
settling.
In type III settling, the settling velocities of particles are affected by the presence of
other particles due to particle collisions and frictional forces (Howe et al. 2012). During this
type of settling, a blanket of particles forms with a distinct interface due to particle aggregation
(Howe et al. 2012). This causes the settling velocity of larger particles to be reduced, however
the settling velocity of smaller particles, such as silts and clays, are likely to be increased if they
are caught within the settling blanket. Under Type III settling, the settling velocity is also
dependent on the soil type and the solids concentration. As the solids concentration increases,
the settling velocity decreases (Howe et al. 2012). Therefore, as the solids concentration
increases, the potential removal by sedimentation will decrease. However, a larger solids
concentration will increase the potential for removal by filtration.

28
Filtering Theory
An understanding of the basic theory of filtration and how it applies to silt fence
applications is presented in this section. The discussion is broken up into three parts; how the
filtration mechanism occurs in geotextiles, how filtration of the fabric affects the flow-through
rate of the geotextile, and a brief discussion on different types of geotextile/soil interactions.
Filtration Mechanism
A discussion on the mechanics of filtration in geotextile applications is described by
Faure et al. (2006), a summary of this discussion is presented below.
In a silt fence fabric, small openings in the fabric act as small pipes. Many of these
openings in the fabric make up a pipe network where water and fine particles can flow through.
The flow-through rate of this system is equal to the sum of the flow-through rates in each
individual pipe in the network. Depending on the geotextile properties such as pore opening size
and fabric thickness, as well as soil characteristics of the slurry, particles in suspension may
settle or be caught within the individual pipes. Filtering of this nature is referred to as parallel
filtering (Figure 1a). Different pipes will undergo parallel filtration at different rates depending
on the properties of each pipe. Some pipes may experience an excessive amount of parallel
filtration and become obstructed; causing additional particles to pile up in the pipe. This is
called series filtration (Figure 1b). If series filtration causes a pipe to become entirely filled with
particles, additional particles will start to accumulate on the outside of the fabric and will form a
filter cake (Figure 1c).

29
As particles continue to be filtered by the fabric, the impinged particles reduce the pore
sizes of the pipes. The reduction in pore size limits the ease with which water can flow through
the fabric and also increases the filtration ability of the fabric. These mechanism are discussed in
more detail in the following sections.
FIGURE 1 MECHANISM OF PARTICLE ACCUMULATION: (A) ALL PIPES ARE OPENED (SERIES
FILTRATION), (B) FEW PIPES ARE OBSTRUCTED (SERIES AND PARALLEL FILTRATION), (C)
FILTER CAKE FORMATION ABOVE COMPLETELY OBSTRUCTED PIPES (FAURE ET AL. 2006)
Effect of Filtration on Flow Rate
The purpose of silt fence is to remove soil particles from a concentrated slurry, while
still permitting the flow of water through it. However, as soil particles accumulate both within
and on the fabric, both the pore sizes of the fabric and the ability of the fabric to transmit water
are reduced (Fisher and Jarrett 1984, Britton et al. 2000, Risse et al. 2008). The decrease in
flow-through rate causes an increase in the accumulation of ponding water upstream of the silt

30
fence. Although this will increase the hydraulic detention time of the system, allowing
additional time for the sedimentation mechanism to take place, excessive ponding could also
cause the ponding water to overtop the silt fence (Farias et al. 2006). The additional pressure
brought on by large ponding depths could also cause the silt fence to fail. For these reason silt
fence must be prevented from becoming clogged with sediment and there must exist a
compromise between the fabrics ability to retain soil and its ability to transmit water (Fisher and
Jarrett 1984).
Sansone and Koerner (1992) defined clogging of the fabric due to particle filtering as,
“the reduction of the geotextile’s permeability to the point where flow through it results in the
hydraulic system’s nonperformance.” The potential of a filter to become clogged depends on
both the fabric characteristics and the parent/eroded soil characteristics. Studies by Aydilek and
Edil (2003) have shown that the permittivity of the geotextile is the “main pore structure
parameter” that affects its clogging. Where increases in the initial permittivity of the geotextile
lead to a decrease in the potential of the fabric to become clogged with sediment. However,
according to Weggel and Dortch (2012) the permittivity of the geotextile is only important
initially. What controls the flow-through rate of the fabric and the ability of the fabric to become
clogged is the geotextile/soil characteristics and the nature of the filter cake that forms on the
fabric. In general, greater reductions in flow rate also occur in heavier and thicker geotextiles
due to the increased available volume for binding and impregnation in these fabrics (Farias et al.
2006).

31
Geotextile/Soil Interaction
Overall, the soil characteristics relative to the geotextile’s characteristics are the most
important parameters affecting both the potential for fabric clogging and the ability of the fabric
to filter the concentered slurry. In general, soils that contain particles that are for the most part
larger than the geotextiles opening pores will operate with high efficiency and will not clog, but
will build a stable filter cake on the geotextile (Sansone and Koerner 1992). The filter cake will
continue to thicken over time as additional particles adhere to the filter cake, however, the flow
rate will remain relatively constant and will be dependent on the permittivity of the accumulated
filter cake (Sansone and Koerner 1992, Weggel and Ward 2012).
For soils where all the particles are smaller than the pore size of the fabric, the silt fence
will operate with a low filtering efficiency, but clogging is not likely to occur (Sansone and
Koerner 1992). Soils consisting of primarily silts and clays fall into this category. For this
reason silt fence is generally not an effective filter of silty and clayey soils (Fisher and Jarrett
1984).
The last soil type consists of particles that are both larger (i.e. sands) and smaller (i.e.
silts and clays) than the pore size openings of the fabric. These types of soils can lead to
excessive clogging of the geotextile depending on how well graded the soil is (Sansone and
Koerner 1992). Initially the larger sand particles are filtered by the fabric, decreasing the pore
sizes of the fabric. This leads to smaller particles also being filtered by the fabric. As the pore
size of the fabric continues to decreases due to smaller and smaller particles being filtered, the
ability of the system to transmit water also decreases. In this fashion, the fabric may become

32
completely clogged over time, and the flow-through rate of the fabric will be severely
diminished.
Previous Silt Fence Research
This section describes previous research that has been conducted on the performance
efficiency of silt fence. These studies were conducted in a number of ways, including;
monitoring silt fence in the field under actual storm events, bench and field scale studies with
simulated rainfall, and flume studies. A summary of previous research on silt fence that has been
conducted these three types of studies is presented in this section.
Flume Studies
A flume study is a controlled test performed in the laboratory. The test is conducted by
mixing a mass of parent soil with a certain volume of water to create concentrated slurry. The
concentration of the slurry becomes the influent concentration to the flume. The slurry is
pumped into the flume and flows down the flume, where it is exposed to a silt fence that sits at
the bottom of the flume. The concentration that is discharged through the silt fence is the
effluent concentration. The efficiency of the silt fence is then calculated by comparing the
effluent concentration to the initial influent concentration.
Farias et al. (2006) tested four nonwoven silt fence fabrics of various opening sizes and
thicknesses using flume tests. The slope of the flume was not stated. The opening sizes of the
geotextiles ranged from 0.11 mm to 0.60 mm and the thickness of the geotextiles ranged from
0.8 mm to 4.5 mm. Three soil types were used with a sediment concentration of 10,000 mg/L;
namely two silty soils and one sandy soil. Results showed that sediment reduction under these

33
conditions ranged from 93 to 96 percent for all fabrics and soil combination pairs tested. The
opening size and thickness of the fabrics did not affect the reduction efficiencies; however, these
parameters did affect the flow rate. The thicker and less opened geotextiles had the greatest flow
rate reductions, whereas the lighter and more opened geotextile presented the smallest reductions
in flow rate (Farias et al. 2006). Thus, the study concluded that the thicker and less opened the
geotextile, the easier it would be for the fabric to become clogged; reducing its ability to transmit
water. Results from this study also showed that silt fence, even those with large opening sizes of
0.60 mm could efficiently remove silty soils.
Risse et al. (2008) also tested silt fence fabrics using flumes. The flume was raised to a
grade of 8 percent, and both a woven and a nonwoven fabric were tested. The nonwoven fabric
was a polyester silt fence that was introduced by Silt-Saver Inc. and is called a Belted Silt
Retention Fence (BSRF). Three soils, Tifton sand, Fannin silt, and Cecil clay loam, were used at
concentrations of approximately 3000 mg/L and 6000 mg/L. Sediment removal efficiencies
under all test conditions were at least 87 percent, indicating high removal for both fabrics under
all soil conditions. Risse et al. (2008) concluded that the high sediment removal efficiencies
were attributed to the low slope gradient and the extended holding time created under these
conditions, and that much of the released sediment settled out of suspension prior to reaching the
silt fence. Risse et al. (2008) also investigated the performance of silt under a large slope of
58%, and found that sediment removal still remained high (upwards of 80%). So it seems the
low slope gradient did not have that large of an effect on reduction after all. Although sediment
removals were high, turbidity reduction was significantly lower and ranged from 25 to 58
percent for the woven fabric and 55 to 90 percent for the nonwoven fabric.

34
Risse et al. (2008) also found that the flow rate through the fabrics decreased with
increasing influent concentration. These results indicate that soil particles have an influence on
the flow rate and suggested that the sediment trapped behind the fence was controlling the flow
rate more than the fence itself (Risse et al. 2008). Note that flow rates were significantly higher
with the sandy soil than the silty or clayey soils. The reason for this may be that the silty and
clayey soils have better graded distribution of soil particle sizes than the sandy soil; which
consisted mostly of sand sized particles. As was discussed in the section on filtering theory, the
well-graded soils can progressively clog silt fence fabrics due to progressively smaller sediments
clogging the pores of the filter.
Results from this study show that silt fence is capable of high sediment removals of silt,
sand, and clay loams. However, it is less effective in removing turbidity from these soil types.
The lower turbidity removal shows that the larger sediment particles most likely settled out of
suspension, while the smaller particles did not, and were discharged through the silt fence.
While the large sediment particles that settled out affect the mass of sediment discharged and to
some extent the turbidity, the smaller silt and clay particles affect the turbidity to a larger extent
(Bilotta and Brazier 2008) . However, due to their small size, they do not contribute to the total
solid mass to the extent that the larger particles do. This explains why turbidity removal was
lower.
Field Testing
Barrett et al. (1995) investigated the performance of silt fences under controlled
conditions in an outdoor flume as well as in the field under actual rainfall on active construction
sites. The flume slope was 0.33% and a slurry was made using Austin silty clay soil at a

35
concentration of 3000 mg/L. Sediment removal efficiencies ranged from 68 to 90 percent. The
high removal efficiencies were attributed to the geometry of the upstream ponding volume; the
low slope allowed adequate detention time for the suspended solids to settle out before reaching
the silt fence. Barrett et al. (1995) was able to show that silt fence was capable of removing silt
and clay sized particles under low sloped conditions. The mechanism for removal however was
not due to filtering through the silt fence, but through settling.
Barrett et al. (1995) also investigated silt fence performance in the field by monitoring
installations on active highway construction sites. However, information regarding the intensity,
duration, or quantity of each rainfall event was not obtained due to limited equipment. In total
six different sites were monitored, two of which used nonwoven fabrics and four of which used
woven fabrics. Over the course of seven rainfall events, the average removal efficiencies ranged
from negative 61 to 54 percent with a median of 0 percent and negative 32 to 49 percent with a
median of 2 percent for sediment and turbidity, respectively. According to Britton et al. (2000),
due to the magnitude and random nature of the measured concentration, the instantaneous
comparison of these values were not valid. An accurate estimate of the overall operation
efficiency would need to be approximated by collecting samples over the entire duration of a
storm event in order to determine the total load into and out of the control device over time.
Bench Scale Testing
Faucette et al. (2008) investigated the performance of silt fence using bench scale tests.
The bench scale testing bed was 100 cm length by 35 cm width by 25 cm depth (39 in × 14 in ×
10 in). The test beds were filled with a silt loam and raised to a 10 percent slope and exposed to
rainfall intensity of 7.45 mm/h (2.93 in/h). Removal efficiencies ranged from 78 to 87 percent

36
and from 54 to 76 percent for sediment concentration and turbidity, respectively. This result
shows further that silt fence does not reduce turbidity as well as it does sediment. The results
also showed that even though silt fence removed sediment from 78 to 87 percent, effluent
concentrations were still high. Effluent sediment concentrations ranged from 9,000 mg/L to
14,000 mg/L despite the large reduction efficiencies, which indicates that the erosion rate of the
soil was high during the bench scale testing.
Field Scale Testing
Due to the uncontrollable nature of actual field testing on construction sites and the
need to further investigate the performance of silt fences under these conditions, Gogo-Abite and
Chopra (2013) studied the performance of both woven and nonwoven (BSRF) silt fence fabrics.
The study was done using a tilted test bed filled with a sandy soil and rainfall simulator in order
to simulate field conditions in a controlled environment. In order to simulate worst case
conditions that would be found in the field, high slopes of 10 and 25 percent, and high intensities
of 27, 76, 127 millimeter per hour (1, 3, and 5 inches per hour) were evaluated. The woven fabric
reduced turbidity by 18 percent and reduced sediment by 28 percent. The nonwoven fabric
achieved reductions of 52 and 57 percent for turbidity and sediment, respectively. The low
removal percentages were caused by inadequate time for settling due to the large slopes and
because a large portion of the suspended sediment was smaller than the AOS of either fabric.
Gogo-Abite and Chopra (2013) concluded that due to the low removal efficiencies, silt fence as a
standalone process installed at the toes of high slopes of 10% and greater would not be adequate
enough to meet the reductions of turbidity and sediment as required by regulatory agencies.

37
Summary
Literature related to silt fence show that sediment removal is by gravity settling and by
filtration of the fabric. The performance efficiency of the fabrics is dependent on the particle
size characteristics as well as the geotextile properties such as opening pore size and thickness.
The flow-through rate of these fabrics in the field is also a function of the ease with which the
fabric can become clogged and is therefore a function of the soil characteristics, the gradation of
the soil, and the geotextiles opening pore size.
It is common for silt fence to be characterized by both its permittivity and apparent
opening size, however, this literature review has shown that both these properties do not
correctly describe silt fence performance under field conditions. The initial permittivity in
particular will not give indication to the expected hydraulic performance of the fabric in the field
due to filter clogging when exposed to concentrated flows. The apparent opening size can give
an indication of what particle sizes may be intercepted by the fabric in the field, however,
ponding water upstream of the silt fence creates a load on the silt fence that induces a strain that
can result in an increase in the opening size of the fabric. This would increase the particle sizes
that could pass through the fabric and decrease the fabric efficiency.
Previous research on silt fence performance has been conducted on active construction
sites under monitored storm events, in flume studies, and in both pilot and field scale test beds.
Results from flume studies have shown that silt fence reduces sediment concentrations of sandy
soils as well as silty and clayey loams at high efficiencies upwards of 70 percent. However, silt
fence did not reduce turbidity to this extent due to the difficulty of silt fence in removing small
silt and clay sized particles.

38
While flume studies have shown high removal efficiencies, field tests and field scale
tests have shown that silt fence does not reduce turbidity or sediment as well under field
conditions. In particular, field scale testing with tilted test beds and active rainfall have shown
that silt fence reduces sediment and turbidity in the range of only 20 to 50 percent depending on
the type of geotextile used. These studies have shown a need for additional field scale testing of
silt fence geotextiles in order to further evaluate their performance in the field.

39
CHAPTER 3: METHODOLOGY
Introduction
This project compared and evaluated the performance of two silt fence geotextiles
exposed to a simulated rain event over a silty-sand-soil. The evaluation and comparison was
performed using a field scale tilted test bed and rainfall simulator located at University of Central
Florida’s Stormwater Management Academy Research and Testing Laboratory (SMARTL).
This chapter will describe the soil type that was used in the study, the types of silt fence
geotextiles used, the test preparation and set up, the field scale testing method, and the
limitations encountered during the study.
Soil Characteristics
A series of bench scale tests were used in order to characterize the soil that was loaded
in the test bed. Testing was done in order to determine the soils particle size distribution,
maximum compaction, and permeability. Brief discussions on the results of these tests are the
topic of the next few sections.
Soil Classification and Particle Size Distribution
Defining the soils classification and particle size distribution is particularly important
when evaluating the performance of silt fence fabrics. The ability of the geotextile to filter the
concentrated slurry and the settling velocity of the suspended particles are primarily dependent
on both the soil particle sizes and on the distribution and uniformity of these particle sizes. Due
to this dependence, the AASHTO Classification system was used because this system
distinguishes between clay and silt particles based on grain diameter. The AASHTO

40
Classification system was also used because it is the common classification system for
construction sites for roadway and stormwater management. The AASHTO Classification
system also takes into account the plastic and liquid limits of the soil. The results of these tests
showed that the soil type was non-plastic. The soil classification was therefore based solely on
its grain size distribution. The grain size classification used in the AASHTO Classification
system is shown in Table 2.
TABLE 2 SUMMARY OF SOIL PARTICLE CLASSIFICATION ANALYSES
Particle Type AASHTO Classification, grain
diameter (mm) Percentage of Soil (%)
Gravel 76.2 to 2 0
Sand 2 to 0.075 84
Silt 0.075 to 0.002 4
Clay < 0.002 12
Particle size distribution
Three tests were completed in order to determine the particle size distribution of the
soil. These tests were the standard test method for materials finer than 75 µm (No. 200) sieve in
mineral aggregates by washing (ASTM C117-13 2013), sieve analysis of fine and coarse
aggregates (ASTM C136-06 2013), and standard test method for particle-size analysis of soils by
hydrometer analysis (ASTM D422-63 2013). The method for materials finer than 75 µm was
performed first in order to determine the percentage of the soil that was finer than 75 μm (No.
200 mesh). Following the method for materials finer than 75 μm, those particles with diameters
that were greater than 75 µm and that were retained on the number 200 sieve were used in the
sieve analysis in order to determine the distribution of those particles which were greater than 75

41
µm. Finally, a hydrometer analysis was conducted in order to determine the soil distribution of
those particles which had diameters less than 75 μm.
The results for material finer than 75 µm by washing, sieve for fine and coarse
aggregates, and particle size analysis using hydrometer are shown in Table 21, Table 22 and
Table 23, respectively, of Appendix A. A summary of these results and the particle-size
distribution curve for this soil are also shown in Table 2 and Figure 2, respectively.
FIGURE 2 PARTICLE SIZE DISTRIBUTION CURVE
The silty-sand soil is made primarily of sand particles (84 percent sand) in the range of
0.075 mm to 4.0 mm. The remaining 16 percent of the soil distribution is made of clay particles
0%
10%
20%
30%
40%
50%
60%
70%
80%
90%
100%
0.0010.0100.1001.00010.000
Per
cent
Fin
er, %
Particle Size, mm

42
with diameters of less than 0.001 mm (12 percent) and silt sized particles in the range of 0.075 to
0.002 (4 percent). It will be interesting to see if silt fence is able to achieve removal efficiencies
of greater than 84 percent from this soil type. Silt fence is well known for being unable to
remove silt and clay sized particles due to their very small particle sizes (Fisher and Jarrett
1984). It is also well known however that the erosion rate of clay particles is lower than the
erosion rate of small sands and silts (FDEP 2008). Thus, the soil composition of particles that
actually erode from this parent soil may be different from the parent soil composition itself.
Proctor (Laboratory) Compaction Test
The compaction level of the soil affects both the permeability and the erodibility of the
soil. The additional compaction reduces the permeability and increases the erodibility of the soil
(European Commission 2012). The in situ compaction level of the soil in the test bed is
therefore an important characteristic that will affect both the erodibility of the soil and the
volume of sheet flow over the soil. For this reason, during testing, a constant compaction level
of the soil at the beginning of each test is maintained in order to best simulate constant soil
conditions from test to test. Originally, that compaction level prior to each test was 95 percent of
maximum dry density of the soil, however, it was too difficult to achieve this level of
compaction in the field. The difficultly in achieving this compaction level in the field is
discussed in further detail in the section, Test Bed Preparation and Setup, of this chapter.
Instead, the soil was compacted to 80 percent of the maximum dry density prior to each new test.
The maximum dry density and the moisture content at which this density occurs is
determined using the standard proctor test Method A as described in D698-12 (2013). The
results of the laboratory compaction test and compaction curve are presented in Table 24 and

43
Figure 20 of Appendix A. The results of the proctor test show that the maximum dry unit weight
of the soil is 1.86 g/cm3 (116 lb/ft3) and occurs at a moisture content of 11.5%. With a
compaction level of 80% in the field, an initial field density of 1.5 g/cm3 (92 lb/ft3) was the
compaction goal prior to each field test.
Permeability Test
The permeability of the soil measures the ability of the soil to pass water through it. The
permeability and hydraulic conductivity of the soil are found using the constant head method in
ASTM D2434-68 (2006). The hydraulic conductivity of the soil describes the ease with which
water can move through pore spaces of the soil. It is related to the permeability of the soil, the
dynamic viscosity and density of the fluid, and the gravitational constant.
The results of the constant head permeability test are shown in Table 25 of Appendix A.
The results of the test show that the permeability and hydraulic conductivity of the soil are
1.41E-08 cm2 and 0.0014 cm/s, respectively, at a temperature of 20°C and a soil density of 1.45
g/cm3 (91 lb/ft3). This value of permeability is in the range for silty-sands (Geotechdata.info
2008).
Silt Fence Geotextiles
Two silt fence fabrics were evaluated in this study. The first silt fence is a woven
monofilament geosynthetic which was donated by Absolute Erosion Control, Incorporated and is
referred to as an ASR 1400 silt fence. This woven fabric is shown in Figure 3.

44
FIGURE 3 WOVEN (ASR 1400) SILT FENCE INSTALLED ON A TILTED TEST BED (GOGO-ABITE
2012)
This type of silt fence is well known for being commonly used on construction sites,
however, previous studies on this type of silt fence have shown the fences inability in achieving
desired performance targets (Gogo-Abite 2012). For this reason, Silt Savers, Inc. introduced a
polyester nonwoven belted silt retention fence (BSRF) as shown in Figure 4. The BSRF was
designed to both retain more silt and reduce turbidity and suspended sediment more than the
traditional woven monofilament silt fence fabric (Risse et al. 2008).

45
FIGURE 4 NONWOVEN (BSRF) SILT FENCE INSTALLED ON A TILTED TEST BED
Both silt fence fabrics have been tested in a previous study by Gogo-Abite and Chopra
(2013) to determine the grab strength, permittivity, and AOS of both the woven (ASR 1400) and
nonwoven (BSRF) fabrics. The results from this study were compared with the ASTM D6461
(2007) recommended index test values as shown in Table 3.
TABLE 3 COMPARISON OF WOVEN AND NONWOVEN FABRICS
Property Direction ASTM Test
Methods Units
ASTM
D6461
Woven
Fabric
Nonwoven
Fabric
Grab strength Machine
D 4632 N 400 539 591
X-Machine 400 637 726
Permittivity D 4491 sec-1 0.05 0.11 2.5
AOS D 451 mm 0.6 0.7 0.212

46
Results of the index testing show that both fabrics, for the most part, surpassed the
recommended standards set by ASTM D6461 (2007). The grab strengths of both fabrics were
higher than the recommended values, however, the nonwoven fabric was slightly stronger than
the woven fabric. The permittivity of both fabrics were also higher than the recommended value,
with the woven fabric having a permittivity over a magnitude greater than the recommended
value and the nonwoven fabric having a permittivity over two magnitudes greater. The AOS of
the woven fabric was the only standard that was not met. The AOS was slightly higher than the
maximum value recommended. It will be interesting to see the filtering abilities of the woven
and nonwoven fabrics will be affected by this difference in AOS. Recall from Figure 2 that the
AOS of the nonwoven fabric (0.212 mm) is smaller than approximately 40% of the soil
distribution and that the woven fabric, which AOS is 0.70 mm, is actually larger than 100
percent of the soil distribution used in this study.
Test Bed Preparation and Setup
The investigations on silt fence performance were carried out using the tilted test bed
and rainfall simulator at the UCF SMARTL. The aluminum tilted test bed measures 2.4 meter (8
feet) wide by 9.1 meter (30 feet) long by 30.5 centimeter (1 foot) deep and can be set to
embankment slopes ranging from 0 to 50 percent. Due to the initial test bed depth of only 30.5
centimeters, the test bed was modified by the construction of a plywood apron on its perimeter in
order to increase the depth to 50.8 centimeter (20 inches) to accommodate the minimum required
post embedment of 45.7 centimeter (18 inches) as shown in Figure 5a (Gogo-Abite 2012).
Following the plywood apron construction a visqueen was placed over the plywood apron in
order to protect it from water damage (Figure 5b). The bed was then loaded with the silty-sand

47
soil (84 percent sand, 12 percent clay, and 4 percent silt, AASHTO Classification Type A-2-4) in
three layers of 15.2 centimeter (6 inch), and compacted to achieve 80 percent Standard Proctor
compaction effort of 7 kilogram per cubic meter (92 pounds per cubic feet) maximum dry unit
weight.
FIGURE 5 PICTURES OF TEST BED MODIFICATIONS (A) PLYWOOD FOR DEPTH, AND (B)
VISQUEEN TO PROTECT PLYWOOD (GOGO-ABITE 2012)
Prior to each field scale test, a silt fence was installed along the perimeter of the test bed
in an “L” shape as shown in Figure 6a. The test bed soil was then graded and compacted as
shown in Figure 6b. Initially, the compaction goal prior to each test was 95% maximum dry unit
weight, however, there was a difficulty in achieving this compaction goal with the silty-sand soil
in the field. Instead a compaction effort of only 80 percent was able to be achieved prior to each
test. A lower compaction effort would cause more percolation of water into the soil and would
also reduce the erosion rate of the soil in comparison with a higher compaction effort. However,
it was more important to have a compaction effort, which could be achieved on a consistent basis
at the beginning of each test, so that all tests would be subjected to the same initial conditions.

48
For this reason, 80 percent soil compaction was chosen. After test bed soil compaction, rain
gages were placed on the test bed in order to measure the rainfall intensity over the test bed, and
a meter stick was installed at the face of the silt fence in order to measure the ponding depth of
water behind the fence (Figure 6a). The test bed was then raised to the proper embankment slope
and the rainfall simulator was placed over the tilted test bed (Figure 6c).

49
FIGURE 6 TEST BED SETUP (A) WOVEN FABRIC, RAIN GAGES, AND METER STICK INSTALLED, (B)
TEST BED COMPACTION, (C) RAINFALL SIMULATOR AND TILTED TEST BED WITH NONWOVEN
FABRIC INSTALLED

50
Field Scale Testing Procedure
Both the woven and nonwoven fabrics were field tested under three different
embankment slopes (33, 25, and 10 percent) and three different simulated rainfall intensities –
25, 76, and 127 mm/h (1, 3, and 5 inches per hour). For each embankment slope, each rainfall
intensity was simulated four times for each fabric. The testing matrix for a typical case of 10%
embankment slope is shown in Figure 7.
FIGURE 7 SAMPLE FIELD TEST MATRIX FOR 10 PERCENT SLOPE (REPEATED FOR 33 AND 10
PERCENT SLOPES)
Four rainfall events were simulated for each pair of embankment slope and rainfall
intensity. These four rainfall events were broken up into two pairs of two rainfall events each.
The first rainfall event, denoted as #1, evaluated the performance of a newly installed silt fence.
After the commencement of Test #1, a minimum of three-hour interval was given before the
initiation of Test #2. The second rainfall event, denoted as #2, was then simulated without
performing any maintenance or retrofit to the silt fence or soil surface in order to test the silt
fences performance when subjected to an additional rainfall event without having any

51
maintenance performed on it. When Test #2 was completed, a new silt fence was installed and
the soil surface was re-graded and compacted to its initial condition of 80 percent maximum dry
unit weight. Tests #1 and #2 were then repeated under the same slope and intensity as in the
previous two tests. The repeated tests are referred to as # 1R and # 2R as shown in Figure 7.
For each rainfall event, simulated rainfall was allowed to fall over the tilted test bed for
30 minutes after the initiation of downstream runoff through the silt fence. During the 30-minute
rainfall event, six grab samples (one grab sample every five minutes for 30 minutes) were
collected both upstream (influent) of the silt fence and downstream (effluent) of the silt fence.
Figure 8 shows the downstream collection system used during testing. Runoff water
flowed through the silt fence and over a white visqueen where the runoff water was channeled
into two separate troughs. Water then flowed through each trough and into a white PVC pipe
that connected both troughs. The water then exited the PVC pipe and flowed into a bucket as
shown in Figure 8. The bucket was changed every minute and the mass of water that flowed
through the fence in that one-minute interval was recorded. In addition, a grab sample was taken
from the bucket as well as upstream of the silt fence every five minutes as discussed previously.
The upstream sample was taken from the middle of the ponding water depth and close to the silt
fence.

52
FIGURE 8 FIELD SCALE TESTING: DOWNSTREAM COLLECTION SYSTEM

53
At the end of the 30-minute rainfall event, the concentrated ponded water behind the silt
fence was given an additional 30 minutes to flow through the silt fence in order to evaluate the
performance of the fabric after the rain event had ended. During this time, six more grab
samples (one grab sample every five minutes) were taken both upstream and downstream of the
silt fence. All collected grab samples were then tested for both sediment concentration (total
solids) and turbidity according to the Standard Methods for the Examination of Water and
Wastewater (APHA et al. 2005). In addition to collected grab samples that were tested for
turbidity and sediment concentration, downstream runoff was also collected at one-minute
intervals from the start of when runoff first occurred to either the conclusion of the one hour test
or until runoff stopped, which ever occurred first. Downstream runoff was collected in one-
minute intervals in order to measure the flow rate of water with time through the silt fence
fabrics.

54
Limitations of Field Scale Testing
There were certain limitations of the field scale testing procedure used in this study.
For the most part, as will be discussed in Chapter 4, the field scale testing method was not
repeatable between tests. Many factors contributed to the performance of silt fence from test to
test. Changes in the initial field density and moisture content affected both the erosion rate of the
soil and percolation of water through the soil. It was not possible to obtain the same exact initial
conditions from test to test.
For the upstream collection, a grab sample is taken by hand from the middle of the
ponding volume behind the silt fence. The sample was taken from the middle of the pond and
close to the silt fence. It is assumed that the turbidity and sediment concentration of this sample
represented the average concentration of suspended sediment of the entire ponding volume.
However, due to human error in taking sample by hand and the unknown vertical concentration
gradient of suspended solids within the pond, this sample may not have adequately represented
the concentration within the ponding volume.
The samples that were taken both upstream and downstream of the silt fence also had
relatively high turbidity values. Turbidity values were high enough that in order to calculate the
turbidity multiple dilutions were needed. The accuracy of the turbidity measurement decreases
as the dilution factor is increased.

55
CHAPTER 4: RESULTS AND DISCUSSION
Introduction
Results of the field scale performance of woven and nonwoven fabrics installed on a
silty-sand soil are presented in this section. Both fabrics were tested on three embankment
slopes (33, 25, and 10 percent) and under three rainfall intensities – 25, 76, and 125 millimeters
per hour (1, 3, 5 inches per hour). In total, 78 rainfall events were simulated over the course of
15 months on both fabrics, starting from June 4, 2012 to September 20, 2013. Although 78
rainfall events were simulated, only 62 of those rainfall events were used in analysis, with the
results of the other 16 tests being discarded. These 16 tests were discarded due to a series of
testing errors, which led to the results from these tests being unusable. These testing errors
involved errors in the upstream collection behind the fence, which yielded average efficiency
values of negative 30 to negative 50 percent for both turbidity and suspended sediment
concentration. These results were deemed erroneous and the tests were thrown out. The results
of these tests are not presented or analyzed in this thesis. All 16 tests that were discarded
occurred during testing with the woven fabric; so in total, only 27 rainfall events were used for
the woven fabric and 35 rainfall events for the nonwoven fabric.
The tests that were thrown out are four tests from 10 percent slope and 127 mm/h rainfall
intensity, four tests from 25 percent slope and 25 mm/h rainfall intensity, four tests from 25
percent slope and 76 mm/h rainfall intensity, and four tests from 25 percent slope and 127 mm/h
rainfall intensity. If time had permitted, all 16 tests that were thrown out would have been
repeated, however, due to time constraints there was only enough time to complete two
additional tests instead of the usual four tests for each of the slope and intensity pairs discussed

56
above. More tests on the nonwoven fabric than on the woven fabric were analyzed because of
the observed errors in the tests on the woven fabric.
The performance evaluation on these silt fence fabrics involve the analysis of fabric
efficiency in both turbidity and suspended sediment removal as well as fabric flow-through rate
of each geotextile, both during rain events and after rainfall stops. For the woven fabric, 294
grab samples were taken during the rain event and 254 grab samples after the rain event. In the
case of the nonwoven fabric, 418 grab samples were taken during the rain event and 380 grab
samples after the rain event. There are two discrepancies with these numbers. The first is that
over 200 more grab samples were taken overall for the nonwoven fabric than for the woven
fabric. The second being that more grab samples were taken during the rain event than after the
rain event for both fabrics.
The reason that more samples were taken for the nonwoven fabric was discussed
previously and was due to the 8 tests that were not able to be completed due to time constraints.
For the second discrepancy there were more grab samples taken during the rain event than after
the rain event due to overtopping of the silt fence or fence failure occurring during some of the
rainfall events. The overtopping events or fence failures, such as stake breaking and fabric
pullout of the fence from the staples, caused the test to be cancelled during the rain event, and no
post rainfall samples were collected. In particular, no post rainfall samples were taken for the
woven fabric for test on a 33 percent slope and a 127 millimeter per hour (5 inches per hour)
rainfall event due to overtopping of the silt fence during all testing. For the nonwoven fabric, a
stake breaking in half on a 33 percent slope and a 76 millimeter per hour (3 inches per hour)
57
rainfall also caused no after rain event samples taken. Fence failures that occurred during testing
are discussed in more detailed in this chapter in the section: Silt Fence Failure.
For each embankment slope and intensity pair, four tests were completed for each fabric,
except for the tests on the woven fabric on 10 percent and 127 mm/h rainfall and each pair on 25
percent embankment slope, as discussed previously. Of these four tests, two were repeated tests
using a new fabric on the same slope and intensity as was previously tested. The tests were
repeated in order to obtain additional data for each slope and intensity pair and to determine if
the field-scale testing procedure was repeatable. In order to show if there was a significant
difference in the upstream and downstream turbidity and suspended sediment concentrations
between both sets of tests, a Wilcoxon rank sum test was performed on the samples taken during
the rain event between both sets of tests. Results of these tests are shown in Table 26 and Table
27 in Appendix B for the woven and nonwoven fabrics, respectively. The tests show that initial
conditions and silt fence performance between the initial test and the repeat tests were
statistically different with 95 percent confidence in 20 of the 52 tests. These results show that it
was difficult to obtain the constant initial conditions sought after for each test and that the
erosion rate and the downstream discharge concentrations varied from test to test; and were thus,
not very repeatable
Additional statistical analysis is performed throughout this chapter in order to
significantly quantify the data. Three types of statistical tests were used; single factor ANOVA,
Wilcoxon rank sum test, and Wilcoxon rank sum test on difference. All statistical tests were
completed with a confidence level of 95 percent (α = 0.05) and are located in the appropriate
appendixes.

58
Tables of results of all time dependent efficiency and flow-through rates from field
scale testing are presented in Table 46 through Table 48 for the woven fabric and Table 49
through Table 51 for the nonwoven fabric in Appendix D. The remainder of this chapter
discusses all results pertaining to this research with field scale testing of silt fence fabrics used in
conjunction with a silty-sand soil. The chapter is broken into four main sections; fabric
performance during the rain event, fabric performance after the rain event, overall silt fence
performance based on measured samples, and overall silt fence performance based on projection.
The first section is further broken down into discussions on fabric efficiency, fabric flow-through
rate, and silt fence failure; and the second section is broken into discussions on fabric efficiency
and flow-through rate.

59
Fabric Performance during Rain Events
Fabric Reduction Efficiency during Rain Events
This section presents results of fabric performance efficiency in both turbidity and
suspended sediment concentrations (SSC), which occurred during the rainfall event. On every
test, both the turbidity and SCC values were obtained from all collected grab samples both
downstream and upstream of the silt fence. Downstream turbidity and SCC values were
weighted by the volume of runoff water which transmitted through the silt fence for that sample.
Upstream values were weighted by the volume of ponding water upstream of the silt fence when
the sample was taken. The volume-weighted downstream and upstream values were then
compared to each other to determine a mean efficiency value. These computations are expressed
in Equations 4 through 9
𝑊𝑀𝐼𝑇 = ∑ [𝑇INF∗ 𝑉𝑢𝑝𝑠𝑡𝑟𝑒𝑎𝑚]𝑛
𝑖=0
∑ 𝑉𝑢𝑝𝑠𝑡𝑟𝑒𝑎𝑚𝑛𝑖=0
(4)
𝑊𝑀𝐼𝐶 = ∑ [𝑇𝑆INF∗ 𝑉𝑢𝑝𝑠𝑡𝑟𝑒𝑎𝑚]𝑛
𝑖=0
∑ 𝑉𝑢𝑝𝑠𝑡𝑟𝑒𝑎𝑚𝑛𝑖=0
(5)
(WMET)DR = ∑ [𝑇EFF∗ 𝑉𝑑𝑜𝑤𝑛𝑠𝑡𝑟𝑒𝑎𝑚]𝑛
𝑖=0
∑ 𝑉𝑑𝑜𝑤𝑛𝑠𝑡𝑟𝑒𝑎𝑚𝑛𝑖=0
(6)
(𝑊𝑀𝐸𝐶)𝐷𝑅 = ∑ [𝑇𝑆EFF∗ 𝑉𝑑𝑜𝑤𝑛𝑠𝑡𝑟𝑒𝑎𝑚]𝑛
𝑖=0
∑ 𝑉𝑑𝑜𝑤𝑛𝑠𝑡𝑟𝑒𝑎𝑚𝑛𝑖=0
(7)
𝐸𝑇(%)𝐷𝑅 = 100 ∗ [1 − (𝑊𝑀𝐸𝑇)𝐷𝑅
𝑊𝑀𝐼𝑇] (8)
𝐸𝑆𝑆𝐶(%)𝐷𝑅 = 100 ∗ [1 − (𝑊𝑀𝐸𝐶)𝐷𝑅
𝑊𝑀𝐼𝐶] (9)

60
where, WMIT is the volume-weighted mean influent turbidity (NTU); (WMET)DR is the volume-
weighted mean effluent turbidity during the rain event (NTU); Tinf is the influent turbidity value
collected for sample i (NTU); Vupstream is the upstream ponding volume when sample i was
taken (L); WMIC is the volume-weighted mean influent concentration (mg/L); (WMEC)DR is the
volume-weighted mean effluent concentration during the rain event (mg/L); SSC is the
suspended sediment concentration in runoff collected for sample i (mg/L); Vdownstream is the
volume of collected runoff which discharged through the silt fence in interval between sample i
and sample i – 1 (L); n is the number of samples collected during the rain event; ET(%)DR is the
mean turbidity performance efficiency during the rain event; and ESSC(%)DR is the mean
suspended sediment concentration performance efficiency during the rain event. Table 4 and
TABLE 5 present the volume-weighted turbidity and suspended sediment concentration and the
respective performance efficiency that occurred during the rain event for both the ASR-1400 and
BSRF silt fence fabrics. Note that from this point forward, woven fabric will be used to refer to
the ASR-1400 silt fence and nonwoven fabric will be used to refer to the BSRF silt fence.

61
TABLE 4 WOVEN FABRIC TEST VOLUME-WEIGHTED MEAN TURBIDITY AND SSC RESULTS
DURING THE RAIN EVENT
Slope %
(Ratio)
Rainfall
Intensity
(mm/h)
Rainfall
Events
Volume-Weighted Mean Turbidity Volume-Weighted Mean SSC
Up-
stream
(NTU)
Down-
stream
(NTU)
Performance
Efficiency
(%)
Up-
stream
(mg/L)
Down-
stream
(mg/L)
Performance
Efficiency
(%)
33%
(3:1
) S
lop
e
25
#1 50171 25054 50 32616 14186 57
#2 33573 16998 49 23412 15867 32
#1R 28738 19743 31 21001 13728 35
#2R 30096 17200 43 25614 13299 48
76
#1 43339 19359 55 40099 13496 66
#2 -- -- -- -- -- --
#1R 41442 20644 50 21641 12620 42
#2R 27811 15466 44 17641 11928 32
127
#1 48311 18760 61 31212 12121 61
#2 -- -- -- -- -- --
#1R 57945 27442 53 46322 21086 54
#2R 40266 28031 30 35427 21355 40
25%
(4:1
) S
lope 25
#1 29396 22130 25 19585 14185 28
#2 21551 15465 28 13875 11893 14
76 #1 19080 14532 24 13462 11312 16
#2 25891 20995 19 11361 9797 14
127 #1 47590 22583 53 15744 12260 22
#2 30530 18983 38 12755 8541 33
10
% (
10
:1)
Slo
pe
25
#1 12357 7782 37 10959 6558 40
#2 10839 3293 70 10743 2409 78
#1R 13365 5176 61 10468 3544 66
#2R 9453 5113 46 5920 3621 39
76
#1 5358 4132 23 4215 3089 27
#2 3707 2802 24 3426 2196 36
#1R 6036 4472 26 4610 3491 24
#2R 2619 2092 20 2117 1681 21
127 #1 4886 3129 36 3982 2363 41
#2 4321 2644 39 3763 2171 42 Table entries that appear with "--" indicate that no samples were collected during those tests due to previous test failures

62
TABLE 5 NONWOVEN FABRIC TEST VOLUME-WEIGHTED MEAN TURBIDITY AND SSC RESULTS
DURING THE RAIN EVENT
Slope %
(Ratio)
Rainfall
Intensity
(mm/h)
Rainfall
Events
Volume-Weighted Mean Turbidity Volume-Weighted Mean SSC
Up-
stream
(NTU)
Down-
stream
(NTU)
Performance
Efficiency
(%)
Up-
stream
(mg/L)
Down-
stream
(mg/L)
Performance
Efficiency
(%)
33%
(3:1
) S
lop
e
25
#1 29690 13544 54 27767 9356 66
#2 39009 2467 94 25079 3001 88
#1R 46765 24193 48 33356 16805 50
#2R 18628 9623 48 22205 8753 61
76
#1 40355 18276 55 31706 14155 55
#2 32081 11134 65 24753 9700 61
#1R 26588 20144 24 19271 12361 36
#2R 24696 12370 50 19142 9423 51
127
#1 37989 21601 43 31958 17041 47
#2 -- -- -- -- -- --
#1R 37008 16518 55 26679 13855 48
#2R 18925 12308 35 13685 6012 56
25%
(4:1
) S
lope
25
#1 24380 12494 49 21495 9037 58
#2 20556 7308 64 17723 5361 70
#1R 22906 16882 26 18459 11691 37
#2R 22996 9191 60 17807 7024 61
76
#1 8780 7861 10 6547 6682 -2
#2 6976 5567 20 5256 4204 20
#1R 8244 6002 27 5608 4274 24
#2R 3915 2431 38 2720 1107 59
127
#1 7772 6282 19 5544 4465 19
#2 19213 10394 46 14032 8048 43
#1R 14489 8965 38 13018 6301 52
#2R 8384 4284 49 7123 3221 55
10%
(1
0:1
) S
lop
e
25
#1 13512 1848 86 14449 1327 91
#2 13824 2101 85 14555 2136 85
#1R 6631 2512 62 5962 1891 68
#2R 9973 3539 65 7318 2660 64
76
#1 9472 4769 50 10330 3303 68
#2 10282 2686 74 11088 2222 80
#1R 7217 5072 30 5932 3611 39
#2R 4736 1545 67 3441 1178 66

63
Slope %
(Ratio)
Rainfall
Intensity
(mm/h)
Rainfall
Events
Volume-Weighted Mean Turbidity Volume-Weighted Mean SSC
Up-
stream
(NTU)
Down-
stream
(NTU)
Performance
Efficiency
(%)
Up-
stream
(mg/L)
Down-
stream
(mg/L)
Performance
Efficiency
(%)
127
#1 12466 7966 36 7147 4606 36
#2 14303 5764 60 10503 2715 74
#1R 8629 5817 33 6416 4544 29
#2R 6044 3298 45 4779 2457 49
Table entries that appear with "--" indicate that no samples were collected during those tests due to previous test failures
Table 4 and TABLE 5 show the volume-weighted mean influent and effluent, and
efficiency values for both the turbidity and SSC for both fabrics for every test during the rain
event. These results show that overall for the woven fabric, turbidity performance efficiency
during the rain event for all slopes and intensities tested ranged from 19 to 70 percent with a
mean and median of 40 and 38 percent, respectively. The SCC performance efficiency ranged
from 14 to 78 percent with a mean and median of 39 and 37 percent, respectively. For the
nonwoven fabric, performance efficiency during the rain event ranged from 10 to 94 percent
with a mean and median of 49 percent, and from negative 2 to 91 percent with a mean of 53
percent and a median of 55 percent for the turbidity and SCC, respectively. From these results, a
Wilcoxon rank sum test was performed to determine if the nonwoven fabric performance
efficiencies were significantly higher than those occurring with the woven fabric. The test was
completed using the volume-weighted mean efficiencies that were shown in Table 4 and TABLE
5 for each embankment slope. The results of these tests are shown in Table 28 of Appendix B.
The statistical analysis showed that the nonwoven fabric significantly reduced both turbidity and
SSC to a greater extent than the woven fabric over the combination of all embankment slopes.

64
The greater reduction by the nonwoven fabric can be attributed to the smaller pore size of this
fabric when compared to the woven fabric.
Fabric Reduction Efficiency based on Embankment Slope
For each fabric, testing was completed on three embankment slopes; 10, 25, and 33
percent slopes. Comparison between the efficiency values occurring between slopes can give
insight into a possible relation of silt fence effectiveness with change in slope. The comparison
was done using a single factor ANOVA analysis in order to test if the efficiency values occurring
on each slope stem from the same underlying distribution. If the ANOVA test were to be
significant, it would indicate that the efficiency values occurring on at least one of the slopes
differed significantly from the others. The analyses were done on the volume-weighted mean
efficiency values for all embankment slopes (that is, 10, 25 and 33 percent) during the rainfall
event. The results and discussion of these tests are presented in the following two sections for
the woven and nonwoven fabrics.
Woven Fabric Performance Efficiency based on Embankment Slope
Results showed that during rainfall, the woven fabric had 40 and 39 percent turbidity
and SSC performance efficiencies, respectively, for all embankment slopes and rainfall
intensities. Statistical analysis shows however that the efficiency values of both turbidity and
SSC were significantly different when compared on different embankment slopes as shown in
Table 32 of Appendix B. The changes in the turbidity and SSC performance efficiency with
changes in slope are shown graphically in Figure 9 and FIGURE 10, respectively.

65
FIGURE 9 WOVEN FABRIC VOLUME-WEIGHTED MEAN TURBIDITY PERFORMANCE EFFICIENCY
WITH EMBANKMENT SLOPE
Shown directly above both bars on each embankment slope is the average performance
efficiency on the respective embankment slope. The highest mean performance efficiency
occurred on the 33 percent embankment slope and the lowest efficiency occurred on the 25
percent slope.
FIGURE 10 WOVEN FABRIC VOLUME-WEIGHTED MEAN SSC PERFORMANCE EFFICIENCY WITH
EMBANKMENT SLOPE
0
10000
20000
30000
40000
10% (10:1) Slope 25% (4:1) Slope 33% (3:1) Slope
Tu
rbid
ity (
NT
U)
Embankment Slope
Upstream Weighted Turbidity Downstream Weighted Turbidity
38%
47%
31%
0
10000
20000
30000
10% (10:1) Slope 25% (4:1) Slope 33% (3:1) Slope
SS
C (
mg/L
)
Embankment Slope
Upstream Weighted SSC Downstream Weighted SSC
41%
22%
47%

66
Results for the SCC performance efficiency show a similar trend to those of the
turbidity, with efficiencies of 41 and 47 percent on 10 and 33 percent slopes, respectively, but
with mean performance efficiency of only 21 percent on the 25 percent slope. Once again, the
lowest mean efficiencies occurred on the 25 percent slope. It is not completely understood why
the performance efficiency decreased on the 25 percent slope, however, a possible theory is
given in the following section.
Although there was not much of a trend in performance efficiency with degree of slope,
Figure 9 and FIGURE 10 show the significant increase in both upstream and downstream
turbidity and sediment concentrations with increases in slope percent, respectively. The reason
for the increasing trend was due to the increase in the rate of erosion caused by increasing degree
of slope; as the degree of slope increased, erosion rate increased, and more particles were
available to runoff through the silt fence. The trend shows that although performance efficiency
was similar on 10 and 33 percent embankment slopes, the effluent turbidity and sediment
concentrations were significantly higher on the 33 percent slope. It is also interesting that even
though the lowest volume-weighted mean reduction efficiencies occurred on 25 percent
embankment slopes, the volume-weighted mean effluent turbidity and concentration were still
lower on the 25 percent slope when compared to the 33 percent slope due to the higher erosion
rate occurring on the 33 percent slope.
Nonwoven Fabric Reduction Efficiency Based on Embankment Slope
For the nonwoven fabric, performance results during rainfall event showed that
turbidity and SSC were reduced by a mean value of 49 and 53 percent, respectively, for all
embankment slopes and rainfall intensities. Similar to the woven fabric, statistical analysis on

67
the nonwoven fabric as shown in Table 33 of Appendix B showed that the efficiency values of
both turbidity and SSC were significantly different when compared on different embankment
slopes. The changes in the turbidity and SSC performance efficiency with changes in slope are
shown in Figure 11 and FIGURE 12, respectively.
FIGURE 11 NONWOVEN FABRIC VOLUME-WEIGHTED MEAN TURBIDITY PERFORMANCE
EFFICIENCY WITH EMBANKMENT SLOPE
FIGURE 12 NONWOVEN FABRIC VOLUME-WEIGHTED MEAN SSC PERFORMANCE EFFICIENCY
WITH EMBANKMENT SLOPE
0
10000
20000
30000
40000
10% (10:1) Slope 25% (4:1) Slope 33% (3:1) Slope
Turb
idit
y (
NT
U)
Embankment Slope
Upstream Weighted Turbidity Downstream Weighted Turbidity
58%37%
52%
0
10000
20000
30000
10% (10:1) Slope 25% (4:1) Slope 33% (3:1) Slope
SS
C (
mg/L
)
Embankment Slope
Upstream Weighted SSC Downstream Weighted SSC
62%41%
56%

68
For the nonwoven fabric the average volume-weighted performance efficiencies were
58 and 62 percent for the turbidity and SSC on the 10 percent slope, 37 and 41 percent for the
turbidity and SSC on the 25 percent slope, and 52 and 56 percent for the turbidity and SSC on
the 33 percent slope. These results show that the average performance efficiencies of both
turbidity and SSC were higher on the nonwoven fabric than on the woven fabric for the three
embankment slopes tested.
As was the case with the woven fabric, the 25 percent slope had the lowest performance
efficiencies of both turbidity and SSC, and the efficiency on this slope was significantly different
from the reduction on 10 and 33 percent slopes. A possible explanation for this trend, which
occurred on testing with both silt fence fabrics, could be due to the effect of settling and filtering
on these slopes. On the high slope of 33 percent, the erosion rate was very high, leading to a
large amount of suspended sediment in the upstream ponding volume. Due to the large portion
of suspended sediment, the filtering of the fabric was increased due to increased opportunity for
particles to clog the pore spaces of the fabric; leading to a relatively high efficiency on the 33
percent slope. On the lower slope of 10 percent, the amount of suspended particles in the pond
was much lower due to the decreased erosion rate. However, due to the low slope, the ponding
volume height is also much lower; possibly allowing a large portion of the suspended solids
within the ponding volume to settle before discharging through the silt fence and leading once
again to a relatively high efficiency. On the 25 percent slope, based on geometry of the slope
and assuming a constant flow-through rate, the ponding height would be 2.5 times that of the 10
percent slope, which would lead to a much smaller portion of the suspended mass settling out
than was the case with the 10 percent slope. The ponding depth on the 25 percent slope would

69
be much closer to the case of the 33 percent slope, with the ponding depth on the 33 percent
slope only being 1.3 times higher than on the 25 percent slope. Although the ponding depths
would be similar, the added erosion caused from increasing the slope from 25 to 33 percent led
to the upstream suspended solids concentration doubling as shown in Figure 10 and FIGURE 12.
The settling taking place on the 25 and 33 percent slopes would therefore be similar but the
filtering on the 33 percent slope would be much larger due to the much higher influent SSC.
This is a possible explanation for why the performance efficiency is seen to decrease on the 25
percent slope when compared to the 10 and 33 percent slopes. This result also shows that it is
likely that if a constant influent concentration were to be used for all three embankment slopes,
there would most likely be a trend of decreasing efficiency with increasing embankment slope.
Fabric Reduction Efficiency from Test 1 to Test 2
For each rainfall intensity and embankment slope, four tests were completed on each
fabric. Test 1 was performed on a new silt fence material and Test 2 was performed on the silt
fence used in Test 1 without any maintenance being performed on the silt fence. These two tests
were then repeated on a new silt fence under the same intensity and slope. Comparison between
Test 1 and Test 2 can help show how silt fence fabric performance is affected by being used
previously without having any maintenance performed. The comparison was done using a
Wilcoxon signed rank test and was completed in order to determine if a change in performance
efficiency was significant between Test 1 and Test 2 for both fabrics. The signed rank test was
completed on the time dependent efficiency values between each test that occurred during the
rain event. The results and discussion of these tests are shown in the following two sections for
the woven fabric and the nonwoven fabric, respectively.

70
Woven Fabric Reduction Efficiency from Test 1 to Test 2
A summary of the volume-weighted mean turbidity and SCC performance efficiencies
that occurred on the woven fabric from Test 1 to Test 2 are shown in Table 6.
TABLE 6 WOVEN FABRIC TURBIDITY AND SCC PERFORMANCE EFFICIENCY FROM TEST 1 TO
TEST 2
Slope
%
(Ratio)
Rainfall
Intensity
(mm/h)
Rainfall
Events
Volume-Weighted Mean
Turbidity Efficiency (%)
Volume-Weighted Mean SSC
Efficiency (%)
Test 1
(New Fabric)
Test 2
(Used Fabric)
Test 1
(New Fabric)
Test 2
(Used Fabric)
33%
(3:1
) S
lope 25
#1, #2 51 50 58 34
#1R, #2R 35 43 37 48
76 #1, #2 55 -- 67 --
#1R, #2R 51 45 43 34
127 #1, #2 64 -- 67 --
#1R, #2R 53 30 54 40
25%
(4:1
)
Slo
pe 25 #1, #2 24 28 26 13
76 #1, #2 25 23 18 17
127 #1, #2 53 41 22 35
10%
(10:1
)
Slo
pe
25 #1, #2 36 69 40 78
#1R, #2R 61 49 66 42
76 #1, #2 30 26 33 37
#1R, #2R 33 24 31 25
127 #1, #2 36 42 41 44
Table entries that appear with "--" indicate that no samples were collected during those tests due to previous test failures.
Overall, the volume-weighted mean turbidity efficiency for all tests from Test 1 to Test
2 showed a slighted decrease; having mean performance efficiency of 44 percent on Test 1 and
mean efficiency of 39 percent on Test 2. The volume-weighted mean SSC for all tests was
similar as well; having mean performance efficiency of 43 percent on Test 1 and mean efficiency
of 37 percent on Test 2.

71
The statistical analysis however, showed that a change in fabric efficiency was not
significant with 95 percent confidence from Test 1 to Test 2. The statistical analysis is shown in
Table 34 and Table 35 of Appendix B for the turbidity and SSC, respectively.
The overall decrease in efficiency from Test 1 to Test 2 may indicate that the woven
fabric pore spaces were stretched and enlarged from Test 1 to Test 2. The pore spaces could
have been enlarged due to the stress brought on by the ponding volume on the silt fence from the
previous test. The increase in pore size would have decreased the filtration ability of the fabric,
decreasing the filtration mechanism of the woven fabric from Test 1 to Test 2. Previous studies
by (Gogo-Abite 2012) have indicated a similar result of the pore sizes of the woven fabric
increasing due to increased ponding depth on the upstream side of the silt fence. However,
results from this study show that a change in efficiency between Test 1 to Test 2 was not
significant with the woven fabric.
Nonwoven Fabric Reduction Efficiency from Test 1 to Test 2
Statistical analysis on the change in turbidity and SSC performance efficiency from Test
1 to Test 2 of nonwoven fabrics is shown in Table 36 and Table 37 of Appendix B. Table 7
shows a summary of the performance efficiencies that occurred from Test 1 to Test 2 for the
nonwoven fabric.

72
TABLE 7 NONWOVEN FABRIC TURBIDITY AND SSC PERFORMANCE EFFICIENCY FROM TEST 1
TO TEST 2
Slope
%
(Ratio)
Rainfall
Intensity
(mm/h)
Rainfall
Events
Volume-Weighted Mean
Turbidity Efficiency (%)
Volume-Weighted Mean SSC
Efficiency (%)
Test 1
(New Fabric)
Test 2
(Used Fabric)
Test 1
(New Fabric)
Test 2
(Used Fabric)
33
% (
3:1
)
Slo
pe
25 #1, #2 56 94 67 88
#1R, #2R 49 49 50 61
76 #1, #2 56 66 58 62
#1R, #2R 27 50 38 50
127 #1, #2 47 -- 48 --
#1R, #2R 58 38 51 58
25%
(4:1
)
Slo
pe
25 #1, #2 49 64 59 70
#1R, #2R 27 58 37 59
76 #1, #2 13 20 1 20
#1R, #2R 32 39 30 59
127 #1, #2 35 48 23 45
#1R, #2R 40 51 55 57
10%
(10:1
)
Slo
pe
25 #1, #2 86 85 91 85
#1R, #2R 64 65 71 64
76 #1, #2 50 74 68 80
#1R, #2R 32 67 42 66
127 #1, #2 39 60 39 74
#1R, #2R 34 46 30 49
Table entries that appear with "--" indicate that no samples were collected during those tests due to previous test failures.
The overall volume-weighted mean efficiency values that occurred for the nonwoven
fabric from Test 1 to Test 2 were 44 to 57 percent and 48 to 62 percent for the turbidity and SSC
efficiencies, respectively. The statistical analysis showed that there was a significant increase in
the turbidity and sediment performance efficiencies from Test 1 to Test 2 on 10, 25, and 33
percent slopes for the nonwoven fabric. These results indicate that clogged particles within and
on the fabric from previous tests influenced the performance of the nonwoven fabric and led to

73
the increase in efficiency from Test 1 to Test 2. The clogged particles would have increased the
efficiency from Test 1 to Test 2 because they would decrease the pore size of the fabric and
allowed additional filtration to occur.
In general, both impingement of particles on the fabric and pore space enlargement due
to ponding water will affect the performance of silt fence from Test 1 to Test 2, as well as over
the lifespan of the silt fence in the field over many rainfall events. Although both mechanisms
will contribute to the future performance of the silt fence, from the results of the field scale
testing of these two fabrics indicate that the dominate mechanism for the nonwoven fabric was
the impingement of particles on the fabric which increased the efficiency of the silt fence. The
dominating mechanism for the woven fabric however could not be determined with a significant
degree of confidence.
Flow-through rate during the Rain Event
The water flux through the silt fence fabrics, herein referred to as flow-through rate, is a
measure of the volume of water that flows through the silt fence per unit area of silt fence. In
this study the flow-through rate is calculated as the volume of water which flowed through the
fabric in time interval t, divided by the average area of submerged silt fence during the same time
period as expressed in Equation 10. For each test, the calculated flow-through rate for each time
interval during the rain event was then averaged to obtain a representative mean flow-through
rate for each test as expressed in Equation 11. Table 8 presents summary results for the average
flow-through rate encountered on each embankment slope during the rain event for each fabric.
𝑞𝑖 = 𝑉𝑑𝑜𝑤𝑛𝑠𝑡𝑟𝑒𝑎𝑚
[1
2∗(𝑃𝐷𝑖−1+𝑃𝐷𝑖)]∗𝑏𝑇𝐵∗ ∆𝑡
(10)

74
𝑞𝐷𝑅 =∑ 𝑞𝑖
𝑛𝑖=2
𝑛−1 (11)
where, i refers to the time dependent order with which the ponding depth upstream of the silt
fence is measured; n refers to the number of measurements taken; 𝑞𝑖 is the flow-through rate of
the silt fence fabric during the rain event occurring during measurement i (L/m2/h); 𝑞𝐷𝑅 is the
average flow-through rate occurring during the rain event; Vdownstream is the volume of
collected runoff which discharged through the silt fence in interval between measurement i - 1
and measurement i (L); PDi is the ponding depth occurring at measurement i; bTB is the width of
the test bed; and Δt is the time interval between measurement i - 1 and measurement i.
TABLE 8 SUMMARY RESULTS FOR FLOW-THROUGH RATE OF WOVEN AND NONWOVEN FABRICS
DURING THE RAIN EVENT
Embankment
Slope (%)
Rainfall
Intensity
(mm/h)
Flow-through rate (L/m2/h)
Woven Fabric Nonwoven Fabric
Mean Median Standard
Deviation Mean Median
Standard
Deviation
33
25 60 57 42 310 293 176
76 132 103 74 416 442 231
127 72 64 27 460 419 289
25
25 125 128 26 880 973 460
76 214 178 96 1512 1566 234
127 397 377 177 1155 1136 624
10
25 830 902 408 1267 766 1018
76 1494 1448 570 2377 2248 837
127 1360 1376 209 2564 2686 1266
Results from Table 8 show that nonwoven fabric achieved a higher mean flow-through
rate during the rain event on every slope and intensity pair tested. Higher flow-through rates
would decrease the chances of developing high ponding depths which could lead to silt fence

75
failure or overtopping of the silt fence. Lower flow through rates, however, would decrease the
volume of water that is discharged during the rain event. This would lead to a higher overall
efficiency of the silt fence as will be discussed in this chapter in the section: Overall Performance
Efficiency (Projected).
The results also suggest a trend of increasing flow-through rate with decreasing
embankment slope. The mean flow-through rate is shown to increase by approximately a
magnitude when comparing results on the 33 percent slope to those on the 10 percent slope. For
the woven fabric, the flow-through rate is shown to range from 57 L/m2/h on a 33 percent slope
to 1494 L/m2/h on a 10 percent slope, and in the case of the nonwoven fabric, from 310 L/m2/h
on a 33 percent slope to 2564 L/m2/h on a 10 percent slope.
A statistical analysis was performed in order to determine if the trend of increasing
flow-through rate with decreasing embankment slope was significant during the tests. The
statistical analysis was completed by performing a Wilcoxon rank sum test between the time
dependent flow-through rate values on 10 and 25 percent slopes and then again between the
flow-through rate values on 25 and 33 percent slopes for both fabrics. The results of these
statistical analyses are shown in Table 40 and Table 41 of Appendix C for the woven and
nonwoven fabrics, respectively. Results revealed that the flow-through rate of both silt fence
fabrics was significantly higher on the 10 percent slope when compared to the 25 percent slope
and that the flow-through rates were also significantly higher on the 25 percent slope when
compared to the 33 percent slope.
The results of this statistical analysis; decreases in flow-through rate with increases in
embankment slope, goes against what would be commonly expected. In theory, given clean

76
water, an increase in embankment slope should cause an increase in the flow-through rate, not a
decrease. The reason for this is that the ponding depth behind the silt fence will be higher on the
higher slope if the influent water volume remains constant. Higher ponding depths would cause
a larger force on the silt fence and would cause the pores of the fabric to be enlarged, increasing
the flow-through rate of the fabric. The result from this study however shows the opposite; that
increases in embankment slope caused a decrease in the flow-through rate.
The observed contradiction is because the flow-through rate is directly related to the
concentration of suspended sediment in contact with each fabric. Recall from Figure 10 and
Figure 12 that the erosion rate and the concentration of upstream suspended solids increased with
increasing embankment slope. The increase in upstream SSC led to a decrease in the flow-
through rate because the mass of particles that had the potential to be filtered by the fabric
increased. Filtering of the soil particles by the fabric clogged the fabrics pores and decreased the
ability of the fabric to transmit water. Risse et al. (2008) and Britton et al. (2000) also observed
that increasing sediment concentration led to a decrease in flow-through rate of silt fence. Figure
13 shows the trend of decreasing flow-through rate with increasing upstream suspended sediment
concentration encountered for both the woven and nonwoven fabrics for this soil type.

77
FIGURE 13 TREND OF DECREASING FLOW-THROUGH RATE WITH INCREASING UPSTREAM SSC
FOR BOTH WOVEN AND NONWOVEN FABRICS
Figure 13 is a plot of the SSC in the ponding water volume upstream of the silt fence (x-
axis) verse the average flow-through rate of the silt fence (y-axis). Note that the plot is only of
samples taken during the rain event. In total, 112 samples for the woven fabric and 163 samples
for the nonwoven fabric. According to Figure 13, the flow-through rate tended to decrease
exponentially with increases in the upstream solids concentration (R2 = 0.69 for the woven fabric
and R2 = 0.52 for the nonwoven fabric). This trend was due to the increased filtering and
impingement of soil particles on the fabric with increases in the SSC in contact with the silt
fence. This increase in filtering caused reduction of the fabric pore size and limited the ability of
water to flow through the silt fence. The plot shows how strongly influenced the flow-through
rate of silt fence fabrics can be on the concentration of suspended solids in contact with them.
The plot also shows that the flow-through rates encountered in the field are more a function of
the upstream suspended solids concentration than the initial permittivity or AOS of the fabric.
R² = 0.6882
R² = 0.4974
0
1000
2000
3000
4000
5000
0 10000 20000 30000 40000 50000 60000
Flo
w-T
hro
ugh R
ate
(L/m
²/h)
Upstream Suspended Solids Concentration (mg/L)
Woven Fabric
Nonwoven Fabric
Expon. (Woven Fabric)
Expon. (Nonwoven Fabric)

78
It would have been interesting to test the effect of changing upstream SSC on the flow-
through rate of used fabrics. For instance, testing the fabric under a high slope (high
concentration) condition during Test 1. Then, during Test 2, testing the same silt fence under a
lower slope (lower concentration) condition to see if the high influent concentration from Test 1
would have affected the flow-through rate encountered in Test 2. In this study, these tests were
not conducted, however, changing rainfall intensity under the same embankment slope was, and
is the topic of the next section.
Comparing flow-through rate from Test 1 to Test 2
Comparing the flow-through rate of the silt fence from Test 1 to Test 2 can give insight
into how the fabric is affected by multiple rain events occurring without maintenance being
performed. A Wilcoxon signed rank test on the difference between Test 1 and Test 2 was
completed on the time dependent flow-through rate values to determine if a significant change in
the flow-through rate occurred from Test 1 to Test 2 for each embankment slope. The test was
conducted on the difference between Test 1 and Test 2 because the flow-through rate data show a
trend of increasing with time during the rain event due to the increasing ponding depth. For this
reason, the statistical analysis is performed by pairing the flow-through rates on a time dependent
basis between Test 1 and Test 2. The statistical analysis is shown in Table 42 of Appendix C for
both woven and nonwoven fabrics.
The mean flow-through rates for both fabrics occurring on Test 1 and Test 2 during the
rain event are presented in Table 9 for each embankment slope and intensity pair tested.

79
TABLE 9 AVERAGE FLOW-THROUGH RATE OCCURRING DURING THE RAIN EVENT BETWEEN
TEST 1 AND TEST 2 FOR BOTH WOVEN AND NONWOVEN FABRICS
Slope
%
(Ratio)
Rainfall
Intensity
(mm/h)
Rainfall
Events
Average Flow-through rate During the Rain Event (L/m2/h)
Woven Fabric Nonwoven Fabric
Test 1
(New Fabric)
Test 2
(Used Fabric)
Test 1
(New Fabric)
Test 2
(Used Fabric)
33%
(3
:1)
Slo
pe
25 #1, #2 27 68 198 228
#1R, #2R 44 102 340 476
76 #1, #2 131 -- 254 324
#1R, #2R 97 167 583 504
127 #1, #2 154 -- 344 --
#1R, #2R 51 -- 389 648
25%
(4:1
)
Slo
pe
25 #1, #2 117 132 636 411
#1R, #2R -- -- 1386 1085
76 #1, #2 167 260 1620 1629
#1R, #2R -- -- 1433 1368
127 #1, #2 370 424 1985 652
#1R, #2R -- -- 1091 892
10%
(10:1
)
Slo
pe
25 #1, #2 805 1279 464 604
#1R, #2R 244 992 1142 2859
76 #1, #2 2057 1516 3384 1293
#1R, #2R 1129 1272 2690 2141
127 #1, #2 1458 1262 1513 1265
#1R, #2R -- -- 3774 3702
Table entries that appear with "--" indicate that the flow-through rate could not be calculated during these tests due to test
failures
The statistical analysis showed that, for the woven fabric, there was a trend of
increasing flow-through rate from Test 1 to Test 2 on the combination of all embankment slope
tested. This trend was also significant on the 25 and 33 percent slopes, however, it was not
significant on the 10 percent slope The increase in flow-through rate suggest that the pore spaces

80
of the fabric increased from Test 1 to Test 2, allowing an increase in the rate at which water was
allowed to flow through the silt fence.
The statistical analysis also showed that, for the nonwoven fabric, there was a trend of
decreasing flow through rate from Test 1 to Test 2 on 10 and 25 percent slopes, however the
trend was only significant with 95 percent confidence on the 25 percent slope. The decrease in
flow-through rate conforms with the results from the section: Nonwoven Fabric Reduction
Efficiency from Test 1 to Test 2, in which the reduction efficiency was found to increase from
Test 1 to Test 2. These tests suggest that it is likely that the impingement of particles within the
fabric decreased the pore size of the fabric and caused both an increase in the reduction
efficiency and a decrease in the flow-through rate from Test 1 to Test 2.
However, for the nonwoven fabric on the 33 percent slope, the statistical analysis showed
that there was a trend of increasing flow-through rate from Test 1 to Test 2, but the result was not
significant for 95 percent confidence interval. Although the trend suggest an increase in flow-
through rate from Test 1 to Test 2, review of the time dependent flow-through rate results shown
in Table 51 of Appendix C suggest that the impingement of particles within the fabric from Test
1 did decreased the flow-through rate of this fabric in Test 2. The decrease in flow-through rate
however only occurred for the first couple of samples taken. The reason for this is shown
graphically in Figure 14 below for testing done on a 33 percent slope and 76 mm/h rainfall event
on the nonwoven fabric.

81
FIGURE 14 NONWOVEN FABRIC CHANGE IN FLOW RATE WITH CHANGE IN PONDING DEPTH
BETWEEN TEST 1 AND TEST 2 ON A 33 PERCENT SLOPE
Figure 14 shows the flow-through rate and ponding depth during Test 1 and Test 2 on a
33 percent slope and a 76 mm/h rainfall event for the nonwoven fabric. Results for other tests on
the 33 percent slope show similar trends. Note the point where the ponding depth during Test 2
surpasses the maximum ponding depth that occurred during all of Test 1. This point occurs at
minute 20 at a ponding depth of 30 cm. During Test 2, when the ponding depth is less than the
maximum ponding depth that occurred during Test 1, the flow-through rate is less than the flow-
through rate during Test 1. This indicates that impingement of particles within the fabric from
Test 1 decreased the flow-through rate that occurred during Test 2. However, at minute 20 of
Test 2, the ponding depth became higher than the maximum depth that occurred during Test 1
and the flow-through rate increased substantially. The increase in flow-through rate was because
the ponding water was no longer influenced by the impinged particles from Test 1.
0
5
10
15
20
25
30
35
0
200
400
600
800
1000
1200
0 5 10 15 20 25 30
Po
nd
ing D
epth
(cm
)
Flo
w-t
hro
ugh r
ate
(L/m
²/h)
Time During the Rain Event (min)
Flow Through Rate (Test 1) Flow Through Rate (Test 2)
Ponding Depth (Test 1) Ponding Depth (Test 2)

82
This trend and the overlying results with the nonwoven fabric show its susceptibility to
forming a filter cake within and on its fabric. Although the woven fabric also filters the
concentrated water, the impingement of particles within this fabric did not seem to affect its
performance in future tests. It is possible that once the woven fabric is given time to dry, the
impinged particles fall off the surface of the fabric. However, for the nonwoven fabric, the
particles remained impinged within the fabric itself and affected its future performance.
Figure 15 shows the filter cake formation on the nonwoven fabric over the span of Test
1 and Test 2. When the concentrated water was in contact with the nonwoven fabric, a filter
cake formed on its surface as shown in Figure 15b. During Test 2, when the ponding depth was
in contact with the fabric with filter cake on it, the flow-through rate of the fabric was decreased
and the efficiency of the fabric was increased. When the ponding depth during Test 2 became
higher than the filter cake from Test 1, a new filter cake started to form on this new fabric.
Figure 15c shows the increase in filter cake height from Test 1 to Test 2.

83
FIGURE 15 FILTER CAKE FORMATION ON NONWOVEN (A) UNTESTED FABRIC (B) CAKE
FORMATION AFTER COMPLETION OF TEST 1 (C) CAKE FORMATION AFTER COMPLETION OF TEST
2

84
Overall, the results of the analyses show that the flow-through rate for both fabrics
changed from Test 1 to Test 2. For the woven fabric, testing on the fabric caused an increase in
the flow-through rate that is most likely caused by an increase in the pore size of the fabric. For
the nonwoven fabric, previous testing on the fabric caused decreases in the flow-through rate due
to impingent of particles within and on the fabric. It is interesting that even though the flow-
through rate increased for the woven fabric and decreased for the nonwoven fabric from Test 1 to
Test 2, the flow-through rates on the nonwoven fabric remained higher than the woven fabric
during Test 2. It would have been interesting to test if this trend of increasing flow-through rate
of the woven fabric and decreasing flow-through rate of the nonwoven fabric would have
continue over additional testing on both fabrics.
Comparing flow-through rates due to changing rainfall intensity
A single factor ANOVA was performed on the flow-through rates to determine if
changes in the rainfall intensity affected the flow-through rate of the fabrics on each
embankment slope. Results of these tests are shown in Table 43 and Table 44 of Appendix C for
the woven and nonwoven fabrics, respectively. Similar with results presented by Gogo-Abite
and Chopra (2013), the rainfall intensity significantly affected the flow-through rate of the
woven fabric with probabilities of 0.000, 0.000, and 0.002 for falsely rejecting the null
hypotheses on 10, 25 and 33 percent slopes, respectively. The rainfall intensity also significantly
affected the flow-through rate through the nonwoven fabric as well on 10 and 25 percent slopes,
with probabilities of 0.001 and 0.000, respectively. The rainfall intensity however did not
significantly affect the flow-through rate on the 33 percent slope for the nonwoven fabric, with
probability of 0.176.

85
Results show that the lowest mean flow-through rates occurred on the lowest rainfall
intensity of 25 mm/h for both fabrics on all embankment slopes tested. The reason for the higher
flow-through rates occurring on the higher intensity rainfall events may be attributed to the
fabrics stretching and elongation under stress caused by these higher intensity rainfall events.
The higher rainfall intensity increases the upstream ponding volume, which causes a larger
pressure on the silt fence. The increased water pressure may have caused a greater force to
develop which pushed water through the fabric at a greater rate.
Silt Fence Failure
Due to the trend of decreasing flow-through rate with increasing embankment slope and
the decreased storage volume on the higher slopes, the ponding depth behind the silt fence
reached high levels during testing with both fabrics on the 33 percent slope. The high ponding
depths increased the chance of silt fence failure by means of both tearing and ripping of the silt
fence or by failure of the wooden stakes due to the increased hydrostatic pressure brought on by
the high ponding depth. In addition, low flow-through rate of the silt fence caused it to fail by
means of overtopping. Throughout the field scale testing with both fabrics, five silt fence
failures and two overtopping events occurred over the span of all tests. The types of silt fence
failures that occurred during testing are shown in Figure 16.

86
FIGURE 16 SILT FENCE FAILURES: (A) PULLOUT OF FABRIC FROM MIDDLE STAKE ON 33%
SLOPE (B) OVERTOPPING ON 33% SLOPE (C) CORNER STAKE FAILURE ON 33% SLOPE (D)
CORNER STAKE TEAR ON 25% SLOPE
For the woven fabric, it was observed that high slopes (33%) and high intensity (127
mm/h) caused the ponding water to overtop the silt fence during each rainfall event in less than
30 minutes. This failure is depicted in Figure 16b. Failures of this nature were not observed
while testing the nonwoven fabric due to the ability of this fabric to transmit water at a large
enough rate to avoid overtopping failures under the conditions evaluated in this study. Other
failures that occurred during testing with the woven fabric include pullout of the fabric from the

87
stake and fabric tears occurring at corner stakes as shown in Figure 16a and Figure 16d. Pullout
of the fabric from the stake occurred during only one test, on a 33 percent slope and 76 mm/h
rainfall event, while the failures involving fabric tears at corner stakes occurred multiple times
on 25 and 33 percent slopes. Once again, no such failures of this nature were observed for the
nonwoven fabric. However, during testing on a 33 percent slope and a 127 mm/h rainfall event,
a corner stake broke in half as shown on Figure 16c and caused failure to occur with the
nonwoven fabric. It should be noted however, that during the repeat test on this same slope and
intensity the nonwoven silt fence did not fail or overtop.
One of the reason that failures such as pullout of the fabric from the stake and fabric
tearing at the corners occurred on the woven fabric and not on the nonwoven fabric was because
the common woven silt fence used in this study did not come furnished with nailing strips
attached to the stakes. These nailing strips are thin pieces of wood that sandwich the silt fence
between the stake and the nailing strip itself. This construction helped to distribute the load
caused by ponding water over the entire length of the post rather than at discrete points as would
be the case if the material was just stapled without the nailing strips attached (Risse et al. 2008).
The difference in strength between the fabrics may also have contributed, but it seems that the
nailing strips were very helpful in preventing the nonwoven fabric from failing by pullout or tear.

88
Fabric Performance following Rain Events
Fabric Reduction Efficiency following Rain Events
Grab samples were collected both upstream and downstream of the silt fence for 30
minutes after rainfall ended. Samples were collected in order to determine the performance of
silt fence after rainfall stopped. Under high intensity rainfall as was simulated in these tests, the
flow rate of water that was transmitted through the silt fence was less than the flow rate of runoff
water. For this reason a ponding volume of runoff water accumulated on the upstream side of
the silt fence. When rainfall stopped, grab samples were taken both upstream and downstream of
the silt fence as the ponding volume continued to flow through the fabric, in order to evaluate the
performance of the silt fence after rainfall had stopped. It should be noted that samples were
taken for only 30 minutes after rainfall stopped, however, the estimated hydraulic detention time
of the ponding volume ranged from 1 hour to over 15 hours depending on the rainfall intensity,
embankment slope, and fabric type tested. Due to the large hydraulic detention times it was not
possible to collect samples over the entire time period. However, results show that performance
efficiency increased with time after rainfall ended and that downstream concentration values
decreased with time after rainfall ended. For this reason, the results discussed in this section,
which take into account only the first 30 minutes after rainfall ended, can be thought of as
conservative estimates of the true performance of silt fence after rainfall ends.
The efficiency values for after rainfall were calculated in a similar way as the during
rainfall calculations. Downstream samples were weighted by the volume of water which
discharged through the fabric in the time interval with which the sample was taken. The after
rainfall efficiency was then calculated by comparing the after rainfall volume-weighted mean

89
effluent concentration to the during rainfall volume-weighted mean influent concentration. The
expressions for the after rainfall efficiencies are shown in Equations 12 through 15.
(WMET)AR = ∑ [𝑇eff∗ 𝑉𝑑𝑜𝑤𝑛𝑠𝑡𝑟𝑒𝑎𝑚]𝑚
𝑖=0
∑ 𝑉𝑑𝑜𝑤𝑛𝑠𝑡𝑟𝑒𝑎𝑚𝑚𝑖=0
(12)
(𝑊𝑀𝐸𝐶)𝐴𝑅 = ∑ [𝑇𝑆eff∗ 𝑉𝑑𝑜𝑤𝑛𝑠𝑡𝑟𝑒𝑎𝑚]𝑚
𝑖=0
∑ 𝑉𝑑𝑜𝑤𝑛𝑠𝑡𝑟𝑒𝑎𝑚𝑚𝑖=0
(13)
𝐸𝑇(%)𝐴𝑅 = 100 ∗ [1 − (𝑊𝑀𝐸𝑇)𝐴𝑅
𝑊𝑀𝐼𝑇] (14)
𝐸𝑆𝑆𝐶(%)𝐴𝑅 = 100 ∗ [1 − (𝑊𝑀𝐸𝐶)𝐴𝑅
𝑊𝑀𝐼𝐶] (15)
where, (WMET)AR is the volume-weighted mean effluent turbidity after rainfall (NTU);
(WMEC)AR is the volume-weighted mean effluent concentration after rainfall (mg/L);
Vdownstream is the volume of collected runoff which discharged through the silt fence in interval
between sample i and sample i – 1 (L); m is the number of samples collected after rainfall;
ET(%)AR is the mean turbidity performance efficiency after rainfall; and ESSC(%)AR is the mean
suspended sediment concentration performance efficiency after rainfall. WMIT and WMIC
where defined previously in Equations 4 and 5, respectively. The volume-weighted mean
turbidity and suspended sediment concentrations as well as the performance efficiencies that
occurred after the rain event for both fabrics are shown in Table 10 and TABLE 11, respectively.

90
TABLE 10 WOVEN FABRIC TEST VOLUME-WEIGHTED MEAN TURBIDITY AND SSC RESULTS
AFTER THE RAIN EVENT
Slope %
(Ratio)
Rainfall
Intensity
(mm/h)
Rainfall
Events
Volume-Weighted Mean Turbidity Volume-Weighted Mean SSC
Up-
stream
(NTU)
Down-
stream
(NTU)
Performance
Efficiency
(%)
Up-
stream
(mg/L)
Down-
stream
(mg/L)
Performance
Efficiency
(%)
33%
(3:1
) S
lop
e
25
#1 50171 15791 69 32616 9010 72
#2 33573 6159 82 23412 4973 79
#1R 28738 5817 80 21001 4187 80
#2R 30096 3800 87 25614 3034 88
76
#1 43339 -- -- 40099 -- --
#2 -- -- -- -- -- --
#1R 41442 11000 73 21641 6096 72
#2R 27811 4579 84 17641 3677 79
127
#1 48311 -- -- 31212 -- --
#2 -- -- -- -- -- --
#1R 57945 -- -- 46322 -- --
#2R 40266 -- -- 35427 -- --
25%
(4:1
) S
lope 25
#1 29396 9426 68 19585 6422 67
#2 21551 6689 69 13875 4558 67
76 #1 19080 5993 69 13462 4380 67
#2 25891 6760 74 11361 3558 69
127 #1 47590 7676 84 15744 4123 74
#2 30530 2942 90 12755 2042 84
10
% (
10
:1)
Slo
pe
25
#1 12357 2104 83 10959 1722 84
#2 10839 1093 90 10743 915 91
#1R 13365 904 93 10468 787 92
#2R 9453 1614 83 5920 1165 80
76
#1 5358 1116 79 4215 1026 76
#2 3707 1170 68 3426 920 73
#1R 6036 932 85 4610 886 81
#2R 2619 916 65 2117 789 63
127 #1 4886 761 84 3982 781 80
#2 4321 907 79 3763 1000 73
Table entries that appear with "--" indicate that no samples were collected during those tests due to previous test failures

91
TABLE 11 NONWOVEN FABRIC TEST VOLUME-WEIGHTED MEAN TURBIDITY AND SSC RESULTS
AFTER THE RAIN EVENT
Slope %
(Ratio)
Rainfall
Intensity
(mm/h)
Rainfall
Events
Volume-Weighted Mean Turbidity Volume-Weighted Mean SSC
Up-
stream
(NTU)
Down-
stream
(NTU)
Performance
Efficiency
(%)
Up-
stream
(mg/L)
Down-
stream
(mg/L)
Performance
Efficiency
(%)
33%
(3:1
) S
lop
e
25
#1 29690 2775 91 27767 1479 95
#2 39009 1538 96 25079 1227 95
#1R 46765 3552 92 33356 2952 91
#2R 18628 2103 89 22205 1914 91
76
#1 40355 1681 96 31706 1835 94
#2 32081 969 97 24753 851 97
#1R 26588 802 97 19271 405 98
#2R 24696 954 96 19142 1027 95
127
#1 37989 -- -- 31958 -- --
#2 -- -- -- -- -- --
#1R 37008 1312 96 26679 1075 96
#2R 18925 460 98 13685 1235 91
25%
(4:1
) S
lope
25
#1 24380 4230 83 21495 3298 85
#2 20556 2981 85 17723 2053 88
#1R 22906 1692 93 18459 1290 93
#2R 22996 3509 85 17807 2752 85
76
#1 8780 946 89 6547 768 88
#2 6976 3210 54 5256 2729 48
#1R 8244 729 91 5608 599 89
#2R 3915 269 93 2720 237 91
127
#1 7772 1016 87 5544 834 85
#2 19213 4184 78 14032 319 98
#1R 14489 1523 89 13018 1212 91
#2R 8384 2326 72 7123 1732 76
10%
(10
:1)
Slo
pe
25
#1 13512 770 94 14449 647 96
#2 13824 525 96 14555 660 95
#1R 6631 1681 75 5962 1280 79
#2R 9973 1812 82 7318 1476 80
76
#1 9472 3765 60 10330 2224 78
#2 10282 2031 80 11088 1497 87
#1R 7217 823 89 5932 697 88
#2R 4736 803 83 3441 696 80

92
Slope %
(Ratio)
Rainfall
Intensity
(mm/h)
Rainfall
Events
Volume-Weighted Mean Turbidity Volume-Weighted Mean SSC
Up-
stream
(NTU)
Down-
stream
(NTU)
Performance
Efficiency
(%)
Up-
stream
(mg/L)
Down-
stream
(mg/L)
Performance
Efficiency
(%)
127
#1 12466 3408 73 7147 1999 72
#2 14303 1725 88 10503 1371 87
#1R 8629 2104 76 6416 1642 74
#2R 6044 1919 68 4779 1524 68
Table entries that appear with "--" indicate that no samples were collected during those tests due to previous test failures
The turbidity performance efficiency that occurred after the rain event in the first 30
minutes, for all slopes and intensities tested, for the woven and nonwoven fabrics had a mean of
79 and 86 percent; median of 81 and 89 percent, and ranged from 65 to 93 percent and from 54
to 98 percent, respectively. The SSC performance efficiency was similar, with mean of 77 and
87 percent; median of 77 and 89 percent; and ranged from 63 to 92 percent and from 48 to 98
percent for the woven and nonwoven fabrics, respectively.
Using the volume-weighted mean turbidity and SSC efficiencies shown in Table 10 and
TABLE 11 a Wilcoxon rank sum test was completed in order to determine if the performance
efficiencies on the nonwoven fabric were significantly greater than the efficiencies on the woven
fabric. The results of the analysis are shown in Table 29 of Appendix B. As was the case of the
results during rainfall, the after rainfall results also show that the nonwoven fabric significantly
reduced both turbidity and SSC to a greater extent than did the woven fabric when analyzed on
all embankment slopes combined. The greater removal by the nonwoven fabric can be attributed
to the smaller pore size of the nonwoven fabric in comparison to the woven fabric.

93
The above performance efficiencies were normalized based on the volume-weighted
mean influent turbidity and SCC occurring during the rain event. The efficiency after rainfall
can also be calculated on a time dependent basis by comparing the downstream concentration
that discharged through the fence at time t to the upstream concentration of the ponding volume
at the same time t. In this calculation, the effect of particle settling has been largely ignored and
the efficiency values are based on the filtering of the fabric at time t.
The results of these time dependent calculations are shown in Table 46 through Table
48 of Appendix D for the woven fabric and Table 49 through Table 51 of Appendix D for the
nonwoven fabric. A Wilcoxon rank sum test on the difference between the during and after
rainfall efficiencies was also conducted and is presented in Table 38 and Table 39 of Appendix B
for the woven and nonwoven fabrics, respectively. The statistical test was conducted on both the
during rainfall average performance efficiencies and the after rainfall average efficiencies in
order to determine if there was a statistically significant change in performance efficiency from
during rainfall to after rainfall on each embankment slope for each fabric. The results of the
analysis show that the performance efficiency for both the turbidity and SSC increased
significantly from during the rain event to after the rain event on all embankment slopes for both
fabrics. The efficiency increase was dependent on time, as the time since rainfall ended
increased, the efficiency of the fabric in removing turbidity and SSC increased. Figure 17
depicts the typical trend encountered for the increased mean turbidity performance efficiency and
the decrease in effluent turbidity with time after rainfall stopped. The plot shows the average
efficiencies and concentrations occurring on a 25 percent slope for both fabrics. This trend was
similar on all embankment slopes and also was similar for the SSC efficiency and

94
concentrations. Plots associated with the other embankment slopes as well as the SSC reductions
are shown in Figure 21 through Figure 25 in Appendix D.
FIGURE 17 TIME DEPENDENT AVERAGE TURBIDITY REDUCTION EFFICIENCY AND
DOWNSTREAM VALUE ON 10 PERCENT SLOPE
The black vertical line indicates the point at which rainfall stops. Points to the left are
efficiency and turbidity values during the rain event and points to the right are efficiency and
turbidity values after the rain event. After rainfall stopped the efficiency of the silt fence
increased substantially with time before leveling off. The opposite is true for the downstream
effluent turbidity, which decreased with time after rainfall stopped.
The increase in efficiency after rainfall ended was perhaps due to a combination of the
filtration ability of the fabric and the settling of the suspended sediments. A possible theory as to
why the observed filtration efficiency increased after rainfall ended is the topic of the next
couple of sections. Filtration is discussed first and a discussion on sedimentation follows.
0
1000
2000
3000
4000
5000
6000
7000
0
20
40
60
80
100
0 10 20 30 40 50 60 Dow
nst
ream
Tu
rbid
ity (
NT
U)
Turb
idit
y E
ffic
ien
cy (
%)
Sampling Time (min)
Woven Fabric Efficiency Nonwoven Fabric Efficiency
Woven Fabric Turbidity Nonwoven Fabric Turbidity

95
Filtration Mechanism
The ability of the silt fence fabric to filter the concentrated water volume is dependent
on the opening of the pore sizes of the fabric and on the relative size distribution of soil particles
in the ponding volume. At first, only those particle sizes that are in close or larger than the
opening size of the fabric will be filtered, while smaller particles will pass through. However,
over time, the opening size of the fabric will decrease due to impregnation of soil particles on the
fabric. The filtration efficiency of the fabric will therefore increase with time as it is exposed to
the concentrated water volume. This process is taking place both during and after the rain event.
The efficiency values remain somewhat low and do not increase during the rain event because
the ponding water volume behind the fence is constantly increasing and exposing new fabric to
the concentrated water volume with time. When the concentrated water volume reaches the new
fabric, the process repeats (i.e. a large portion of the soil distribution will pass through this
portion of the fabric until particles become impinged it). Figure 18 shows the typical
relationship between the height of ponding water behind the fence and the time dependent
efficiency values.

96
FIGURE 18 WOVEN FABRIC TIME DEPENDENT EFFICIENCY VALUES AND PONDING DEPTH ON 25
PERCENT SLOPE AND 25 MM/H RAINFALL INTENSITY
The plot shows that during the rain event, as the ponding depth is constantly increasing,
exposing new fabric to the ponding water volume, the efficiency values remain relatively low
and constant. When rainfall stopped, the efficiency of the silt fence system started to increase
with time. This increase with time was due in part to the clogging mechanism described above,
however, the main mechanism by which the efficiency increased was likely due to the
concentration gradient which forms within the pond after rainfall ends. Settling and
concentration gradient is discussed below.
Settling Mechanism
In the ponding volume upstream of the silt fence a vertical concentration gradient exists
due to settling. The lowest concentration exists at the top of the pond and the concentration
0
2
4
6
8
10
12
0
10
20
30
40
50
60
70
80
90
100
0 10 20 30 40 50 60
Po
nd
Dep
th (
cm)
Tu
rbid
ity E
ffic
ien
cy (
%)
Time (min)
Turbidity Efficiency Ponding Depth Rainfall Ends

97
increases as the depth increases. The increasing concentration gradient that forms after the rain
event ends is most likely main reason for the observed increasing efficiency.
During the rain event, the concentration gradient was not as noticeable as it was after
the rain event. Falling rainfall impacting the ponding volume as well as sheet flow colliding
with the ponding volume decreased the potential for the suspended sediments to settle.
Although, these collisions may disrupt sedimentation, the suspended particles will still settle
during the rain event. However, new sediment is constantly being introduced into the ponding
volume replacing particles which have settled. Therefore, during the rain event, a noticeable
concentration gradient did not form and the concentration throughout the vertical height of
ponding water remained relatively constant.
When rainfall stops, no new sediment is introduced into the ponding water volume and
a concentration gradient starts to form as suspended particles settle. Figure 19 shows a possible
trend of the concentration gradient which may form over time after rainfall ends.

98
FIGURE 19 CONCEPTUAL EXAMPLE OF HOW CONCENTRATION GRADIENT IN PONDING VOLUME
MAY CHANGE OVER TIME AFTER RAINFALL ENDS
The slanting lines represent the concentration in the ponding volume with depth. The
vertical dotted lines indicate the average concentration in the pond at that time. Figure 19 shows
that over time, due to settling, the average concentration in the ponding volume decreases. As
settling occurs, a concentration gradient may start to become more spread out over time.
Recall from the previous section: Filtration Mechanism, that over time, particles clog the
silt fence fabric, reducing its pore size. The reduction in pore size not only increase the
reduction efficiency of the fabric, but also limit the ability of the fabric to transmit water. For
this reason, parts of the fabric at the bottom will be transmit flow at a lesser rate than parts near
the top of the ponding volume. The increase in efficiency is due to both this difference in flow-
through rate and the increasing spread of the concentration gradient.
For example, referring to Figure 19 and the far right lines, the concentration at the top of
pond is relatively close to the average concentration in the pond, leading to low efficiency.
Po
nd
ing w
ater
hei
ght
Concentration
Concentration when rainfall ends
Concentration at time t1 after rainfall ends
Concentration at time t2 after rainfall ends

99
When rainfall stops, the suspended particles settle and no new sediment is introduced into the
system. The concentration gradient becomes more spread out, with the ratio between the
concentrations at the top of the pond to the average concentration in the pond increasing. This
leads to an observed increase in efficiency because a greater flow-through rate occurs near the
top of the ponding volume when compared to lower portions due to filter clogging. Essentially,
the increase in efficiency is because the rate of sedimentation at the top of the pond where the
flow-through rate is highest is greater than the overall settling velocity of the ponding volume as
a whole.
Flow-through rate after the Rainfall Event
The flow-through rate after the rain event decreased due to fabric clogging as was
observed with the downstream turbidity and SSC. A Wilcoxon rank sum test on the difference
between flow-through rates occurring during and after the rain event is shown in Table 45 in
Appendix C for the woven and nonwoven fabrics. The statistical analysis showed that there was
a significant decrease in the flow-through rate from during the rain event to after the rain event
for both fabrics on all embankment slopes tested, except for the woven fabric on a 10 percent
slope. The lower flow-through rate after rainfall ended is another indication that filter cake
formation on both fabrics affects the performance. Table 12 shows the average flow-through
rates that occurred during and after the rain event on all embankment slopes and rainfall
intensities tested.

100
TABLE 12 AVERAGE FLOW-THROUGH RATES DURING AND AFTER RAIN EVENTS
Embankment
Slope (%)
Rainfall
Intensity
(mm/h)
Mean Flow through rate (L/m2/h)
Woven Fabric Nonwoven Fabric
During
Rainfall
After
Rainfall
During
Rainfall
After
Rainfall
33
25 60 32 310 130
76 132 104 416 109
127 72 -- 460 132
25
25 125 75 880 295
76 214 132 1512 386
127 397 227 1155 262
10
25 830 771 1267 716
76 1494 1467 2377 520
127 1360 1084 2564 926
Table entries that appear with "--" indicate that no after rainfall samples were taken due to
overtopping events
Due to the low flow-through rate encountered on the higher slopes and the decreasing
flow-through rate after rainfall ended, the hydraulic detention time of the ponding volume
increased for some of the tests. More hydraulic detention time of the ponding volume gives
additional time for settling to occur. Thus, a high hydraulic detention time post rainfall would
therefore lead to higher efficiency removal. In this section, the efficiency values are based on
only the first 30 minutes after rainfall ended. However, the estimated hydraulic detention times
of the pond show that water would have discharged through the silt fence anywhere from 1 hour
to 15 hours depending on the embankment slope and fabric tested. The estimated hydraulic
detention time of the pond was calculated using the equation expressed in Equation 16. A
summary of the estimated average hydraulic detention times on each embankment slope for each
fabric are shown in Table 13.

101
𝜏𝐻𝐷 = (𝑉𝑝𝑜𝑛𝑑)
𝑒𝑛𝑑 𝑡𝑒𝑠𝑡∗(𝑃𝐷)𝑒𝑛𝑑 𝑡𝑒𝑠𝑡∗𝑏𝑇𝐵
(𝑞)𝑒𝑛𝑑 𝑡𝑒𝑠𝑡+ (𝑡)𝑒𝑛𝑑 𝑡𝑒𝑠𝑡 (16)
where, 𝜏𝐻𝐷 is the hydraulic detention time of the ponding volume when rainfall stops (h); Vpond is
the ponding volume for the 30 minutes after rainfall test sampling was completed; PD is the
ponding depth for the 30 minutes after rainfall test sampling was completed; bTB is the width of
silt fence perpendicular to flow; q is the measured flow-through rate for the 30 minutes after
rainfall test sampling was completed; and t is the 30 minutes after rainfall test event (h).
TABLE 13 ESTIMATED AVERAGE HYDRAULIC DETENTION TIME OF THE PONDING VOLUME
Embankment slope
(%)
Rainfall
intensity
(mm/h)
Average Hydraulic Detention Time (h)
Woven Fabric Nonwoven Fabric
33
25 15.2 4
76 11.7 9.5
127 -- 10
25
25 4.2 2.2
76 6.6 3.5
127 7 6.3
10
25 1.1 1.8
76 0.9 4.5
127 1.3 4.7
Table entries that appear with "--" indicate that test failures occurred during the rain
event and the hydraulic detention time could not be calculated
In general the woven fabric had higher hydraulic detention times due to its low flow-
through rate. The exception occurs on the 10 percent slope where the nonwoven fabric had very
low measured flow-through rates at the end of the 30 minutes after rainfall test, leading to
relatively high estimated detention times on this slope in comparison with the woven fabric. The
reason for this is unknown. It can also be seen that the detention times, for the most part,

102
increased with increasing embankment slope. This was due to the trend of decreasing flow-
through rate with increasing upstream suspended solids concentration caused by the increasing
embankment slope.

103
Overall Performance Efficiency (Collected): Both During and After Rain events
In order to quantify the overall efficiency of silt fence, an overall weighted mean
effluent value was calculated based on discharge volume. The overall weighted mean effluent
value was then compared to the volume-weighted influent occurring during the rain event to
obtain an overall performance efficiency of the silt fence. The expression for the overall
efficiency is shown in Equations 17 through 20.
(WMET)Overall = ∑ [𝑇effDR
∗ 𝑉𝑑𝑜𝑤𝑛𝐷𝑅]𝑛
𝑖=0 + ∑ [𝑇effAR∗ 𝑉𝑑𝑜𝑤𝑛𝐴𝑅
]𝑚𝑖=0
∑ 𝑉𝑑𝑜𝑤𝑛𝐷𝑅𝑛𝑖=0 + ∑ 𝑉𝑑𝑜𝑤𝑛𝐴𝑅
𝑚𝑖=0
(17)
(WMEC)Overall = ∑ [𝑆𝑆𝐶effDR
∗ 𝑉𝑑𝑜𝑤𝑛𝐷𝑅]𝑛
𝑖=0 + ∑ [𝑆𝑆𝐶effAR∗ 𝑉𝑑𝑜𝑤𝑛𝐴𝑅
]𝑚𝑖=0
∑ 𝑉𝑑𝑜𝑤𝑛𝐷𝑅𝑛𝑖=0 + ∑ 𝑉𝑑𝑜𝑤𝑛𝐴𝑅
𝑚𝑖=0
(18)
𝐸𝑇(%)𝑂𝑣𝑒𝑟𝑎𝑙𝑙 = 100 ∗ [1 − (𝑊𝑀𝐸𝑇)𝑂𝑣𝑒𝑟𝑎𝑙𝑙
𝑊𝑀𝐼𝑇] (19)
𝐸𝑆𝑆𝐶(%)𝑂𝑣𝑒𝑟𝑎𝑙𝑙 = 100 ∗ [1 − (𝑊𝑀𝐸𝐶)𝑂𝑣𝑒𝑟𝑎𝑙𝑙
𝑊𝑀𝐼𝐶] (20)
where, (WMET)Overall is the overall volume-weighted mean effluent turbidity (NTU);
(WMEC)Overall is the overall volume-weighted mean effluent concentration (mg/L); Vdown is the
volume of collected runoff which discharged through the silt fence in interval between sample i
and sample i – 1 (L); n is the number of samples collected during rainfall; m is the number of
samples collected after rainfall; EFF stands for effluent; DR stands for during rainfall; AR stands
for after rainfall; ET(%)Overall is the overall mean turbidity performance efficiency; and
ESSC(%)Overall is the mean suspended sediment concentration performance efficiency. WMIT and
WMIC where defined previously in Equations 4 and 5, respectively.

104
Note that the calculation takes into account only those samples that were collected
during the 1-hour test. Flow would have continued to discharged through the silt fence for
upwards of 14 additional hours depending on the test type, and would have led to an increased
overall efficiency value. Therefore, the results shown in this section can be thought of as
conservative estimates of the performance efficiency of silt fence. The mean overall efficiency
values under all embankment slope and intensity pairs for both the woven and nonwoven fabrics
are shown in Table 14 and Table 15, respectively. Discussion of a projected overall efficiency
calculation, which would take into account the entire hydraulic detention time of the test, is the
topic of the next section.

105
TABLE 14 OVERALL PERFORMANCE EFFICIENCY OF WOVEN SILT FENCE (COLLECTED SAMPLES)
Slope %
(Ratio)
Rainfall
Intensity
(mm/h)
Rainfall
Events
Volume-Weighted Mean Turbidity Volume-Weighted Mean SSC
Up-
stream
(NTU)
Down-
stream
(NTU)
Performance
Efficiency
(%)
Up-
stream
(mg/L)
Down-
stream
(mg/L)
Performance
Efficiency
(%)
33%
(3:1
) S
lop
e
25
#1 50171 20002 60 32616 11363 65
#2 33573 12059 64 23412 10902 53
#1R 28738 13334 54 21001 9337 56
#2R 30096 12518 58 25614 9712 62
76
#1 43339 -- -- 40099 -- --
#2 -- -- -- -- -- --
#1R 41442 16522 60 21641 9831 55
#2R 27811 9668 65 17641 7534 57
127
#1 48311 -- -- 31212 -- --
#2 -- -- -- -- -- --
#1R 57945 -- -- 46322 -- --
#2R 40266 -- -- 35427 -- --
25%
(4:1
) S
lope 25
#1 29396 16928 42 19585 11006 44
#2 21551 11151 48 13875 8287 40
76 #1 19080 11187 41 13462 8597 36
#2 25891 14189 45 11361 6815 40
127 #1 47590 16708 65 15744 9053 42
#2 30530 12383 59 12755 5867 54
10
% (
10
:1)
Slo
pe
25
#1 12357 4719 62 10959 3950 64
#2 10839 2164 80 10743 1642 85
#1R 13365 2830 79 10468 2030 81
#2R 9453 3478 63 5920 2473 58
76
#1 5358 2678 50 4215 2095 50
#2 3707 2160 42 3426 1694 51
#1R 6036 2375 61 4610 1947 58
#2R 2619 1668 36 2117 1359 36
127 #1 4886 2227 54 3982 1761 56
#2 4321 2024 53 3763 1753 53
Table entries that appear with "--" indicate that no samples were collected during those tests due to previous test failures

106
Table 15 OVERALL PERFORMANCE EFFICIENCY OF NONWOVEN SILT FENCE (COLLECTED
SAMPLES)
Slope %
(Ratio)
Rainfall
Intensity
(mm/h)
Rainfall
Events
Volume-Weighted Mean Turbidity Volume-Weighted Mean SSC
Up-
stream
(NTU)
Down-
stream
(NTU)
Performance
Efficiency
(%)
Up-
stream
(mg/L)
Down-
stream
(mg/L)
Performance
Efficiency
(%)
33%
(3:1
) S
lope
25
#1 29690 9039 70 27767 6061 78
#2 39009 2049 95 25079 2203 91
#1R 46765 17232 63 33356 12133 64
#2R 18628 6490 65 22205 5904 73
76
#1 40355 11954 70 31706 9462 70
#2 32081 7750 76 24753 6754 73
#1R 26588 15692 41 19271 9609 50
#2R 24696 9682 61 19142 7446 61
127
#1 37989 -- -- 31958 -- --
#2 -- -- -- -- -- --
#1R 37008 12601 66 26679 10563 60
#2R 18925 9646 49 13685 4939 64
25%
(4:1
) S
lope
25
#1 24380 9056 63 21495 6650 69
#2 20556 5820 72 17723 4224 76
#1R 22906 13817 40 18459 9592 48
#2R 22996 7336 68 17807 5629 68
76
#1 8780 6759 23 6547 5740 12
#2 6976 5043 28 5256 3876 26
#1R 8244 4979 40 5608 3561 37
#2R 3915 2050 48 2720 954 65
127
#1 7772 5546 29 5544 3958 29
#2 19213 8063 58 14032 5147 63
#1R 14489 6957 52 13018 4928 62
#2R 8384 3513 58 7123 2635 63
10%
(10
:1)
Slo
pe
25
#1 13512 1615 88 14449 1180 92
#2 13824 1248 91 14555 1338 91
#1R 6631 2144 68 5962 1620 73
#2R 9973 3136 69 7318 2384 67
76
#1 9472 4518 52 10330 3033 71
#2 10282 2526 75 11088 2045 82
#1R 7217 4480 38 5932 3205 46
#2R 4736 1415 70 3441 1093 68

107
Slope %
(Ratio)
Rainfall
Intensity
(mm/h)
Rainfall
Events
Volume-Weighted Mean Turbidity Volume-Weighted Mean SSC
Up-
stream
(NTU)
Down-
stream
(NTU)
Performance
Efficiency
(%)
Up-
stream
(mg/L)
Down-
stream
(mg/L)
Performance
Efficiency
(%)
127
#1 12466 6737 46 7147 3903 45
#2 14303 4585 68 10503 2322 78
#1R 8629 4872 44 6416 3805 41
#2R 6044 2935 51 4779 2211 54
Table entries that appear with "--" indicate that no samples were collected during those tests due to previous test failures
The overall performance efficiency of the woven fabric ranged from 36 to 80 percent
and from 36 to 85 percent with a mean of 57 and 54 percent for the turbidity and suspended
sediment concentrations, respectively. For the nonwoven fabric, the overall performance
efficiency ranged from 23 to 95 percent and 12 to 92 percent with a mean of 59 and 62 percent
for the turbidity and sediment concentrations, respectively. These performance results show that
the nonwoven fabric performed slightly better than the woven fabric in the overall removal of
turbidity and suspended sediment concentrations.
Table 16 shows a summary of the above overall efficiency results as well as a summary
of efficiency results from during and after the rain event.

108
TABLE 16 SUMMARY OF VOLUME-WEIGHTED MEAN TURBIDITY AND SCC PERFORMANCE
EFFICIENCY
Performance
criteria
Slope
(%)
Statistical
parameter
Woven Nonwoven
During
rainfall
After
rainfall Overall
During
rainfall
After
rainfall Overall
Turbidity
Performance
Efficiency
(%)
All
slopes
Mean 40 79 57 49 86 59
Median 38 81 59 49 89 62
33 Mean 47 79 60 52 95 66
Median 50 81 60 50 96 66
25 Mean 31 76 50 37 83 48
Median 26 71 47 38 86 50
10 Mean 38 81 58 58 80 63
Median 36 83 58 61 81 68
SSC
Performance
Efficiency
(%)
All
slopes
Mean 39 77 54 53 87 62
Median 37 77 54 55 89 64
33 Mean 47 78 58 56 94 68
Median 45 79 56 55 95 68
25 Mean 21 71 43 41 85 52
Median 19 68 41 47 88 63
10 Mean 41 79 59 62 82 67
Median 40 80 57 67 80 69
The overall efficiency values show that the nonwoven achieved slightly higher fabric
efficiency values for both the turbidity and SSC on every slope and intensity pair except on the
25 percent slope for turbidity. A statistical analysis in the form of a Wilcoxon rank sum test was
performed on the overall volume-weighted mean performance efficiencies in order to determine
if the nonwoven fabric significantly reduced turbidity and SSC to a greater extent than the woven
fabric. Presented in Table 30 of Appendix B are the results of this analysis. Results show that
there was not a significant difference in the overall turbidity performance efficiency of the
woven and nonwoven fabric on any embankment slope. However, there was a significant
difference in the overall SSC performance efficiency of the woven and nonwoven fabrics on 25

109
and 33 percent slopes. All other embankment slopes showed no significant difference between
the performance efficiencies of either fabric.
The result of the woven and nonwoven not having statistically different performance
efficiencies is interesting since the nonwoven fabric significantly removed both turbidity and
SCC to a greater extent than the woven fabric on combination of all embankment slopes both
during and after the rain event. The reason for the similar performance efficiencies was due to
the flow-through rates of both fabrics. How the flow-through rate affects the overall efficiency is
discussed in the following section: Overall Performance Efficiency (Projected).

110
Overall Performance Efficiency (Projected)
The field-scale testing procedure allowed for only 1-hour sampling time. However, as
shown in Chapter 4, section: Flow-through rate after the rainfall event, the projected hydraulic
detention time of the ponding volume was as high as 15 hours. Much of the turbidity and SCC
removal will occur during the long hydraulic detention time after rainfall has ended due to
settling and increased filtration. The focus of this section is to calculate an overall projected
performance efficiency of silt fence which takes into the removal which occurs during the entire
hydraulic detention time of the system.
Two assumptions are needed in order to calculate the projected performance efficiency.
1) The entire ponding volume upstream of the silt fence would have discharge through the silt
fence. This assumption negates water losses through infiltration of the soil and evaporation. 2)
The concentration of the last downstream measurement taken during sampling would have
continued to discharge through the silt fence. This assumption can be considered conservative.
Due to settling and increased filtration, the downstream discharge concentration was shown to
decrease with time after rainfall ended as shown in Chapter 4, section: Fabric reduction
efficiency following rain events. Noting these assumption, the overall projected efficiency is
calculated as expressed in Equations 21 through 24.
(WMET)Projected = ∑ [𝑇effDR
∗ 𝑉𝑑𝑜𝑤𝑛𝐷𝑅]𝑛
𝑖=0 + ∑ [𝑇effAR∗ 𝑉𝑑𝑜𝑤𝑛𝐴𝑅
]𝑚𝑖=0 +[(𝑇𝐸𝐹𝐹𝐴𝑅
)𝑚
∗(𝑉𝑢𝑝)𝑚
]
∑ 𝑉𝑑𝑜𝑤𝑛𝐷𝑅𝑛𝑖=0 + ∑ 𝑉𝑑𝑜𝑤𝑛𝐴𝑅
𝑚𝑖=0 +(𝑉𝑢𝑝)
𝑚
(21)
(WMEC)Projected = ∑ [𝑆𝑆𝐶effDR
∗ 𝑉𝑑𝑜𝑤𝑛𝐷𝑅]𝑛
𝑖=0 + ∑ [𝑆𝑆𝐶effAR∗ 𝑉𝑑𝑜𝑤𝑛𝐴𝑅
]𝑚𝑖=0 +[(𝑆𝑆𝐶𝐸𝐹𝐹𝐴𝑅
)𝑚
∗(𝑉𝑢𝑝)𝑚
]
∑ 𝑉𝑑𝑜𝑤𝑛𝐷𝑅𝑛𝑖=0 + ∑ 𝑉𝑑𝑜𝑤𝑛𝐴𝑅
𝑚𝑖=0 +(𝑉𝑢𝑝)
𝑚
(22)
𝐸𝑇(%)𝑃𝑟𝑜𝑗𝑒𝑐𝑡𝑒𝑑 = 100 ∗ [1 − (𝑊𝑀𝐸𝑇)𝑃𝑟𝑜𝑗𝑒𝑐𝑡𝑒𝑑
𝑊𝑀𝐼𝑇] (23)

111
𝐸𝑆𝑆𝐶(%)𝑃𝑟𝑜𝑗𝑒𝑐𝑡𝑒𝑑 = 100 ∗ [1 − (𝑊𝑀𝐸𝐶)𝑃𝑟𝑜𝑗𝑒𝑐𝑡𝑒𝑑
𝑊𝑀𝐼𝑇] (24)
where (WMET)Projected is the projected weighted mean effluent turbidity (NTU); (𝑇𝐸𝐹𝐹𝐴𝑅)
𝑚 is
the effluent turbidity of the last sample taken during the 1-hour test (NTU); (𝑉𝑢𝑝)𝑚
is the volume
of ponding water upstream of the silt fence when the last sample during the test was taken (L);
(WMEC)Projected is the projected weighted mean effluent SCC (mg/L); (𝑆𝑆𝐶𝐸𝐹𝐹𝐴𝑅)
𝑚is the
effluent SSC of the last sample taken during the 1-hour test (mg/L); 𝐸𝑇(%)𝑃𝑟𝑜𝑗𝑒𝑐𝑡𝑒𝑑 is the
projected turbidity performance efficiency; 𝐸𝑆𝑆𝐶(%)𝑃𝑟𝑜𝑗𝑒𝑐𝑡𝑒𝑑 is the projected SSC performance
efficiency. All other terms have been describe previously. The mean overall projected volume-
weighted turbidity and SCC efficiencies are shown in Table 17 and Table 18 and for the woven
and nonwoven fabrics, respectively.

112
TABLE 17 PROJECTED OVERALL WOVEN FABRIC PERFORMANCE EFFICIENCY
Slope %
(Ratio)
Rainfall
Intensity
(mm/h)
Rainfall
Events
Volume-Weighted Mean Turbidity Volume-Weighted Mean SSC
Up-
stream
(NTU)
Down-
stream
(NTU)
Performance
Efficiency
(%)
Up-
stream
(mg/L)
Down-
stream
(mg/L)
Performance
Efficiency
(%)
33%
(3:1
) S
lop
e
25
#1 50171 1534 97 32616 1091 97
#2 33573 1554 95 23412 1507 94
#1R 28738 756 97 21001 709 97
#2R 30096 1916 94 25614 1705 93
76
#1 43339 -- -- 40099 -- --
#2 -- -- -- -- -- --
#1R 41442 1755 96 21641 994 95
#2R 27811 1331 95 17641 1282 93
127
#1 48311 -- -- 31212 -- --
#2 -- -- -- -- -- --
#1R 57945 -- -- 46322 -- --
#2R 40266 -- -- 35427 -- --
25%
(4:1
) S
lope 25
#1 29396 2803 90 19585 2007 90
#2 21551 3199 85 13875 2487 82
76 #1 19080 2168 89 13462 1776 87
#2 25891 2926 89 11361 1640 86
127 #1 47590 3950 92 15744 1700 89
#2 30530 2509 92 12755 1420 89
10
% (
10
:1)
Slo
pe
25
#1 12357 4399 64 10959 3693 66
#2 10839 2005 82 10743 1531 86
#1R 13365 1383 90 10468 1093 90
#2R 9453 3167 66 5920 2273 62
76
#1 5358 2605 51 4215 2044 52
#2 3707 1889 49 3426 1513 56
#1R 6036 1856 69 4610 1558 66
#2R 2619 1297 50 2117 1091 48
127 #1 4886 1873 62 3982 1523 62
#2 4321 1713 60 3763 1516 60
Table entries that appear with "--" indicate that no samples were collected during those tests due to previous test failures

113
TABLE 18 PROJECTED OVERALL NONWOVEN FABRIC PERFORMANCE EFFICIENCY
Slope %
(Ratio)
Rainfall
Intensity
(mm/h)
Rainfall
Events
Volume-Weighted Mean Turbidity Volume-Weighted Mean SSC
Up-
stream
(NTU)
Down-
stream
(NTU)
Performance
Efficiency
(%)
Up-
stream
(mg/L)
Down-
stream
(mg/L)
Performance
Efficiency
(%)
33%
(3:1
) S
lop
e
25
#1 29690 1609 95 27767 1153 96
#2 39009 758 98 25079 875 97
#1R 46765 4222 91 33356 3135 91
#2R 18628 2771 85 22205 2665 88
76
#1 40355 1121 97 31706 1073 97
#2 32081 1080 97 24753 1127 95
#1R 26588 2750 90 19271 1886 90
#2R 24696 1834 93 19142 1624 92
127
#1 37989 -- -- 31958 -- --
#2 -- -- -- -- -- --
#1R 37008 1364 96 26679 1296 95
#2R 18925 2265 88 13685 1279 91
25%
(4:1
) S
lope
25
#1 24380 3549 85 21495 2701 87
#2 20556 2016 90 17723 1626 91
#1R 22906 11037 52 18459 7684 58
#2R 22996 5581 76 17807 4324 76
76
#1 8780 3867 56 6547 3397 48
#2 6976 2819 60 5256 2251 57
#1R 8244 2648 68 5608 2032 64
#2R 3915 1195 69 2720 614 77
127
#1 7772 3061 61 5544 2269 59
#2 19213 1955 90 14032 1410 90
#1R 14489 2729 81 13018 2042 84
#2R 8384 1354 84 7123 1115 84
10%
(1
0:1
) S
lop
e 25
#1 13512 878 94 14449 714 95
#2 13824 855 94 14555 971 93
#1R 6631 1985 70 5962 1515 75
#2R 9973 2889 71 7318 2215 70
76
#1 9472 3831 60 10330 2599 75
#2 10282 1751 83 11088 1480 87
#1R 7217 3556 51 5932 2578 57
#2R 4736 1152 76 3441 926 73
127 #1 12466 4105 67 7147 2410 66
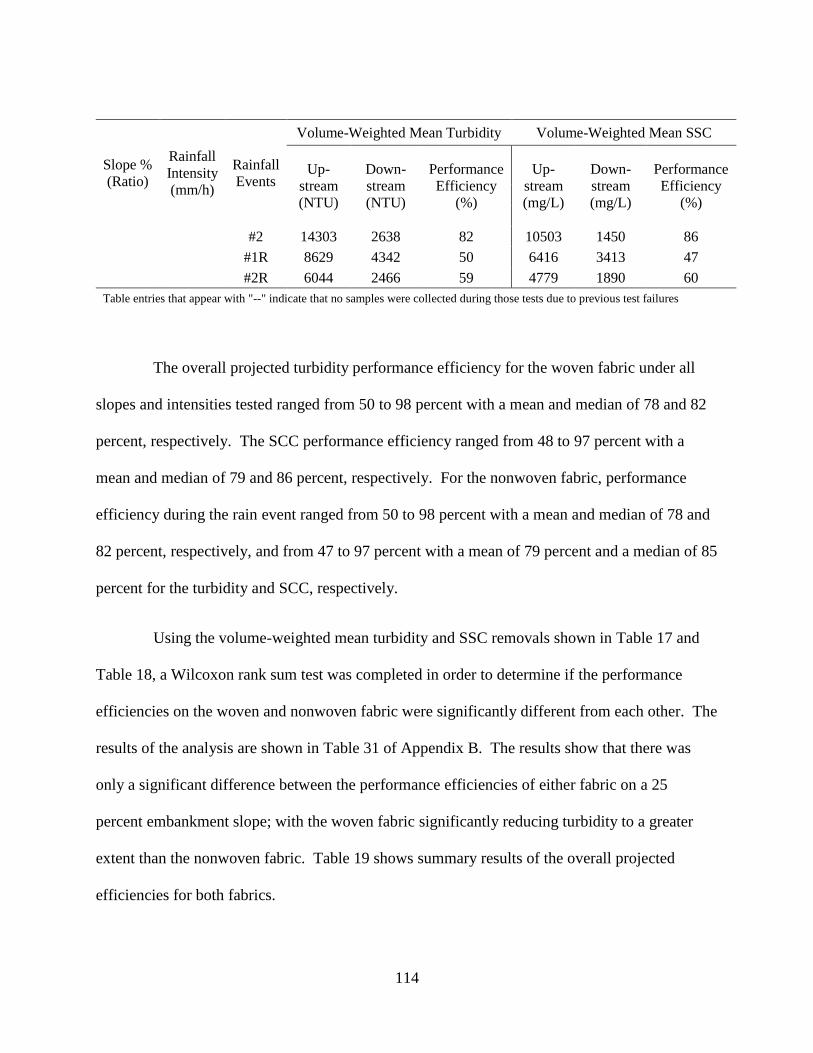
114
Slope %
(Ratio)
Rainfall
Intensity
(mm/h)
Rainfall
Events
Volume-Weighted Mean Turbidity Volume-Weighted Mean SSC
Up-
stream
(NTU)
Down-
stream
(NTU)
Performance
Efficiency
(%)
Up-
stream
(mg/L)
Down-
stream
(mg/L)
Performance
Efficiency
(%)
#2 14303 2638 82 10503 1450 86
#1R 8629 4342 50 6416 3413 47
#2R 6044 2466 59 4779 1890 60
Table entries that appear with "--" indicate that no samples were collected during those tests due to previous test failures
The overall projected turbidity performance efficiency for the woven fabric under all
slopes and intensities tested ranged from 50 to 98 percent with a mean and median of 78 and 82
percent, respectively. The SCC performance efficiency ranged from 48 to 97 percent with a
mean and median of 79 and 86 percent, respectively. For the nonwoven fabric, performance
efficiency during the rain event ranged from 50 to 98 percent with a mean and median of 78 and
82 percent, respectively, and from 47 to 97 percent with a mean of 79 percent and a median of 85
percent for the turbidity and SCC, respectively.
Using the volume-weighted mean turbidity and SSC removals shown in Table 17 and
Table 18, a Wilcoxon rank sum test was completed in order to determine if the performance
efficiencies on the woven and nonwoven fabric were significantly different from each other. The
results of the analysis are shown in Table 31 of Appendix B. The results show that there was
only a significant difference between the performance efficiencies of either fabric on a 25
percent embankment slope; with the woven fabric significantly reducing turbidity to a greater
extent than the nonwoven fabric. Table 19 shows summary results of the overall projected
efficiencies for both fabrics.

115
TABLE 19 SUMMARY OF OVERALL PROJECTED PERFORMANCE EFFICIENCY
Performance
criteria Slope (%)
Statistical
parameter
Projected Overall Performance
Woven Fabric Nonwoven Fabric
Turbidity
Performance
Efficiency
(%)
All slopes Mean 80 78
Median 89 82
33 Mean 96 93
Median 96 94
25 Mean 89 73
Median 90 73
10 Mean 64 71
Median 63 71
SSC
Performance
Efficiency
(%)
All slopes Mean 79 79
Median 86 85
33 Mean 95 93
Median 94 93
25 Mean 87 73
Median 88 77
10 Mean 65 74
Median 62 74
Table 19 shows that the projected performance of the woven fabric is actually better
than the nonwoven fabric on every slope except for 10 percent. This is interesting because
during the rain event as well as after the rain event, the nonwoven significantly reduced both
turbidity and SCC to a greater extent than the woven fabric.
The reason for the greater performance efficiency occurring on the woven fabric is due
to the lower flow-through rate of this fabric. Lower flow through-rates lead to greater
performance efficiencies because water discharges at a slower rate during the rain event where
the performance efficiencies are low. The lower flow-through rate allows a greater portion of the
influent water to discharge after the rain event where the performance efficiency is significantly

116
higher due to increased filtration and sedimentation. Comparing the woven and nonwoven
fabrics, the woven fabric achieved overall greater performance efficiency because less flow
discharged during rainfall in comparison with the nonwoven fabric. This explains why even
though the nonwoven fabric achieved higher removals both during and after the rainfall event,
the woven fabric still achieved an overall comparable performance efficiency.
The effect of how flow-through rate on performance efficiency can affect the overall
performance can be seen in Table 19 by noting the trend of increasing efficiency with increasing
embankment slope for both fabrics. Recall from Chapter 4, section: Flow-through rates during
the rain event, that the flow-through rate of both fabrics decreased with increasing embankment
slope. The decrease in flow-through rate with embankment slope is what led to the trend of
increasing efficiency with increasing embankment slope.
The reason for the woven fabric having a higher performance efficiency in comparison
with the nonwoven fabric and the trend of increasing performance efficiency with increasing
embankment slope can be better explained by comparing the volumes of water which discharged
through both fabrics both during and after the rain event, as presented in Table 20.

117
TABLE 20 DISCHARGE WATER VOLUME BOTH DURING AND AFTER RAINFALL
Embankment
Slope (%)
Rainfall
Intensity
(mm/h)
Volume Discharged (L)
Woven Fabric Nonwoven Fabric
During
Rainfall
After
Rainfall
Ratio,
During/After
During
Rainfall
After
Rainfall
Ratio,
During/After
33
25 9 155 0.06 24 63 0.38
76 37 434 0.09 86 330 0.26
127 16 -- -- 128 468 0.27
25
25 10 50 0.2 48 34 1.41
76 44 281 0.16 206 109 1.89
127 124 616 0.2 230 269 0.86
10
25 47 53 0.89 69 72 0.96
76 162 173 0.94 220 131 1.68
127 111 264 0.42 240 193 1.24
Table 20 shows the volume of water discharged through both fabrics during and after
the rain event. Additionally, presented is the ratio of during rainfall to after rainfall volume for
both fabrics. Comparing the ratios between both fabrics, the nonwoven fabric had a greater ratio
on each embankment slope and rainfall intensity tested because the nonwoven fabric allowed a
greater volume of water to discharge through the silt fence during the rain event. The greater
ratio of the nonwoven fabric is what helped lead to the lower overall projected efficiency. There
is also a trend of decreasing ratio with increasing embankment slope, which helps to further
explain the trend of increasing performance efficiency with increasing embankment slope.
Overall, projections show that both silt fences would have removed both turbidity and
SSC with comparable efficiencies. The woven fabric removed more sediment through ponding
of water and sedimentation than the nonwoven fabric did, while the nonwoven fabric removed
more sediment through filtration than did the woven fabric. Although both fabrics removed

118
turbidity and SSC at similar rates, the nonwoven fabric did so with a higher flow-through rate,
thus decreasing the chances of this fabric attaining high ponding depths, which could lead to
failure or overtopping.

119
CHAPTER 5: CONCLUSION
This study presented an investigation on active field-scale performance of two silt fence
fabrics, woven (ASR 1400) and nonwoven (BSRF). Both fabric types were evaluated in both
turbidity and suspended sediment concentration performance efficiencies as well as flow-through
rate for different simulated rainfall events and embankments slopes using a tilted test-bed and
rainfall simulator.
Overall measured results showed that woven and nonwoven fabrics achieved
performance efficiencies of 57 and 59 percent in turbidity, and 59 and 62 percent in suspended
sediment concentrations, respectively. Projected results also showed that the woven and
nonwoven fabrics would have achieved performance efficiencies of 80 and 78 percent in
turbidity, and 78 and 79 percent in suspended sediment concentrations, respectively.
The overall efficiency was dependent on the filtration efficiency occurring during the
rain event, the filtration and settling efficiencies occurring after the rain event, and the flow-
through rate of the fabrics. The flow-through rate was found to affect the overall efficiency due
to the performance efficiency after rainfall being significantly higher (α = 0.05) than the
performance efficiency during rainfall. Lower flow-through rates limited the volume of water
discharged during the rain event where the performance efficiencies were relatively low. Thus,
allowing additional hydraulic detention time for the settling mechanism to occur and for
discharge to occur after the rainfall event where performance efficiencies were higher. There
was therefore a tradeoff between the flow-through rate of the fabric and the overall efficiency of
the silt fence.

120
The AOS of both fabrics affected their performance efficiencies. Due in part to the
nonwoven fabrics smaller AOS, the nonwoven fabric achieved significantly (α = 0.05) greater
performance efficiencies both during and after the rain event when compared to the woven
fabric. The woven fabric achieved average performance efficiencies of 40 and 78 percent, and
the nonwoven fabric achieved average efficiencies of 50 and 85 percent during and after the rain
event, respectively. Although AOS was found to influence the filtration and performance
efficiency of the silt fence fabrics, AOS could not be used to predict particle size capture. The
woven fabrics AOS was larger than 100% of the particle sizes used in the study, however, the
filtration efficiency of this fabric during the rain event was 40 percent. It is therefore likely that
the particle sizes captured by silt fence in the field can be smaller than the AOS of the silt fence.
Results of the field-scale study showed that silt fence was not adequate as a stand-alone
treatment installed on a silty-sand soil at the toes of embankment slopes of 10 percent and
greater. Due to the large erosion rate of the silty-sand soil, the effluent discharge turbidities of
both fabrics were on average, at least 2 magnitudes greater than the regulated maximum
discharge turbidity of 29 NTU above background. Additional treatment processes would need to
be installed in conjunction with silt fence in order to form a treatment train if effluent discharge
limits were to be met.
Both the woven and nonwoven fabrics performed similarly, however, there were
differences in how they operated as silt fence. Both fabrics reduced the discharge of the silty-
sand soil through filtration, with the nonwoven fabric achieving higher efficiency due to its
smaller AOS. Both fabrics also reduced sediment through ponding of water and sedimentation;
however, the woven fabric removed sediment to a greater extent using this mechanism due to its

121
lower flow-through rate. Overall, both fabrics reduce turbidity and suspended sediment
concentrations by approximately 60 percent. The nonwoven fabric however, achieved this
performance efficiency while maintaining a higher flow-through rate. Thus, decreasing the
chance of this fabric failing or overtopping due to high ponding ponds depths.

122
APPENDIX A: ANALYSES OF SOIL TESTING

123
Soil Particle Distribution
TABLE 21 MATERIALS FINER THAN 75-μm BY WASHING ANALYSIS
Parameter Unit Value
Total dry soil mass g 715.2
Dry mass retained on number 200 sieve g 601.7
Dry mass finer than number 200 sieve g 113.5
Percent finer than number 200 sieve % 16
TABLE 22 SIEVE ANALYSIS
Sieve
Number
Sieve
Opening
(mm)
Mass of
Sieve
(g)
Mass of
Soil and
Sieve
(g)
Mass
Retained
(g)
Retained
(%)
Cumulative
Percent
Retained (%)
Percent
Finer
(%)
10 2 486.1 486.6 0.5 0 0 100
20 0.85 570.7 571.7 1 0 0 100
40 0.425 390.7 417 26.3 4 4 96
60 0.25 407.6 549.5 141.9 20 24 76
80 0.18 526 659.6 133.6 19 42 58
100 0.15 351.3 424.9 73.6 10 53 47
140 0.106 337 501.5 164.5 23 76 24
200 0.075 337.6 395.5 57.9 8 84 16
TABLE 23 HYDROMETER ANALYSIS
Time
(min) Reading Rcp
Percent
Finer
(%)
Rcl L (cm)
Particle
Diameter
(mm)
2 44.5 40.62 13.2 45.5 8.8 0.027
5 43.5 39.62 12.9 44.5 9 0.017
15 43 39.12 12.7 44 9.1 0.01
30 42 38.12 12.4 43 9.2 0.007
60 41.5 37.62 12.2 42.5 9.3 0.005
250 41 37.12 12.1 42 9.4 0.003
1440 39 35.12 11.4 40 9.7 0.001

124
Compaction Testing
FIGURE 20 MAXIMUM DRY UNIT WEIGHT OF SILTY-SAND SOIL
0
20
40
60
80
100
120
140
160
0 2 4 6 8 10 12 14 16 18 20
Dry
Unit
Wei
gh
t ,
lb/f
t³
Moisture Content , %
Dry Unit Weight Zero-air void unit weight

125
TABLE 24 MAXIMUM DRY UNIT WEIGHT FOR SILTY-SAND
Moisture Content Determination
Trial No.
Mass of
Moist
Specimen
+ Mold
(kg)
Mass of
Moist
Specimen
(kg)
Moist
Density of
Compacted
Specimen
(Mg/m3)
Theoretical
Moisture
Content
(%)
Mass of
Wet Soil
+ Can
(g)
Mass of
Dry Soil
+ Can
(g)
Mass of
Water
(g)
Mass of
Can (g)
Mass of
Dry Soil
(g)
Moisture
Content
(%)
1 6.02 1.74 1.84 8 162.9 153.74 9.16 50.37 103.37 8.86
2 6.06 1.78 1.89 9 126.25 119.92 6.33 49.65 70.27 9
3 6.22 1.94 2.06 11 187.8 174.01 13.79 49.92 124.09 11.11
4 6.24 1.96 2.08 15 133.11 122.02 11.09 50.24 71.78 15.46
5 6.18 1.9 2.01 18 151.19 135.58 15.61 50.21 85.37 18.29
Unit Weight Determination
Trial No.
Dry
Density of
Compacted
Specimen
(Mg/m3)
Dry Unit
Weight,
(lb/ft3)
Moist
Density of
Compacted
Specimen,
(Mg/m3)
Moist Unit
Weight,
(lb/ft3)
zero-air-
void
Unit
Weight,
(lb/ft3)
Volume of Mold = 0.000944 m³
Specific Gravity = 2.60
Unit Weight of Water = 62.4 lb/ft3
1 1.69 105.73 1.84 115.1 134.37 Mass of Mold = 4.28 kg
2 1.73 108.02 1.89 117.74 131.54
3 1.85 115.49 2.06 128.33 126.22
4 1.8 112.29 2.08 129.65 116.78
5 1.7 106.25 2.01 125.68 110.57

126
Constant Head Permeability Testing
TABLE 25 SILTY-SAND SOIL PERMEABILITY
Test # 1 2
1A 1B 1C 2A 2B 2C
Volume Collected, cm3 19.61 17.61 14.53 42.26 36.6 30.67
Time of Collection, sec 60 60
Temperature of Water, °C 24.2 24.2 24.2 24.1 24.9 24.7
Head difference "h" (cm) 98.63 87.63 87.63 98.63 87.63 74.63
Diameter of Specimen, mm 75.62 75.62
Length of Specimen, mm 130.69 130.07 130.04 137.2 138.48 139.8
Area of Specimen, cm2 44.91 44.91
Hydraulic Conductivity, cm/s 0.00096 0.00097 0.0008 0.00218 0.00215 0.00213
ηT°C /η20°C 0.9058 0.9058 0.9058 0.9079 0.8911 0.8953
Corrected Hydraulic Conductivity,
cm/s 0.000873 0.000879 0.000725 0.001981 0.001913 0.001909
Hydraulic Conductivity @ 20°C, cm/s 0.0014
Permeability @ 20°C, cm2 1.41E-08
Dry Density Calculations
Mass of empty container, g 2096.1
mass of soil + container, g 3005.4
mass of soil, g 909.3
Volume of specimen, cm3 625.4008
Dry Density, g/cm3 1.453948
Dry Density, lb/ft3 90.76699

127
APPENDIX B: STATISTICAL ANALYSES OF PERFORMANCE
EFFICIENCY

128
Statistical Difference between Initial and Repeat Tests
TABLE 26 WILCOXON RANK SUM TEST: WOVEN FABRIC SIGNIFICANT P-VALUES BETWEEN
INITIAL AND REPEAT TESTS
Embankment
Slope (%)
Rainfall
Intensity
(mm/h)
p-Value
Upstream
Turbidity
Downstream
Turbidity
Upstream
SSC
Downstream
SSC
33 25 0.045 0.810 0.013 0.575
127 1.000 0.530 0.676 0.403
10 25 0.522 0.020 0.575 0.013
76 0.810 0.940 1.000 0.936
TABLE 27 WILCOXON RANK SUM TEST: NONWOVEN FABRIC SIGNIFICANT P-VALUES BETWEEN
INITIAL AND REPEAT TESTS
Embankment
Slope (%)
Rainfall
Intensity
(mm/h)
p-Value
Upstream
Turbidity
Downstream
Turbidity
Upstream
SSC
Downstream
SSC
33
25 0.013 0.013 0.298 0.008
76 0.689 0.689 0.008 0.575
127 0.523 0.523 0.410 0.411
25
25 0.005 0.005 0.020 0.013
76 0.470 0.471 0.379 0.128
127 0.066 0.093 0.005 0.128
10
25 0.031 0.031 0.013 0.031
76 0.571 0.571 0.093 1.000
127 0.045 0.045 0.047 0.575

129
Statistical Analysis of woven fabric performance efficiency verse nonwoven fabric performance
efficiency
TABLE 28 WILCOXON RANK SUM TEST: SIGNIFICANT P-VALUES FOR NONWOVEN FABRIC
HAVING GREATER PERFORMANCE EFFICIENCY THAN WOVEN FABRIC DURING THE RAIN EVENT
Embankment
Slope (%)
p-Value
Volume-weighted
Turbidity Efficiency
Volume-weighted SSC
Efficiency
33, 25 and 10 0.041 0.001
33 0.252 0.049
25 0.303 0.010
10 0.016 0.009
TABLE 29 WILCOXON RANK SUM TEST: SIGNIFICANT P-VALUES FOR NONWOVEN FABRIC
HAVING GREATER PERFORMANCE EFFICIENCY THAN WOVEN FABRIC AFTER THE RAIN EVENT
Embankment Slope
(%)
p-Value
Volume-weighted Turbidity
Efficiency
Volume-weighted SSC
Efficiency
33, 25 and 10 0.003 0.000
33 0.000 0.000
25 0.050 0.004
10 0.435 0.383
TABLE 30 WILCOXON RANK SUM TEST: SIGNIFICANT P-VALUES FOR NONWOVEN FABRIC
HAVING AN OVERALL GREATER PERFORMANCE EFFICIENCY THAN WOVEN FABRIC
Embankment Slope (%)
p-Value
Volume-weighted Turbidity Efficiency
Volume-weighted SSC Efficiency
33, 25 and 10 0.238 0.012
33 0.087 0.029
25 0.750 0.014
10 0.244 0.153

130
TABLE 31 WILCOXON RANK SUM TEST: SIGNIFICANT P-VALUES FOR WOVEN AND NONWOVEN
FABRIC HAVING SIGNIFICANTLY DIFFERENT PROJECTED OVERALL PERFORMANCE EFFICIENCY
Embankment Slope (%)
p-Value
Volume-weighted Turbidity Efficiency
Volume-weighted SSC Efficiency
33, 25 and 10 0.597 0.980
33 0.303 0.255
25 0.008 0.083
10 0.249 0.121

131
Performance Efficiency Based on Embankment Slope
TABLE 32 SINGLE FACTOR ANOVA: WOVEN FABRIC STATISTICAL DIFFERENCE OF VOLUME-
WEIGHTED MEAN EFFICIENCY BETWEEN DIFFERENT SLOPES
Parameter Embankment
Slope (%)
No.
Sample
Average
(%) Variance p-Value
Significance
(α = 0.05)
Turbidity
Efficiency
33 10 48 97
0.026 Significant 25 6 32 149
10 10 37 121
SSC
Efficiency
33 10 48 162
0.003 Significant 25 6 22 63
10 10 44 262
TABLE 33 SINGLE FACTOR ANOVA: NONWOVEN FABRIC STATISTICAL DIFFERENCE OF
VOLUME-WEIGHTED MEAN EFFICIENCY BETWEEN DIFFERENT SLOPES
Parameter Embankment
Slope (%)
No.
Sample
Average
(%) Variance p-Value
Significance
(α = 0.05)
Turbidity
Efficiency
33 11 54 285
0.030 Significant 25 12 40 235
10 12 58 342
SSC
Efficiency
33 11 58 166
0.026 Significant 25 12 43 430
10 12 63 368

132
Performance Efficiency Change of Test 1 to Test 2
TABLE 34 WILCOXON RANK SUM TEST: WOVEN FABRIC STATISTICAL DIFFERENCE OF
TURBIDITY PERFORMANCE EFFICIENCY BETWEEN TEST 1 AND TEST 2
Embankment
Slope (%) Test No.
Samples Median p-Value Significance
(α = 0.05)
33, 25, and 10 # 1 68 35.5
0.886 Not Significant # 2 68 35.5
33 # 1 21 51
0.753 Not Significant # 2 21 54
25 # 1 17 30
0.270 Not Significant # 2 17 29
10 # 1 30 27
0.616 Not Significant # 2 30 30
TABLE 35 WILCOXON RANK SUM TEST: WOVEN FABRIC STATISTICAL DIFFERENCE OF
SEDIMENT PERFORMANCE EFFICIENCY BETWEEN TEST 1 AND TEST 2
Embankment
Slope (%) Test No.
Samples Median p-Value Significance
(α = 0.05)
33, 25, and 10 # 1 68 32
0.407 Not Significant # 2 68 28
33 # 1 21 49
0.178 Not Significant # 2 21 41
25 # 1 17 22
0.318 Not Significant # 2 17 19
10 # 1 30 32
0.842 Not Significant # 2 30 32

133
TABLE 36 WILCOXON RANK SUM TEST: NONWOVEN FABRIC STATISTICAL DIFFERENCE OF
TURBIDITY PERFORMANCE EFFICIENCY BETWEEN TEST 1 AND TEST 2
Embankment
Slope (%) Test No.
Samples Median p-Value Significance
(α = 0.05)
33, 25, and 10 # 1 102 39
0.000 Significant # 2 102 63
33 # 1 30 44.5
0.000 Significant # 2 30 65
25 # 1 36 28.5
0.001 Significant # 2 36 54.5
10 # 1 36 45.5
0.006 Significant # 2 36 66
TABLE 37 WILCOXON RANK SUM TEST: NONWOVEN FABRIC STATISTICAL DIFFERENCE OF
SEDIMENT PERFORMANCE EFFICIENCY BETWEEN TEST 1 AND TEST 2
Embankment
Slope (%) Test No.
Samples Median p-Value Significance
(α = 0.05)
33, 25, and 10 # 1 102 46
0.000 Significant # 2 102 64
33 # 1 30 57
0.006 Significant # 2 30 67.5
25 # 1 36 32.5
0.006 Significant # 2 36 54.5
10 # 1 36 52.5
0.032 Significant # 2 36 70

134
Change in Efficiency from During Rainfall to After Rainfall
TABLE 38 WILCOXON RANK SUM TEST: WOVEN FABRIC STATISTICAL DIFFERENCE OF
PERORMANCE EFFICIENCY DURING AND AFTER RAINFALL
Parameter Embankment
Slope (%)
No.
Sample
Estimated Efficiency
Difference,
During - After (%)
p-Value Significance
(α = 0.05)
Turbidity
Efficiency
33, 25, and 10 22 -30 0.000 Significant
33 6 -28 0.036 Significant
25 6 -29 0.036 Significant
10 10 -31 0.006 Significant
SSC
Efficiency
33, 25, and 10 22 -28 0.000 Significant
33 6 -28 0.036 Significant
25 6 -36 0.036 Significant
10 10 -23 0.006 Significant
TABLE 39 WILCOXON RANK SUM TEST: NONWOVEN FABRIC STATISTICAL DIFFERENCE OF
PERFORMANCE EFFICIENCY FROM DURING RAINFALL TO AFTER RAINFALL
Parameter Embankment
Slope (%)
No.
Sample
Estimated Efficiency
Difference,
During - After (%)
p-Value Significance
(α = 0.05)
Turbidity
Efficiency
33, 25, and 10 34 -40 0.000 Significant
33 10 -43 0.006 Significant
25 12 -48 0.003 Significant
10 12 -27 0.003 Significant
SSC
Efficiency
33, 25, and 10 34 -32 0.000 Significant
33 10 -36 0.006 Significant
25 12 -39 0.003 Significant
10 12 -17 0.003 Significant

135
APPENDIX C: STATISTICAL ANALYSES OF FLOW-THROUGH RATE

136
Change in Flow Through Rate with Change in Embankment Slope
TABLE 40 WILCOXON RANK SUM TEST: WOVEN FABRIC STATISTICAL DIFFERENCE FOR FLOW
THROUGH RATE BETWEEN SLOPES
Testing Embankment
Slope (%)
No. of
Samples Median p-Value
Significance
(α = 0.05)
10% vs. 25% 10 50 1193
0.000 Significant 25 30 169
25% vs. 33% 25 30 169
0.000 Significant 33 36 68
TABLE 41 WILCOXON RANK SUM TEST: NONWOVEN FABRIC STATISTICAL DIFFERENCE FOR
FLOW THROUGH RATE BETWEEN SLOPES
Testing Embankment
Slope (%)
No. of
Samples Median p-Value
Significance
(α = 0.05)
10% vs. 25% 10 60 1975
0.000 Significant 25 60 1234
25% vs. 33% 25 60 1234
0.000 Significant 33 53 324

137
Change in Flow Through Rate from Test 1 to Test 2
TABLE 42 WILCOXON RANK SUM TEST: STATISTICAL DIFFERENCE OF FLOW-THROUGH RATE
BETWEEN TEST 1 AND TEST 2
Fabric Type Embankment
Slope (%)
No.
Samples
Estimated Flow rate
Difference,
Test 1 - Test 2 (L/m²/h)
p-Value Significance
(α = 0.05)
Woven
Fabric
33, 25, and 10 55 -48.5 0.010 Significant
33 15 -40 0.001 Significant
25 15 -43.5 0.003 Significant
10 25 -128 0.226 Not Significant
Nonwoven
Fabric
33, 25, and 10 85 64 0.227 Not Significant
33 25 -93 0.060 Not Significant
25 30 299 0.020 Significant
10 30 138 0.399 Not Significant

138
Change in Flow-Through Rate due to Change in Rainfall Intensity
TABLE 43 SINGLE FACTOR ANOVA: WOVEN FABRIC STATISTICAL DIFFERENCE OF FLOW-
THROUGH RATE BASED ON DIFFERENT RAINFALL INTENSITIES
Embankment
Slope (%)
Rainfall
Intensity
(mm/h)
No. of
Sample
Average Flow
rate (L/m²/h) p-Value
Significance
(α = 0.05)
33
25 19 63
0.002 Significant 76 9 139
127 -- --
25
25 9 123
0.000 Significant 76 9 220
127 9 427
10
25 20 830
0.000 Significant 76 20 1494
127 10 1360
TABLE 44 SINGLE FACTOR ANOVA: NONWOVEN FABRIC STATISTICAL DIFFERENCE OF FLOW
THROUGH RATE BASED ON DIFFERENT RAINFALL INTENSITIES
Embankment
Slope (%)
Rainfall
Intensity
(mm/h)
No. of
Sample
Average Flow
rate (L/m²/h) p-Value
Significance
(α = 0.05)
33
25 20 310
0.176 Significant 76 20 416
127 13 458
25
25 20 860
0.000 Significant 76 20 1512
127 20 1155
10
25 19 1310
0.001 Significant 76 19 2355
127 19 2652

139
Change in Flow Through Rate from During Rainfall to After Rainfall
TABLE 45 WILCOXON RANK SUM TEST: STATISTICAL DIFFERENCE OF FLOW THROUGH RATE
BETWEEN DURING AND AFTER THE RAIN EVENT
Fabric Type Embankment
Slope (%)
No.
Samples
Estimated Flow rate
Difference,
During - After (L/m²/h)
p-Value Significance
(α = 0.05)
Woven
Fabric
33, 25, and 10 22 61 0.002 Significant
33 6 24 0.036 Significant
25 6 89 0.036 Significant
10 10 74 0.103 Not Significant
Nonwoven
Fabric
33, 25, and 10 34 752 0.000 Significant
33 10 272 0.006 Significant
25 12 896 0.003 Significant
10 12 1278 0.003 Significant

140
APPENDIX D: MISCELLANEOUS

141
Time Dependent Efficiency and Flow Rate Results
TABLE 46 WOVEN FABRIC TIME DEPENDENT EFFICIENCY AND FLOW-THROUGH RATE RESULTS
ON 10% SLOPE
Intensity
(mm/h) Test
During Rainfall After Rainfall
time
(min)
Turbidity
Efficiency
(%)
SSC
Efficiency
(%)
Flow
Rate
(L/m²/h)
time
(min)
Turbidity
Efficiency
(%)
SSC
Efficiency
(%)
Flow
Rate
(L/m²/h)
25
# 1
5 37 47 -- 35 39 59 1114
10 46 11 584 40 71 83 1014
15 29 52 670 45 92 94 873
20 4 32 829 50 91 93 793
25 27 39 884 55 94 95 673
30 57 49 1058 60 96 96 709
# 2
5 66 65 -- 35 77 84 1570
10 29 63 1111 40 84 89 1457
15 69 77 1119 45 89 92 1311
20 67 74 1262 50 94 95 1151
25 80 84 1398 55 95 95 938
30 72 80 1503 60 94 95 749
# 1R
5 75 79 -- 35 87 87 233
10 50 56 236 40 84 85 277
15 50 57 241 45 96 94 292
20 67 67 241 50 95 93 238
25 57 63 217 55 96 95 230
30 79 83 286 60 96 95 190
# 2R
5 34 6 -- 35 57 57 1121
10 33 26 903 40 72 75 902
15 31 21 953 45 90 85 844
20 44 45 902 50 93 87 756
25 55 46 1055 55 87 87 606
30 57 53 1147 60 90 86 477
76
# 1
5 17 15 -- 35 9 13 2414
10 1 -1 1206 40 60 53 2268
15 -5 -5 1834 45 80 71 2122
20 16 28 2103 50 80 76 1704
25 21 27 2518 55 86 77 1638
30 -3 13 2623 60 82 75 --
# 2
5 0 -12 -- 35 -14 17 1964
10 0 -14 737 40 46 58 1296
15 28 49 1265 45 69 73 999
20 9 44 1571 50 74 70 768
25 12 15 1825 55 76 70 626
30 -19 5 2182 60 -- -- --
# 1R
5 49 51 -- 35 9 9 1937
10 8 -20 489 40 59 39 1740
15 -50 -55 855 45 73 56 1558

142
Intensity
(mm/h) Test
During Rainfall After Rainfall
time
(min)
Turbidity
Efficiency
(%)
SSC
Efficiency
(%)
Flow
Rate
(L/m²/h)
time
(min)
Turbidity
Efficiency
(%)
SSC
Efficiency
(%)
Flow
Rate
(L/m²/h)
20 -1 7 1155 50 81 72 1333
25 26 32 1470 55 83 72 1032
30 -15 -11 1677 60 84 74 856
# 2R
5 9 12 -- 35 9 5 1444
10 29 34 870 40 37 34 1176
15 16 17 1182 45 54 44 1002
20 -41 6 1425 50 -- -- --
25 38 22 1398 55 -- -- --
30 -15 -26 1487 60 -- -- --
127
# 1
5 8 10 -- 35 27 47 1450
10 5 5 1122 40 72 60 1227
15 27 39 1421 45 78 66 1017
20 33 32 1518 50 49 28 895
25 50 45 1446 55 56 66 690
30 55 66 1782 60 48 24 552
# 2
5 53 51 -- 35 42 49 1570
10 43 40 1051 40 67 54 1457
15 35 56 1204 45 74 71 1311
20 23 13 1302 50 79 72 1151
25 28 31 1357 55 86 81 938
30 13 22 1395 60 89 82 749

143
TABLE 47 WOVEN FABRIC TIME DEPENDENT EFFICIENCY AND FLOW-THROUGH RATE RESULTS
ON 25% SLOPE
Intensity
(mm/h) Test
During Rainfall After Rainfall
time
(min)
Turbidity
Efficiency
(%)
SSC
Efficiency
(%)
Flow
Rate
(L/m²/h)
time
(min)
Turbidity
Efficiency
(%)
SSC
Efficiency
(%)
Flow
Rate
(L/m²/h)
25
# 1
5 34 32 -- 35 4 23 109
10 15 24 135 40 11 29 62
15 30 22 127 45 32 55 50
20 11 20 87 50 65 59 41
25 29 29 105 55 87 85 35
30 22 29 133 60 89 88 42
# 2
5 22 3 -- 35 11 7 168
10 17 10 129 40 33 33 113
15 3 8 115 45 86 84 90
20 92 14 96 50 91 87 78
25 29 19 143 55 90 84 63
30 1 14 176 60 87 81 47
76
# 1R
5 50 57 -- 35 3 13 129
10 41 44 156 40 -3 29 80
15 28 28 148 45 38 35 74
20 32 15 157 50 63 56 64
25 4 -4 162 55 68 69 58
30 18 3 212 60 72 68 62
# 2R
5 41 28 -- 35 14 10 379
10 31 19 194 40 33 42 238
15 31 14 139 45 77 73 184
20 10 3 207 50 88 81 139
25 8 2 322 55 92 86 103
30 11 21 440 60 92 88 79
127
# 1
5 52 33 -- 35 32 -3 402
10 65 16 130 40 58 37 280
15 60 5 237 45 65 44 208
20 28 -3 358 50 63 53 160
25 39 16 535 55 66 83 120
30 59 43 590 60 -- -- --
# 2
5 -- -- -- 35 43 32 443
10 41 25 232 40 82 79 318
15 33 28 288 45 90 88 230
20 21 23 395 50 94 61 159
25 29 31 558 55 97 91 111
30 40 31 644 60 95 84 72

144
TABLE 48 WOVEN FABRIC TIME DEPENDENT EFFICIENCY AND FLOW-THROUGH RATE RESULTS
ON 33% SLOPE
Intensity
(mm/h) Test
During Rainfall After Rainfall
time
(min)
Turbidity
Efficiency
(%)
SSC
Efficiency
(%)
Flow
Rate
(L/m²/h)
time
(min)
Turbidity
Efficiency
(%)
SSC
Efficiency
(%)
Flow
Rate
(L/m²/h)
25
# 1
5 67 75 -- 35 12 41 58
10 78 81 15 40 53 53 26
15 71 76 18 45 88 87 17
20 56 56 23 50 92 91 14
25 42 43 41 55 93 93 13
30 21 43 39 60 96 95 10
# 2
5 84 73 -- 35 4 24 73
10 65 48 63 40 48 13 49
15 52 21 65 45 80 65 36
20 57 30 75 50 68 66 33
25 35 16 76 55 73 66 35
30 29 30 59 60 86 83 34
# 1R
5 69 63 -- 35 16 25 41
10 32 30 42 40 62 64 26
15 33 35 55 45 86 83 22
20 39 47 44 50 90 87 24
25 9 17 40 55 96 94 26
30 24 32 39 60 96 93 20
# 2R
5 -11 15 -- 35 65 68 55
10 67 55 217 40 73 75 34
15 61 67 98 45 80 78 32
20 70 72 67 50 85 84 31
25 54 65 67 55 87 84 29
30 72 72 64 60 91 89 22
76
# 1
5 84 90 -- 35 -- -- --
10 55 58 69 40 -- -- --
15 10 24 192 45 -- -- --
20 -- -- -- 50 -- -- --
25 -- -- -- 55 -- -- --
30 -- -- -- 60 -- -- --
# 2
5 -- -- -- 35 -- -- --
10 -- -- -- 40 -- -- --
15 -- -- -- 45 -- -- --
20 -- -- -- 50 -- -- --
25 -- -- -- 55 -- -- --
30 -- -- -- 60 -- -- --
# 1R
5 79 83 -- 35 48 -27 150
10 69 65 73 40 80 51 69
15 51 49 77 45 90 77 45
20 38 26 88 50 97 68 34
25 45 33 114 55 94 84 24
30 43 25 135 60 95 79 25

145
Intensity
(mm/h) Test
During Rainfall After Rainfall
time
(min)
Turbidity
Efficiency
(%)
SSC
Efficiency
(%)
Flow
Rate
(L/m²/h)
time
(min)
Turbidity
Efficiency
(%)
SSC
Efficiency
(%)
Flow
Rate
(L/m²/h)
# 2R
5 75 75 -- 35 28 22 282
10 65 57 87 40 78 63 187
15 53 41 91 45 21 89 152
20 42 27 131 50 94 93 119
25 42 27 211 55 90 88 88
30 29 17 316 60 97 95 69
127
# 1
5 93 95 -- 35 -- -- --
10 98 98 108 40 -- -- --
15 73 77 76 45 -- -- --
20 33 24 147 50 -- -- --
25 31 9 284 55 -- -- --
30 -- -- -- 60 -- -- --
# 2
5 -- -- -- 35 -- -- --
10 -- -- -- 40 -- -- --
15 -- -- -- 45 -- -- --
20 -- -- -- 50 -- -- --
25 -- -- -- 55 -- -- --
30 -- -- -- 60 -- -- --
# 1R
5 82 85 -- 35 -- -- --
10 82 84 51 40 -- -- --
15 81 82 51 45 -- -- --
20 40 51 143 50 -- -- --
25 31 40 2429 55 -- -- --
30 -- -- -- 60 -- -- --
# 2R
5 63 70 -- 35 -- -- --
10 35 37 220 40 -- -- --
15 29 38 5325 45 -- -- --
20 -- -- -- 50 -- -- --
25 -- -- -- 55 -- -- --
30 -- -- -- 60 -- -- --

146
TABLE 49 NONWOVEN FABRIC TIME DEPENDENT EFFICIENCY AND FLOW-THROUGH RATE
RESULTS ON 10% SLOPE
Intensity
(mm/h) Test
During Rainfall After Rainfall
time
(min)
Turbidity
Efficiency
(%)
SSC
Efficiency
(%)
Flow
Rate
(L/m²/h)
time
(min)
Turbidity
Efficiency
(%)
SSC
Efficiency
(%)
Flow
Rate
(L/m²/h)
25
# 1
5 82 87 -- 35 90 93 387
10 88 93 453 40 94 95 234
15 87 90 459 45 96 96 147
20 90 93 475 50 -- -- --
25 82 88 475 55 -- -- --
30 86 91 457 60 -- -- --
# 2
5 39 52 -- 35 88 87 575
10 78 71 321 40 93 94 623
15 88 88 606 45 98 97 698
20 84 86 772 50 98 96 768
25 87 87 809 55 98 97 755
30 86 89 511 60 99 97 632
# 1R
5 49 56 -- 35 42 48 1890
10 70 88 774 40 77 79 1246
15 70 71 725 45 91 88 557
20 61 65 761 50 94 91 364
25 56 57 1529 55 95 91 305
30 54 59 1919 60 -- -- --
# 2R
5 42 47 -- 35 51 50 2526
10 38 41 2560 40 83 80 933
15 72 72 3033 45 85 77 431
20 72 68 2912 50 95 88 295
25 64 61 2969 55 95 90 236
30 71 71 2820 60 -- -- --
76
# 1
5 29 -5 -- 35 24 47 3239
10 52 69 2792 40 78 81 993
15 49 73 3651 45 91 89 327
20 40 73 3593 50 94 93 192
25 46 60 3491 55 96 94 144
30 62 70 3394 60 97 94 119
# 2
5 70 81 -- 35 30 59 1103
10 81 86 1216 40 81 86 368
15 40 62 1331 45 91 92 152
20 82 85 1396 50 93 91 123
25 68 72 1307 55 95 93 103
30 80 80 1217 60 96 94 87
# 1R
5 18 31 -- 35 75 70 1251
10 30 41 3209 40 89 83 333
15 47 62 3112 45 93 86 186
20 21 27 2775 50 95 89 144
25 45 49 2296 55 96 90 113
30 25 22 2058 60 -- -- --

147
Intensity
(mm/h) Test
During Rainfall After Rainfall
time
(min)
Turbidity
Efficiency
(%)
SSC
Efficiency
(%)
Flow
Rate
(L/m²/h)
time
(min)
Turbidity
Efficiency
(%)
SSC
Efficiency
(%)
Flow
Rate
(L/m²/h)
# 2R
5 44 39 -- 35 71 69 1551
10 52 55 1885 40 83 78 449
15 62 67 2278 45 90 82 239
20 74 73 2117 50 93 87 125
25 73 72 2218 55 95 88 92
30 76 66 2208 60 -- -- --
127
# 1
5 49 43 -- 35 45 44 1764
10 23 30 892 40 88 87 448
15 31 30 1259 45 96 94 198
20 28 20 1463 50 94 74 123
25 35 22 1918 55 87 88 94
30 26 37 2032 60 97 96 75
# 2
5 75 73 -- 35 67 74 1294
10 59 42 605 40 92 92 501
15 46 49 1287 45 96 95 276
20 38 81 1422 50 98 96 201
25 70 83 1556 55 98 96 157
30 52 79 1458 60 98 96 126
# 1R
5 34 18 -- 35 48 45 2932
10 39 22 4215 40 71 68 1284
15 32 37 4008 45 88 85 937
20 25 22 3653 50 95 91 819
25 40 42 3477 55 96 92 557
30 25 23 3518 60 96 92 380
# 2R
5 51 53 -- 35 34 29 --
10 28 40 4480 40 81 77 3774
15 64 69 3340 45 88 84 1151
20 37 38 3618 50 91 84 2344
25 46 41 3505 55 94 88 --
30 33 26 3567 60 94 88 --

148
TABLE 50 NONWOVEN FABRIC TIME DEPENDENT EFFICIENCY AND FLOW-THROUGH RATE
RESULTS ON 25% SLOPE
Intensity
(mm/h) Test
During Rainfall After Rainfall
time
(min)
Turbidity
Efficiency
(%)
SSC
Efficiency
(%)
Flow
Rate
(L/m²/h)
time
(min)
Turbidity
Efficiency
(%)
SSC
Efficiency
(%)
Flow
Rate
(L/m²/h)
25
# 1
5 84 85 -- 35 59 61 522
10 49 64 1007 40 93 93 306
15 50 64 776 45 97 96 156
20 52 59 579 50 98 97 108
25 43 44 458 55 99 97 94
30 54 64 361 60 98 98 89
# 2
5 78 83 -- 35 64 74 504
10 65 74 104 40 96 95 235
15 63 63 418 45 98 98 116
20 69 77 490 50 99 98 81
25 66 70 522 55 99 98 62
30 66 68 524 60 -- -- --
# 1R
5 -15 -5 -- 35 85 87 716
10 35 39 2122 40 98 97 299
15 26 37 1322 45 99 99 181
20 33 32 1255 50 99 99 170
25 32 34 1182 55 -- -- --
30 27 54 1051 60 -- -- --
# 2R
5 57 64 -- 35 44 45 1086
10 -4 4 939 40 96 94 562
15 52 46 1161 45 99 97 271
20 63 59 1114 50 99 97 188
25 69 69 1112 55 99 97 156
30 68 73 1101 60 -- -- --
76
# 1
5 14 -17 -- 35 72 75 882
10 61 1 1715 40 95 87 236
15 -19 -8 1751 45 96 85 136
20 13 9 1620 50 90 57 105
25 16 11 1597 55 90 43 88
30 -16 -4 1416 60 -- -- --
# 2
5 16 16 -- 35 11 6 1403
10 6 6 1693 40 82 73 398
15 21 19 1601 45 93 82 138
20 26 28 1739 50 95 82 89
25 26 28 1581 55 -- -- --
30 28 21 1531 60 -- -- --
# 1R
5 23 16 -- 35 70 69 877
10 13 7 1359 40 95 84 233
15 30 30 1480 45 96 82 143
20 27 32 1494 50 98 88 113
25 39 25 1428 55 99 89 98
30 33 36 1403 60 99 83 83

149
Intensity
(mm/h) Test
During Rainfall After Rainfall
time
(min)
Turbidity
Efficiency
(%)
SSC
Efficiency
(%)
Flow
Rate
(L/m²/h)
time
(min)
Turbidity
Efficiency
(%)
SSC
Efficiency
(%)
Flow
Rate
(L/m²/h)
# 2R
5 77 71 -- 35 61 74 780
10 71 70 642 40 88 81 227
15 33 65 1581 45 92 81 145
20 3 47 1479 50 95 80 106
25 43 72 1552 55 97 80 92
30 34 32 1586 60 97 85 85
127
# 1
5 9 8 -- 35 21 20 874
10 13 17 2181 40 81 64 224
15 16 20 2027 45 87 70 151
20 6 8 2093 50 87 71 110
25 27 28 1934 55 93 63 89
30 36 31 1688 60 91 72 47
# 2
5 96 95 -- 35 47 96 987
10 85 85 113 40 97 97 271
15 56 42 613 45 99 97 145
20 21 25 723 50 99 96 102
25 39 35 821 55 99 95 80
30 47 46 988 60 99 95 66
# 1R
5 25 46 -- 35 77 81 835
10 11 56 833 40 96 93 355
15 26 46 1080 45 98 98 194
20 51 60 1256 50 98 95 152
25 33 44 1071 55 99 97 118
30 52 54 1214 60 98 96 100
# 2R
5 65 80 -- 35 39 35 1414
10 92 93 144 40 95 94 422
15 54 61 267 45 97 95 207
20 55 62 1192 50 97 93 141
25 32 45 1515 55 96 91 116
30 49 50 1340 60 98 96 105

150
TABLE 51 NONWOVEN FABRIC TIME DEPENDENT EFFICIENCY AND FLOW-THROUGH RATE
RESULTS ON 33% SLOPE
Intensity
(mm/h) Test
During Rainfall After Rainfall
time
(min)
Turbidity
Efficiency
(%)
SSC
Efficiency
(%)
Flow
Rate
(L/m²/h)
time
(min)
Turbidity
Efficiency
(%)
SSC
Efficiency
(%)
Flow
Rate
(L/m²/h)
25
# 1
5 57 60 -- 35 72 88 170
10 74 72 181 40 91 93 153
15 58 63 214 45 98 98 89
20 33 57 177 50 99 99 70
25 64 70 208 55 99 99 48
30 46 70 209 60 99 99 40
# 2
5 81 94 -- 35 91 92 370
10 85 84 51 40 99 98 163
15 86 81 96 45 99 98 107
20 89 85 230 50 99 90 81
25 92 93 349 55 99 99 56
30 98 86 413 60 99 97 53
# 1R
5 14 -24 -- 35 84 81 298
10 30 41 369 40 96 94 122
15 41 47 287 45 98 97 71
20 44 47 371 50 99 98 45
25 60 57 349 55 99 98 35
30 58 57 324 60 99 98 34
# 2R
5 31 38 -- 35 79 84 550
10 57 71 586 40 94 94 223
15 65 82 137 45 95 96 133
20 71 80 300 50 99 98 91
25 37 55 635 55 99 99 65
30 47 55 722 60 100 98 56
76
# 1
5 17 62 -- 35 88 70 267
10 29 32 216 40 99 97 125
15 49 59 198 45 99 97 71
20 49 59 240 50 100 98 56
25 57 58 231 55 100 98 44
30 64 55 385 60 100 97 31
# 2
5 82 82 -- 35 90 91 332
10 65 64 122 40 99 98 132
15 69 61 101 45 99 98 88
20 61 62 249 50 99 98 69
25 65 57 596 55 100 98 57
30 67 59 550 60 99 95 50
# 1R
5 3 8 -- 35 92 97 248
10 12 12 891 40 98 96 121
15 29 33 656 45 97 94 77
20 38 31 484 50 98 95 60
25 38 47 437 55 99 95 52
30 40 92 447 60 98 93 52

151
Intensity
(mm/h) Test
During Rainfall After Rainfall
time
(min)
Turbidity
Efficiency
(%)
SSC
Efficiency
(%)
Flow
Rate
(L/m²/h)
time
(min)
Turbidity
Efficiency
(%)
SSC
Efficiency
(%)
Flow
Rate
(L/m²/h)
# 2R
5 98 97 -- 35 92 90 347
10 89 75 61 40 99 97 110
15 52 56 488 45 99 97 86
20 49 48 683 50 99 96 63
25 46 47 628 55 98 96 49
30 51 55 660 60 99 93 39
127
# 1
5 50 16 -- 35 -- -- --
10 55 63 261 40 -- -- --
15 47 54 214 45 -- -- --
20 28 31 291 50 -- -- --
25 41 45 472 55 -- -- --
30 -- -- 480 60 -- -- --
# 2
5 -- -- -- 35 -- -- --
10 -- -- -- 40 -- -- --
15 -- -- -- 45 -- -- --
20 -- -- -- 50 -- -- --
25 -- -- -- 55 -- -- --
30 -- -- -- 60 -- -- --
# 1R
5 62 59 -- 35 87 86 280
10 41 48 243 40 99 97 119
15 47 52 310 45 99 97 81
20 93 39 426 50 99 97 59
25 33 33 419 55 99 97 47
30 45 50 548 60 100 97 39
# 2R
5 100 99 -- 35 91 66 320
10 97 98 73 40 99 95 232
15 60 96 283 45 98 96 145
20 26 46 933 50 98 93 110
25 16 43 1082 55 99 95 86
30 2 24 868 60 99 95 69

152
Change in Performance Efficiency and Discharge Concentration with Time
FIGURE 21 TIME DEPENDENT AVERAGE TURBIDITY PERFORMANCE EFFICIENCY AND
DOWNSTREAM VALUE ON 25 PERCENT SLOPE
0
5000
10000
15000
20000
25000
0
20
40
60
80
100
0 10 20 30 40 50 60
Dow
nst
ream
Tu
rbid
ity (
NT
U)
Turb
idit
y E
ffic
ien
cy (
%)
Sampling Time (min)
Woven Fabric Efficiency Nonwoven Fabric Efficiency
Woven Fabric Turbidity Nonwoven Fabric Turbidity

153
FIGURE 22 TIME DEPENDENT AVERAGE TURBIDITY PERFORMANCE EFFICIENCY AND
DOWNSTREAM VALUE ON 33 PERCENT SLOPE
FIGURE 23 TIME DEPENDENT AVERAGE SSC PERFORMANCE EFFICIENCY AND DOWNSTREAM
VALUE ON 10 PERCENT SLOPE
0
5000
10000
15000
20000
25000
0
20
40
60
80
100
0 10 20 30 40 50 60
Do
wn
stre
am T
urb
idit
y (
NT
U)
Tu
rbid
ity E
ffic
ien
cy (
%)
Sampling Time (min)
Woven Fabric Efficiency Nonwoven Fabric Efficiency
Woven Fabric Turbidity Nonwoven Fabric Turbidity
0
1000
2000
3000
4000
5000
6000
0
20
40
60
80
100
0 10 20 30 40 50 60
Do
wn
stre
am S
SC
(m
g/L
)
SS
C E
ffic
iency
(%
)
Sampling Time (min)
Woven Fabric Efficiency Nonwoven Fabric Efficiency
Woven Fabric Concentration Nonwoven Fabric Concentration

154
FIGURE 24 TIME DEPENDENT AVERAGE SSC PERFORMANCE EFFICIENCY AND DOWNSTREAM
VALUE ON 25 PERCENT SLOPE
FIGURE 25 TIME DEPENDENT AVERAGE SSC PERFORMANCE EFFICIENCY AND DOWNSTREAM
VALUE ON 33 PERCENT SLOPE
0
2000
4000
6000
8000
10000
12000
14000
0
20
40
60
80
100
0 10 20 30 40 50 60
Do
wn
stre
am S
SC
(m
g/L
)
SS
C E
ffic
ien
cy (
%)
Sampling Time (min)
Woven Fabric Efficiency Nonwoven Fabric Efficiency
Woven Fabric Concentration Nonwoven Fabric Concentration
0
2000
4000
6000
8000
10000
12000
14000
16000
0
20
40
60
80
100
0 10 20 30 40 50 60
Do
wn
stre
am S
SC
(m
g/L
)
SS
C E
ffic
iency
(%
)
Sampling Time (min)
Woven Fabric Efficiency Nonwoven Fabric Efficiency
Woven Fabric Concentration Nonwoven Fabric Concentration

155
LIST OF REFERENCES
APHA, AWWA and WEF (2005). Standard Method for the Examination of Water and Wastewater, A.D. Eaton,
Washinton D.C.
Arjunan, J., S. Yeri, E. Stevens, B. Barfield and K. Gasem (2006). Application of Polyacrylamide to Enhance Silt
Fence Performance, Oklahoma State University.
ASTM (1987). D 4632-86 Standard Test Method for Breaking Load and Elongation of Geotextiles. Annual Book of
ASTM Standards, American Society for Testing and Materials. Vol. 4.08.
ASTM C117-13 (2013). Standard Test Method for Materials Finer than 75-um (No. 200) Sieve in Mineral
Aggregates by Washing. ASTM Volue 04.02 Concrete and Aggregates.
ASTM C136-06 (2013). Standard Test Method for Sieve Analysis of Fine and Coarse Aggregates. ASTM Volume
04.02 Concrete and Aggregates.
ASTM D422-63 (2013). Standard Test Method for Particle-Size Analysis of Soils. ASTM Volue 04.08 Soil and
Rock (I): D420-D5876.
ASTM D2434-68 (2006). Standard Test Method for Permeability of Granular Soils (Constant Head). ASTM
Volume 04.08 Soil and Rock (I): D420-D5876.
ASTM D4491 (2009). "Test Methods for Water Permeability of geotextiles by Permittivity." West Conshohocken,
PA, ASTM International. 04.13.
ASTM D6461 (2007). Standard Specification for Silt Fence Materials. ASTM Volume 04.09 Soil and Rock (II):
D5877-latest.
Aydilek, A. and T. Edil (2003). "Long-term filtration performance of nonwoven geotextile-sludge systems."
Geosynthetics International 10(4): 110-123.
Barrett, M. E., J. E. Kearney, T. G. McCoy, J. F. Malina, R. Charbeneau and G. Ward (1995). An evaluation of the
use and effectiveness of temporary sediment controls, Center for Research in Water Resources, University of Texas
at Austin.
Bilotta, G. and R. Brazier (2008). "Understanding the influence of suspended solids on water quality and aquatic
biota." Water research 42(12): 2849-2861.
Britton, S. L., K. M. Robinson, B. J. Barfield and K. Kadavy (2000). Silt fence performance testing. 2000 ASAE
Annual International Meeting, Milwaukee, Wisconsin, USA, 9-12 July 2000, American Society of Agricultural
Engineers.
D698-12, A. (2013). Standard Test Methods for Laboratory Compaction Characteristics of Soil Using Standard
Effort. ASTM Volume 04.08 Soil and Rock (I): D420-D5876.
Dierickx, W. and P. Van Den Berghe (2004). "Natural weathering of textiles used in agricultural applications."
Geotextiles and Geomembranes 22(4): 255-272.
EPA (2007). Developing Your Stormwater Pollution Prevention Plan: A Guide for Construction Sites: 46.

156
European Commission. (2012). "Soil Compaction." European Soil Portal - Soil Data and Information System
Retrieved January 28, 2014, from http://eusoils.jrc.ec.europa.eu/library/themes/compaction/.
Farias, R., E. Palmeira and J. Carvalho (2006). "Performance of geotextile silt fences in large flume tests."
Geosynthetics International 13(4): 133-144.
Faucette, L., K. Sefton, A. Sadeghi and R. Rowland (2008). "Sediment and phosphorus removal from simulated
storm runoff with compost filter socks and silt fence." Journal of soil and water conservation 63(4): 257-264.
Faure, Y.-H., A. Baudoin, P. Pierson and O. Ple (2006). "A contribution for predicting geotextile clogging during
filtration of suspended solids." Geotextiles and Geomembranes 24(1): 11-20.
FDEP (2008). "Florida Stormwater Erosion and Sedimentation Control Inspector's Manual". Talahassee, Florida
Department of Environmental Protection: 378.
Fisher, L. and A. Jarrett (1984). "Sediment retention efficiency of synthetic filter fabrics [Land management,
erosion, flowing soil suspensions]." Transactions of the ASAE [American Society of Agricultural Engineers](USA).
Geotechdata.info. (2008, July 7, 2013). "Soil permeability coefficient." Retrieved January 28, 2014, from
http://www.geotechdata.info/parameter/permeability.html.
Gogo-Abite, I. (2012). Effluent Water Quality Improvement Using Silt Fences and Stormwater Harvesting. Doctor
of Philosophy, University of Central Florida.
Gogo-Abite, I. and M. Chopra (2013). "Performance evaluation of two silt fence geotextiles using a tilting test-bed
with simulated rainfall." Geotextiles and Geomembranes 39: 30-38.
Harbor, J. (1999). "Engineering geomorphology at the cutting edge of land disturbance: erosion and sediment
control on construction sites." Geomorphology 31(1): 247-263.
Hayes, S. A., R. McLaughlin and D. Osmond (2005). "Polyacrylamide use for erosion and turbidity control on
construction sites." Journal of soil and water conservation 60(4): 193-199.
Howe, K. J., D. W. Hand, J. C. Crittenden, R. R. Trussell and G. Tchobandglous (2012). Principles of Water
Treatment, John Wiley & Sons, Inc.
Koerner, R. M. (2012). Designing with geosynthetics, Xlibris Corporation.
Lamy, E., L. Lassabatere, B. Bechet and H. Andrieu (2013). "Effect of a nonwoven geotextile on solute and colloid
transport in porous media under both saturated and unsaturated conditions." Geotextiles and Geomembranes 36: 55-
65.
Owens, D. W., P. Jopke, D. W. Hall, J. Balousek and A. Roa (2000). "Soil erosion from two small construction
sites, Dane County, Wisconsin." USGS Fact Sheet, USGS, Madison, WI.
Rawal, A. and H. Saraswat (2011). "Pore size distribution of hybrid nonwoven geotextiles." Geotextiles and
Geomembranes 29(3): 363-367.
Risse, L., S. Thompson, J. Governo and K. Harris (2008). "Testing of new silt fence materials: A case study of a
belted strand retention fence." Journal of soil and water conservation 63(5): 265-273.
Sansone, L. and R. Koerner (1992). "Fine fraction filtration test to assess geotextile filter performance." Geotextiles
and Geomembranes 11(4): 371-393.

157
Suits, L. D. and Y. G. Hsuan (2003). "Assessing the photo-degradation of geosynthetics by outdoor exposure and
laboratory weatherometer." Geotextiles and Geomembranes 21(2): 111-122.
USEPA. (2011). "Sediment and Erosion Control." Retrieved March 10, 2014, from
http://www.epa.gov/region6/6en/w/sw/sediment.pdf.
USEPA. (2012). "Nonpoint Source Pollution: The Nation's Largest Water Quality Problem." Water: Outreach &
Communication Retrieved March 11, 2013, from http://water.epa.gov/polwaste/nps/outreach/point1.cfm.
Weggel, J. R. and J. Dortch (2012). "A model for filter cake formation on geotextiles: Experiments." Geotextiles and
Geomembranes 31: 62-68.
Weggel, J. R. and N. D. Ward (2012). "A model for filter cake formation on geotextiles: Theory." Geotextiles and
Geomembranes 31: 51-61.
Wu, C.-S., Y.-S. Hong and R.-H. Wang (2008). "The influence of uniaxial tensile strain on the pore size and
filtration characteristics of geotextiles." Geotextiles and Geomembranes 26(3): 250-262.
Zhang, Y., W. Liu, W. Shao and Y. Yang (2013). "Experimental study on water permittivity of woven
polypropylene geotextile under tension." Geotextiles and Geomembranes 37: 10-15.