performance evaluation of graded aggregate as a … · 2014-01-15 · performance evaluation of...
TRANSCRIPT

Florida Department of
TRANSPORTATION
Performance Evaluation of Graded
Aggregate as a Base Material
FDOT Office State Materials Office
Research Report Number
FL/DOT/SMO/13-562
Authors Sanghyun Chun
James Greene Abdenour Nazef
Date of Publication
12/2013

i
TABLE OF CONTENTS
1 EXECUTIVE SUMMARY .................................................................................................... 1
2 INTRODUCTION .................................................................................................................. 2
2.1 Background ........................................................................................................................ 2
2.2 Objectives and Scope......................................................................................................... 4
3 PROJECT DESCRIPTION ..................................................................................................... 4
4 SR-30A CONSTRUCTION MATERIAL INFORMATION ................................................. 6
5 PAVEMENT PERFORMANCE MONITORING ................................................................. 8
5.1 Falling Weight Deflectometer (FWD) ............................................................................... 8
5.2 Permanent Deformation (Rutting) ................................................................................... 12
5.3 Cracking........................................................................................................................... 17
5.4 Roughness ........................................................................................................................ 18
6 SUMMARY AND CONCLUSIONS ................................................................................... 19
7 ACKNOWLEDGEMENTS .................................................................................................. 20
8 REFERENCES ..................................................................................................................... 21

ii
LIST OF FIGURES
FIGURE 1. SR-30A at milepost 4.577 ........................................................................................... 5
FIGURE 2. SR-30A traffic information ......................................................................................... 5
FIGURE 3. Falling Weight Deflectometer ..................................................................................... 9
FIGURE 4. Stress distribution below FWD load.......................................................................... 10
FIGURE 5. Base response from FWD loading ............................................................................. 11
FIGURE 6. Overall pavement stiffness ........................................................................................ 12
FIGURE 7. Rut depth measurements............................................................................................ 13
FIGURE 8. Change in rut depth ................................................................................................... 14
FIGURE 9. Change in AC modulus ............................................................................................. 15
FIGURE 10. Change in base modulus .......................................................................................... 16
FIGURE 11. Change in subgrade-embankment modulus............................................................. 17
FIGURE 12. Summary of cracking measurements....................................................................... 18
FIGURE 13. SR-30A MRI ........................................................................................................... 19

iii
LIST OF TABLES
TABLE 1. Structural Layer Coefficients for Different Pavement Layers in Florida ..................... 3
TABLE 2. SR-30A Experimental Project ....................................................................................... 4
TABLE 3. Graded Aggregate Base Gradation ............................................................................... 7
TABLE 4. Field and Laboratory Measurements ............................................................................. 7

1
1 EXECUTIVE SUMMARY
In 1994, the Florida Department of Transportation (FDOT) initiated an experimental project on a
portion of the westbound travel lane of State Road (SR) 30A between Panama City Beach and
the Walton County line. The main objective of the experimental project was to compare the
relative long-term performance of a graded aggregate limestone base material (GAB) to the
performance of a standard limerock base. The project included two 1,500 foot test sections which
were resurfaced in May 2005 after approximately 2 million equivalent single axle loads (ESALs)
were applied to the roadway. Pavement performance was evaluated in terms of deflection, rut
depth and ride quality. Prior to resurfacing, the overall rut depth of both sections was
approximately the same, 0.23 inch for the GAB section and 0.22 inch for the limerock base
section, respectively. However, the 2012 survey showed the limerock section had a relatively
higher rut depth of 0.28 inch compared to 0.19 inch for the GAB section. Cracks were first
observed six years following construction in the GAB section and after eight years in the
limerock section. There was no significant difference in ride quality between the GAB and the
limerock base sections.

2
2 INTRODUCTION
2.1 Background
In a flexible pavement system, a base layer provides load distribution and contributes to strength,
drainage and frost protection. The properties and characteristics of a base layer play a significant
role in pavement performance, especially for traditional fatigue cracking (i.e. a load-associated
bottom-up cracking), and are the primary source for resistance to bending. It is generally agreed
that the type, quality, and mechanical properties of base materials are important factors that
affect the performance of asphalt pavements.
The FDOT’s current flexible pavement design method relies on the 1993 AASHTO
Method and is based on the structural number (SN) and layer coefficient concept (1). The SN is
used to indicate the required combined structural capacity of the pavement layers above the
embankment. The required SN is a function of reliability, serviceability, embankment resilient
modulus, and the expected traffic. The SN of the designed pavement must be greater than the
required SN to ensure adequate pavement performance. The required SN is calculated as follows:
SN = (a1 × D1) + (a2 × D2) + (a3 × D3) + … + (an × Dn) (1)
Where, a1-n = layer coefficient of the 1st to n
th layer and D1-n = layer thickness of 1
st to n
th layer.
Over the years, FDOT constructed several experimental field projects to study the effect
of layer thickness and type on pavement performance. The layer coefficients shown in TABLE 1
represent the relative strength of different pavement materials used in Florida. However, the

3
structural layer coefficients should be developed or revised as new materials are introduced and
field performance is supported by research.
TABLE 1. Structural Layer Coefficients for Different Pavement Layers in Florida
Group Layer Layer Coefficient
Friction Courses FC-5 0.00
FC-12.5, FC-9.5 0.44
Structural Courses SP-9.5, SP-12.5, SP-19.0 0.44
Base Courses
(General Use)
Limerock (LBR 100) 0.18
Cemented Coquina (LBR 100) 0.18
Shell Rock (LBR 100) 0.18
Bank Run Shell (LBR 100) 0.18
Graded Aggregate (LBR 100) 0.15
Type B-12.5 (Asphalt Base) 0.30
Base Courses
(Limited Use)
Limerock Stabilization (LBR 70) 0.12
Shell Stabilization (LBR 70) 0.10
Sand Clay (LBR 75) 0.12
Soil Cement (500 psi) 0.20
Soil Cement (300 psi) 0.15
Stabilization
Type B Stabilization (LBR 40) 0.08
Type B Stabilization (LBR 30) 0.06
Type C Stabilization 0.06
Subgrade Cement Treated 0.12
Lime Treated 0.08
Previous research conducted by McNamara and Miley concluded that the GAB and
limerock base materials may perform similarly based on the results of preliminary testing
conducted immediately after construction (2). However, the in-place pavement performance
should be monitored to evaluate how the GAB and limerock base sections truly perform over
time. Therefore, in 1994, an experimental project was constructed on State Road (SR) 30A in
Bay County to investigate the relative long-term performance of limerock and GAB as a base
material.

4
2.2 Objectives and Scope
The objective of this study is to compare the relative long-term performance of limerock and
GAB as base materials. Pavement performance was evaluated in terms of deflection, ride
quality/roughness, rutting, and cracking.
3 PROJECT DESCRIPTION
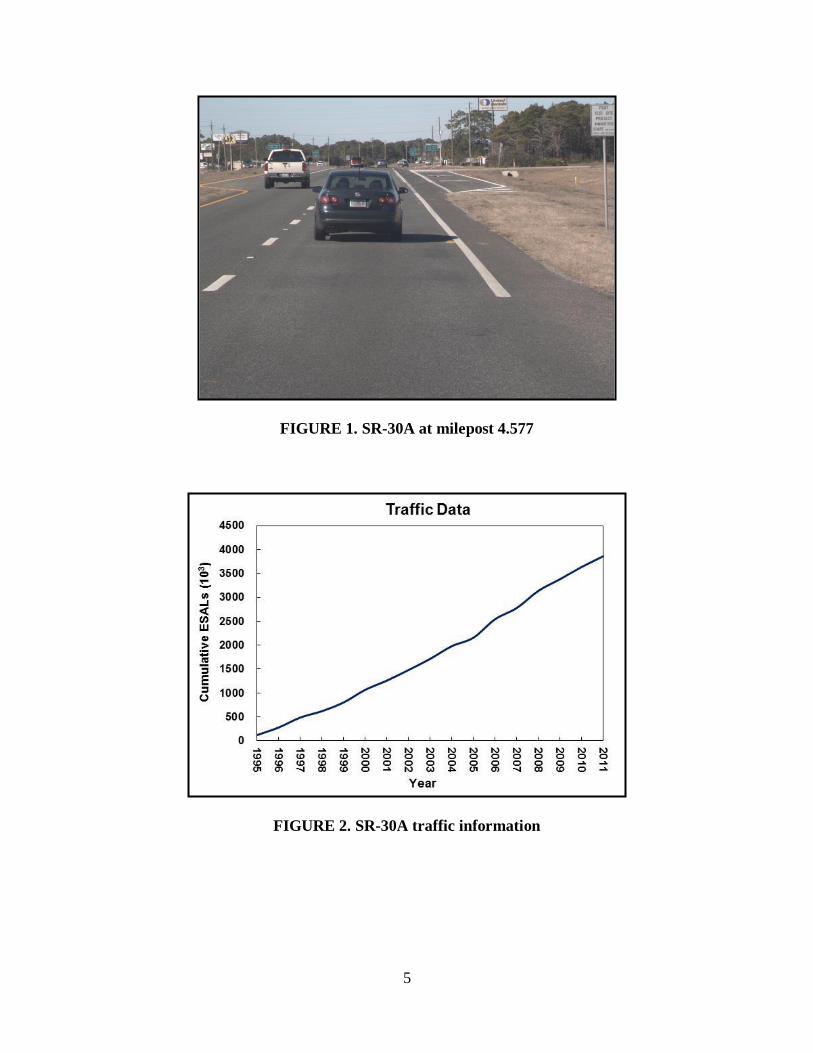
The experimental project was constructed in 1994 along the westbound travel lane of SR-30A,
between Panama City Beach and the Walton County line. This four-lane divided highway
consists of 12 foot lanes separated by a grassy median and four foot asphalt shoulders. The two
test sections are 1500 feet long. The test sections were resurfaced in May of 2005. TABLE 2
describes the limits of the test sections, base material sources and the installed price for the GAB
and limerock base. A photograph of the beginning of section 1 is shown in FIGURE 1. Also,
FIGURE 2 summarizes the traffic loading that has been applied to the test sections.
TABLE 2. SR-30A Experimental Project
Section 1 Section 2
Base Type Graded Aggregate Limestone Limerock
Source Vulcan Materials
Birmingham, AL
Piney Grove Mine (No. 61391)
Washington County
Station (feet) 340+00 to 355+00 374+00 to 389+00
Milepost 4.577 to 4.862 5.221 to 5.505
Installed Price
($/in/SY) 1.50 to 2.00 1.00 to 1.50
5
FIGURE 1. SR-30A at milepost 4.577
FIGURE 2. SR-30A traffic information

6
4 SR-30A CONSTRUCTION MATERIAL INFORMATION
Roadway construction complied with the FDOT’s Standard Specifications for Road and Bridge
Construction, 1991 Edition. The embankment material was classified as A-3 and A-2-4 material
according to the AASHTO Classification System. The subgrade consisted of embankment mixed
with sand clay borrow material to achieve a limerock bearing ratio (LBR) of 40 or greater. In
addition to standard quality control measurements, the following tests were conducted at selected
locations:
● Non-repetitive static plate load tests of soils (FM 5-527/AASHTO T 222)
● Moisture-density relations for embankment soils (FM 5-525/AASHTO T 99)
● Moisture-density relations for subgrade and base materials (FM 5-521/AASHTO T 180)
● Particle size analysis (FM 1-T 088/AASHTO T 88)
● Limerock Bearing Ratio (FM 5-515)
● Percent carbonates (FM 5-514)
The GAB gradation is summarized in TABLE 3. Also, TABLE 4 shows the average of
three individual plate bearing, density, moisture, and LBR tests performed during construction.
Results from field tests showed the embankment stiffness and density were similar for both
sections. Notes from construction records indicated that it was difficult to construct a uniform
subgrade using clay stabilized subgrade because it was slightly plastic and was not mixed well
leading to a highly variable material depending on moisture content. Some areas where the
moisture was low coincided with higher stiffness while wetter areas had a lower stiffness. While

7
specific subgrade LBR and plate bearing tests showed variability as indicated in TABLE 4, the
average LBR results were well above the required value of 40 when all tests throughout the
depth of the cross-section were considered. Both base materials passed the 100 LBR
requirements. Construction records also indicated that the average as-built pavement structure for
each section consisted of 4.5 inches of hot-mix asphalt (HMA), 10 inches of base material, and
16 inches of stabilized subgrade (4 inches thicker than designed).
TABLE 3. Graded Aggregate Base Gradation
Sieve Size Section 204 Specification
1,
% Passing Average % Passing
2
50 mm (2 inch) 100 100
19 mm (3/4 inch) 95 to 100 100
12.5 mm (1/2 inch) 65 to 90 80
9.5 mm (3/8 inch) 45 to 75 63
4.75 mm (#4) 35 to 60 51
2.0 mm (#10) 25 to 45 37
0.3 mm (#50) 5 to 25 11
0.075 mm (#200) 0 to 10 5
Note 1: The 2010 specification includes the same gradation requirements.
Note 2: Average of 3 samples. All samples met the specification.
TABLE 4. Field and Laboratory Measurements
Layer Section /
Base Type
Thickness
(inch)
Plate
Bearing
Modulus
(psi)
Field
Density
(pcf)
Field
Moisture
(%)
Lab
Max
Density
(pcf)
Optimum
Moisture
(%)
% Max
Density
LBR
Value
Base 1 / GAB 10 12,690 138.3 2.6 142.9 5.9 96.7 169
2 / Limerock 10 13,150 122.2 10.7 124.1 10.0 98.5 114
Subgrade 1 / GAB 16 18,500 115.8 5.3 116.0 10.5 99.7 45
2 / Limerock 16 8,472 109.8 7.0 108.9 10.3 100.8 28
Embankment 1 / GAB N/A 13,650 106.0 3.9 106.5 12.9 99.6 28
2 / Limerock N/A 10,520 104.6 5.4 104.5 12.9 100.2 31

8
5 PAVEMENT PERFORMANCE MONITORING
The SMO conducted annual pavement performance monitoring of the experimental sections
during the same time of the year (typically in January) to better control variability due to
seasonal changes (e.g. temperature, rainfall, etc.). The primary parameters used to evaluate the
performance of the experimental sections include:
● Pavement deflection/stiffness
● Pavement smoothness
● Asphalt surface permanent deformation (rutting), and
● Pavement cracking
5.1 Falling Weight Deflectometer (FWD)
Annual deflection measurements were conducted in the outside of wheel path for each lane. A
photograph of a FWD is shown in FIGURE 3. A typical testing configuration includes the
following:
● A 12 inch load plate
● A 9 kip applied load
● Deflection sensors placed at 0, 8, 12, 18, 24, 36, and 60 inches from the load plate

9
FIGURE 3. Falling Weight Deflectometer
The relative stiffness of a pavement system may be inferred through the determination of
several different deflection basin parameters. The peak deflection measured directly below the
load plate is representative of the overall pavement stiffness and elastic compression of the entire
pavement structure. Research has shown that 95 % of the deflections measured on the pavement
surface originate at a depth in the pavement corresponding to 34° from the horizontal (3). This
concept applied to the pavement structure of SR-30A is illustrated in FIGURE 4. Also, according
to FIGURE 4, the following deflection basin parameters may be used to evaluate the relative
performance of the base, subgrade, and embankment:
Base Response = D (8) – D (18) (2)
Subgrade Response = D (24) – D (36) (3)
Embankment Response = D (60) (4)

10
Where, D (i) = deflection measured i inches from the load in mils. It is noted that a smaller
deflection response corresponds to a stiffer layer (i.e. greater layer modulus).
FIGURE 4. Stress distribution below FWD load
FIGURE 5 shows the base response to FWD loading for both GAB and limerock base
sections over time. Prior to the 2005 resurfacing, the GAB shows a relatively stiffer response
than the limerock base. After resurfacing, the difference in base stiffness between both sections
became more negligible. Also, based on the FWD historical data, the overall limerock base
response was greater than the GAB over time, which indicates a potentially lower initial stiffness
of limerock base compared to GAB.
FW
D L
oa
d
34⁰0
5
10
15
20
25
30
35
40
0 10 20 30 40 50 60
De
pth
, in
ch
Distance from load, inch
Stress Zone Stress Depth Geophone
Base
HMA
Stabilized Subgrade
Embankment

11
FIGURE 5. Base response from FWD loading
The deflection measured directly below the load plate indicates the stiffness of the overall
pavement system. The overall pavement modulus may be calculated using the center deflection
according to the following equation:
Where, E0 = modulus of the entire pavement system beneath the load plate in psi, a = radius of
load plate in inch, σ0 = peak pressure of the FWD load plate in psi, d0 = peak center FWD
deflection in mils. FIGURE 6 shows the modulus for the overall pavement structure over time.
Overall, the pavement modulus for the section with GAB was slightly higher than that of the
section with a limerock base prior to the time of resurfacing in 2005 with the difference
decreasing over time. Similar to the base response in FIGURE 5, the difference in pavement
modulus between the two sections becomes negligible after the 2005 resurfacing. Also, up until
2005, the pavement stiffness for the GAB section decreased slightly from 69 to 61 ksi, while the

12
stiffness of the limerock base section remained approximately the same at 59 ksi. However, after
the 2005 resurfacing, the overall pavement modulus for both the GAB and limerock base
sections increased at a similar rate over time reaching similar modulus value by 2012.
FIGURE 6. Overall pavement stiffness
5.2 Permanent Deformation (Rutting)
Permanent deformation, or rut depth, was measured manually in the right wheelpath using a 6-
foot straightedge and measuring gauge. As shown in FIGURE 7, the overall rut depths of the
GAB and limerock base sections were similar until the 2005 resurfacing. Prior to resurfacing, the
average maximum rut depth was 0.23 inch for the GAB section and 0.22 inch for the limerock
section. Both sections exhibited similar rate of change in rut depth over time. However, a
significant difference in rut depth between the two sections was observed during the last four

13
surveys with a maximum average rut depth of 0.28 inch and 0.19 inch for limerock and GAB
section, respectively. In particular, between 2008 and 2012, the limerock section increasingly
showed a significant higher rate of change in rut depth than the GAB section. As indicated in
FIGURE 7, the limerock base section exhibited a relatively higher rate of rutting than the GAB
section over time throughout the entire project section.
FIGURE 7. Rut depth measurements
FIGURE 8 shows the rut depth measurements in 2006 shortly after resurfacing and again
in 2012 for the entire length of the experimental project section. Layer moduli were
backcalculated using FWD data to determine if the increase in rut depth may be due to a
deficiency in a specific layer.

14
Survey Year 2006 2012
Base Type GAB Limerock GAB Limerock
Min. 0.10 0.10 0.14 0.17
Max. 0.20 0.35 0.27 0.36
Average 0.16 0.17 0.19 0.28
Std. 0.04 0.06 0.04 0.07
%CV 23.8 36.3 19.7 23.4
FIGURE 8. Change in rut depth
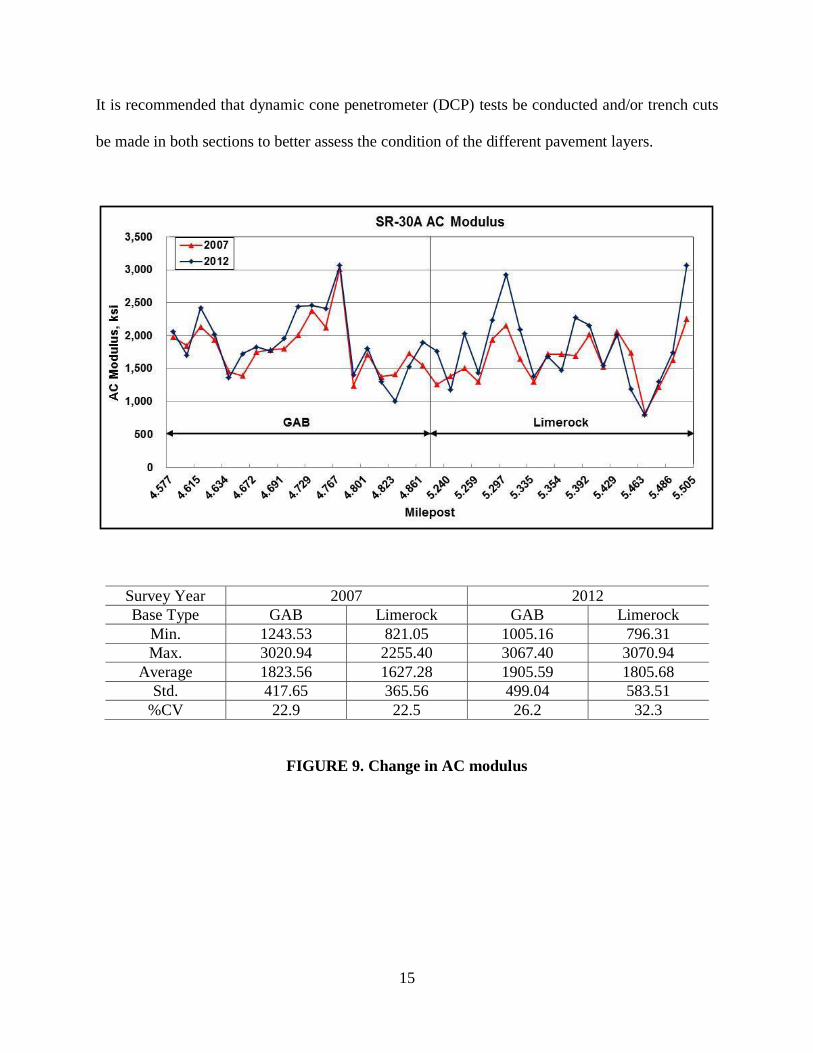
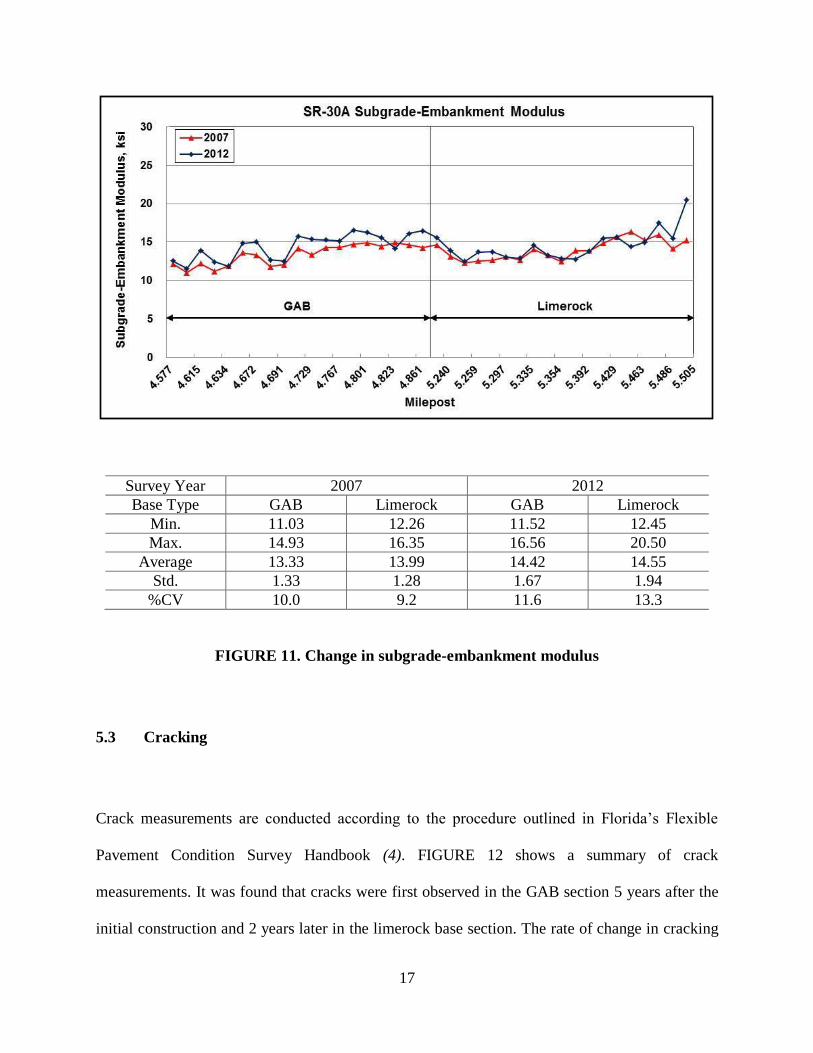
FIGURES 9 through 11 represent the change of backcalculated layer moduli over time
for asphalt concrete (AC), base, and subgrade/embankment. The subgrade and embankment
layers were combined to simplify the backcalculation process. Based on the results in FIGURES
9 through 11, the limerock base modulus appears to be uniform just after resurfacing, but seems
to have weakened and is much more variable in 2012 indicating potential damage. However,
ground truth data is required to determine the exact contribution of the different layers to rutting.
15
It is recommended that dynamic cone penetrometer (DCP) tests be conducted and/or trench cuts
be made in both sections to better assess the condition of the different pavement layers.
Survey Year 2007 2012
Base Type GAB Limerock GAB Limerock
Min. 1243.53 821.05 1005.16 796.31
Max. 3020.94 2255.40 3067.40 3070.94
Average 1823.56 1627.28 1905.59 1805.68
Std. 417.65 365.56 499.04 583.51
%CV 22.9 22.5 26.2 32.3
FIGURE 9. Change in AC modulus

16
Survey Year 2007 2012
Base Type GAB Limerock GAB Limerock
Min. 24.60 32.00 17.20 15.20
Max. 81.00 58.50 66.60 74.30
Average 47.04 48.42 39.04 39.53
Std. 13.42 7.59 13.23 12.82
%CV 28.5 15.7 33.9 32.4
FIGURE 10. Change in base modulus
17
Survey Year 2007 2012
Base Type GAB Limerock GAB Limerock
Min. 11.03 12.26 11.52 12.45
Max. 14.93 16.35 16.56 20.50
Average 13.33 13.99 14.42 14.55
Std. 1.33 1.28 1.67 1.94
%CV 10.0 9.2 11.6 13.3
FIGURE 11. Change in subgrade-embankment modulus
5.3 Cracking
Crack measurements are conducted according to the procedure outlined in Florida’s Flexible
Pavement Condition Survey Handbook (4). FIGURE 12 shows a summary of crack
measurements. It was found that cracks were first observed in the GAB section 5 years after the
initial construction and 2 years later in the limerock base section. The rate of change in cracking

18
was similar for both sections. After the resurfacing in 2005, a small amount of cracking was
observed in both sections for the first time during the 2011 survey.
1995 to 2005 After 2005 Resurfacing
Section Years Until First
Crack
2005 Cracked
Area, ft2/1000 ft
2
Years Until First
Crack
2012 Cracked
Area ft2/1000 ft
2
GAB 5 885 6 3
Limerock 7 845 6 2
FIGURE 12. Summary of cracking measurements
5.4 Roughness
Roughness is reported in terms of Mean Roughness Index (MRI) as shown in FIGURE 13
according to ASTM E 1926. The IRI is a mathematical process of the longitudinal pavement

19
profile and is presented in units of inches per mile, where the rating scale starts from 0
representing a perfectly smooth surface and increases as the surface becomes rougher. Based on
FIGURE 13, there is practically no significant difference in ride quality between the GAB and
limerock base sections. Both sections exhibited an improvement in ride quality as indicated by a
reduction in MRI in the years following resurfacing and the pavement smoothness has remained
stable since.
FIGURE 13. SR-30A MRI
6 SUMMARY AND CONCLUSIONS
In this study, the relative long-term pavement performance of GAB and limerock base was
evaluated. Pavement performance was expressed in terms of deflection, rutting, cracking, and
ride quality. A summary of findings and conclusions is presented as follows:

20
● Historical deflection data suggested that the limerock base exhibits slightly lower
stiffness than the GAB.
● There was no significant difference in rutting performance between the GAB section and
the limerock base section in the years prior to the 2005 resurfacing. However, the
limerock base section had a greater rate of rutting than the GAB section since 2009. FWD
data indicated possible damage to the limerock base, but further investigation is required
to determine the specific cause.
● Before resurfacing in 2005, the extent and rate of cracking for both sections were similar.
Six years after resurfacing, cracking is minimal and similar for both sections.
● There is no practical difference in ride quality between GAB section and limerock base
section based on MRI results.
● Overall, there is little difference in performance for both sections after the initial life
cycle. However, further investigation is warranted to explain the significant increase in
rutting of the limerock base section since 2009.
7 ACKNOWLEDGEMENTS
The work represented herein was the result of a team effort. The authors would like to
acknowledge the FDOT’s State Materials Office Pavement Materials Section staff for their
assistance with the data collection effort and technical advice.

21
8 REFERENCES
1. FDOT, Flexible Pavement Design Manual Document No. 625-010-002-g. Florida
Department of Transportation, Tallahassee, FL, 2008.
2. McNamara, R. L. and Miley, B. Evaluation of Graded Aggregate as a Base Material.
Florida Department of Transportation, State Materials Office, Gainesville, FL, 1992.
3. Irwin, L. H. User’s Guide to Modcomp2, Version 2.1. Local Roads Program, Cornell
University, Ithaca, NY, 1983.
4. FDOT, Flexible Pavement Condition Survey Handbook. Florida Department of
Transportation, Tallahassee, FL, 2009.