evaluation of the benefits of open-graded friction course
TRANSCRIPT

NDOT Research Report
Report No. 557-13-803
Evaluation of the Benefits of Open-Graded
Friction Course (OGFC) on NDOT Category-3
Roadways
May 2018
Nevada Department of Transportation
1263 South Stewart Street
Carson City, NV 89712

Disclaimer
This work was sponsored by the Nevada Department of Transportation. The contents of
this report reflect the views of the authors, who are responsible for the facts and the
accuracy of the data presented herein. The contents do not necessarily reflect the official
views or policies of the State of Nevada at the time of publication. This report does not
constitute a standard, specification, or regulation.

iii
TECHNICAL REPORT DOCUMENTATION PAGE
1. Report No. P 557-13-803
2. Government Accession No.
3. Recipient’s Catalog No.
4. Title and Subtitle Evaluation of the Benefits of Open-Graded Friction Course (OGFC) on NDOT Category-3 Roadways
5. Report Date Month 05 2018 6. Performing Organization Code
7. Author(s) Donald Watson, Fan Gu, and Jason Moore
8. Performing Organization Report No.
9. Performing Organization Name and Address National Center for Asphalt Technology 277 Technology Parkway Auburn, AL 36830
10. Work Unit No. 11. Contract or Grant No.
12. Sponsoring Agency Name and Address Nevada Department of Transportation 1263 South Stewart Street Carson City, NV 89712
13. Type of Report and Period Covered Final Report 14. Sponsoring Agency Code
15. Supplementary Notes
16. Abstract Numerous agencies use Open Graded Friction Course (OGFC) mixtures as the final riding surface on their roadways
because of the many benefits such as: reduced hydroplaning, reduced splash and spray, reduced headlight glare, improved visibility, reduced accidents, reduced noise, and surface friction properties. However, there have been some indications that OGFC performance is reduced over time due to the tendency of the surface pores to become clogged, so it was urgent that Nevada Department of Transportation (NDOT) conduct this research since OGFC mixtures cost about 25 percent more than dense-graded mixtures. NDOT constructed two projects for this study. The northern project was on state route 535 in Elko and the southern project was on I-15 east of Las Vegas. At each location a dense-graded mix was placed as a control mix to compare performance of the OGFC mix. A series of laboratory and field tests such as Cantabro stone loss, Hamburg Wheel Track Test for rutting susceptibility, retained tensile strength for moisture susceptibility, permeability, friction, texture, and tire-pavement noise were conducted with mixtures at both OGFC and dense-graded locations. Field testing showed the I-15 OGFC mixture exhibited benefits in permeability, friction, and noise reduction compared to the dense-graded mix and was cost-effective while the SR 535 OGFC applied in an urban setting was not. Based on this study, it is recommended that OGFC not be used in an urban environment or town area.
17. Key Words OGFC, permeability, tire-pavement noise, Cantabro stone loss
18. Distribution Statement No restrictions. This document is available through the: National Technical Information Service Springfield, VA 22161
19. Security Classif. (of this report) Unclassified
20. Security Classif. (of this page) Unclassified
21. No. of Pages
22. Price
Form DOT F 1700.7 (8-72) Reproduction of completed page authorized

iv
Evaluation of the Benefits of Open Graded Friction Course (OGFC) on NDOT Category-3 Roadways
by
Donald Watson, Fan Gu,
and Jason Moore
May 2018

v
AUTHOR AFFILIATION
National Center for Asphalt Technology, 277 Technology Parkway, Auburn, AL 36830. Corresponding author: D. E. Watson, [email protected].

vi
ACKNOWLEDGMENTS
This project was conducted in cooperation with NDOT and FHWA. The authors thank the NDOT Project Manager Yathi Yatheepan, and members of the NDOT project team: Matthew DeMattei, and Manjunathan Kumar, as well as the local area construction and maintenance engineers who helped with the necessary logistical arrangements to conduct the field sampling and testing.

vii
SI* (MODERN METRIC) CONVERSION FACTORS
APPROXIMATE CONVERSIONS TO SI UNITS
SYMBOL WHEN YOU KNOW MULTIPLY BY TO FIND SYMBOL LENGTH
in inches 25.4 millimeters mm ft feet 0.305 meters m yd yards 0.914 meters m mi miles 1.61 kilometers km
AREA in2 square inches 645.2 square millimeters mm2 ft2 square feet 0.093 square meters m2 yd2 square yard 0.836 square meters m2 ac acres 0.405 hectares ha mi2 square miles 2.59 square kilometers km2
VOLUME fl oz fluid ounces 29.57 milliliters mL gal gallons 3.785 liters L ft3 cubic feet 0.028 cubic meters m3 yd3 cubic yards 0.765 cubic meters m3
NOTE: volumes greater than 1000 L shall be shown in m3 MASS
oz ounces 28.35 grams g lb pounds 0.454 kilograms kg T short tons (2000 lb) 0.907 megagrams
(or "metric ton") Mg
(or “t”) TEMPERATURE (exact degrees)
oF Fahrenheit 5 (F-32)/9 or (F-32)/1.8
Celsius oC
FORCE and PRESSURE or STRESS lbf poundforce 4.45 newtons N
lbf/in2 poundforce per square inch
6.89 kilopascals kPa

viii
APPROXIMATE CONVERSIONS FROM SI UNITS
SYMBOL WHEN YOU KNOW MULTIPLY BY TO FIND SYMBOL LENGTH
mm millimeters 0.039 inches in m meters 3.28 feet ft m meters 1.09 yards yd km kilometers 0.621 miles mi
AREA mm2 square millimeters 0.0016 square inches in2 m2 square meters 10.764 square feet ft2 m2 square meters 1.195 square yards yd2 ha hectares 2.47 acres ac
km2 square kilometers 0.386 square miles mi2 VOLUME
mL milliliters 0.034 fluid ounces fl oz L liters 0.264 gallons gal m3 cubic meters 35.314 cubic feet ft3 m3 cubic meters 1.307 cubic yards yd3
MASS g grams 0.035 ounces oz kg kilograms 2.202 pounds lb
Mg (or "t")
megagrams (or "metric ton")
1.103 short tons (2000 lb) T
TEMPERATURE (exact degrees) oC Celsius 1.8C+32 Fahrenheit oF
FORCE and PRESSURE or STRESS N newtons 0.225 poundforce lbf
kPa kilopascals 0.145 poundforce per square inch
lbf/in2
*SI is the symbol for the International System of Units. Appropriate rounding should be made to comply with Section 4 of ASTM E380. (Revised March 2003)
(Source: FHWA)

ix
TABLE OF CONTENTS
Page List of Figures ................................................................................................................................ x List of Tables ................................................................................................................................ xi Executive Summary .................................................................................................................... xii Chapter 1. Literature Review .................................................................................................... 13
Introduction ............................................................................................................................... 13 Benefits and Disbenefits of OGFC Mix ................................................................................... 14 Mix Design Methods ................................................................................................................ 16 Construction and Maintenance ................................................................................................. 22
Chapter 2. OGFC Field Construction Projects ........................................................................ 25 Introduction ............................................................................................................................... 25 Construction information .......................................................................................................... 26
Chapter 3. Laboratory Test Results .......................................................................................... 29 Introduction ............................................................................................................................... 29 Cantabro Test ............................................................................................................................ 29 Tensile Strength Ratio .............................................................................................................. 30 Hamburg Wheel Tracking Test ................................................................................................. 31
Chapter 4. Field Performance Test Results .............................................................................. 34 Introduction ............................................................................................................................... 34 Field Permeability Test ............................................................................................................. 34 Field Friction Test ..................................................................................................................... 36 Surface Texture Test ................................................................................................................. 41 Tire-Pavement Noise Test ........................................................................................................ 41
Chapter 5. Cost-Benefit Analysis of OGFC Projects ............................................................... 43 Introduction ............................................................................................................................... 43 Initial Construction Cost ........................................................................................................... 44 Maintenance Cost ..................................................................................................................... 46 Salvage Value ........................................................................................................................... 49 Safety-Related Benefit .............................................................................................................. 49 Noise-Related Benefit ............................................................................................................... 52 Net Present Value of Costs of Identified Pavements ................................................................ 53
Conclusions .................................................................................................................................. 55 References .................................................................................................................................... 57 Appendix A Asphalt Mix Designs ............................................................................................ 57 Appendix B Laboratory Test Results ...................................................................................... 74 Appendix C Roadway Test Results ......................................................................................... 80

x
LIST OF FIGURES
Page Figure 1 Use of OGFC Mixtures by State Highway Agencies in 2015. ....................................... 13 Figure 2 Primary distresses observed in OGFC mixes of (a) top-down cracking and (b)
raveling. ................................................................................................................................ 14 Figure 3 Comparison of driver’s view on rainy days on (a) dense-graded mix and (b)
OGFC surface. ...................................................................................................................... 14 Figure 4 Fatality reduction on rainy days. .................................................................................... 15 Figure 5 Aggregate type specified by agencies. ........................................................................... 17 Figure 6 Survey response to stabilizing additives used in OGFC mixes. ..................................... 19 Figure 7 Agency response for tack application rate...................................................................... 23 Figure 8 Raveling of OGFC mixture due to poor construction practices (a) cold
transverse joint and (b) center of paver streak. ..................................................................... 24 Figure 9 Locations of identified construction projects. ................................................................ 25 Figure 10 OGFC construction on SR 535. .................................................................................... 27 Figure 11 OGFC construction on I-15. ......................................................................................... 28 Figure 12 Cantabro loss results for DGHMA and OGFC mixtures. ............................................ 30 Figure 13 Tensile strength ratio test results for DGHMA and OGFC mixtures. .......................... 31 Figure 14 Determination of stripping inflection point from HWTT............................................. 32 Figure 15 Field permeability test results of (a) Elko and (b) Las Vegas sections. ....................... 35 Figure 16 Surface friction test results of (a) Elko and (b) Las Vegas sections. ............................ 37 Figure 17 Surface texture results of Elko and Las Vegas sections. .............................................. 41 Figure 18 Sound intensity results of Elko and Las Vegas sections. ............................................. 42 Figure 19 Illustration of cost-benefit analysis for OGFC pavements. .......................................... 44

xi
LIST OF TABLES
Page Table 1 Requirements of aggregate characteristics in OGFC mix design .................................... 17 Table 2 Requirements of asphalt binders used in OGFC mixtures ............................................... 18 Table 3 Aggregate gradations for OGFC mixtures specified by highway agencies ..................... 20 Table 4 Optimum asphalt content properties for OGFC mixes .................................................... 22 Table 5 Aggregate gradations of DGHMA and OGFC mixes for the Elko project ..................... 26 Table 6 Aggregate gradations of DGHMA and OGFC mixes for the I-15 project ...................... 28 Table 7 Hamburg wheel tracking test results for DGHMA and OGFC mixtures ........................ 33 Table 8 Friction resistance on various NDOT projects ................. Error! Bookmark not defined. Table 9 Calculation of initial construction cost ............................................................................ 45 Table 10 Calculation of Winter Maintenance Cost....................................................................... 47 Table 11 Salvage values of OGFC and DGHMA pavements....................................................... 49 Table 12 Estimation of Crash Modification Factors for OGFC treatment (Lyon et al.
2018) ..................................................................................................................................... 50 Table 13 Unit costs of various accident types (Ozbay et al., 2001) .............................................. 51 Table 14 Model coefficients for estimation of expected number of accidents per year ............... 51 Table 15 Safety-related savings (or costs) for OGFC pavements ................................................. 51 Table 16 NDSI values from existing studies ................................................................................ 52 Table 17 Calculation of noise costs for OGFC pavements ........................................................... 53 Table 18 Calculation of NPVs for identified OGFC and DGHMA pavement costs .................... 54

xii
EXECUTIVE SUMMARY
This study evaluated the benefits of Open Graded Friction Course (OGFC) on NDOT Category-3 Roadways. Field projects constructed in Elko and Las Vegas, respectively were used for the research analysis. Each project included both the OGFC and Dense-Graded Hot Mix Asphalt (DGHMA) sections. The Elko project was a Category-3 project located on state route 535 in the town area of Elko while the Las Vegas project was a Category- 1 project constructed in a rural area on I-15 interstate highway. The I-15 Category-1 project was selected for this study because there were no Category-3 projects in southern Nevada during the time of this research study. Laboratory tests were performed to evaluate the durability, rutting and moisture-susceptibility of OGFC mixtures. The selected test methods included the Cantabro test, Tensile Strength Ratio (TSR) test, and Hamburg Wheel-Track Test (HWTT). The laboratory test results showed that the Las Vegas OGFC mixture passed all the performance criteria, but the Elko Mixture failed to satisfy the HWTT criterion.
The field performance tests were conducted to assess the permeability, friction, texture, and noise functionality over time. The selected test methods included the NCAT falling head permeameter test, locked-wheel skid trailer test, Circular Texture Meter (CTM), and On-Board Sound Intensity (OBSI) test. The field performance results demonstrated that the Las Vegas OGFC pavement exhibited benefits in permeability, friction, and noise reduction compared to the DGHMA pavement, while the Elko OGFC pavement showed comparable performance with the DGHMA pavement after 2-years of service.
Finally, a cost-benefit analysis was conducted to monetize the advantages and disadvantages of OGFC pavements. As demonstrated in the economic analysis, the OGFC pavement in Las Vegas reduced the net present value of project costs by 36%, while the OGFC pavement in Elko increased the net present value of project costs by 86%. This indicates that the implementation of OGFC is cost-effective in rural highways but impractical in urban or town areas. High speed traffic is generally needed to help keep the interconnected voids of an OGFC pavement from becoming clogged over time. As a result of the reduced speed on the Elko project, the permeability functionality was lost after one year and the noise reduction benefit was lost after thirty two months.

13
CHAPTER 1. LITERATURE REVIEW
INTRODUCTION Open graded friction course (OGFC) is a gap-graded asphalt mixture that contains a high percentage of air voids (i.e., usually 15% - 22%) (Alvarez et al. 2006). It is also known as Permeable European Mix (PEM), Porous Friction Course (PFC), and Porous Asphalt (PA) that has been widely used in Europe (e.g., The Netherlands, France, and Germany), Asia (e.g., China, Japan, and Korea), and the United States for decades. The OGFCs are usually paved as the final riding surface on roadways because of the safety and environmental benefits associated with this mixture. Despite the benefits, the use of OGFC has diminished over the years due to durability and service life issues. The durability problems are generally evidenced by raveling, and once the distress begins, it progresses rapidly. A 1998 survey conducted by the National Center for Asphalt Technology (NCAT) showed that in 1998, 22 states had discontinued use of OGFC (Kandhal and Mallick 1998). A 2015 survey conducted by NCAT showed that only half of 41 responding agencies (40 states and Puerto Rico) were using OGFC mixes. Figure 1 depicts the results of the 2015 survey regarding OGFC usage. The survey revealed that agencies that did not use OGFC felt that their designs were not adequate to maintain the expected performance life of OGFC mixes. The primary distresses that reportedly caused premature failure were identified as raveling and top-down cracking. Figure 2 shows the examples of raveling and cracking in an OGFC mix. In this chapter, a thorough review of existing OGFC studies was conducted to summarize the benefits and disbenefits of OGFC mixes, and their mix design methods and construction and maintenance issues.
Figure 1 Use of OGFC Mixtures by State Highway Agencies in 2015.

14
(a) (b)
Figure 2 Primary distresses observed in OGFC mixes of (a) top-down cracking and (b) raveling.
BENEFITS AND DISBENEFITS OF OGFC MIX
The safety and environmental benefits of OGFC mix have been documented in many studies. In regard to safety, one of the obvious abilities of OGFC mixtures is to channel water through the pavement structure. The reduction in water standing or flowing across the pavement surface during wet weather is a significant improvement over the performance of dense-graded hot mix asphalt (DGHMA) layers. Thereby, the use of OGFC mixture as a surface layer is effective in improving the friction resistance of pavement in wet weather, reducing splash and spray from surrounding vehicles, reducing glare from on-coming headlights during rainy conditions, and enhancing the visibility of pavement markings. Figure 3 compares the driver’s view on the surfaces of OGFC and DGHMA in rainy days. It is shown that the backsplash and spray from vehicles dramatically diminish a driver’s view of the paint striping and surrounding vehicles.
(a) (b)
Figure 3 Comparison of driver’s view on rainy days on (a) dense-graded mix and (b) OGFC surface.

15
Because of these safety benefits, the OGFC treatment has been shown to lower wet weather vehicle crashes or accident rates and reduce the economic costs of accidents. Figure 4 shows a traffic study conducted by Japanese researchers in 2010 (Shimento and Tanaka 2010). As presented, the OGFC significantly reduced the number of fatalities during rainy weather in Japan when compared to standard DGHMA. Hernandez-Saenz et al. (2016) asserted that these safety-related benefits were the main reason for using OGFC mixtures in the United States. However, some studies challenged that the safety effectiveness of OGFC was limited and inconclusive (Elvik and Greibe 2005; Buddhavarupu et al. 2015). They claimed that the road user usually drives faster on OGFC surfaced pavements, which might result in a higher accident rate as compared to the conventional pavements. Thus, there is an urgent need to thoroughly review these studies in order to evaluate the safety effectiveness of OGFC pavements.
Figure 4 Fatality reduction on rainy days.
In terms of environmental benefits, OGFC is effective in reducing the tire/pavement noise and improving the water runoff quality. The majority of highway noise comes from the pavement-tire interaction, especially when the traffic speed is above 45 miles per hour. The noise can become an annoyance to human beings, which leads to negative impacts on the quality of life. It can also have an economic impact on real estate by keeping properties from being developed or sold (Donavan 2007). Because of its high interconnected air void content, the OGFC mix acts as a resonant cavity structure that efficiently absorbs sound energy generated from the tire-pavement interface. The existing studies indicate that the use of OGFC reduces the tire/pavement noise by 3 to 6 dBA, which is equivalent to diminishing the traffic volume by 50 percent or comparable to the construction of a noise wall (Bernhard and Wayson 2004). Due to its considerable noise reduction, OGFC has been used as a strategic means of meeting environmental noise regulations in Europe.
In addition, a few studies also pointed out the water runoff generated from OGFC surface was of better quality than that from conventional DGHMA surfaces. It was found that water runoff from OGFC layers had a significant lower concentration of total suspended solids, total metals, and phosphorus. This benefit of OGFC was attributed to the reduction of splash and spray that reduced the amount of pollutants derived from the bottoms of vehicles, and a large amount of pores in the surface layer that were able to retain these pollutants.
Although these safety and environmental benefits are attractive, the use of OGFCs is also associated with several shortcomings. One great shortcoming is its high material cost. The
01234567
Sunny Days Rainy Days
Fata
lity
Rat
e pe
r 10
0 M
illio
n M
iles T
rave
led
Standard Mix OGFC

16
material cost of OGFC is usually 20%-40% higher than that of conventional mixes used in highway construction. Winter maintenance is another serious problem for OGFC pavement. Compared to the conventional pavement, OGFC pavement has earlier and more frequent frost and ice formation due to its low thermal conductivity caused by a porous void structure. To maintain a desirable ride quality in winter, OGFC pavement requires more deicing agents and more frequent maintenance activities, which means OGFC pavement has higher maintenance costs than the conventional pavement. In addition, OGFC mixture is often associated with poor long-term performance or durability. The OGFC mixture normally has a higher potential for raveling when compared to conventional mix. This results in a shorter service life for OGFC pavements (e.g., typically 7-10 years for OGFCs and 12-15 years for conventional mix). Apparently, the durability and service life issues diminish the use of OGFC treatment in asphalt pavements. As shown in Figure 1, only 20 state highway agencies were using OGFC mixtures. Based on the survey feedback, the primary reason agencies did not use OGFC was that their mix designs were not adequate to ensure the expected service life of OGFC mixtures. Therefore, a performance-based mix design is needed to produce long-lasting OGFC mixtures with adequate functionality.
MIX DESIGN METHODS
An OGFC pavement must be permeable enough to drain the water away from the surface and off the roadway, and meanwhile it must provide acceptable performance with a long service life. Current design of OGFC mixtures requires three major components, including: a) suitable materials; b) a well-designed gradation; and c) optimum binder content. In this section, the existing mix designs of OGFC mixture are reviewed on the basis of these three components. Selection of Materials
The OGFC mixtures usually consist of aggregates, asphalt binders, stabilizing agents, and fillers or anti-stripping agent. A detailed description of the selection of these materials is presented as follows. Aggregates
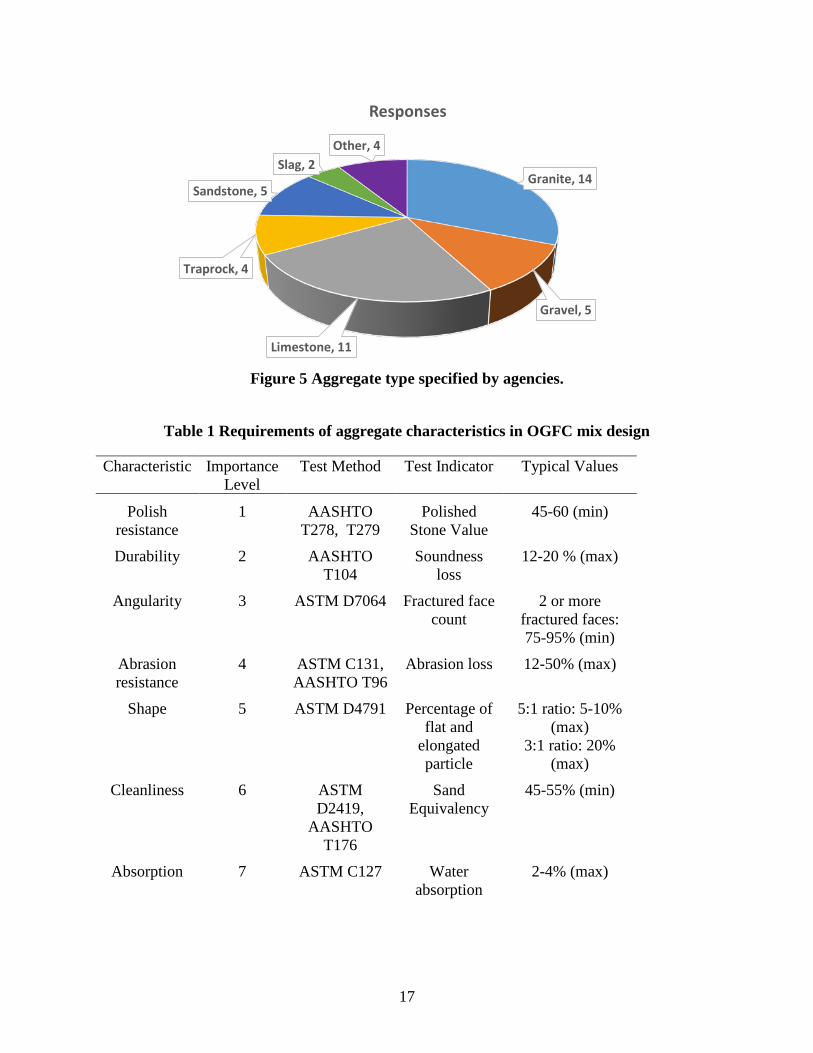
In the United States, the most commonly used aggregate types are granite, limestone, gravel and sandstone. Some state highway agencies also consider traprock and blast furnace slag for the mix design of OGFC mixtures. Figure 5 presents a survey result of aggregate type specified by agencies. To ensure the aggregates with high quality, the aggregate characteristics that are considered for the mix design include durability, polish resistance, angularity, shape, cleanliness, abrasion resistance, and absorption. Table 1summarizes the requirements of these aggregate characteristics in the existing mix designs in terms of importance level, test method, test indicator, and typical values. The importance level is ranked according to a survey from National Cooperative Highway Research Program (NCHRP) Report 640 (Cooley et al. 2009). The typical values are summarized from the existing OGFC specifications in different countries.
17
Figure 5 Aggregate type specified by agencies.
Table 1 Requirements of aggregate characteristics in OGFC mix design
Characteristic Importance Level
Test Method Test Indicator Typical Values
Polish resistance
1 AASHTO T278, T279
Polished Stone Value
45-60 (min)
Durability 2 AASHTO T104
Soundness loss
12-20 % (max)
Angularity 3 ASTM D7064 Fractured face count
2 or more fractured faces: 75-95% (min)
Abrasion resistance
4 ASTM C131, AASHTO T96
Abrasion loss 12-50% (max)
Shape 5 ASTM D4791 Percentage of flat and
elongated particle
5:1 ratio: 5-10% (max)
3:1 ratio: 20% (max)
Cleanliness 6 ASTM D2419,
AASHTO T176
Sand Equivalency
45-55% (min)
Absorption 7 ASTM C127 Water absorption
2-4% (max)
Granite, 14
Gravel, 5
Limestone, 11
Traprock, 4
Sandstone, 5
Slag, 2Other, 4
Responses

18
Asphalt Binders
OGFC mixes have been successfully used with both modified and unmodified binders. The use of modified binders becomes more prevalent since the modified binders are effective in increasing the service life of OGFC pavements and preventing the draindown of OGFC mixtures. In the United States, the most common modifiers for OGFC mixtures are SBS polymer and rubber (e.g., crumb rubber modifier and ground tire rubber). These modifiers can provide a stiffer asphalt binder for OGFC mixtures, which leads to the increase of cohesion in aggregate stone skeleton. For this reason, the OGFC mixes with the modified asphalt binders usually have higher resistances to rutting, cracking, and raveling damage, which exhibit better durability in the field. Table 2 presents the requirements of highway agencies for the use of modified and unmodified asphalt binders in OGFC mixtures. Note that the binders are graded by the Superpave Performance Grading (PG) system in the United States, and graded by the penetration grading system in European countries.
Table 2 Requirements of asphalt binders used in OGFC mixtures
Agency Binder Requirement
UK 100 pen Italy 80/100 pen Spain 80/100 pen
Alabama PG 76-22 Florida PG 76-22, PG 76-22 HP, ARM-5, ARB-12
Mississippi PG 76-22 North Carolina PG 76-22, PG 64-22
Texas PG 76-XX Virginia PG 70-28
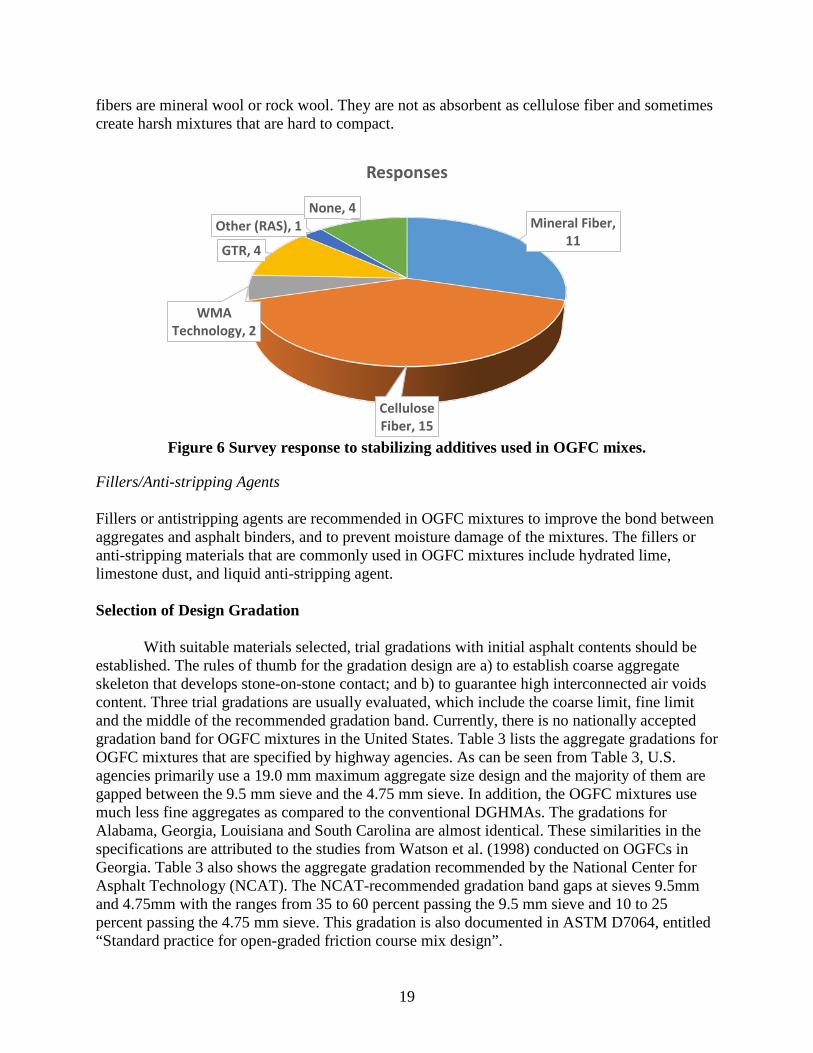
Stabilizing Agents Stabilizing additives are used to improve the durability of OGFC mixtures by preventing draindown and by increasing their tensile strength. When draindown occurs during production and transportation of the OGFC mixture, a significant amount of the asphalt binder is lost from the mix. This loss of binder can cause decreased durability, which may lead to premature raveling or cracking. Figure 6 shows a survey response to stabilizing additives used in OGFC mixes. The most commonly used stabilizers are cellulose and mineral fiber. They are typically added to the mix at a rate of 0.2-0.5 percent by total weight of the mixture (Cooley et al., 2009). Cellulose fibers are flora-based and made in either pellet or loose form. The cellulose fiber has high absorption so that it enables to maintain high binder content and reinforced asphalt film. Mineral fibers exist in two forms: manufactured and naturally-occurring. Asbestos, the only naturally-occurring fiber used in asphalt, was used as mineral filler in the 1960’s until its negative impact on human health was discovered. The most common manufactured mineral
19
fibers are mineral wool or rock wool. They are not as absorbent as cellulose fiber and sometimes create harsh mixtures that are hard to compact.
Figure 6 Survey response to stabilizing additives used in OGFC mixes.
Fillers/Anti-stripping Agents Fillers or antistripping agents are recommended in OGFC mixtures to improve the bond between aggregates and asphalt binders, and to prevent moisture damage of the mixtures. The fillers or anti-stripping materials that are commonly used in OGFC mixtures include hydrated lime, limestone dust, and liquid anti-stripping agent. Selection of Design Gradation
With suitable materials selected, trial gradations with initial asphalt contents should be established. The rules of thumb for the gradation design are a) to establish coarse aggregate skeleton that develops stone-on-stone contact; and b) to guarantee high interconnected air voids content. Three trial gradations are usually evaluated, which include the coarse limit, fine limit and the middle of the recommended gradation band. Currently, there is no nationally accepted gradation band for OGFC mixtures in the United States. Table 3 lists the aggregate gradations for OGFC mixtures that are specified by highway agencies. As can be seen from Table 3, U.S. agencies primarily use a 19.0 mm maximum aggregate size design and the majority of them are gapped between the 9.5 mm sieve and the 4.75 mm sieve. In addition, the OGFC mixtures use much less fine aggregates as compared to the conventional DGHMAs. The gradations for Alabama, Georgia, Louisiana and South Carolina are almost identical. These similarities in the specifications are attributed to the studies from Watson et al. (1998) conducted on OGFCs in Georgia. Table 3 also shows the aggregate gradation recommended by the National Center for Asphalt Technology (NCAT). The NCAT-recommended gradation band gaps at sieves 9.5mm and 4.75mm with the ranges from 35 to 60 percent passing the 9.5 mm sieve and 10 to 25 percent passing the 4.75 mm sieve. This gradation is also documented in ASTM D7064, entitled “Standard practice for open-graded friction course mix design”.
Mineral Fiber, 11
Cellulose Fiber, 15
WMA Technology, 2
GTR, 4
Other (RAS), 1None, 4
Responses

20
Cooley et al. (2009) provided an empirical relationship to estimate the initial asphalt content for trial gradation, which is based on the combined aggregate bulk specific gravity. Specimens are compacted for each of the trial gradation, and the corresponding air void content of mixture and voids in the coarse aggregate (VCA) are used to select the design gradation.
Table 3 Aggregate gradations for OGFC mixtures specified by highway agencies
State Mix
19mm (3/4”)
12.5mm (1/2”)
9.5mm (3/8”)
4.75mm (No. 4)
2.36mm (No. 8)
1.18mm (No. 16)
0.6mm (No. 30)
0.075mm (No. 200)
AL 100 85-100 55-65 10-25 5-10 2-4 AZ 1 100 30-45 4-8 0-2 AZ 2 100 31-46 5-9 0-3 CA 1 78-89 28-37 7-18 CA 2 99-100 29-36 7-18 FL 100 85-100 55-75 15-25 5-10 2-4
GA 1 100 85-100 20-40 5-10 2-4 GA 2 100 85-100 55-75 15-25 5-10 2-4 GA 3 100 80-100 35-60 10-25 5-10 1-4 LA 1 100 90-100 25-50 5-15 2-5 LA 2 100 85-100 55-75 10-25 5-10 2-4 MS 100 80-100 15-30 10-20 2-5
NC 1 100 75-100 25-45 5-15 1-3 NC 2 100 75-100 25-45 5-15 1-3 NC 3 100 85-100 55-75 15-25 5-15 2-4 NE 100 95-100 40-80 15-35 5-12 0-3
NJ 1 100 89-100 30-50 5-15 2-5 NJ 2 100 85-100 35-60 10-25 5-10 2-5 NJ 3 100 85-100 20-40 5-10 2-4 NM 100 90-100 25-55 0-12 0-8 0-4
NV 1 100 90-100 35-55 5-18 0-4 NV 2 100 95-100 40-65 12-22 0-5 OR 1 99-100 90-100 22-40 5-15 1-5 OR 2 99-100 90-98 18-32 3-15 1-5 SC 100 85-100 55-75 15-25 5-10 0-4 TN 100 85-100 55-75 10-25 5-10 2-4
TX 1 100 80-100 35-60 1-20 1-10 1-4
TX 2 100 95-100 50-80 0-8 0-4 0-4
NCAT 100 85-100 35-60 10-25 5-10 2-4

21
Determination of Optimum Binder Content
Once the design gradation is selected, the optimum binder content (OBC) needs to be determined. In this step, there are usually 3 or 4 trial asphalt contents with a 0.5 percent increment above and below the initial asphalt content. The methods to determine the OBC are generally categorized as three groups: 1) absorption calculation; 2) visual determination; and compacted specimen evaluation.
The absorption calculation method utilizes the oil absorption capacity and the apparent specific gravity of aggregates to empirically estimate the OBC of OGFC mixture. This method ignores the influence of binder type and aggregate type on the OBC of asphalt mixture. Meanwhile this method cannot ensure that OGFC mixture with designed OBC has satisfied field performance.
The visual determination method refers to Pie-plate or Pyrex bowl test. In this method, approximately 1000 grams uncompacted OGFC mix placed in a glass pie plate is oven-heated at 160°C for 1 hour. After that, the pie plate with OGFC mix is removed from the oven to cool down to room temperature, and then the plate is inverted for the visual determination whether the trial binder content is the OBC. The visual determination is extremely subjective, which requires experienced technician to judge the results. To overcome this issue, Pernia et al. (2016) employed an image analysis technique to quantitatively determine the OBC of OGFC mix. This approach is similar to the draindown test, which can evaluate the stability of OGFC mix. The compacted specimen evaluation method directly targets the performance of OGFC mixture to determine its OBC. The specimens are compacted either at a level of 50 gyrations using Superpave Gyratory Compactor (SGC) or at a level of 50 blows per each side using a Marshall Compactor. The following engineering properties of compacted specimen are evaluated:
1) Air voids, which are related to the permeability of pavement; 2) VCA of the dry-rodded aggregate (VCADRC) and VCA of the mix (VCAMIX), which is to
ensure the stone-on-stone contact; 3) Cantabro loss, which is related to durability; 4) Draindown, which is related to stability; 5) Permeability; and 6) Tensile strength ratio (TSR), which is related to the moisture susceptibility.
Table 4 summarizes three national compacted specimen evaluation criteria to determine the OBC of OGFC mixture. In general, these three mix design criteria are in good agreement with each other. Compared to the other two methods above, the compacted specimen evaluation method is more desirable to reflect the field performance of OGFC mixture. However, the use of compacted specimen-based methods still cannot ensure the designed OGFC mixture possesses satisfactory field performance. For example, the existing studies reported that some premature distresses including raveling, shoving, and excessive rutting, were found in OGFC pavements. This is because other important engineering properties (e.g., cracking and rutting resistance) should also be considered in OGFC mix design.

22
Table 4 Optimum asphalt content properties for OGFC mixes
Mix Property NCHRP 640 ASTM D7064 NAPA Series 115
Air Voids (%) 18 – 22 ≥18 ≥18
Unaged Cantabro Loss (%) ≤15.0 ≤20.0 ≤20.0
VCAMIX (%) <VCADRC ≤VCADRC ≤VCADRC
Tensile Strength Ratio ≥0.70 ≥0.80 ≥0.80 Draindown at Production
Temperature (%) ≤0.30 ≤0.30 ≤0.30
Permeability (m/day), min. 100 100 100
CONSTRUCTION AND MAINTENANCE
The main issues with OGFC mixes that can be related to construction are raveling and delamination. The following factors are the main influences that lead to issues with OGFC pavements during production and construction:
• Homogenous mix gradation and temperature • Asphalt content • Tack bond strength, rate and quality of application • Layer thickness • Mixing temperature during placement According to Bennert et al. (2014), production and construction issues may be more
responsible for raveling than mix design properties. Inconsistent temperatures in the mix during construction can lead to both delamination and raveling. Delamination occurs when the bond between the underlying surface and the OGFC is inadequate and causes a slip plane. A tack application is placed on the surface of the underlying layer so that the OGFC can adhere. If the underlying layer is too cold or covered in dust the tack material may not adhere, causing the pavement to delaminate. The amount and type of tack material is also important. Since OGFC mixtures are coarse-graded, there is less contact area between aggregate particles in the OGFC and the underlying layer than for a DGHMA. It would therefore seem logical that the tack rate should be increased so that the contact area has the same tack bond strength as a DGHMA.
Several studies have been conducted on the interface bond strength. An NCAT study in 2005 recommends a bond strength of 100 psi, when tested at 77°F, for newly constructed overlays (West et al. 2005). This study was primarily for DGHMA overlays but did include porous overlay data in the bond strength recommendation. By improving the bond of the two layers, the risk of delamination is diminished.
The rate at which the tack is applied is also a critical component. Figure 7 shows tack rates provided by agencies that responded to the 2014 NCAT survey. Most tack material is an emulsion. Emulsions consist of asphalt binder particles that are suspended in water. This allows the tack to be spread more evenly and allows it to be applied at lower temperatures for safety reasons. The percent of asphalt binder in the emulsion is known as the residual. Most application rates are based on the residual. There is a wide range of tack rates provided in the responses

23
(0.02 – 0.15 gal/sy) depending on the type of tack material used. One example of the “Other” category shown in Figure 7 is from South Carolina which provided a range of 0.05-0.15 gal/sy.
Figure 7 Agency response for tack application rate.
While raveling can be linked to the interface bond, it is also a durability issue that begins at the top of the pavement. Mix temperature is one of the biggest concerns when constructing OGFC mixtures. Consistent mix temperatures and short haul times are critical for adequate placement. Due to the open structure, an OGFC will cool faster than a standard DGHMA. This can be mitigated somewhat with the use of insulated truck beds and tarpaulins during transport to resist crusting of the outer surface of the mix on the haul truck. However, initial production temperature, haul time, and the ambient/pavement surface temperature are more critical. Great Britain specifies that from production until the mix is placed on the ground, no more than 3 hours can elapse (Alvarez et al. 2006). The FHWA Technical Advisory recommended a maximum haul distance of 40 miles and a travel time of less than 1 hour (FHWA 1990). In order to mitigate the loss of heat in OGFC mixtures during construction the following items have be considered:
1. Provide an adequate number of haul trucks so that there is no pause in construction. When the paver is required to wait on haul trucks due to a lack of mix, a cold transverse joint is created (Figure 8a).
2. Preheat the screed before the initial start-up at a transverse joint. A cold screed will pull some of the mix particles at the start-up transverse joint and will cause a lack of mix homogeneity. In DGHMA, the material can be raked to correct this issue; but raking an OGFC, especially with modified binder is somewhat difficult.
3. Use a material transfer vehicle (MTV). A MTV is used to remix the asphalt mixture after it has been transported to the job site. This remixing should result in a homogenous mix temperature that will help eliminate cold spots in the asphalt mat.
4. Ensure adequate screed crown and temperature. Most pavers use multiple burners to heat the screed. These burners can go out during production and cause a cold spot in one section of the screed. It is important to provide proper adjustment of screed crown and screed
0
1
2
3
4
5
6
7
<0.04 0.04-0.08 0.08-0.12 > 0.12 Other
No.
of R
espo
nses
Application Rate, gal/sy
24
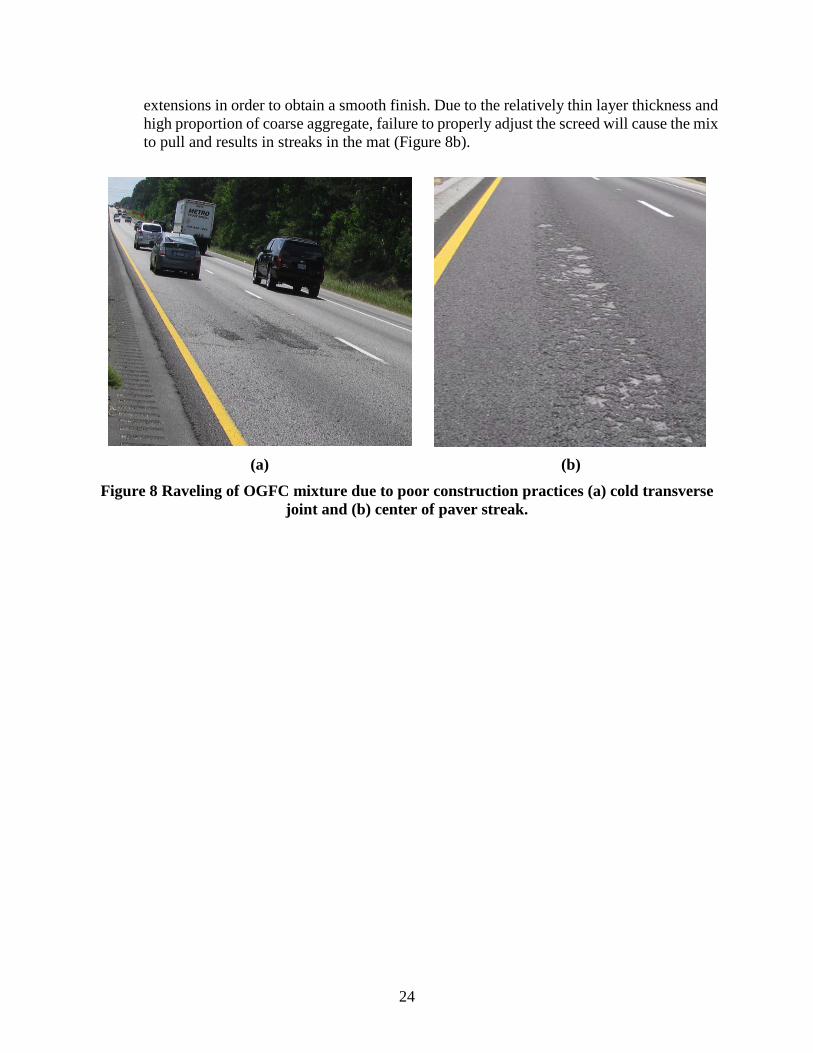
extensions in order to obtain a smooth finish. Due to the relatively thin layer thickness and high proportion of coarse aggregate, failure to properly adjust the screed will cause the mix to pull and results in streaks in the mat (Figure 8b).
(a) (b)
Figure 8 Raveling of OGFC mixture due to poor construction practices (a) cold transverse joint and (b) center of paver streak.

25
CHAPTER 2. OGFC FIELD CONSTRUCTION PROJECTS
INTRODUCTION
NDOT constructed two projects for evaluation during this research: one project each in northern and southern Nevada as shown in Figure 9. The northern Category-3 OGFC section was constructed in Elko on a two lane section of SR 535 which extends from I-80 eastward to Fifth Street (3.8 miles). The focus of the research testing for this project was from milepost 0.0-1.0 for the dense-graded control section and from 1.0-2.0 for the OGFC section. The southern Nevada project was built on Interstate 15 (I-15), a four lane roadway with divided median, east of Las Vegas. This project is a Category 1 project, but was selected for this research study because there were no Category-3 projects in southern Nevada available at the time this study was conducted. The project extends for 25 miles from 2.4 miles north of U.S. 93 to the Nevada/Arizona state line. The focus of the research was from milepost 85-89 in the northbound direction with the dense-graded mix being placed from milepost 86.8 to 87.6. From the magnified map shown in Figure 9, it is seen that the Elko OGFC mix was paved in an urban area, while the OGFC mix placed near Las Vegas was paved in a rural area.
Figure 9 Locations of identified construction projects.
Test Sections
Test Sections
Magnified
Magnified

26
CONSTRUCTION INFORMATION
In the Elko project, the existing asphalt concrete was milled 2 inches and then 2-inch dense-graded hot mix asphalt (DGHMA), Type 2, was placed as the surface for the control section. For the OGFC section, 2¾-inch existing asphalt concrete was milled, and then 2-inch DGHMA and ¾-inch OGFC mix was placed as the final riding surface. The dense-graded mix also contained 15% RAP which contributed 0.8% of the total binder. PG 64-28 NV virgin binder was added at a rate of 4.2% for a total binder content of 5.0%. The same binder at an optimum rate of 6.7% was used for OGFC. It is important to note that NDOT bases asphalt content on the total weight of aggregate instead of total weight of mix. Hydrated lime was used as an anti-stripping agent in both mixes to improve the resistance to moisture damage. The lime was added to the virgin aggregate in slurry form at a rate of 1.5% of the virgin aggregate rate. The treated aggregated is required to marinate for 48 hours before using in mix production. The aggregate gradations of the two SR 535 mixes are presented in Table 5. The unit cost of DGHMA was $70/ton, and the unit cost of OGFC was $130/ton. Figure 10 shows SR 535 OGFC construction.
Table 5 Aggregate gradations of DGHMA and OGFC mixes for the Elko project
Sieve Size DGHMA OGFC % Passing Spec. Range % Passing Spec. Range
1” 100 100 3/4” 91 90-100 1/2” 72 100 100 3/8” 64 63-85 97 95-100 No. 4 47 45-63 49 40-65 No. 10 31 30-44 No.16 18 12-22 No. 40 14 12-22 No.200 5 3-8 4 0-5

27
Figure 10 OGFC construction on SR 535.
In the I-15 project, 3-inch to 5-inch existing asphalt concrete was milled. The control section was resurfaced with 3-inch DGHMA, and the OGFC section was resurfaced with 3-inch plant mix DGHMA and ¾-inch OGFC. The I-15 project also incorporated 15% RAP in the dense-graded mix with a RAP binder contribution of 0.6%. PG 76-22NV binder was added at 3.2% for a total binder content of 3.8%. The same binder with a ratio of 5.7% of total aggregate was used for OGFC. Lime slurry was used as anti-strip for this project as well and was based on 1% of the coarse aggregate portion and 2% of the fine aggregate portion for a combined treatment rate of 1.29% for the dense mix and 1.7% for the OGFC mix. In both cases, the treated aggregate was required to marinate 48 hours before incorporating into plant mixture.
The aggregate gradations of these two I-15 mixes are shown in Table 6. The unit cost of DGHMA was $63.5/ton, and the unit cost of OGFC was $87/ton. As described, the cost of Elko OGFC mix is much higher than that of the Las Vegas mix. This is because the Elko OGFC mix had a higher binder content and higher transportation fees. Figure 11 shows OGFC construction on the I-15 project.

28
Table 6 Aggregate gradations of DGHMA and OGFC mixes for the I-15 project
Sieve Size DGHMA OGFC % Passing Spec. Range % Passing Spec. Range
1” 100 100 3/4” 91 88-95 1/2” 74 70-85 100 100 3/8” 68 60-78 93 90-100 No. 4 53 43-60 43 35-55 No. 10 36 30-44 No.16 7 5-18 No. 40 21 12-22
No.200 8 3-8 3 0-4
Figure 11 OGFC construction on I-15.

29
CHAPTER 3. LABORATORY TEST RESULTS
INTRODUCTION
The objective of this chapter was to evaluate the laboratory performance of the OGFC and DGHMA mixtures that were received from the identified field projects. The selected test methods included the Cantabro test, tensile strength ratio (TSR) test, and Hamburg wheel-track test (HWTT). The test methods and the corresponding results are detailed in the following sections.
CANTABRO TEST
The Cantabro test was used to determine the durability of an OGFC. The test method AASHTO TP 108-14, Standard Method of Test for Determining the Abrasion Loss of Asphalt Mixture Specimens was followed for this test. The Cantabro tests were performed on the three groups of OGFC mixtures, which were: (1) unconditioned mixtures; (2) long-term oven aged mixtures; and (3) vacuum saturated with one freeze/thaw cycle conditioned mixtures. The long-term oven aging procedure followed the AASHTO R30, Standard Practice for Mixture Conditioning of Hot Mix Asphalt. The vacuum saturation with one freeze/thaw cycle conditioning procedure followed AASHTO T283, Standard Method of Test for Resistance of Compacted Asphalt Mixtures to Moisture-Induced Damage. The OGFC specimens were individually placed in the Los Angeles Abrasion machine and were tested for 300 revolutions at a rate of 30 to 33 revolutions per minute. The loose material was discarded and the final specimen weight was recorded. The percent loss was calculated for each specimen according to Equation 1.
𝐶𝐶𝐶𝐶 = 𝐴𝐴−𝐵𝐵𝐴𝐴∗ 100 (1)
Where: CL = Cantabro Loss, % A = Initial weight of test specimen B = Final weight of test specimen
Figure 12 shows the Cantabro loss results of the two OGFC mixtures and DGHMA mixtures with various conditioning procedures: none, long-term aging per AASHTO R30, and vacuum-saturated with one freeze-thaw cycle. As shown in Figure 12, both Elko and Las Vegas OGFC mixtures had lower Cantabro loss values compared to the DGHMA mixtures. Both the long-term oven aging and freeze-thaw conditioning increased the Cantabro loss values of OGFC mixtures. Compared with the Las Vegas OGFC mixtures, the Elko OGFC mixtures had less Cantabro loss values no matter the conditioning of the mixtures. According to ASTM D7064, an acceptable amount of loss is less than 20% for unaged specimens and 30% for aged specimens. Therefore, both Elko and Las Vegas OGFC mixtures met the minimum requirements for the durability performance of asphalt mixtures.

30
Figure 12 Cantabro loss results for DGHMA and OGFC mixtures.
TENSILE STRENGTH RATIO
The tensile strength ratio (TSR) is defined as the ratio of the tensile strength of water conditioned specimens to the tensile strength of unconditioned specimens, which is shown in Equation 2.
𝑇𝑇𝑇𝑇𝑇𝑇 = 𝑆𝑆2𝑆𝑆1∗ 100 (2)
Where: S1 = the average tensile strength of unconditioned specimen S2 = the average tensile strength of conditioned specimen
The TSR test was conducted on each mix design and performed according to AASHTO T 283, Resistance of Compacted Bituminous Mixture to Moisture Induced Damage, with slight modifications to accommodate OGFC mixes. The modifications are recommended in the ASTM D7064 test procedure. The specimens were compacted to the design gyration level and height instead of the target height in the procedure of 95 mm. While this differed from the specification, the height of the specimens was included in the final calculations so this change was accounted for in the final results. The weight of the design specimens was altered slightly for these specimens to target a height of 110 to 115 mm in order to ensure that the specimens fit inside the breaking head. The specimens were saturated at 26 in Hg (660.4 mm Hg) below atmospheric pressure for 10 minutes and then the saturated specimens were frozen in plastic concrete cylinder molds. The specimens were kept submerged under water while freezing to keep the interior voids
9.5
5.9
3.1
6.0
15.0
13.3
6.9
12.9
0.0
2.0
4.0
6.0
8.0
10.0
12.0
14.0
16.0
None Long-TermOven
Aging perR30
None VacuumSaturatedand 1 F/T
None Long-TermOven
Aging perR30
None VacuumSaturatedand 1 F/T
Dense OGFC Dense OGFC
Elko, Nevada Las Vegas, Nevada
Avg
. Can
tabr
o Lo
ss, %

31
filled with water. Specimens were then conditioned in a hot water bath at 140°F for 24 hours and put in a 77°F water bath according to AASHTO T 283 prior to breaking. The specimens were tested for indirect tensile strength on a Marshall Stability press at a rate of 2 inches per minute. The tensile strength of the mixes was determined by using the peak load recorded on the device and the specimen dimensions.
Figure 13 presents the TSR test results for DGHMA and OGFC mixtures. It is shown that the OGFC mixtures had lower conditioned tensile strength and TSR than the DGHMA mixtures. Compared to the Elko OGFC mixtures, the Las Vegas OGFC mixtures had higher conditioned tensile strength. However, the TSR values between Elko and Las Vegas OGFC mixtures were comparable with each other. The ASTM D7064 standard suggests that the TSR should be at least 80% for OGFC mix. Accordingly, neither the Elko nor the Las Vegas OGFC mixtures met this requirement. Watson et al. (2018) developed a performance-based mix design for OGFC mixtures. They recommended that the TSR should be at least 70% for OGFC mix, meanwhile the conditioned tensile strength should be greater than 50 psi. Based on this criterion, both the Elko and the Las Vegas OGFC mixtures passed the requirement.
Figure 13 Tensile strength ratio test results for DGHMA and OGFC mixtures.
HAMBURG WHEEL TRACKING TEST
The Hamburg wheel tracking test (HWTT) determines the susceptibility of asphalt mixtures to stripping and rutting. All specimens were fabricated and tested according to AASHTO T 324, Hamburg Wheel-Track Testing of Compacted Hot Mix Asphalt (HMA). Six specimens were fabricated for each design so that statistical analysis could be performed on all of the mixtures. The specimens were subjected to a load of 158 ± 1 lbs. The specimens were
54.3
127.9
72.6
139.2
0.73
1.00
0.78
0.96
0
0.2
0.4
0.6
0.8
1
0
20
40
60
80
100
120
140
160
Elko-OGFC Elko-Dense LV-OGFC LV-DenseT
ensi
le S
tren
gth
Rat
io
Con
ditio
ned
Ten
sile
Str
engt
h (p
si)
Conditioned Tensile Strength Tensile Strength Ratio

32
submerged and conditioned in a 50°C water bath for 30 minutes prior to testing. The water bath maintained the 50°C temperature for the duration of the testing (20,000 passes). All data output of the linear variable differential transformer (LVDT) attached to each arm was recorded by a computer and analyzed to determine the stripping inflection point (SIP) and moisture susceptibility of the mix. The SIP of the mix was determined by incorporating tangents to the secondary and tertiary stages. The SIP is the number of loaded wheel passes where the tangents intersect. An example of calculating the SIP was shown in Figure 14.
There is currently no nationally accepted criterion for the maximum allowable rutting depth with the HWTT device. Watson et al. (2018) recommended the following criteria based on asphalt binder grade:
i. PG 64 or lower ≥ 10,000 passes before reaching 12.5 mm rut ii. PG 70 ≥ 15,000 passes before reaching 12.5 mm rut iii. PG 76 or higher ≥ 20,000 passes before reaching 12.5 mm rut
Figure 14 Determination of stripping inflection point from HWTT.
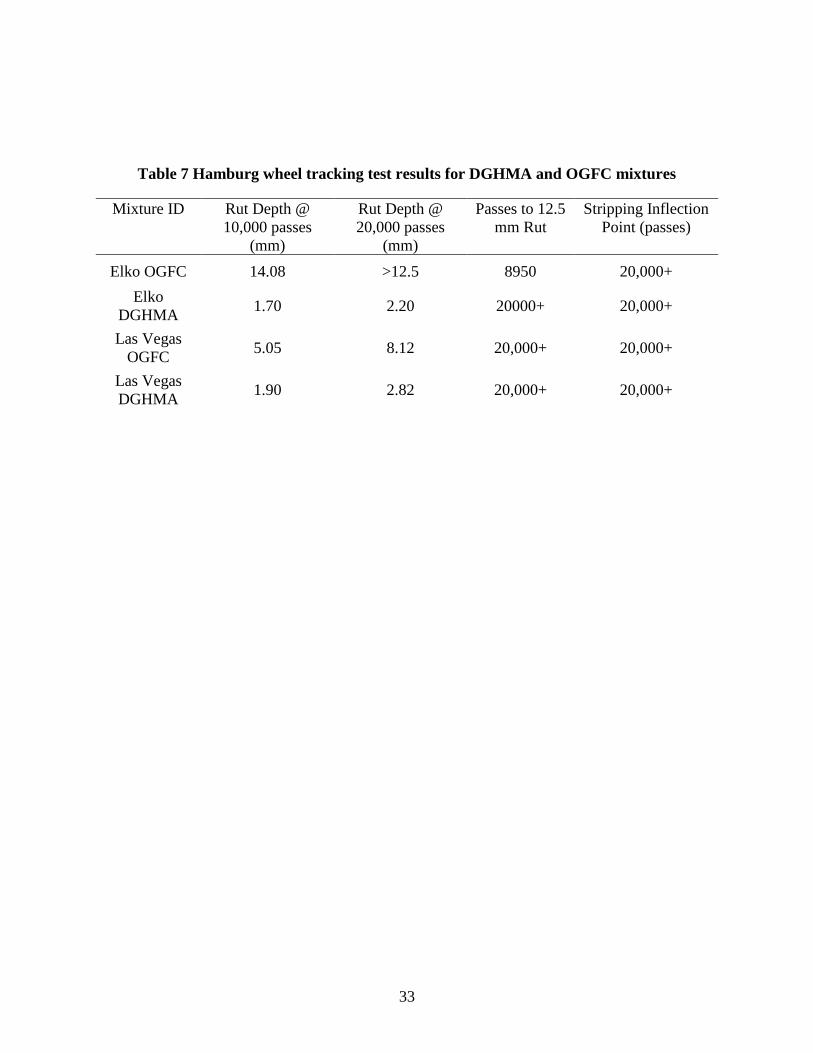
As mentioned in Chapter 2, the Elko project used PG 64-28 NV asphalt binder, while the Las Vegas project used the PG 76-22 NV asphalt binder. According to Watson (2018), the Elko mixtures should have more than 10,000 passes prior to reaching 12.5 mm rut, while the Las Vegas mixtures should have more than 20,000 passes before reaching 12.5 mm rut. Table 7 shows the HWTT results for the Elko and Las Vegas asphalt mixtures. It is indicated that most of the asphalt mixtures passed the requirements except the Elko OGFC mixture. It is also shown that the Elko DGHMA mixture had less rut depth than the Las Vegas DGHMA mixture. This indicated that the Elko DGHMA mixture had a higher rutting resistance and less moisture susceptibility.
33
Table 7 Hamburg wheel tracking test results for DGHMA and OGFC mixtures
Mixture ID Rut Depth @ 10,000 passes
(mm)
Rut Depth @ 20,000 passes
(mm)
Passes to 12.5 mm Rut
Stripping Inflection Point (passes)
Elko OGFC 14.08 >12.5 8950 20,000+ Elko
DGHMA 1.70 2.20 20000+ 20,000+
Las Vegas OGFC 5.05 8.12 20,000+ 20,000+
Las Vegas DGHMA 1.90 2.82 20,000+ 20,000+

34
CHAPTER 4. FIELD PERFORMANCE TEST RESULTS
INTRODUCTION
The objective of this chapter was to evaluate the field performance of the OGFC and DGHMA mixes, which included permeability, friction, texture, and noise. The selected test methods included the NCAT falling head permeameter test, locked-wheel skid trailer test, Circular Texture Meter (CTM), and On-Board Sound Intensity (OBSI) test. The test methods and the corresponding results are detailed in the following sections.
FIELD PERMEABILITY TEST
The NCAT Field Permeameter is a falling head permeameter that uses Darcy’s Law to determine the rate of water flow through asphalt pavement. In the field, a clean, representative spot is selected to place the permeameter. A wax ring is placed at the base of the permeameter to prevent water leakage. Water is poured inside the tube and allowed to flow for a few minutes to saturate the pavement. Equation 3 was used to determine the field permeability.
𝑘𝑘 = 𝑎𝑎𝑎𝑎
𝐴𝐴𝐴𝐴𝑙𝑙𝑙𝑙 �ℎ1
ℎ2� (3)
Where: k = coefficient of permeability (cm/s) a = inside cross-sectional area of the standpipe (cm2) L = lift thickness of asphalt mixture A = base area of the permeameter (cm2) t = elapsed time between h1 and h2 (s) h1 = initial head (cm) h2 = final head (cm)
Figure 15 presents the field permeability values of the DGHMA and OGFC pavement sections at different service times. The measurements in February 2015 represented the initial permeability of pavement sections. The measurements in March 2016 and March 2017 reflected the permeability of pavement sections after 1- and 2-years service, respectively. As shown in Figure 15 both the Elko and Las Vegas OGFC sections had much greater initial permeability values than the DGHMA sections. This was because the OGFC mixture had a higher interconnected air void content that was effective in channeling the water to the underlying lifts. For the Elko sections, the permeability of OGFC reduced dramatically after 1-year service, and became comparable to that of DGHMA section after 2-years of service. For the Las Vegas sections, the OGFC pavement still exhibited a satisfactory permeable function after 2-years of service. The Elko sections were located in a town area with low speed limits and frequent stops, while the Las Vegas sections were located on an interstate highway with high speed limits and continuously moving traffic. This infers that the low speed limit and frequent stops were prone to clog the interconnected air voids of OGFC, which thereby diminished the permeability of the OGFC pavements.

35
(a) Elko Sections
(b) Las Vegas Sections
Figure 15 Field permeability test results of (a) Elko and (b) Las Vegas sections.
0
500
1000
1500
2000
2500
3000
3500
Perm
eabi
lity,
x10
-5cm
/s
2/15 3/16 3/17
SR 535 Dense
SR 535 OGFC
Time of Measurement
0
2000
4000
6000
8000
10000
12000
14000
Perm
eabi
lity,
x10
-5cm
/s
2/15 3/16 3/17
I-15 Dense
I-15 OGFC
Time of Measurement

36
FIELD FRICTION TEST
The locked-wheel skid trailer measures the steady-state friction force on a locked test wheel as it is dragged under a constant load and at a constant speed over a wet pavement surface. In this test, water is sprayed on the pavement surface to simulate wet conditions. The test procedures are documented in ASTM E274. The skid number (SN) is used to characterize the friction of pavement surface, which is determined from the resulting force or torque. A higher SN indicates greater frictional resistance.
Figure 16 shows the friction test results of OGFC and DGHMA pavements in Elko and Las Vegas. For the Elko sections, the OGFC pavement had a lower skid number than the DGHMA pavement at the beginning of service, but had a comparable skid number to the DGHMA pavement after 1.5-year service. For the Las Vegas sections, the OGFC pavement showed higher skid numbers than the DGHMA pavement within 1.5-year service. However, this difference reduced with the increase of service time.
(a) Elko Sections
y = -1.0778x + 51.389OGFC R² = 0.031
y = -3.0778x + 58.167Dense R² = 0.1914
30
35
40
45
50
55
60
65
70
0 1 2 3 4 5
SN
Time of Measurement
OGFC Dense
11/14 8/15 1/16 6/16

37
(b) Las Vegas Sections
Figure 16 Surface friction test results of (a) Elko and (b) Las Vegas sections.
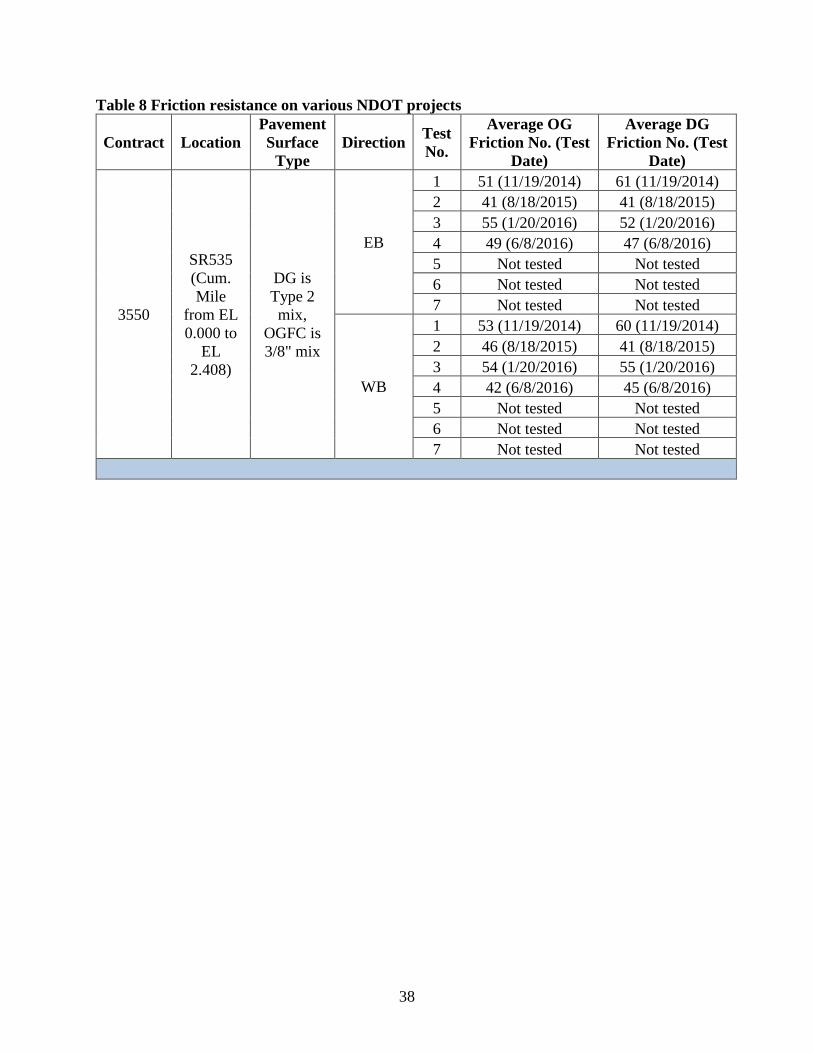
For comparison, NDOT conducted friction tests on a variety of other projects involving both OGFC and dense-graded mixtures. A summary of those results is provided in Table 8.
y = 0.0406x + 32.531OGFC R² = 0.0005
y = 1.35x + 20.375Dense R² = 0.2014
05
101520253035404550
0 1 2 3 4 5 6
SN
Time of Measurement
OGFC Dense
2/15 8/15 1/16 6/16 11/17
38
Table 8 Friction resistance on various NDOT projects
Contract Location Pavement Surface
Type Direction Test
No.
Average OG Friction No. (Test
Date)
Average DG Friction No. (Test
Date)
3550
SR535 (Cum. Mile
from EL 0.000 to
EL 2.408)
DG is Type 2 mix,
OGFC is 3/8" mix
EB
1 51 (11/19/2014) 61 (11/19/2014) 2 41 (8/18/2015) 41 (8/18/2015) 3 55 (1/20/2016) 52 (1/20/2016) 4 49 (6/8/2016) 47 (6/8/2016) 5 Not tested Not tested 6 Not tested Not tested 7 Not tested Not tested
WB
1 53 (11/19/2014) 60 (11/19/2014) 2 46 (8/18/2015) 41 (8/18/2015) 3 54 (1/20/2016) 55 (1/20/2016) 4 42 (6/8/2016) 45 (6/8/2016) 5 Not tested Not tested 6 Not tested Not tested 7 Not tested Not tested

39
Table 8 Friction resistance on various NDOT projects
Contract Location Pavement Surface
Type Direction Test
No.
Average OG Friction No. (Test Date)
Average DG Friction No. (Test Date)
3561
US050 (Cum. Mile
from CC 14.761 to LY 2.597)
DG is Type 2 mix,
OGFC is 3/8" mix
EB
1 44 (11/04/2014) 58 (10/01/2014) 2 36 (7/23/2015) 3 53 (1/28/2016) 4 54 (7/21/2016) 5 49 (12/13/2016) 6 46 (7/25/2017) 7 56 (12/07/2017)
WB
1 44 (11/04/2014) 55 (10/01/2014) 2 36 (7/23/2015) 3 53 (1/28/2016) 4 54 (7/21/2016) 5 48 (12/13/2016) 6 50 (7/25/2017) 7 57 (12/07/2017)
3564
SR207 (Cum. Mile
from DO 0.000 to DO
3.760)
DG is Type 2 mix.
EB
1 No OGFC surface 66 (11/4/2014) 2 43 (7/23/2015) 3 52 (1/28/2016) 4 42 (7/27/2016) 5 Not tested 6 46 (7/26/2017) 7 48 (12/07/2017)
WB
1 No OGFC surface 62 (11/4/2014) 2 45 (7/23/2015) 3 49 (1/28/2016) 4 45 (7/27/2016) 5 Not tested 6 45 (7/26/2017) 7 49 (12/07/2017)

40
Table 8 Friction resistance on various NDOT projects
Contract Location Pavement Surface
Type Direction Test
No.
Average OG Friction No. (Test Date)
Average DG Friction No. (Test Date)
3558
SR431 (Cum. Mile from WA
8.130 to WA 24.413)
DG is Type 2 mix,
OGFC is 3/8" mix
EB
1 41 (3/11/2015) 59 (Oct 01, 2014) 2 45 (7/28/2015) 3 42(1/28/2016) 4 54 (7/21/2016) 5 55 (12/12/2016) 6 57 (07/26/2017) 7 60 (12/07/2017)
WB
1 42 (3/11/2015) 62 (10/01/2014) 2 46 (7/28/2015) 3 42(1/28/2016) 4 52 (7/21/2016) 5 56 (12/12/2016) 6 57 (07/26/2017) 7 62 (12/07/2017)
3546
IR015 (Cum. Mile from CL 85.0 to CL 89.0)
DG is Type 2C mix, OGFC is 1/2" mix
NB
1 33 (2/10/2015) 19 (2/10/2015) 2 32 (8/18/2015) 27 (8/18/2015) 3 32 (1/20/2016) 24 (1/20/2016) 4 33 (6/8/2016) 25 (6/8/2016) 5 Not tested Not tested 6 Not tested Not tested 7 40 (11/09/2017) 31 (11/9/2017)
3533
IR080 (Cum. Mile from EU 15.736
to EU 25.704)
DG is Type 2C mix, OGFC is 3/8" mix
EB 1 53 45
WB 1 53 44
3524
IR080 (Cum. Mile from
HU 0.112 to HU 12.011)
DG is Type 2C mix, OGFC is 3/8" mix
EB 1 50 53
WB 1 51 52

41
SURFACE TEXTURE TEST
The Circular Texture Meter (CTM) is a texture measuring device equipped with a Charged Couple Device laser displacement sensor mounted on an arm above the surface. According to ASTM E2157, the CTM measures the profile of a circle that is 284 mm in diameter or 892 mm in circumference. The profile is divided into eight segments of 111.5 mm. The mean profile depth (MPD) of each segment or arc of the circle is calculated according to ASTM E1845.
Figure 17 presents the measured surface texture results of DGHMA and OGFC sections at different times. It is shown that the OGFC surface had consistently higher MPD values than the DGHMA surface in the Las Vegas sections, but had comparable MPD values to the DGHMA surface in the Elko sections. The existing studies found that the pavement surface with a greater MPD value generally has a higher skid number. Thus, the surface texture results were in good agreement with the surface friction results.
Figure 17 Surface texture results of Elko and Las Vegas sections.
TIRE-PAVEMENT NOISE TEST
The on-board sound intensity (OBSI) is used to measure noise levels at the tire/pavement interface. The sound intensity probe consists of two microphones with 12.5 mm diameter and preamplifiers in a side-by-side configuration spaced 16 mm apart and protected with a custom foam windscreen. The sound intensity is measured at 100 mm away from the plane of the tire sidewall, 70-80 mm away from the pavement surface, and opposite the leading and trailing edges of the tire/pavement contact. Because of the nature of sound intensity, there is no need for an acoustical chamber. Thus, the equipment can be mounted on the wheel of a passenger car.
Figure 18 presents the sound intensity results of OGFC and DGHMA sections in Elko and Las Vegas. At the beginning, both OGFC sections exhibited a noise reduction benefit when compared to the DGHMA sections. For the Elko sections, the reduction of sound intensity for
0
0.2
0.4
0.6
0.8
1
1.2
1.4
Elko Dense Elko OGFC LV Dense LV OGFC
Mea
n Pr
ofile
Dep
th (m
m)
2015
2016
2017

42
OGFC significantly reduced with the increasing service time. After 32-months service time, the OGFC section showed a similar sound intensity level to the DGHMA section. For the Las Vegas sections, the OGFC pavement consistently showed a noise reduction by approximately 2dB(A) within the 32-month service time.
When the final OBSI testing was performed in September, 2017 it was requested by NDOT that a recently placed OGFC section on US 93 near McGill, NV (Milepost 66.99 to 76.34 in White Pine County) be tested for information purposes. That project averaged 97.7 dB(A) which is similar to the I-15 results after construction.
Figure 18 Sound intensity results of Elko and Las Vegas sections.
92.0
94.0
96.0
98.0
100.0
102.0
0 5 10 15 20 25 30 35
Ave
rage
Sou
nd In
tens
ity d
B(A
)
Service Time (Months)Elko Dense Elko OGFC Las Vegas Dense Las Vegas OGFC

43
CHAPTER 5. COST-BENEFIT ANALYSIS OF OGFC PROJECTS
INTRODUCTION
The cost-benefit analysis was conducted on the identified OGFC projects and the corresponding DGHMA projects. To unify the analysis, both OGFC pavements and DGHMA pavements were assumed to be 1.0 mile long. The cost-benefit of OGFC pavement was analyzed by investigating the initial construction and maintenance costs, the durability, and the functionality, such as permeability, friction, and tire/pavement noise. Compared to DGHMA pavements, the OGFC pavements have the following advantages and disadvantages:
• Advantages: significantly improves pavement permeability, enhances pavement friction, and reduces tire/pavement noise.
• Disadvantages: increased initial construction cost, increased maintenance cost, and reduced serviceable life.
To conduct the economic analysis, these advantages and disadvantages were monetized as follows.
• Increasing initial construction cost is due to the increased material cost; • Increasing maintenance cost is attributed to the increased road salt usage; • Reduced serviceable life is equivalent to the decreased salvage value of existing
pavement; • Improved pavement permeability raises the driver visibility and reduces the hydroplaning
in wet-weather condition, which decreases the accident rate and cost; • Enhanced surface friction also reduces the accident rate and cost; and • Reduced tire/pavement noise raises the value of houses that are near the highway and
saves on the costs of noise barriers.
It has been noted that OGFC pavement also improves the quality of storm water runoff, but it was not assessed in this study. In addition, the permeability improvement enhanced the ride quality especially in the wet-weather condition, but the improvement of ride quality was difficult to assess monetarily. Therefore, this study considered the increase of ride quality (quantified by the increase of permeability) as an additional benefit for OGFC pavements. Figure 19 illustrates the factors considered in the cost-benefit analysis, which are elaborated in the following sections.

44
Figure 19 Illustration of cost-benefit analysis for OGFC pavements.
INITIAL CONSTRUCTION COST
The cost-benefit analysis only considered differential costs or benefits between pavement alternatives. In regard to the initial construction cost, the major difference between OGFC and DGHMA pavements was that OGFC mix had a higher material price than DGHMA mix due to higher asphalt contents. Thus, this study only took into account the material cost, which was calculated by Equations 4 and 5.
Initial Construction Cost = Material Unit Price × Weight of Material (4)
Weight of Material = Section Length × Section Width × Layer Thickness × Density (5) The detailed calculation of initial construction cost is presented in Table 99.

45
Table 8 Calculation of initial construction cost
Project Name Material Unit Price ($/ton)
Section Length (mile)
Section Width (ft)
Layer Thickness (inch)
Density (lb/ft3)
Initial Construction Cost ($)
Elko DGHMA 70 1 24 0.75 143.5 39,553
Elko OGFC 130 1 24 0.75 130.7 66,906
Las Vegas DGHMA 63.5 1 24 0.75 154.1 38,518
Las Vegas OGFC 87 1 24 0.75 126.9 43,471

46
MAINTENANCE COST
The maintenance of OGFC pavement usually includes the general maintenance and winter maintenance. The general maintenance focuses on recovering the permeability of the OGFC layer, which utilizes water washing or vacuum cleaning methods to remove debris from clogged pores. The winter maintenance is to apply the liquid chemicals or road salt to melt the ice and snow on the surface and interior of OGFC pavement. In the United States, the general maintenance is not conducted on a routine basis, but the winter maintenance is mandatory if the OGFC pavement has snow or ice on the surface. For the Elko sections, the pavements usually have snow or ice in winter, but for the Las Vegas sections, no snow or ice is expected. Thus, this study only considered the winter maintenance cost for the OGFC and DGHMA pavements in Elko.
Regarding the chemical deicers, salt (sodium chloride) is very effective when the temperature is above 25°F, fairly effective when temperature is between 25°F and 15°F, and marginally effective when temperature is between 10°F and 15°F. In Elko, the average minimum temperature is 15°F. While in Las Vegas, the average minimum temperature is 39°F. Therefore, salt is only applicable for deicing the OGFC and DGHMA sections in Elko. NDOT recommends the optimum application rate of salt for winter maintenance is 300 pounds per lane mile for DGHMA. Generally, the salt usage for OGFC pavement is higher than that for DGHMA pavement by 20 to 30 percent. This study assumed that the salt application rate is 375 pounds per lane mile for OGFC pavement. The details of the calculation of winter maintenance costs are presented in Table 10.

47
Table 9 Calculation of Winter Maintenance Cost
Project Name1 Salt Unit Price ($/ton)
Section Length (mile)
Number of Traffic Lanes
Salt Application Rate (ton/lane mile)
Maintenance Frequency Per
Year
Maintenance Cost Per Year ($)
Elko DGHMA 41.72 1 2 300 30 375
Elko OGFC 41.72 1 2 375 30 469
1 No winter maintenance activity was needed for pavements in the Las Vegas sections.


49
SALVAGE VALUE
Salvage value represents the expected worth of a pavement alternative at the end of the analysis period. It is comprised of two components: serviceable life and residual value. Serviceable life represents the value of the remaining life of a pavement alternative at the end of the analysis period. A recent survey showed that the service life of DGHMA pavements in Nevada is usually 10 years, while that of OGFC pavement in Nevada is only 7 years (Jackson et al. 2008). Thus, this study assumed the service lives of OGFC and DGHMA pavements to be 7 and 10 years, respectively. For the sake of simplicity, the analysis period was assigned as 7 years, which excluded the rehabilitation activity from the analysis. Note that this study did not take into account the influence of mix design on pavement service life, although an appropriate mix design could significantly extend the service life of OGFC pavement. Residual value is defined as the asset value of in-place materials of a pavement alternative at the end of the service life. Until now, no studies have been found to investigate the differential asset values between OGFC and DGHMA pavements. Therefore, the residual value was not taken into account by this study. The salvage value is calculated using Equation 6.
𝑇𝑇𝑆𝑆𝑙𝑙𝑆𝑆𝑆𝑆𝑆𝑆𝑆𝑆 𝑉𝑉𝑆𝑆𝑙𝑙𝑉𝑉𝑆𝑆 = 𝐶𝐶𝑎𝑎𝑎𝑎𝐿𝐿𝐴𝐴 𝐴𝐴𝐴𝐴𝐴𝐴𝐴𝐴𝐴𝐴𝐴𝐴𝐴𝐴𝐴𝐴 × 𝑁𝑁𝑅𝑅𝑅𝑅
𝑁𝑁𝑆𝑆𝑅𝑅 (6)
where 𝐶𝐶𝑎𝑎𝑎𝑎𝐿𝐿𝐴𝐴 𝐴𝐴𝐴𝐴𝐴𝐴𝐴𝐴𝐴𝐴𝐴𝐴𝐴𝐴𝐴𝐴 is the cost of last rehabilitation or reconstruction activity, herein it refers to the initial construction cost; 𝑁𝑁𝑅𝑅𝑎𝑎 is the remaining service life of pavement alternative; and 𝑁𝑁𝑆𝑆𝑎𝑎 is the total service life of pavement alternative. Table 11 shows the salvage values of the identified OGFC and DGHMA pavements.
Table 10 Salvage values of OGFC and DGHMA pavements
Project Name Initial Construction Cost ($) NSL (Years)
NRL (Years)
Salvage Value ($)
Elko DGHMA 39,553 10 3 11,866 Elko OGFC 66,906 7 0 0 Las Vegas DGHMA 38,518 10 3 11,555
Las Vegas OGFC 43,471 7 0 0
SAFETY-RELATED BENEFIT
OGFC is typically applied to improve driving safety by means of increasing pavement surface friction and reducing the hydroplaning of vehicles in wet-weather conditions. There are numerous studies investigating the safety improvement by OGFC treatment. For example, Shimeno and Tanaka (2010) reported that OGFC reduced the wet weather fatality accident rate from 3.9 percent to 1.1 percent in Japan. Kabir et al. (2012) compared the accident rates of four

50
pavement sections before and after OGFC treatment in Louisiana. They concluded that the OGFC treatment was effective in reducing the fatalities and total accidents regardless of the weather conditions. Chen et al. (2017) assessed the effect of OGFC treatment on accident rate reduction of 12 pavement sections in Tennessee. They found that the OGFC is significantly effective in reducing the accident rate in wet weather conditions.
Buddhavarapu et al. (2015) analyzed the accident data of 43 OGFC pavements and 83 non-OGFC pavements in Texas. Based on their statistical analysis, the hypothesis that OGFC is effective in reducing wet weather crashes was not accepted. They claimed that the road user usually drives faster on OGFC surfaced pavements, which might result in a higher accident rate as compared to the non-OGFC pavements.
Due to the inconclusiveness of these safety studies, Lyon et al. (2018) conducted a large-scale study to quantify the safety effect of OGFC treatment. They collected the accident data of the OGFC and non-OGFC pavements from California, Minnesota, North Carolina and Pennsylvania, and estimated the crash modification factors (CMFs) for OGFC treatment, which are presented in Table 12. Herein, the CMF refers to the ratio of expected number of crashes after treatment to that before treatment. A CMF less than 1.0 indicates that the treatment reduces the number of crashes on that pavement site. As shown in Table 12 the OGFC treatment was only effective in decreasing the accident rate in wet-conditions of the freeway, but meanwhile increased the accident rate in dry-conditions of roads. In summary, the OGFC treatment only reduced the total accident rate on freeways. In this study, the Las Vegas sections were classified as freeway, and the Elko sections were considered as multilane road. Thus, the OGFC pavement on the Las Vegas section reduced the accident rate by 5.5 percent, while the OGFC pavement on the Elko section increased the accident rate by 9.2 percent.
Table 11 Estimation of Crash Modification Factors for OGFC treatment (Lyon et al. 2018)
Group Miles Estimated CMF Total Wet-Condition Dry-Condition
Freeway 165 0.945 0.668 1.008
Multilane 61 1.092 0.981 1.108
For the conventional pavement, the accident cost was calculated by, 3
1acc f f h h d d
iC C p C p C p
=
= + +∑ (7)
where accC is the total accident cost per year (dollars/year), fC is the unit cost of a fatal accident per crash (dollars), hC is the unit cost of an injury accident per crash (dollars), dC is the unit cost of a property damage accident per crash (dollars), and fp , hp , and dp are the number of fatal accidents, injury accidents, and property damage accidents, respectively. Table 13 lists the unit costs of these accident types (i.e., values of fC , hC , and dC ), which were converted from the data source in Ozbay et al. (2001) to year 2017 using the discount rate of 4 percent.

51
Table 12 Unit costs of various accident types (Ozbay et al., 2001)
Accident Type Cost Per Crash (Dollars)
Fatality 8,013,577 Injury 281,065
Property Damage 13,213
The expected number of accidents per year (i.e., values of fp , hp , and dp ) were estimated using Equation 8.
321p M Qααα= (8)
where M is the length of roadway, Q is the annual average daily traffic, and 1α , 2α , and 3α are model coefficients that are shown in Table 14. In this study, the roadway length was assumed as 1.0 mile for all the sections. The annual average daily traffic was 3700 for the Elko sections, and 41600 for the Las Vegas sections. The safety-related savings or costs for OGFC pavements are presented in Table 15 Safety-related savings (or costs) for OGFC pavementsTable 15.
Table 13 Model coefficients for estimation of expected number of accidents per year
Pavement Section Coefficient Accident Type Fatality Injury Property damage
Elko α1 4.15E-05 5.95E-09 4.70E-07 α2 8.95E-01 7.37E-01 4.59E-01 α3 7.36E-01 2.51E+00 2.19E+00
Las Vegas α1 7.79E-05 3.11E-10 3.23E-05 α2 3.32E-01 9.77E-01 9.04E-01 α3 8.07E-01 2.10E+00 1.09E+00
Table 14 Safety-related savings (or costs) for OGFC pavements
Project Name Safety-related Savings Per Year (Dollars)
Las Vegas Section 2,084 Elko Section -1,8861
1 Negative value represented the safety-related costs for OGFC pavement.

52
NOISE-RELATED BENEFIT
Noise reduction is another well-recognized benefit for OGFC pavement. This study related the tire/pavement noise to the affected house value of nearby residents. For the same house, generally, the higher outside noise represents a lower selling value. The noise depreciation sensitivity index (NDSI) is usually used to calculate the noise costs, which is defined as the ratio of the percentage reduction in the house value and the change in the noise level. There are many studies estimating the local NDSI values, which were presented in Table 16. Table 15 NDSI values from existing studies
Existing Study Location NSDI (%)
Vaughan and Huckins (1975) USA 0.65 Holsman and Bradley (1982) Australia 0.7-1.8
Itenand Maggi (1990) Switherland 0.9 Nelson (2004) USA 0.51-0.67
Blanco and Flindell (2011) UK 1.15-4.50 Andersson et al. (2013) Sweden 1.35-2.90
Szczepanska et al. (2015) Poland 0.7-0.94
As shown in Table 16 the NDSI value varied from region to region. Overall, this value slightly increased with time. In this study, the NDSI value was assigned as 0.8% for both Las Vegas and Elko sections. Accordingly, the noise cost was calculated by,
Cos h avgNoise t N L NDSI W= ×∆ × × (9)
where hN is the number of houses affected by noise that was calculated by multiplying the average residential density by the tire/pavement noise affected area, L∆ is the change of noise due to OGFC, and avgW is the average of house value. The detailed calculation of noise cost is shown in Table 17.

53
Table 16 Calculation of noise costs for OGFC pavements
Model Parameters Identified Projects
Elko OGFC Las Vegas OGFC
Residential Density (number of houses per square mile) 417.3 110.5 Noise Affected Area (square mile) 0.03 0.03
Change of Noise, ΔL (dB)1 0.9 2.1 NDSI (%) 0.8 0.8
Average House Value, Wavg ($) 223,100 216,500 Noise Costs ($) 20,110 12,057
1 Change of noise between OGFC and DGHMA pavements was an average value in the analysis period. NET PRESENT VALUE OF COSTS OF IDENTIFIED PAVEMENTS
To enable a fair comparison among competing pavement alternatives, all future anticipated costs, such as maintenance and rehabilitation costs and user costs, are first “discounted” to the present to take into account the time value of money. If an alternative has any value remaining at the end of the analysis period, a salvage value is also discounted back to its present value. The net present value (NPV) of initial construction and discounted future costs and salvage value is then determined for each alternative using the common economics formula shown in Equation 10. Finally, the alternative with the lowest NPV of life cycle costs calculated by Equation 10 is considered to be the most economical choice.
𝑁𝑁𝑁𝑁𝑉𝑉 𝑜𝑜𝑜𝑜 𝐶𝐶𝐿𝐿𝑜𝑜𝑆𝑆 𝐶𝐶𝐶𝐶𝐶𝐶𝑙𝑙𝑆𝑆 𝐶𝐶𝑜𝑜𝐶𝐶𝐶𝐶𝐶𝐶 = 𝐼𝐼𝑙𝑙𝐿𝐿𝐶𝐶𝐿𝐿𝑆𝑆𝑙𝑙 𝐶𝐶𝑜𝑜𝑙𝑙𝐶𝐶𝐶𝐶.𝐶𝐶𝑜𝑜𝐶𝐶𝐶𝐶 + ∑ 𝑀𝑀𝑆𝑆𝐿𝐿𝑙𝑙𝐶𝐶𝑆𝑆𝑙𝑙𝑆𝑆𝑙𝑙𝐶𝐶𝑆𝑆 𝐶𝐶𝑜𝑜𝐶𝐶𝐶𝐶𝑘𝑘 �1
(1+𝐴𝐴)𝑛𝑛𝑘𝑘�𝑁𝑁
𝑘𝑘=1 −
𝑇𝑇𝑆𝑆𝑙𝑙𝑆𝑆𝑆𝑆𝑆𝑆𝑆𝑆 𝑉𝑉𝑆𝑆𝑙𝑙𝑉𝑉𝑆𝑆 � 1(1+𝐴𝐴)𝑛𝑛𝑒𝑒
� − ∑ 𝑇𝑇𝑆𝑆𝑜𝑜𝑆𝑆𝐶𝐶𝐶𝐶 𝐵𝐵𝑆𝑆𝑙𝑙𝑆𝑆𝑜𝑜𝐿𝐿𝐶𝐶𝑘𝑘 �1
(1+𝐴𝐴)𝑛𝑛𝑘𝑘� −𝑁𝑁
𝑘𝑘=1
𝑁𝑁𝑜𝑜𝐿𝐿𝐶𝐶𝑆𝑆 𝑟𝑟𝑆𝑆𝑙𝑙𝑆𝑆𝐶𝐶𝑆𝑆𝑟𝑟 𝐵𝐵𝑆𝑆𝑙𝑙𝑆𝑆𝑜𝑜𝐿𝐿𝐶𝐶 � 1(1+𝐴𝐴)𝑛𝑛𝑒𝑒
� (10) where i is the discount rate (4% used in this study), and N is the analysis period (7 years used in this study).

54
Table 18 summarizes the monetary items of identified OGFC and DGHMA pavements, and their calculated NPVs. The values shown as maintenance costs per year are used in Equation 10 to calculate the NPV of life cycle costs. The present value of life cycle costs of the OGFC section in Elko was 86 percent higher than the DGHMA section, while the present value of life cycle costs of the OGFC section in Las Vegas was 36 percent lower than that of DGHMA section. This indicates that the implementation of OGFC is cost-effective in rural highways while the use of OGFC in a town area significantly increased the life cycle cost of pavement.
Table 17 Calculation of NPVs for identified OGFC and DGHMA pavement costs
Monetary Item Elko Sections Las Vegas Sections
OGFC DGHMA OGFC DGHMA
Initial construction cost ($) 66,906 39,553 43,471 38,518 Maintenance cost ($/year) 469 375 0 0
Salvage value ($) 0 11,866 0 11,555 Safety benefits ($) -1,886 0 2,084 0 Noise benefits ($) 20,110 0 12,057 0
NPV of life cycle costs ($) 60,933 32,790 18,905 29,737 NPV of costs per lane mile
($/mile) 30,466 16,395 9,453 14,868

55
CONCLUSIONS
This project identified two OGFC projects and two DGHMA projects (i.e., control projects) from Nevada. A Category-3 roadway in Elko and Category-1 roadway near Las Vegas were analyzed to determine the benefits of OGFC pavements. Specifically, the laboratory tests were conducted to comprehensively assess the durability, cracking, rutting and moisture-susceptibility of OGFC and DGHMA mixtures. The field performance tests were performed to evaluate the functional characteristics of OGFC and DGHMA pavements, including the permeability, friction, texture, and tire-pavement noise over time. This project summarizes the advantages and disadvantages of OGFC, and these advantages and disadvantages were monetized for cost-benefit analysis. The major findings of this project are summarized as follows.
• The Cantabro test results indicated that both Elko and Las Vegas OGFC mixtures met the minimum requirements for the durability performance of asphalt mixtures. Compared to the Las Vegas OGFC mixtures, the Elko OGFC mixtures had less Cantabro loss values regardless of the conditioning the mixtures experienced.
• The TSR test results showed that both the Elko and Las Vegas OGFC mixtures passed the recommended TSR criteria of a minimum 70% TSR. Compared to the Elko OGFC mixtures, the Las Vegas OGFC mixtures have higher conditioned tensile strength. This may be attributed to the higher grade modified binder used in the Las Vegas project (PG 76-22) compared to the PG 64-28 used in the Elko project.
• The HWTT results demonstrated that the Las Vegas OGFC mixture passed the HWTT requirement, but Elko OGFC mixture failed to satisfy the criteria.
• The field performance results demonstrated that the Las Vegas OGFC pavement exhibited benefits in permeability, friction, and noise reduction compared to the DGHMA pavement, while the Elko OGFC pavement showed comparable performance with the DGHMA pavement after 2-years of service.
• A cost-benefit analysis conducted on the identified OGFC and DGHMA projects shows the OGFC pavement in Las Vegas reduced the net present value of life cycle costs by 36%, while the OGFC pavement in Elko increased the net present life cycle cost value by 86%. This indicates that the implementation of OGFC is cost-effective in rural highways, but impractical in urban or town areas.
Limitations This project had several limitations that prevented the analysis from being as thorough as planned. There was not a Category-3 OGFC project in the southern part of the state at the time research began, so a Category-1 project was selected by NDOT instead. During the course of the project, the friction trailer needed repairs and resulted in some of the data not being available for the time increments scheduled. Finally, the Elko section was covered with a chip seal in 2017 due to cracking concerns so that final field testing could not be conducted. Future Research There is a need to develop an OGFC mix design procedure for NDOT that addresses the distresses such as raveling, cracking, and stripping observed in the performance of OGFC. The
56
design procedure should include a method of optimizing the combined aggregate gradation to obtain best performance in regard to resistance to raveling, minimum permeability, and noise reduction. There is a need to evaluate the effect of the two different asphalt PG binders of these two projects because the northern part of the state may benefit from the modified binder used in the southern part of the state.
This research was performed in cooperation with the Nevada Department of Transportation (NDOT) and the Federal Highway Administration (FHWA). The contents of this report reflect the views of the authors, who are responsible for the facts and the accuracy of the data presented herein. The contents do not necessarily reflect the official view or policies of the FHWA or NDOT. This report does not constitute a standard, specification, or regulation.

57
REFERENCES
Alvarez, A., Martin, E., Estakhri, C., Button, J., Glover, C., and Jung, S. (2006). Synthesis of Current Practice on the Design, Construction, and Maintenance of Porous Friction Courses. Report No. FHWA/TX-06/0-5262-1. Texas Department of Transportation, Austin, Texas, 86pp.
Alvarez, A., Martin, A., and Estakhri, C. (2011). A Review of Mix Design and Evaluation Research for Permeable Friction Course Mixtures. Construction and Building Materials, Vol. 25, 1159-1166.
Andersson, H., Jonsson, L., and Ogren, M. (2013). Benefit Measures for Noise Abatement: Calculations for Road and Rail Traffic Noise. European Transport Research Review, Vol. 5, No. 3, 135-148.
Barrett, M. (2008). Effects of a Permeable Friction Course on Highway Runoff. Journal of Irrigation and Drainage Engineering. Vol. 134, No. 5, 646-651.
Bennert, T., and Cooley, A. (2014). Evaluation of the Contribution of the Mixture Components of the Longevity and Performance of FC-5. Report No. BDS15 977-01, Florida Department of Transportation, Tallahassee, Florida, 163pp.
Bernhard, R., and Wayson, R. (2004). An Introduction to Tire/Pavement Noise of Asphalt Pavement. Institute of Safe, Quiet and Durable Highways, Purdue University.
Blanco, J., and Flindell, I. (2011). Property Prices in Urban Areas Affected by Road Traffic Noise. Applied Acoustics, Vol. 72, 133-141.
Buddhavarapu, P., Smit, A., and Prozzi, J. (2015). A Fully Bayesian Before-After Analysis of Permeable Friction Course Pavement Wet Weather Safety. Accident Analysis & Prevention, Vol. 80, 89-96.
Chen, X., Zhu, H., Dong, Q., and Huang, B. (2017). Case Study: Performance Effectiveness and Cost-Benefit Analyses of Open-Graded Friction Course Pavements in Tennessee. International Journal of Pavement Engineering, Vol. 18, No. 11, 957-970.
Cooley, L., Brumfield, J., Wogawer, R., Partl, M., Poulikakos, L., and Hicks, G. (2009). Construction and Maintenance Practices for Permeable Friction Courses. NCHRP Report 640, Washington D. C.
Donavan, P. (2007). Exterior Noise of Vehicles. Handbook of Noise and Vibration Control. John Wiley & Sons Inc., New Jersey.
Elvik, R., and Greibe, P. (2005). Road Safety Effects of Porous Asphalt: A Systematic Review of Evaluation Studies. Accident Analysis & Prevention, Vol. 37, No. 3, 515-522.
FHWA. (1990). Open-Graded Friction Courses FHWA Mix Design Method. Technical Advisory T5040.31. Washington D.C., Federal Highway Administration.
Hernandez-Saenz, M., Caro, S., Arambula-Mercado, E., Martin, A. (2016). Mix Design, Performance and Maintenance of Permeable Friction Courses in the United States: State of the Art. Construction and Building Materials, Vol. 111, 358-367.
Holsman, A., and Bradley, R. (1982). The Economic and Social Impact of Main Road Traffic Noise in Sydney. University of New South Wales, Sydney.
Iten, R., and Maggi, R. (1990). The Economic Value of Traffic Noise Abatement in an Urban Area: Empirical Evidence from a Hedonic and Discrete Choice Approach. The fifth World Conference on Transportation Research, Yokohama.
Jackson, N., Vargas, A., and Pucinelli, J. (2008). Quieter Pavement Survey. Report No. WA-RD-688.1. Washington Department of Transportation, Olympia, Washington, 252pp.

58
Kabir, M., King W., Abadie, C., Icenogle, P., and Cooper, S. (2012). Louisiana’s Experience with Open-Graded Friction Course Mixtures. Transportation Research Record, No. 2295, 63-71.
Kandhal, P., and Mallick, R. (1998). Open-Graded Friction Course: State of the Practice. NCAT Report, 98-7. Auburn, Alabama, 31pp.
Lyon C., Persaud, B., and Merritt, D. (2018). Quantifying the Safety Effects of Pavement Friction Improvements – Results from A Large-Scale Study. International Journal of Pavement Engineering. Vol. 19, 145-152.
Nelson, J. (2004). Meta-Analysis of Airport Noise and Hedonic Property Values. Journal of Transport Economics and Policy, Vol. 38, No. 1, 1-27.
Ozbay, K., Bartin, B., and Berechman, J. (2001). Estimation and Evaluation of Full Marginal Costs of Highway Transportation in New Jersey. Journal of Transportation and Statistics, Vol. 4, No. 1, 81-103.
Pernia, Y., Metz, J., Gunaratne, M., Nash, T., and Musselman, J. (2016). Application of Image Analysis Techniques to Develop a Quality Control Tool for Automated Optimum Binder Content Determination of Open-Graded Friction Course Mixtures. Transportation Research Record, No. 2575, 48-60.
Shimeno, S., and Tanaka, T. (2010). Evaluation and Further Development of Porous Asphalt Pavement with 10 Years Experience in Japanese Expressways. 11th International Conference on Asphalt Pavement. Nagoya, Japan.
Szczepanska, A., Senetra, A., and Wasilewicz-Pszczolkowska, M. (2015). The Effect of Road Traffic Noise on the Prices of Residential Property – A Case Study of the Polish City of Olsztyn. Transportation Research Part D: Transport and Environment. Vol. 36, 167-177.
Vaughan and Huckins (1975). The Economics of Expressway Noise Pollution Abatement, P-5475. The Rand Corporation, Santa Monica, California.
Watson, D., Johnson, A., and Jared, D. (1998). Georgia DOT’s Progress in Open-Graded Friction Course Development. Transportation Research Record, No. 1616.
Watson, D., Tran, N., Rodezno, C., Taylor, A., and James, Jr, T. (2018). Performance-Based Mix Design of Porous Friction Courses. NCHRP Project 1-55. Transportation Research Board of the National Academies of Sciences, Engineering, and Medicine. (Final Report submitted and to be published in 2018.)
West, R., Zhang, J., and Moore, J. (2005). Evaluation of Bond Strength Between Pavement Layers. NCAT Report 05-08.

59
APPENDIX A Asphalt Mix Designs

60
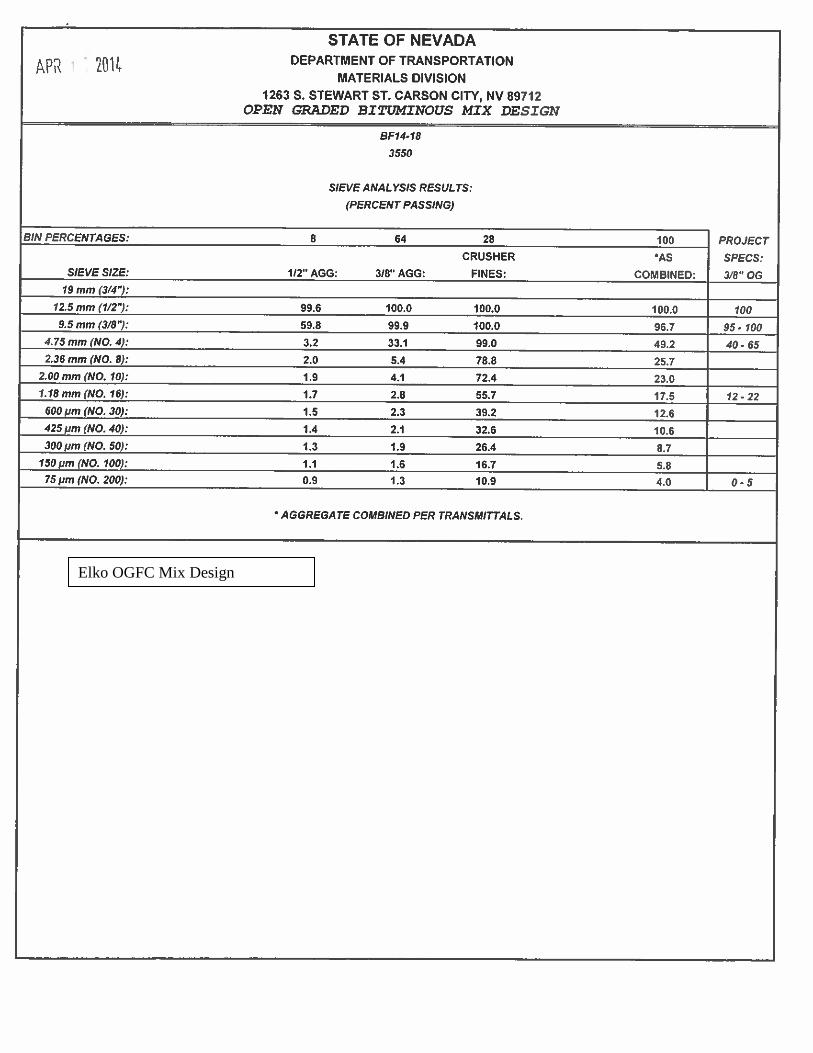
61
Elko OGFC Mix Design

62

63
Elko Dense-Graded Mix

64

65

66

67
Las Vegas OGFC Mix for I-15

68

69

70

71

72
Las Vegas Dense-Graded Mix for I-15

73

74

75

76
APPENDIX B Laboratory Test Results

77
Asphalt Content by Ignition Oven
Project ID Mix ID Bucket #Ignition AC
Replicate #1Ignition AC
Replicate #2
Uncorrected Ignition AC
Average
Ignition Bitumen Ratio (excluding
temp compensation)
Replicate #1
Ignition Bitumen Ratio (excluding
temp compensation)
Replicate #2
Uncorrected Bitumen Ratio Average from
IgnitionElko, Nevada OGFC 1 6.59 6.44 6.52 7.30 7.06 7.18Las Vegas, Nevada OGFC 1 4.83 4.83 4.83 5.23 5.23 5.23Elko, Nevada Dense 1 4.65 4.80 4.73 5.04 5.20 5.12Las Vegas, Nevada Dense 1 3.78 3.65 3.72 4.04 3.92 3.98Las Vegas, Nevada OGFC 2 4.83 4.83 4.83 5.18 5.19 5.19

78
Sample Preparation by Gyratory Compactor
Project ID Mix ID Gyrations Sample IDSample Mass, g
Height, mm
Gmm Gmb Va ,% Density, % Test Used For
Elko, Nevada OGFC 50 14 4206.2 115.7 2.374 2.082 12.3 87.7 CantabroElko, Nevada OGFC 50 15 4213.2 115.3 2.374 2.090 11.9 88.1 CantabroElko, Nevada OGFC 50 16 4186.2 115.8 2.374 2.062 13.1 86.9 CantabroElko, Nevada OGFC 50 17 4085.7 111.6 2.374 2.095 11.7 88.3 TSRElko, Nevada OGFC 50 18 4099.8 112.2 2.374 2.095 11.7 88.3 TSRElko, Nevada OGFC 50 19 4095.8 111.5 2.374 2.096 11.7 88.3 TSRElko, Nevada OGFC 50 20 4098.9 112.0 2.374 2.096 11.7 88.3 TSRElko, Nevada OGFC 50 21 4093.2 111.7 2.374 2.106 11.3 88.7 TSRElko, Nevada OGFC 50 22 4099.4 112.0 2.374 2.092 11.9 88.1 TSRElko, Nevada OGFC 50 23 4311.6 117.6 2.374 2.106 11.3 88.7 HamburgElko, Nevada OGFC 50 25 4366.7 119.5 2.374 2.101 11.5 88.5 HamburgElko, Nevada OGFC 50 26 4364.3 119.2 2.374 2.107 11.2 88.8 Hamburg
Avg. Va = 11.8Las Vegas, Nevada OGFC 50 114 4092.3 115.6 2.465 2.040 17.2 82.8 CantabroLas Vegas, Nevada OGFC 50 115 4109.7 116.0 2.465 2.013 18.3 81.7 CantabroLas Vegas, Nevada OGFC 50 116 4096.6 115.7 2.465 2.029 17.7 82.3 CantabroLas Vegas, Nevada OGFC 50 117 3978.4 112.3 2.465 2.037 17.4 82.6 TSRLas Vegas, Nevada OGFC 50 118 3982 112.5 2.465 2.030 17.6 82.4 TSRLas Vegas, Nevada OGFC 50 119 3987.1 112.4 2.465 2.044 17.1 82.9 TSRLas Vegas, Nevada OGFC 50 120 3980.2 112.4 2.465 2.031 17.6 82.4 TSRLas Vegas, Nevada OGFC 50 121 3984.9 112.5 2.465 2.040 17.3 82.7 TSRLas Vegas, Nevada OGFC 50 127 3975.2 112.0 2.465 2.023 17.9 82.1 TSRLas Vegas, Nevada OGFC 50 124 4233.1 119.5 2.465 2.035 17.4 82.6 HamburgLas Vegas, Nevada OGFC 50 125 4231.7 118.9 2.465 2.048 16.9 83.1 HamburgLas Vegas, Nevada OGFC 50 126 4233.8 119.4 2.465 2.027 17.8 82.2 Hamburg
Avg. Va = 17.5Elko, Nevada Dense 75 203 4599.1 116.4 2.436 2.295 5.8 94.2 Design VerifyElko, Nevada Dense 75 204 4599.5 115.8 2.436 2.302 5.5 94.5 Design Verify
Avg. Va = 5.7Las Vegas, Nevada Dense 75 303 4803.7 112.8 2.534 2.463 2.8 97.2 Design VerifyLas Vegas, Nevada Dense 75 304 4803.00 112.4 2.534 2.472 2.5 97.5 Design Verify
Avg. Va = 2.7

79
Hamburg Wheel Tracking Test
Project ID Mix ID Sample IDTest
Temperature, CSample 1 Air
Voids (%)Sample 2 Air
Voids (%)Average Air
Voids (%)Rut Depth @ 10,000
passes (mm)Rut Depth @ 20,000
Passes (mm)Passes to
12.5mm RutStripping Inflection
Point (passes)Elko, Nevada OGFC 23A and 23B 50 10.4 11.1 10.8 14.29 > 12.5 8,750 20,000+Elko, Nevada OGFC 25A and 25B 50 10.9 11.3 11.1 14.25 > 12.5 8,700 20,000+Elko, Nevada OGFC 26A and 26B 50 10.3 11.0 10.7 13.69 > 12.5 9,400 10,100
Las Vegas, Nevada OGFC 124A and 124B 50 16.7 16.6 16.7 5.20 7.63 > 20,000 20,000+Las Vegas, Nevada OGFC 125A and 125B 50 16.5 16.3 16.4 3.83 7.52 > 20,000 20,000+Las Vegas, Nevada OGFC 126A and 126B 50 16.5 17.1 16.8 6.13 9.21 > 20,000 20,000+

80
Cantabro Stone Loss
Project ID Mix ID Sample ID Conditioning Va ,%Cantabro
% Loss
Elko, Nevada OGFC 14 None 12.3 2.1Elko, Nevada OGFC 15 None 11.9 3.7Elko, Nevada OGFC 16 None 13.1 3.5Las Vegas, Nevada OGFC 114 None 17.2 7.3Las Vegas, Nevada OGFC 115 None 18.3 6.3Las Vegas, Nevada OGFC 116 None 17.7 7.2Elko, Nevada OGFC 27 Vacuum Saturated and 1 F/T 12.4 5.4Elko, Nevada OGFC 29 Vacuum Saturated and 1 F/T 11.8 6.2Elko, Nevada OGFC 32 Vacuum Saturated and 1 F/T 12.3 6.4Las Vegas, Nevada OGFC 128 Vacuum Saturated and 1 F/T 17.6 13.4Las Vegas, Nevada OGFC 129 Vacuum Saturated and 1 F/T 17.8 12.7Las Vegas, Nevada OGFC 131 Vacuum Saturated and 1 F/T 17.5 12.6Elko, Nevada OGFC 28 Long-Term Oven Aging per R30 12.4 5.6Elko, Nevada OGFC 30 Long-Term Oven Aging per R30 11.9 6.9Elko, Nevada OGFC 31 Long-Term Oven Aging per R30 11.7 5.3Las Vegas, Nevada OGFC 130 Long-Term Oven Aging per R30 17.5 14.2Las Vegas, Nevada OGFC 132 Long-Term Oven Aging per R30 17.4 12.3Las Vegas, Nevada OGFC 133 Long-Term Oven Aging per R30 18.0 13.5Elko, Nevada Dense 230 None 6.5 10.8Elko, Nevada Dense 231 None 6.7 8.4Elko, Nevada Dense 232 None 7.3 9.3Las Vegas, Nevada Dense 330 None 6.8 13.7Las Vegas, Nevada Dense 331 None 6.5 13.6Las Vegas, Nevada Dense 332 None 6.7 17.7

81
Moisture Susceptibility Testing (Indirect Tensile Strength)
Project ID Mix ID Sample ID Va ,% Conditioning
Cycles Tensile Strength
(psi) TSR
Elko, Nevada OGFC 17 11.7 1 57.7
0.73
Elko, Nevada OGFC 21 11.3 1 50.5 Elko, Nevada OGFC 22 11.9 1 54.8 Elko, Nevada OGFC 18 11.7 0 75.0 Elko, Nevada OGFC 19 11.7 0 76.5 Elko, Nevada OGFC 20 11.7 0 72.1 Las Vegas, Nevada OGFC 117 17.4 1 76.5
0.78
Las Vegas, Nevada OGFC 119 17.1 1 70.7 Las Vegas, Nevada OGFC 127 17.9 1 70.7 Las Vegas, Nevada OGFC 118 17.6 0 88.0 Las Vegas, Nevada OGFC 120 17.6 0 96.6 Las Vegas, Nevada OGFC 121 17.3 0 95.2

82
APPENDIX C Roadway Test Results

83
Roadway Core Results Immediately after Construction
Roadway Mix ID Core ID
Average Height
(in) Average
Diameter (in) Gmm Gmb
Air Voids (%)
Permeability (k), cm/s*10^-5
I-15 Dense 1 1.66 3.92 2.534 2.474 2.4 0
I-15 Dense 2 1.97 3.91 2.534 2.426 4.3 0
I-15 Dense 3 1.70 3.91 2.534 2.471 2.5 0
I-15 OGFC 4 0.92 3.91 2.465 1.991 19.2 8,514
I-15 OGFC 5 0.79 3.91 2.465 2.046 17.0 6,965
I-15 OGFC 6 0.87 3.92 2.465 1.999 18.9 8,687
SR 535 Dense 1 1.46 3.97 2.436 2.312 5.1 0.4
SR 535 Dense 2 1.23 3.99 2.436 2.322 4.7 0.0
SR 535 Dense 3 1.29 3.98 2.436 2.301 5.5 0.1
SR 535 OGFC 4 0.76 4.00 2.374 2.150 9.4 2.1 SR 535 OGFC 5 0.94 4.01 2.374 2.163 8.9 204.5 SR 535 OGFC 6 1.04 3.99 2.374 2.149 9.5 518.6

84
Field Permeability SR 535 Elko Dense SR 535 Elko OGFC I-15 Las Vegas Dense I-15 Las Vegas OGFC Date Permeability Date Permeability Date Permeability Date Permeability
2/15 7 2/15 2932 2/15 1 2/15 7549 3/16 6 3/16 137 3/16 3 3/16 11447 3/17 8 3/17 5 3/17 5 3/17 5965
Nevada OBSI Summary
Feb-15 May-15 Oct-15 Mar-16 Sep-16 Mar-17 Sep-17
Location Highway Surface Type dB(A) Avg.
dB(A) Avg.
dB(A) Avg.
dB(A) Avg.
dB(A) Avg.
dB(A) Avg.
dB(A) Avg.
Elko, NV NV 535 EB Dense Graded 96.45 97.95 98.95 98.50 99.14 100.15 100.2 a
Elko, NV NV 535 EB OGFC 92.85 93.55 95.45 96.00 98.21 99.20 100.1 a
Las Vegas, NV I-15 NB Dense Graded 99.00 98.10 99.55 99.05 100.10 100.05 100.10
Las Vegas, NV I-15 NB OGFC 96.95 95.90 97.35 97.40 98.02 98.70 98.70
McGill, NV US 93 NB - - - - - - 97.70

85
Nevada Surface Texture by Circular Texture Meter
1 2 3 4 5 Average 1 2 3 4 5 Average 1 2 3 4 5 AverageMean Profile Depth (Average) 0.82 0.80 0.80 0.81 0.81 0.81 0.64 0.65 0.66 0.66 0.66 0.65 0.51 0.51 0.51 0.50 0.50 0.51 0.66
% Dropouts (Average) 0% 0% 0% 0% 0% 0% 0% 0% 0% 0% 0% 0% 0% 0% 0% 0% 0% 0% 0.00RMS (Average) 0.41 0.41 0.40 0.41 0.41 0.41 0.37 0.37 0.37 0.37 0.70 0.44 0.31 0.31 0.31 0.31 0.30 0.31 0.38
Mean Profile Depth (Average) 0.82 0.82 0.83 0.88 0.78 0.83 0.65 0.67 0.68 0.68 0.68 0.67 0.78 0.78 0.78 0.78 0.77 0.78 0.76% Dropouts (Average) 1% 1% 1% 1% 1% 1% 1% 1% 1% 1% 1% 1% 1% 1% 1% 1% 1% 1% 0.01
RMS (Average) 0.57 0.56 0.55 0.59 0.74 0.60 0.50 0.49 0.51 0.50 0.50 0.50 0.61 0.60 0.60 0.60 0.59 0.60 0.57Mean Profile Depth (Average) 0.71 0.71 0.71 0.71 0.71 0.71 0.33 0.31 0.30 0.31 0.30 0.31 0.44 0.44 0.43 0.43 0.43 0.43 0.48
% Dropouts (Average) 0% 0% 0% 0% 0% 0% 0% 0% 0% 0% 0% 0% 0% 0% 0% 0% 0% 0% 0.00RMS (Average) 0.53 0.52 0.52 0.52 0.52 0.52 0.25 0.24 0.24 0.24 0.24 0.24 0.27 0.27 0.27 0.27 0.27 0.27 0.34
Mean Profile Depth (Average) 0.96 0.91 0.92 0.92 0.91 0.92 1.19 1.19 1.25 1.21 1.19 1.21 0.93 1.03 0.97 0.94 0.93 0.96 1.03% Dropouts (Average) 2% 3% 3% 2% 2% 2% 2% 2% 2% 2% 2% 2% 3% 3% 3% 3% 3% 3% 0.02
RMS (Average) 0.89 0.74 0.76 0.74 0.76 0.78 0.80 0.79 1.01 0.79 0.78 0.83 0.64 0.94 0.80 0.63 0.63 0.73 0.78
February, 2015 Overall Average
Site 3Measurement #
I-15 - OGFC MP 86.5 - 87.0
Site 1Measurement #
Site 2Measurement #
Elko, NV - Dense Graded
Elko, NV - OGFC
I-15 - Dense Graded
MP 87.0 - 87.5
1 2 3 4 5 Average 1 2 3 4 5 Average 1 2 3 4 5 AverageMean Profile Depth (Average) 0.85 0.93 0.92 0.93 0.92 0.91 0.52 0.51 0.51 0.51 0.51 0.51 0.96 0.95 0.96 0.96 0.96 0.96 0.79
% Dropouts (Average) 0% 0% 0% 0% 0% 0% 0% 0% 0% 0% 0% 0% 0% 0% 0% 0% 0% 0% 0.00RMS (Average) 0.50 0.52 0.51 0.53 0.50 0.51 0.25 0.25 0.25 0.25 0.25 0.25 0.49 0.50 0.50 0.50 0.50 0.50 0.42
Mean Profile Depth (Average) 0.89 0.88 0.88 0.88 0.88 0.88 0.96 0.95 0.97 0.97 0.97 0.96 0.82 0.82 0.82 0.81 0.82 0.82 0.89% Dropouts (Average) 0% 0% 0% 0% 0% 0% 0% 0% 0% 0% 0% 0% 0% 0% 0% 1% 0% 0% 0.00
RMS (Average) 0.50 0.49 0.50 0.49 0.56 0.51 0.57 0.57 0.57 0.57 0.57 0.57 0.45 0.46 0.46 0.45 0.45 0.45 0.51Mean Profile Depth (Average) 0.46 0.46 0.45 0.46 0.46 0.46 0.46 0.48 0.48 0.49 0.48 0.48 0.53 0.52 0.52 0.52 0.52 0.52 0.49
% Dropouts (Average) 0% 0% 0% 0% 0% 0% 0% 0% 0% 0% 0% 0% 0% 0% 0% 0% 0% 0% 0.00RMS (Average) 0.30 0.30 0.29 0.29 0.30 0.30 0.30 0.29 0.29 0.29 0.29 0.29 0.35 0.35 0.35 0.35 0.35 0.35 0.31
Mean Profile Depth (Average) 1.03 1.08 1.07 1.03 1.13 1.07 1.01 1.03 1.02 1.05 1.00 1.02 1.02 1.04 1.09 1.08 1.05 1.06 1.05% Dropouts (Average) 5% 5% 5% 5% 5% 5% 2% 2% 2% 2% 2% 2% 3% 3% 3% 3% 3% 3% 0.03
RMS (Average) 0.74 1.01 1.00 0.72 1.09 0.91 0.70 0.76 0.70 0.89 0.70 0.75 0.65 0.66 0.72 0.92 0.69 0.73 0.80
March, 2016 Overall Average
Elko, NV - Dense Graded
Elko, NV - OGFC
I-15 - Dense Graded
MP 87.0 - 87.5
I-15 - OGFC MP 86.5 - 87.0
Site 1 Site 2 Site 3Measurement # Measurement # Measurement #
1 2 3 4 5 Average 1 2 3 4 5 Average 1 2 3 4 5 AverageMean Profile Depth (Average) 0.77 0.70 0.69 0.69 0.70 0.71 0.65 0.65 0.67 0.66 0.66 0.66 0.61 0.61 0.62 0.61 0.61 0.61 0.66
% Dropouts (Average) 0% 0% 0% 0% 0% 0% 0% 0% 0% 0% 0% 0% 0% 0% 0% 0% 0% 0% 0.00RMS (Average) 0.38 0.37 0.37 0.37 0.37 0.37 0.31 0.31 0.31 0.31 0.31 0.31 0.29 0.29 0.29 0.29 0.29 0.29 0.32
Mean Profile Depth (Average) 0.60 0.65 0.66 0.66 0.66 0.65 0.64 0.62 0.63 0.63 0.63 0.63 0.65 0.66 0.67 0.66 0.66 0.66 0.65% Dropouts (Average) 0% 0% 0% 0% 0% 0% 0% 0% 0% 0% 0% 0% 0% 0% 0% 0% 0% 0% 0.00
RMS (Average) 0.34 0.35 0.35 0.35 0.35 0.35 0.35 0.35 0.35 0.35 0.35 0.35 0.32 0.33 0.33 0.33 0.33 0.33 0.34Mean Profile Depth (Average) 0.56 0.56 0.56 0.56 0.56 0.56 0.39 0.40 0.40 0.41 0.40 0.40 0.65 0.66 0.66 0.66 0.66 0.66 0.54
% Dropouts (Average) 0% 0% 0% 0% 0% 0% 0% 0% 0% 0% 0% 0% 0% 0% 0% 0% 0% 0% 0.00RMS (Average) 0.29 0.29 0.29 0.29 0.29 0.29 0.20 0.21 0.21 0.21 0.21 0.21 0.37 0.38 0.38 0.37 0.38 0.38 0.29
Mean Profile Depth (Average) 0.94 0.99 0.90 0.89 0.92 0.93 1.12 1.10 1.15 1.11 1.10 1.12 0.97 0.93 0.93 0.92 0.93 0.94 0.99% Dropouts (Average) 2% 2% 2% 3% 2% 2% 2% 2% 2% 2% 3% 2% 2% 1% 2% 2% 2% 2% 0.02
RMS (Average) 0.60 0.92 0.73 0.59 0.81 0.73 0.85 0.72 0.97 0.72 0.71 0.79 0.69 0.58 0.79 0.58 0.58 0.64 0.72
Location 3Measurement #March, 2017 Overall
Average
I15 North OGFC Las
Vegas
Location 1Measurement #
Location 2Measurement #
NV 535 East DGA Elko
NV 535 East OGFC Elko
I15 North DGA Las Vegas

86
Las Vegas I-15 Friction Tests
Route Milepost Direction Mix Type Lane Date Date SN Milepost Lane Date Date SNI-15 85-89 N OGFC 1 2/15 1 34 86.8-87.6 1 2/15 1 19I-15 85-89 N OGFC 1 2/15 1 31 86.8-87.6 1 2/15 1 20I-15 85-89 N OGFC 1 2/15 1 36 86.8-87.6 1 2/15 1 18I-15 85-89 N OGFC 1 2/15 1 34 86.8-87.6 1 2/15 1 18I-15 85-89 N OGFC 1 2/15 1 34 86.8-87.6 2 2/15 1 17I-15 85-89 N OGFC 1 2/15 1 32 86.8-87.6 2 2/15 1 20I-15 85-89 N OGFC 1 2/15 1 35 86.8-87.6 2 2/15 1 22I-15 85-89 N OGFC 1 2/15 1 34 86.8-87.6 2 2/15 1 19I-15 85-89 N OGFC 1 2/15 1 35 86.8-87.6 1 8/15 2 26I-15 85-89 N OGFC 1 2/15 1 35 86.8-87.6 1 8/15 2 27I-15 85-89 N OGFC 1 2/15 1 35 86.8-87.6 1 8/15 2 27I-15 85-89 N OGFC 1 2/15 1 34 86.8-87.6 1 8/15 2 29I-15 85-89 N OGFC 1 2/15 1 34 86.8-87.6 2 8/15 2 28I-15 85-89 N OGFC 1 2/15 1 37 86.8-87.6 2 8/15 2 26I-15 85-89 N OGFC 1 2/15 1 35 86.8-87.6 2 8/15 2 28I-15 85-89 N OGFC 1 2/15 1 35 86.8-87.6 2 8/15 2 26I-15 85-89 N OGFC 2 2/15 1 37 86.8-87.6 1 1/16 3 23I-15 85-89 N OGFC 2 2/15 1 38 86.8-87.6 1 1/16 3 25I-15 85-89 N OGFC 2 2/15 1 32 86.8-87.6 1 1/16 3 24I-15 85-89 N OGFC 2 2/15 1 32 86.8-87.6 1 1/16 3 26I-15 85-89 N OGFC 2 2/15 1 32 86.8-87.6 2 1/16 3 22I-15 85-89 N OGFC 2 2/15 1 31 86.8-87.6 2 1/16 3 25I-15 85-89 N OGFC 2 2/15 1 32 86.8-87.6 2 1/16 3 25I-15 85-89 N OGFC 2 2/15 1 29 86.8-87.6 2 1/16 3 23I-15 85-89 N OGFC 2 2/15 1 32 86.8-87.6 1 6/16 4 28I-15 85-89 N OGFC 2 2/15 1 32 86.8-87.6 1 6/16 4 27I-15 85-89 N OGFC 2 2/15 1 33 86.8-87.6 1 6/16 4 26I-15 85-89 N OGFC 2 2/15 1 30 86.8-87.6 1 6/16 4 27I-15 85-89 N OGFC 2 2/15 1 30 86.8-87.6 2 6/16 4 21I-15 85-89 N OGFC 2 2/15 1 30 86.8-87.6 2 6/16 4 24I-15 85-89 N OGFC 2 2/15 1 30 86.8-87.6 2 6/16 4 23I-15 85-89 N OGFC 2 2/15 1 30 86.8-87.6 2 6/16 4 21I-15 85-89 N OGFC 1 8/15 2 35 86.8-87.6 1 11/17 5 34I-15 85-89 N OGFC 1 8/15 2 32 86.8-87.6 1 11/17 5 34I-15 85-89 N OGFC 1 8/15 2 35 86.8-87.6 1 11/17 5 34I-15 85-89 N OGFC 1 8/15 2 34 86.8-87.6 1 11/17 5 36I-15 85-89 N OGFC 1 8/15 2 31 86.8-87.6 2 11/17 5 26I-15 85-89 N OGFC 1 8/15 2 28 86.8-87.6 2 11/17 5 28I-15 85-89 N OGFC 1 8/15 2 31 86.8-87.6 2 11/17 5 29I-15 85-89 N OGFC 1 8/15 2 29 86.8-87.6 2 11/17 5 28
OGFC Dense-Graded
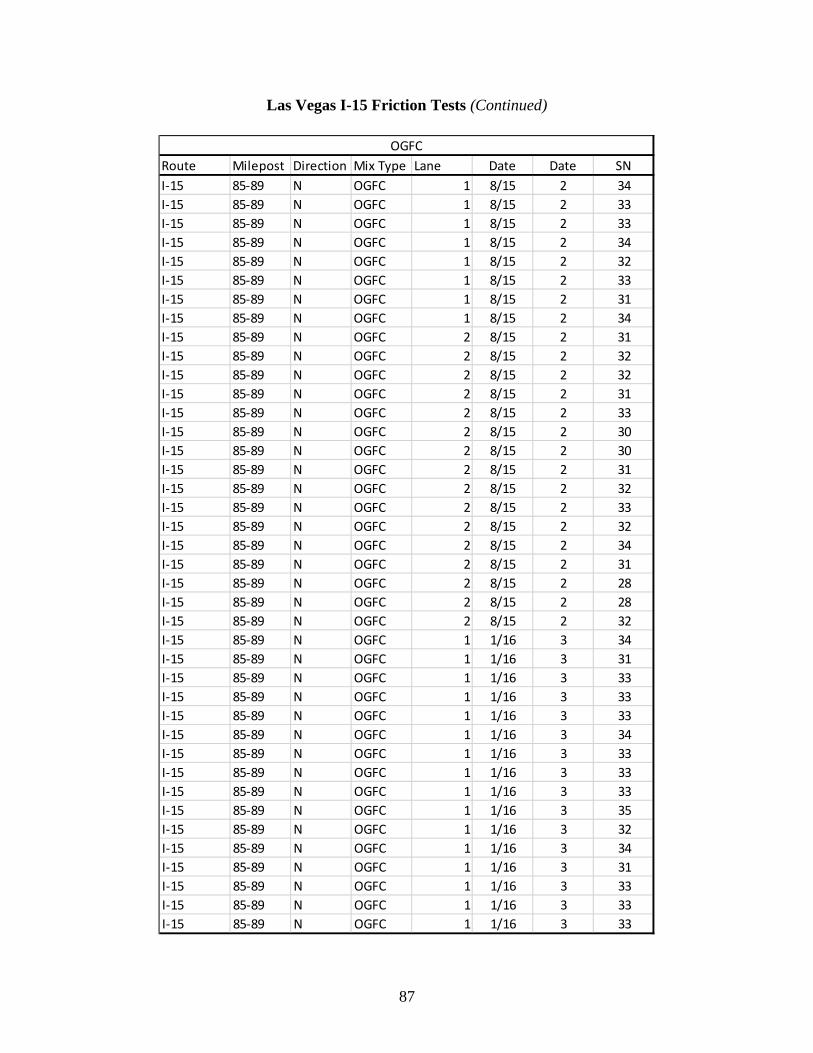
87
Las Vegas I-15 Friction Tests (Continued)
Route Milepost Direction Mix Type Lane Date Date SNI-15 85-89 N OGFC 1 8/15 2 34I-15 85-89 N OGFC 1 8/15 2 33I-15 85-89 N OGFC 1 8/15 2 33I-15 85-89 N OGFC 1 8/15 2 34I-15 85-89 N OGFC 1 8/15 2 32I-15 85-89 N OGFC 1 8/15 2 33I-15 85-89 N OGFC 1 8/15 2 31I-15 85-89 N OGFC 1 8/15 2 34I-15 85-89 N OGFC 2 8/15 2 31I-15 85-89 N OGFC 2 8/15 2 32I-15 85-89 N OGFC 2 8/15 2 32I-15 85-89 N OGFC 2 8/15 2 31I-15 85-89 N OGFC 2 8/15 2 33I-15 85-89 N OGFC 2 8/15 2 30I-15 85-89 N OGFC 2 8/15 2 30I-15 85-89 N OGFC 2 8/15 2 31I-15 85-89 N OGFC 2 8/15 2 32I-15 85-89 N OGFC 2 8/15 2 33I-15 85-89 N OGFC 2 8/15 2 32I-15 85-89 N OGFC 2 8/15 2 34I-15 85-89 N OGFC 2 8/15 2 31I-15 85-89 N OGFC 2 8/15 2 28I-15 85-89 N OGFC 2 8/15 2 28I-15 85-89 N OGFC 2 8/15 2 32I-15 85-89 N OGFC 1 1/16 3 34I-15 85-89 N OGFC 1 1/16 3 31I-15 85-89 N OGFC 1 1/16 3 33I-15 85-89 N OGFC 1 1/16 3 33I-15 85-89 N OGFC 1 1/16 3 33I-15 85-89 N OGFC 1 1/16 3 34I-15 85-89 N OGFC 1 1/16 3 33I-15 85-89 N OGFC 1 1/16 3 33I-15 85-89 N OGFC 1 1/16 3 33I-15 85-89 N OGFC 1 1/16 3 35I-15 85-89 N OGFC 1 1/16 3 32I-15 85-89 N OGFC 1 1/16 3 34I-15 85-89 N OGFC 1 1/16 3 31I-15 85-89 N OGFC 1 1/16 3 33I-15 85-89 N OGFC 1 1/16 3 33I-15 85-89 N OGFC 1 1/16 3 33
OGFC

88
Las Vegas I-15 Friction Tests (Continued)
Route Milepost Direction Mix Type Lane Date Date SNI-15 85-89 N OGFC 2 1/16 3 32I-15 85-89 N OGFC 2 1/16 3 33I-15 85-89 N OGFC 2 1/16 3 31I-15 85-89 N OGFC 2 1/16 3 30I-15 85-89 N OGFC 2 1/16 3 31I-15 85-89 N OGFC 2 1/16 3 32I-15 85-89 N OGFC 2 1/16 3 32I-15 85-89 N OGFC 2 1/16 3 29I-15 85-89 N OGFC 2 1/16 3 31I-15 85-89 N OGFC 2 1/16 3 33I-15 85-89 N OGFC 2 1/16 3 34I-15 85-89 N OGFC 2 1/16 3 34I-15 85-89 N OGFC 2 1/16 3 33I-15 85-89 N OGFC 2 1/16 3 32I-15 85-89 N OGFC 2 1/16 3 34I-15 85-89 N OGFC 2 1/16 3 32I-15 85-89 N OGFC 1 6/16 4 39I-15 85-89 N OGFC 1 6/16 4 36I-15 85-89 N OGFC 1 6/16 4 34I-15 85-89 N OGFC 1 6/16 4 34I-15 85-89 N OGFC 1 6/16 4 34I-15 85-89 N OGFC 1 6/16 4 34I-15 85-89 N OGFC 1 6/16 4 34I-15 85-89 N OGFC 1 6/16 4 35I-15 85-89 N OGFC 1 6/16 4 34I-15 85-89 N OGFC 1 6/16 4 34I-15 85-89 N OGFC 1 6/16 4 35I-15 85-89 N OGFC 1 6/16 4 34I-15 85-89 N OGFC 1 6/16 4 35I-15 85-89 N OGFC 1 6/16 4 34I-15 85-89 N OGFC 1 6/16 4 36I-15 85-89 N OGFC 1 6/16 4 35I-15 85-89 N OGFC 2 6/16 4 31I-15 85-89 N OGFC 2 6/16 4 31I-15 85-89 N OGFC 2 6/16 4 30I-15 85-89 N OGFC 2 6/16 4 29I-15 85-89 N OGFC 2 6/16 4 32I-15 85-89 N OGFC 2 6/16 4 33I-15 85-89 N OGFC 2 6/16 4 32I-15 85-89 N OGFC 2 6/16 4 30
OGFC

89
Las Vegas I-15 Friction Tests (Continued)
Route Milepost Direction Mix Type Lane Date Date SNI-15 85-89 N OGFC 2 6/16 4 31I-15 85-89 N OGFC 2 6/16 4 30I-15 85-89 N OGFC 2 6/16 4 32I-15 85-89 N OGFC 2 6/16 4 34I-15 85-89 N OGFC 2 6/16 4 31I-15 85-89 N OGFC 2 6/16 4 32I-15 85-89 N OGFC 2 6/16 4 31I-15 85-89 N OGFC 2 6/16 4 31I-15 85-89 N OGFC 1 11/17 5 42I-15 85-89 N OGFC 1 11/17 5 42I-15 85-89 N OGFC 1 11/17 5 41I-15 85-89 N OGFC 1 11/17 5 42I-15 85-89 N OGFC 1 11/17 5 41I-15 85-89 N OGFC 1 11/17 5 43I-15 85-89 N OGFC 1 11/17 5 43I-15 85-89 N OGFC 1 11/17 5 42I-15 85-89 N OGFC 1 11/17 5 43I-15 85-89 N OGFC 1 11/17 5 41I-15 85-89 N OGFC 1 11/17 5 44I-15 85-89 N OGFC 1 11/17 5 43I-15 85-89 N OGFC 1 11/17 5 43I-15 85-89 N OGFC 1 11/17 5 43I-15 85-89 N OGFC 1 11/17 5 44I-15 85-89 N OGFC 1 11/17 5I-15 85-89 N OGFC 2 11/17 5 37I-15 85-89 N OGFC 2 11/17 5 37I-15 85-89 N OGFC 2 11/17 5 36I-15 85-89 N OGFC 2 11/17 5 37I-15 85-89 N OGFC 2 11/17 5 38I-15 85-89 N OGFC 2 11/17 5 37I-15 85-89 N OGFC 2 11/17 5 37I-15 85-89 N OGFC 2 11/17 5 39I-15 85-89 N OGFC 2 11/17 5 39I-15 85-89 N OGFC 2 11/17 5 39I-15 85-89 N OGFC 2 11/17 5 39I-15 85-89 N OGFC 2 11/17 5 40I-15 85-89 N OGFC 2 11/17 5 38I-15 85-89 N OGFC 2 11/17 5 39I-15 85-89 N OGFC 2 11/17 5 38I-15 85-89 N OGFC 2 11/17 5 39
OGFC

90
Elko SR 535 Friction Tests
Route Milepost Direction Mix Type Lane Date SN Milepost Direction Mix Type Date SNSR-535 1-2 E OGFC 1 11/14 50 0-1 E Dense 11/14 64SR-535 1-2 E OGFC 1 11/14 50 0-1 E Dense 11/14 60SR-535 1-2 E OGFC 1 11/14 52 0-1 E Dense 11/14 61SR-535 1-2 E OGFC 1 11/14 51 0-1 E Dense 11/14 61SR-535 1-2 E OGFC 1 8/15 40 0-1 E Dense 8/15 40SR-535 1-2 E OGFC 1 8/15 40 0-1 E Dense 8/15 43SR-535 1-2 E OGFC 1 8/15 42 0-1 E Dense 8/15 41SR-535 1-2 E OGFC 1 8/15 41 0-1 E Dense 8/15 40SR-535 1-2 E OGFC 1 1/16 53 0-1 E Dense 1/16 53SR-535 1-2 E OGFC 1 1/16 56 0-1 E Dense 1/16 53SR-535 1-2 E OGFC 1 1/16 55 0-1 E Dense 1/16 50SR-535 1-2 E OGFC 1 1/16 55 0-1 E Dense 1/16 53SR-535 1-2 E OGFC 1 6/16 49 0-1 E Dense 6/16 48SR-535 1-2 E OGFC 1 6/16 48 0-1 E Dense 6/16 49SR-535 1-2 E OGFC 1 6/16 48 0-1 E Dense 6/16 45SR-535 1-2 E OGFC 1 6/16 50 0-1 E Dense 6/16 46SR-535 1-2 W OGFC 1 11/14 52 0-1 W Dense 11/14 64SR-535 1-2 W OGFC 1 11/14 53 0-1 W Dense 11/14 64SR-535 1-2 W OGFC 1 11/14 53 0-1 W Dense 11/14 61SR-535 1-2 W OGFC 1 11/14 54 0-1 W Dense 11/14 58SR-535 1-2 W OGFC 1 11/14 53 0-1 W Dense 11/14 53SR-535 1-2 W OGFC 1 8/15 45 0-1 W Dense 8/15 46SR-535 1-2 W OGFC 1 8/15 45 0-1 W Dense 8/15 47SR-535 1-2 W OGFC 1 8/15 46 0-1 W Dense 8/15 39SR-535 1-2 W OGFC 1 8/15 46 0-1 W Dense 8/15 39SR-535 1-2 W OGFC 1 8/15 47 0-1 W Dense 8/15 36SR-535 1-2 W OGFC 1 1/16 57 0-1 W Dense 1/16 54SR-535 1-2 W OGFC 1 1/16 57 0-1 W Dense 1/16 58SR-535 1-2 W OGFC 1 1/16 57 0-1 W Dense 1/16 54SR-535 1-2 W OGFC 1 1/16 55 0-1 W Dense 1/16 53SR-535 1-2 W OGFC 1 1/16 45 0-1 W Dense 1/16 56SR-535 1-2 W OGFC 1 6/16 28 0-1 W Dense 6/16 45SR-535 1-2 W OGFC 1 6/16 29 0-1 W Dense 6/16 48SR-535 1-2 W OGFC 1 6/16 54 0-1 W Dense 6/16 45SR-535 1-2 W OGFC 1 6/16 51 0-1 W Dense 6/16 45SR-535 1-2 W OGFC 1 6/16 46 0-1 W Dense 6/16 45

Nevada Department of Transportation
Rudy Malfabon, P.E. Director
Ken Chambers, Research Division Chief
(775) 888-7220
1263 South Stewart Street
Carson City, Nevada 89712