thermal–structural coupling analysis of brake friction...
TRANSCRIPT

DRO Deakin Research Online, Deakin University’s Research Repository Deakin University CRICOS Provider Code: 00113B
Thermal–structural coupling analysis of brake friction pair based on the displacement gradient circulation method
Citation: Zhang, Shengfang, Yin, Jian, Liu, Yu, Liu, Nan, Sha, Zhihua, Wang, Yanan and Rolfe, Bernard 2018, Thermal–structural coupling analysis of brake friction pair based on the displacement gradient circulation method, Advances in mechanical engineering, vol. 10, no. 5, pp. 1-13. DOI: http://www.dx.doi.org/10.1177/1687814018773816
© 2018, The Authors
Reproduced by Deakin University under the terms of the Creative Commons Attribution Licence
Downloaded from DRO: http://hdl.handle.net/10536/DRO/DU:30109480
Research Article
Advances in Mechanical Engineering2018, Vol. 10(5) 1–13� The Author(s) 2018DOI: 10.1177/1687814018773816journals.sagepub.com/home/ade
Thermal–structural coupling analysis ofbrake friction pair based on thedisplacement gradient circulationmethod
Shengfang Zhang1, Jian Yin1 , Yu Liu1, Nan Liu2, Zhihua Sha1,Yanan Wang3 and Bernard Rolfe3
AbstractIn view of the braking process for the megawatt wind turbine brakes, considering the geometric and motion characteris-tics of brake pads and brake discs, a displacement gradient circulation method is put forward in this article, to resolvethe deviation of coupling results caused by the difference of friction effect along the radial/circumferential direction ofbrake disc, and the thermal–structural coupling analysis of friction pair during the braking process is carried out. Athree-dimensional model of transient heat transfer for brake friction pair is built based on the Abaqus software. The heatflow density is loaded by the displacement gradient circulation method, which is used to calculate the frictional heat flowduring the braking process. The analysis results show that along the circumferential direction of the brake disc the tem-perature distribution in the friction zone is non-uniform and the temperature starting from the contact position of thebrake disc and the brake pad decreases along the counterclockwise direction. The thermal stress caused by the tem-perature field during the braking process is the main factor causing the brake disc/pad failure. The effectiveness of themethod and the model is verified by the designed inertia braking experiments. The analytical method proposed in thisarticle provides a reference for simulating the friction braking process of large-size disc brakes.
KeywordsWind turbine brake, brake friction pair, thermal–structural coupling, displacement gradient circulation method, finite ele-ment simulation
Date received: 4 December 2017; accepted: 6 April 2018
Handling Editor: Shun-Peng Zhu
Introduction
The wind turbine generators need parking brake in thecases of excessive wind speed, troubleshooting anddaily maintenance. In order to ensure quick shutdownand operational safety during the maintenance, themechanical braking is required and therefore the windturbine brake is an essential device for wind turbinegenerator. When the brake is applied, the frictionbetween the non-rotating element and the rotating ele-ment is used to prevent the rotation or the tendency torotate, and finally to shutdown the system of wind
turbine generator. In the process of braking, due to theuneven contact of the friction pair, the actual contactarea is far less than the nominal contact area. And
1School of Mechanical Engineering, Dalian Jiaotong University, Dalian,
China2CRCC (Qingdao) Vehicle Inspection Station Co., Ltd., Qingdao, China3School of Engineering, Deakin University, Geelong, VIC, Australia
Corresponding author:
Yu Liu, School of Mechanical Engineering, Dalian Jiaotong University,
Dalian 116028, China.
Email: [email protected]
Creative Commons CC BY: This article is distributed under the terms of the Creative Commons Attribution 4.0 License
(http://www.creativecommons.org/licenses/by/4.0/) which permits any use, reproduction and distribution of the work without
further permission provided the original work is attributed as specified on the SAGE and Open Access pages (https://us.sagepub.com/en-us/nam/
open-access-at-sage).

contact discontinuities causing uneven distribution ofcontact surface temperature lead to thermal deforma-tion of the disc, which directly affects the contact stateand contact stress, and further affects the input inten-sity of friction heat conversely. This coupling behaviourleads to the thermoelastic instability (TEI)1 and thencauses the brake vibration and noise.2 At the sametime, the thermal stress can easily cause heat fading ofthe friction material, generate initial cracks and inten-sify the surface scraping of the friction surface.3 Thus,in the process of braking, the temperature field andstress field have great influences on the braking effi-ciency of wind turbine brake, and the coupling analysisof the two fields is an important part of the brakedesign and an important theoretical basis for frictionmaterial selection.
Extensive researches have been carried out on themechanism of the braking process. The surface tem-perature model of the brake friction surface was pro-posed by Bolk4 in the early stage; then Jaeger5
developed Bolk’s theory, demonstrated and proposedthe mathematical model of the rectangular mobile heatsource on the semi-infinite surface. Since then, mostresearches have focused on the multiple heat sources aswell as the influences of the interaction between heatsources on the friction surface temperature. Hua andXiang6 based on the study of energy dissipation duringthe braking process of disc brake established the finiteelement (FE) model of the transient temperature fieldanalysis of brake disc and friction plate. Azarkhin andBarber7 hypothesized that one of the contact bodieswas adiabatic, combining the Fourier transform methodand Green formula, and solved the transient thermalelastic problem based on Hertz contact. Zagrodzki8
studied the stress field problem of the brake disc, inaddition to the temperature field. The braking processwas simplified into two-dimensional axisymmetric prob-lem; assuming that the contact condition and heat flowtransmission were independent of coordinates, the dis-tribution of the temperature field and stress field of thebrake disc was obtained. Shahzamanian et al.9 pre-sented the transient and contact analysis of functionallygraded brake disc using ANSYS Parametric DesignLanguage (APDL). The effect of the number of divi-sions was investigated, and the effect of contact stiffnessin functionally graded brake disc was investigated fortransient analysis. Wang10 applied the cyclic iterativecalculation method to load the heat flux density. Thismethod can simulate the stress–strain distribution alongthe circumferential direction of the brake disc in a betterway, but it did not consider the influence of the radialrotation speed difference of the brake disc during theactual braking process. Belhocine and Bouchetara11
analysed the thermal behaviour of the full and venti-lated brake discs of vehicles. The numerical simulationfor the coupled transient thermal field and stress field
was carried out by sequential thermal–structural cou-pling method based on ANSYS to evaluate the stressfields and deformations. Manjunath and Suresh12 car-ried out the transient thermal and structural analyses ofthermomechanical behaviour of the dry contact of thebrake disc during the braking phase. The coupledthermal–structural analysis was used to determine thedeformation and the von Mises stress established in thedisc for both solid and ventilated discs with two differ-ent materials to enhance the performance of the rotordisc. Yevtushenko and Grzes13 performed a numericalsimulation of frictional heating in a disc brake of a typi-cal passenger vehicle based on the equation of motionand the boundary value problem of heat conduction.The influences of temperature-dependent coefficient offriction on the sliding velocity, braking time, brakingdistance and thermomechanical wear were studied. Andthen they performed an experimental study of a singlebraking process based on actual dimensions of the slid-ing components of the railway braking system, operat-ing parameters and properties of materials. The cast-iron brake disc combined with the pads made of theadvanced organic composite material was examined.The properties of the friction material using the pulsedinfrared (IR) thermography were determined. Thenumerical FE solution to the thermal problem of fric-tion for the pad–disc braking system was obtained. Thecalculated changes in transient temperature fields of thepad and the disc during braking were presented.14
Kennedy and Tian15 were the first to study disc brakesusing the numerical simulation method, but theirnumerical model was axisymmetric and could not effec-tively simulate the braking process. Zhu et al.16 pro-posed a probabilistic framework for fatigue lifeprediction and reliability assessment of a high-pressureturbine (HPT) disc to incorporate the effects of loadvariations and mean stress. The most dangerous regionof an HPT disc can be generally located through FEstructural analysis. By interpolating the boundary con-ditions of elastic–plastic stress analysis, distributions ofthe stress strain response of the HPT disc can beobtained.
In this article, the coupling of temperature field andstructure field in brake friction is considered in thepractical braking condition of a megawatt wind turbinebrake. A three-dimensional (3D) transient thermal–structural coupling model of the braking process isestablished by the Abaqus software. The heat loadmethod of friction braking area is focused on, the dis-placement gradient circulation method is put forward,and the traditional coupling model in Cartesian coordi-nates is expressed in cylindrical coordinates, which sim-plifies the thermal load. And the analysis results revealthe transient distribution and change law of the tem-perature and equivalent stress of the brake disc/pad inthe braking process. The proposed methods offer some
2 Advances in Mechanical Engineering

insights to the simulation of the high-speed and heavy-load mechanism in the process of multi-physics cou-pling and the field effect non-uniform distribution.
Establishment of the coupling model ofbrake friction pair
Establishment of the heat conduction model
Large-megawatt wind turbine brakes produce a lot offriction heat at work, which generates the temperaturedistribution gradients in different directions in thebrake disc/pad. The main heat transfer modes of thebrake disc/pad in the disc brake is heat conduction andthermal convection, and there is a small amount of heatradiation generated from the high brake disc/pad tem-perature during the braking process. Due to the factthat the changes of friction coefficient and some physi-cal parameters caused by the frictional heat have littleeffect on the temperature field and stress field distribu-tion trend of the wind brake disc/pad based on the dis-placement gradient circulation method; in theestablishment of the heat conduction model, the follow-ing assumptions are made:
1. The materials of brake disc/pad are consideredas isotropic and the sliding friction coefficient isconstant during the sliding process.
2. The materials in the braking process generateonly linear elastic deformation and the impactof material wear is ignored.
3. The contact surface of the brake disc/pad plateis an ideal flat plane and the instantaneous tem-perature of each contact point pair on the con-tact surface is equal during the braking process.
4. During the braking process, all the frictionenergy is converted into heat, also the brakepad has uniform heat dissipation, and the brakedisc shows non-uniform heat dissipation.
According to the actual braking condition of thelarge megawatt wind turbine brake, during the brakingprocess, the main heat transfer mode of the inner mate-rial of the brake disc and brake pad is heat conduction;besides, the main heat transfer mode in the surface con-tact area is also heat conduction; the main heat transfermode of the non-contact area of the brake disc is thethermal convection with the surrounding air; at thesame time, a small amount of heat radiation can befound on the brake disc and brake pad.
According to Fourier’s law, the heat conduction lawabout the boundary of heat flux is obtained
q=� l∂T
∂nð1Þ
where q is the heat flux, l is the boundary thermal con-ductivity, ∂T/∂n is the temperature gradient in the direc-tion normal to the boundary and the negative sign onthe right side of the equation indicates that the directionof heat transfer is opposite to the direction of the tem-perature gradient.
The basic formula for convective heat transfer is theNewton cooling formula
q=� hcDT ð2Þ
where hc is the convective heat transfer coefficient andDT is the temperature difference between the fluid andthe solid surface. Radiative heat transfer is based on theStefan–Boltzmann law. The heat flux of radiation heattransfer can be calculated by
q=� es T 41 � T 4
2
� �ð3Þ
where e is the emissivity, the value of which is less than 1,s is the Stefen–Boltzmann constant, the value of whichis s =5.67 3 10–8W/(m2k4), and T1 and T2 are the sur-face temperature and ambient temperature, respectively.
Calculation of thermal stress
From assumption (2), there is only linear strain in theobject due to the thermal expansion, and the shearstrain is zero. This strain caused by the material ther-mal deformation can be seen as the initial strain of theobject. In the calculation of stress, the initial strainterm is included and the relationship between thermalstress and heat flow density can be obtained
s=D(e� De) ð4Þ
where s is the material stress matrix, D is the elasticmatrix of the materials, e is the material strain matrixand De is the temperature strain caused by temperaturechange.
For the 3D model, the integrated brake pad tem-perature expression is derived by17
s= a(Tp � T0)½ 1 1 1 0 0 0 �T ð5Þ
where a is the material stress row vector, Tp is the tem-perature of the brake pads and T0 is the initialtemperature.
Boundary conditions
According to the actual braking conditions, it can beconsidered that the brake pad does not move while thebrake disc is rotating counterclockwise. Since the brakepressure acts on the top surface of the brake pad ratherthan the friction surface, it is assumed that the pressureacting on the top surface is uniform and the elastic
Zhang et al. 3

deformation of the brake disc and the brake pad is con-sidered. The brake pad is fixed to the brake linkageand the grooves on both sides of the brake pad can beassembled on the guide rail to slide up and down alongthe guide rail. Therefore, the fixed constraint in thedirections of X and Y-axes are exerted on the brakepad, as shown in Figure 1.
The method of displacement gradientcirculation of heat flux density
Analysis of working conditions about displacementgradient circulation method
The movement of the disc is different from that of thepad in the braking process of wind turbine brake wherethe brake pad is only in contact with the ring belt areaswept by the surface of the braking disc. And the wholebottom surface of the pad is always in contact with thebraking disc according to the assumptions. However,the non-contact area between the braking disc and thepad is much larger than the contact area at the sametime. This is necessary to be considered when themethod for thermal–structural coupling of the brakingdisc is analysed.
As shown in Figure 2, as the brake disc rotatesanticlockwise in the braking process, the unit studyarea is defined as the contact area swept from Position1, which is shown in Figure 2(a), to Position 2, which isshown in Figure 2(b), on the brake disc at any time. Itcan be seen that the unit study area includes a completeprocess of heat transfer between the disc and the pad,as shown in Figure 2(c). It can also be seen that thebrake disc rotating one revolution is a complete cycle,according to the positional relationship between thestudy area and the contact area of the brake pad.Because the linear velocity of friction for the brake discis equal to that of the pad in the position with the sameradius, the circular linear unit, the radius of which is ri
and the width of which is Dd in the study area, isselected as shown in Figure 2(d). For easy understand-ing, it is assumed that the linear elements of the brakepad slide into the unit study area at the initial linearspeed as v, and do the uniformly decelerated and cyclicmovement on the circular linear unit. That is to say,the rotational displacement is equivalent to the slidingdisplacement. Every cycle can be divided into fivestages, as Stage 1 to Stage 5, based on the differentpositions of the brake pad relative to the unit studyarea of the brake disc, as shown in Figure 2(e). The dis-placement gradient cyclic loading method can be pro-posed, as the differences along the circumferential andradial directions of the brake disc are taken intoaccount holistically.
The coupling equation deduction using thedisplacement gradient circulation method
The thermal radiation difference of the brake pad, dueto its movement on the unit study area of the brakedisc, is ignored. It needs to be discussed in stagesbecause of the different ways of heat exchange in theabove five stages.
Stage 1 is the pre-slide-in stage in which the unitstudy area of the brake disc is about to slide into thepad, but is not in contact with the pad yet. Thus, theheat exchange includes only the heat convectionbetween the unit study area and air. At this stage, theangular velocity is w1 at time t1. The formula of heatflow loading is given by the proper change due to thesize of the unit study area of the brake disc accordingto equation (2)
Q1 =� hcDT � A ð6Þ
Stage 2 is the sliding-in stage in which the unit studyarea of the brake disc has started to slide into the pad,and it has been in contact with the pad partially. Thus,
Figure 1. Relative positional relationship of brake friction pair and displacement constraints.
4 Advances in Mechanical Engineering

the heat exchange includes thermal conduction of thebrake pad in the contact area and the heat convectionwith air in the non-contact area. The formula of heatflow loading of every part in Stage 2 is given by theproper change due to the size of the unit study area ofthe braking disc according to equations (1) and (6) fromStage 1
Q2�1 = l ∂T∂t� A2�1
Q2�2 =� hcDT � A2�2
�ð7Þ
where A2–1 and A2–2 are the proportions of the contactarea and non-contact area in Stage 2, respectively, and∂T/∂t is the temperature gradient of the contact surfacebetween unit study area and brake pad. Figure 3 showsthe equivalent movement at different stages. Accordingto the geometric relation in Figure 3(a), the areas canbe calculated as
A2�1 =Dd � v2 � t2A2�2 =Dd � l � v2 � t2ð Þ
�ð8Þ
The total input heat flow in Stage 2 Q2 is the sum ofheat transfer of the brake pad and the heat convectionwith the air, which is given as
Q2 =Q2�1 +Q2�2 ð9Þ
The formula of total heat flow loading is given bycombining equations (7)–(9) as
Q2 = l∂T
∂t� Dd � v2 � t2 � hcDT � Dd � l � v2 � t2ð Þ ð10Þ
Stage 3 is the fully slid-in stage in which the unitstudy area of the braking disc has slid into the pad com-pletely, and it has been in contact with the pad com-pletely. At this stage, the heat exchange only includesthermal conduction of the brake pad in the contactarea. And the formula of heat flow loading is
Figure 2. Illustration of displacement gradient circulation method: (a) Position 1, (b) Position 2, (c) unit study area, (d) circular unitand (e) study stage.
Figure 3. Equivalent movement at different stages: (a) thestage for slide-in and (b) the stage for slide-out.
Zhang et al. 5

Q3 = l∂T
∂t� A ð11Þ
Stage 4 is the sliding-out stage in which the unitstudy area of the brake disc has started to slide out ofthe pad, and part of it becomes out of contact with thepad. Thus, the heat exchange includes the thermal con-duction of the braking pad in the contact area and theheat convection of air in the non-contact area. Beingsimilar to Stage 2, the formula of heat flow loading canbe given as
Q4�1 =� hcDT � A4�1
Q4�2 = l∂T
∂t� A4�2
8<: ð12Þ
where A4–1 and A4–2 are the proportions of the non-contact area and contact area in Stage 4, respectively.According to the geometric relation in Figure 3(b), theareas can be calculated as
A4�1 =Dd � v4 � t4A4�2 =Dd � l � v4 � t4ð Þ
�ð13Þ
The formula of total heat flow loading in Stage 4 Q4
is given as
Q4 =� hcDT � Dd � v4 � t4 +l∂T
∂t� Dd � l � v4 � t4ð Þ ð14Þ
Stage 5 is the fully slid-out stage in which the unitstudy area of the brake disc has slid out of the pad com-pletely, and the condition of heat exchange is the sameas Stage 1 as
Q5 =� hcDT � A ð15Þ
The coupling equation of the displacement gradientcirculation method can be obtained in the type of user-defined functions which can be invoked and calculatedby Abaqus.
Case study of thermal–structural couplingbased on displacement gradientcirculation method
The structure of a certain model megawatt wind turbinebrake is taken as an example. The material of the brakedisc is high-thermal conductivity cast iron. Accordingto the motion of the brake disc, the displacement gradi-ent circulation method is used and, considering thechanges of material parameters with temperature andthe influence of heat dissipation, the simplified modelof 3D transient FE for brake friction pair is built. Themodel is subjected to sequential thermal–structural cou-pling solution using Abaqus FE analysis software. Theinitial speed of the brake disc is 2000 rev/min and thebrake pressure load is 17,000N. The heat flux density
function is compiled based on the displacement gradi-ent circulation method. The brake load is applied onthe top surface of the brake pad. The friction heat flowis applied to the friction zone on the bottom surface ofthe brake pad by loading function. The load steps forthermal analysis are set and the thermal elements gener-ated in the temperature field are converted into thestructural elements, so the friction can be loaded.Finally, the *.odb file generated by heat analysis isloaded into the structure analysis file of the brake padas a bulk load. The time steps and the load time arecontrolled by global command flow. The material para-meters required in the analysis are shown in Tables 1–3.
Characteristics of temperature field distribution ofbrake disc
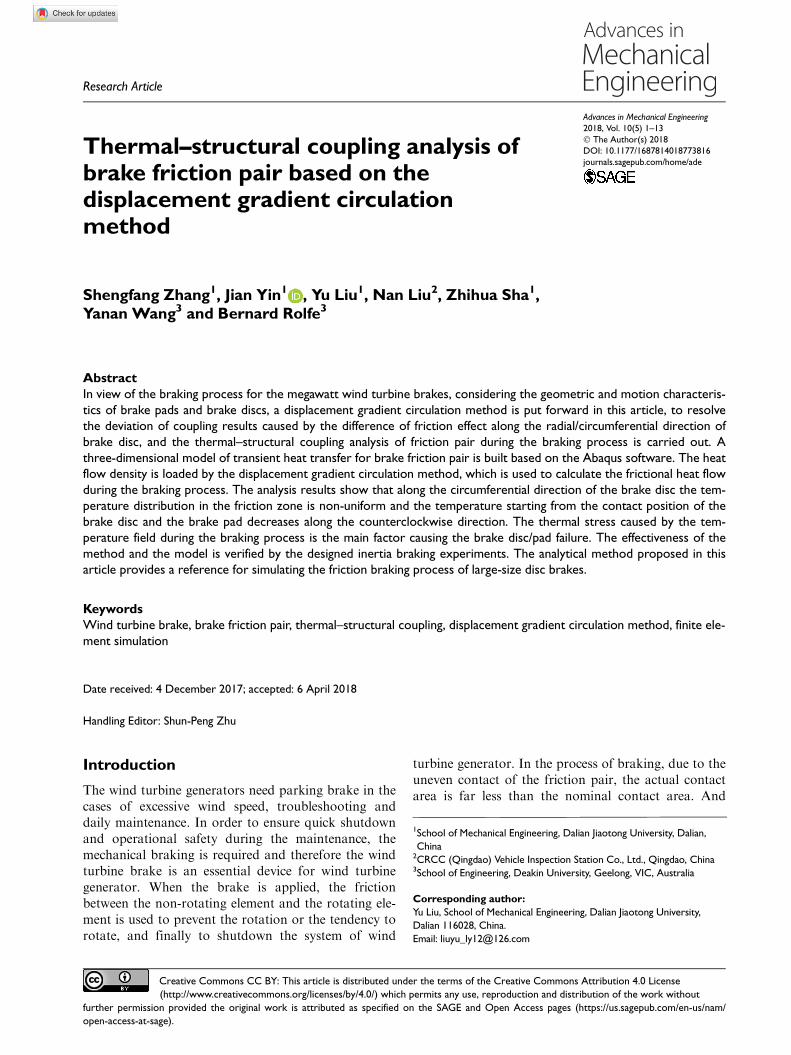
Figure 4 shows the distribution of the transient tem-perature field of the brake disc obtained by the displa-cement gradient circulation method at different times.The brake disc temperature increases initially and thendecreases with the braking process going on. The tem-perature distribution of the brake disc is not uniform.The high-temperature region is concentrated in the fric-tion zone and the non-friction region has almost notemperature rise. The difference between the maximumand the minimum temperature increases gradually. Themaximum temperature is related to the size of the con-tact area of the brake disc/pad. At first, the locationwith a large size of contact area has high temperatureand then the high-temperature zone is concentrated inthe friction zone of the central ring (at the radius ofbrake disc of 265mm). The temperature rise zone nearthe friction zone diffuses towards the centre of the discwith the braking process going on. It can be seen fromFigure 4(a) that an annular temperature zone is pro-duced in the friction zone of the brake disc. A signifi-cant non-uniform temperature distribution is observedalong the circumferential direction of the brake disc.
In order to quantitatively study the temperature dis-tribution in the circumferential direction of the brakedisc shown in Figure 4, 24 equal spacing nodes aretaken along the circumference in the brake disc contactsurface at the radius R1=265mm along the clockwise
Table 1. Material properties of brake pad.
Brake disc material properties Characteristic parameter values
Density (kg/m3) 7250Conductivity (W/(kg �C)) 57Specific heat (J/(kg �C)) 460Expansion (/�C) 1.09 3 10–5
Young’s modulus (Pa) 1.38 3 1011
Poisson’s ratio 0.28
6 Advances in Mechanical Engineering

direction. The radian–temperature curve at 0.1 s brak-ing time is shown in Figure 5. The starting point is thenode closest to the Y-axis on the left side of the Y-axis,and the end point is the node closest to the Y-axis onthe right side of the Y-axis shown in Figure 2. The limitvalue of the temperature difference at this moment isnot large, and the temperature decreases and fluctuatesalong the counterclockwise direction from the left endof the contact zone with brake pad (at 0.12p rad inFigure 5) to the right end of the contact zone (at 1.82p
rad in Figure 5). In addition, the temperature on theleft side of the contact area is slightly higher than thaton the right side.
The friction heat generated during the braking pro-cess in large-megawatt wind brake acts on the frictionzone of the brake disc and is conducted to other partsthrough heat conduction between the brake disc andbrake pad, as well as thermal convection. At the start ofthe braking, there is a temperature difference betweenthe contact area and the non-contact area of the brakedisc, and in the contact area the temperature rises whilein the non-contact area the temperature does notchange. During the braking process, the brake pad isfixed and the brake disc rotates counterclockwise. Thebrake disc rotates about four turns at the time of 0.1 s,so there is a large temperature gradient of the wholecontact surface at that time. This results in the non-uniform temperature distribution along the circumfer-ential direction of the brake disc and further verifies theeffectiveness of the displacement gradient circulationmethod. With the braking process going on, the role ofheat conduction becomes significant. Therefore, thewidth of the annular temperature region in the frictionzone of the brake disc is extended. As the size of thebrake disc is large, the linear velocity of the brake discat the edge is larger than that near the centre. Hence,the frictional heat flow generated at the outer end islarger than that generated at the inner end. However, at
the outer end the heat dissipation condition is betterthan that at the inner end, and the heat convectivetransferred to the air at the outer end of the brake discis more than that at the inner end. The combined effectof the two makes the high-temperature zone on the con-tact surface of the brake disc concentrated in the fric-tional contact area near the middle of the brake discradius.
On the contact surface of the brake disc, along theY-axis direction, the nodes at the radius values ofR1=265mm, R2=295mm, R3=325mm,R4=355mm, as shown in Figure 2(b), are taken,respectively, to draw the node temperature curves asshown in Figure 6 where we can see that the radial tem-perature gradient of the brake disc is very large. Thetemperature of R2 and R3 is high, especially in the mid-dle of the braking process, while the temperature of R1
and R4 is always low. The temperature trends of thenodes R2 and R3 show similar convex shape. In the firsthalf of the braking process, the temperature of the nodeincreases with zigzag fluctuations, after the turningpoint about 2/5th of the whole braking process; in thesecond half, the temperature of the node decreases withzigzag fluctuations, and the upward trend is higherthan the downward trend. The fluctuation frequencydecreases with the progress of the braking process, butthe node temperature at R2 is always higher than thatat R3. The former reaches the maximum temperatureof 782.7�C at about 7 s, while the latter is laggingbehind and reaches its maximum temperature of425.9�C at about 9 s. The node temperature trends atR1 and R4 are similar. They are raised slowly with thebraking process and tend to be modest before the endof the braking. The curves of R1 and R4 change moresmoothly than the curves of R2 and R3, but the nodetemperature of R1 is always higher than that of R4.
It can be seen from Figure 6 that the brake disc con-tact surface undergoes a very complex heat exchange
Table 2. Material properties of brake disc.
Temperature (�C) Conductivity (W/(kg �C)) Specific heat (J/(kg �C)) Young’s modulus (Pa) Expansion (/�C)
100 57 497 0.98 3 1011 1.12 3 10–5
200 74 525 0.88 3 1011 1.20 3 10–5
300 74 574 0.84 3 1011 1.23 3 10–5
400 74 634 0.71 3 1011 1.27 3 10–5
500 74 688 0.67 3 1011 1.30 3 10–5
Table 3. Measured working parameters of brake.
Brake discdiameter
Brake discthickness
Brake padlength
Brake padwidth
Brake padthickness
Initial speed Pressureload
800 mm 40 mm 270 mm 130 mm 26 mm 2000 rev/min 17,000 N
Zhang et al. 7
process during the braking process. The three kinds ofheat exchange effects are also different at differenttimes and different positions. When the nodes R2 andR3 slide into the contact area, they directly contact withthe high-temperature area of the brake pad; in additionto the production of a large amount of frictional heatflow, there is part of heat flow into the nodes from thehigh-temperature zone through the form of heat con-duction, so that the nodes are encountered with thermal
shock, which results in a large temperature gradient.When the nodes R2 and R3 slide out of the contact area,the main heat exchange form is heat dissipationtowards the air. Since the braking process is the decel-eration movement of the brake disc, the heat flow inputof each turn reduces and the heat flow output increases.At first, the heat flux input is greater than the outputand the node temperature rises. Then the input andoutput of heat flow of each node reach equilibrium at
Figure 4. The temperature field distribution at different braking times: (a) at 0.10 s, (b) at 1.00 s, (c) at 5.00 s, (d) at 10.00 s,(e) at 15.00 s and (f) at 19.16 s.
8 Advances in Mechanical Engineering

about 7 and 9 s, respectively, and the node temperaturereaches the maximum value. At last, the heat flow inputis less than the heat flow output, and the node tempera-ture starts to decrease. Because each node contacts withthe brake disc periodically, in a contact period, thenode temperature rises and decreases suddenly forminga zigzag fluctuation in the curve. With the reduction ofrotating speed of the brake disc, the contact periodincreases and the fluctuations tend to be gentler.
The characteristics of stress distribution in brake disc
Using the heat–displacement coupling element ofABAQUS/Standard module, the temperature fieldanalysis elements are converted into the structure fieldanalysis element, so the structure field boundary condi-tions can be loaded. Then the friction load of the fric-tion zone is simulated by defining the contact model ofbrake friction pair. Finally, the thermal analysis result*.odb file is taken into the structure field analysis as abody load.
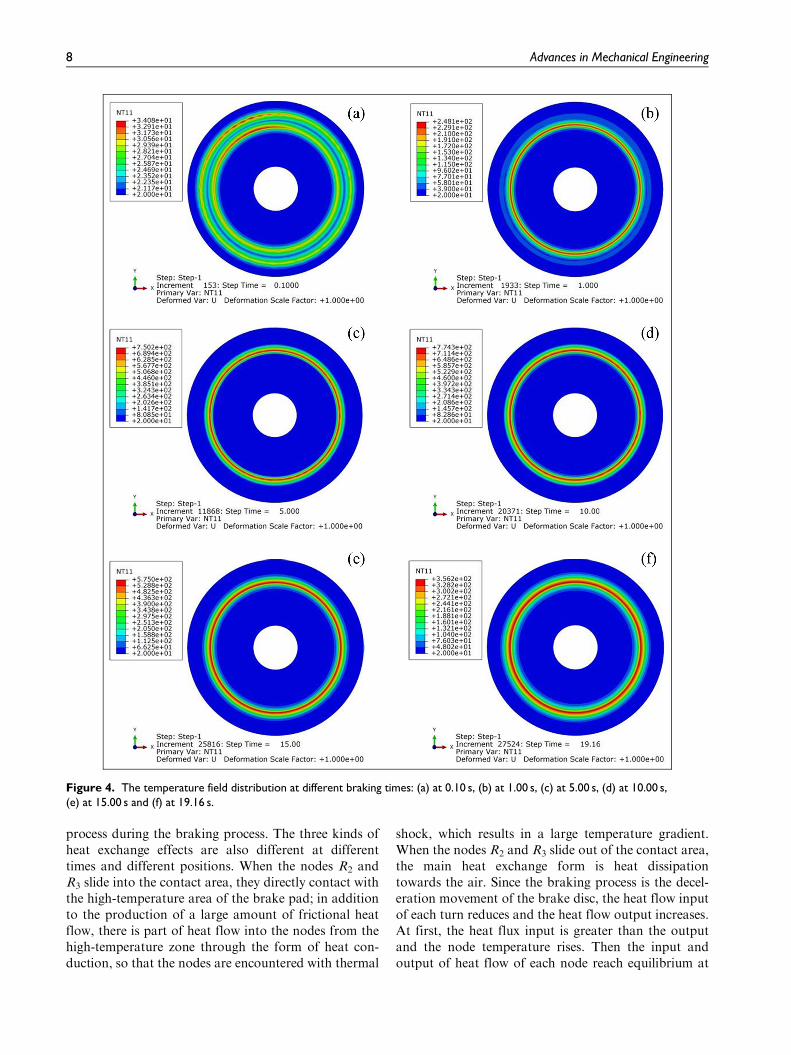
Figure 7 shows the transient equivalent stress distri-bution of the brake disc at different times using displa-cement gradient circulation method. Combined with
Figure 4, it is found that the equivalent stress distribu-tion is similar to the temperature field distribution, thehigh stress area is mainly concentrated in the contactzone with the brake pad, and there is an annular equiv-alent zone in each contour figure. As the braking pro-gresses, the difference of the maximum and theminimum stress, that is, the limit stress difference,increases gradually, and the high-value part of the con-tour has the trend to spread towards both sides alongthe radial direction of the brake disc. At 0.1 s, theequivalent stress diminishes along the counterclockwisedirection starting from the contact position of thebrake disc/pad, similar to the temperature field. Butthere is also a significant difference between stress fieldand temperature field distribution. Initially, the high-stress areas mainly act on the friction zone of the brakedisc and the area near the centre on one side. There arealso some stresses in the rest of the area, but the stressdistribution is uniform. From the equivalent stress con-tour after 1 s, the stress distribution near the centre ofthe brake disc becomes as uniform as the other non-friction zones, but the stress is not zero.
This is because the brake pressure initially applies onthe contact surface; when the rotation of the brake discis driven by the inner ring, the deceleration brakingwould make stress concentration near the centre, pro-ducing mechanical stress. Then the brake disc tempera-ture rises producing thermal stress, and at the time of0.1 s, because the temperature rise is not so large, thecombined action of mechanical stress and thermal stresscan be seen clearly. But after 0.1 s, with the temperaturerising rapidly, the influence of thermal stress on thestress distribution of the brake disc becomes dominantgradually.
It is important to note that in the whole brakingprocess the minimum stress value appears in the annu-lar belt near the friction zone instead of the area nearthe centre of the brake disc; therefore, the stress differ-ence near the position of the minimum radius in thefriction zone is large, which is easy to cause a non-uniform deformation of the material, leading to thefailure on the brake disc. Compared with the influenceof mechanical stress on the stress distribution of thebrake disc in the braking process, the influence of ther-mal stress generated from non-uniform temperaturefield is more significant; therefore, the analysis of ther-mal stress is the main focus to study the problems ofhigh stress cracking and damage of the brake disc.
On the contact surface of the brake disc, along theY-axis direction, the nodes of R1, R2, R3 and R4 whoselocations are the same as above are taken, respectively,to draw the node equivalent stress time-varying curvesas shown in Figure 8, from which it can be seen thatthe curves of nodes R1, R2, R3 and R4 are all the convexcurves. There are also zigzag fluctuations in curves dur-ing the whole braking process, and the zigzag
Figure 5. The temperature change curve along thecircumferential direction of brake disc (0.1 s).
Figure 6. The node temperature of the brake disc in the radialdirection at different times.
Zhang et al. 9

fluctuations in the second half of the braking processare extended especially near the end. The trends of theR2 and R3 curves are similar to those of temperaturechange of the corresponding nodes and the equivalentstress curves are smoother near the peak, while thereare also some pulse fluctuations during the whole pro-cess of braking.
And it should also be noted that the nodes R1 andR3, which are equally spaced either side of the node R2,
have obvious differences in change trends correspond-ing to the node temperature trends. Compared with thenode temperature in Figure 6, the equivalent stress ofthe node R1 is increased. And the trends of the curvesR1 and R3 are similar. The maximum stress of the nodeR1 appears at around 11 s and that of the node R3
appears at around 9 s. At first, the stress curves of thetwo nodes are neck and neck, and after 10 s or so thestress value of the node R1 becomes more than that of
Figure 7. The von Mises stress distribution at different braking times: (a) at 0.10 s, (b) at 1.00 s, (c) at 5.00 s, (d) at 10.00 s,(e) at 15.00 s and (f) at 19.16 s.
10 Advances in Mechanical Engineering

the node R3 till the end. Combined with Figure 6, theradial equivalent stress distribution in the contact sur-face of the brake disc is more uniform than the tem-perature distribution.
From the trend similarity between the radial nodes’stress and time-varying temperature on the contact sur-face, the thermal stress change is crucial to surfacestress changes of the brake disc. The pulse fluctuationof the equivalent stress during the braking process iscaused by the coupling effect of temperature field andstructure field. Because stress is an instantaneous quan-tity, the stress variation of certain node on the brakedisc surface would immediately cause the stress changeof other associated nodes, producing a chain reaction.The stress of the node R2 increases quickly as shown inFigure 8. For the nodes R1 and R3, on top of the influ-ence of thermal stress by themselves, they are alsoaffected by the stress from the node R2. As the radiusof R1 is smaller than that of R3, the node distributionof R1 is denser, which makes it more affected by stresstransfer, so the stress value of the node R1 is greaterthan that of the node R3. In addition, the heat conduc-tion inside the material needs the accumulation of time,which leads to the temperature gradient difference withtime greater than the equivalent stress difference withtime; therefore, the equivalent stress distribution ismore uniform than the temperature distribution alongthe radial direction of the brake disc contact surface.
Experiment of inertial brake test
The braking experiment is carried out in a 1:1 inertialbrake tester, as shown in Figure 9. The test machine
can complete various types of disc brake tests and canbe used for the basic braking performance tests withhigh speed and heavy load for the large-megawatt windbrake products. There are 20 different kinds of brakinginertia for the test bench, the maximum inertia is1000 kgm2 with the inertia differential of 50 kgm2, andthe highest speed of the main motor is 2500 rev/min,which can meet the requirement of the brake test in theemergency working condition.
The sizes of the brake disc and brake pad as well asthe installation position on the test machine are consis-tent with the FE analysis model; the experimental con-ditions are shown in Table 4 and the experiment iscarried out according to the emergency brakingconditions.
Under the conditions shown in Table 4, the test datafrom the sensor are entered into the computer. The testresults of the speed and temperature curves shown inFigure 10 are plotted based on the test data of the con-tact surface at the radius of 325mm of the brake disc.As can be seen from Figure 10, the braking process isapproximately uniformly decelerated and circumferen-tial rotation, and at about 18.8 s the braking process iscompleted. The temperature change curve of the sam-pling point is approximately the convex curve andreaches its highest temperature of about 439�C at 2/5thof the braking process.
Figure 11 shows the comparison between the testresults and simulation results (R3 curve in Figure 6),which shows that the two curves have the similar tem-perature change trend overall. In Figure 11, the
Figure 8. The nodes’ von Mises stress of the brake disc in theradial direction at different times.
Figure 9. Wind turbine brake tester.
Table 4. Test condition parameters.
Environmental temperature Atmospheric pressure Relative humidity Number of friction surfaces Moment of inertia
20�C 101.3 KPa 37% 1 700 kg m2
Zhang et al. 11

braking temperature has not changed at the beginning,and the temperature of the test curve increases gradu-ally after about 1.0 s, while the temperature of thesimulation curve increases after about 0.5 s. This mightbe because the temperature sensor requires a certainamount of response time to sense the temperaturechange. During the braking process, the temperaturerise rate of the simulation result is basically the same asthat of the test result. At 7.1 and 9.1 s, both the simula-tion and test curves reach their highest temperatures ofabout 439�C and 445�C, respectively, and the error ofthe time when the highest temperature appears is about2 s; however, the values of the highest temperatures ofboth curves are very close. After the peak temperature,the two temperature curves begin to decrease, with thesimulation results lagging behind the test results forabout 2 s, which may be caused by the setting error inthe thermal conductivity of the material during thesimulation. It can also be seen from Figure 11 thatthere are zigzag fluctuations in both temperature curvesduring the braking process, which also proves the simi-larity between the simulation and test results.
As the temperature sensors are easily affected by theenvironment, operating conditions and other factors,besides, in the braking experiment, the material proper-ties and loading conditions of the test workpiece are notstrictly consistent with the simulation data, so the mea-sured temperature curve is different from the simulatedtemperature curve at different braking times. Under the
influence of the comprehensive experimental error, thetemperature change trend of the simulation curve isbasically consistent with that of the test curve indicatingthe effectiveness of the simulation model.
Conclusion
Based on the theory of FE method, this article hasstudied the thermal–structural coupling analysis ofbrake disc/pad during the braking process of the mega-watt wind turbine brakes. By fully considering the geo-metry and motion of the brake disc in order to improvethe thermal–structural coupling method, the displace-ment gradient circulation method is proposed for thebrake disc to overcome the deviation of coupling resultscaused by the difference of the friction effect along thecircumferential direction of the brake disc. The simpli-fied model is analysed with thermal–structural couplingand the analysis results reveal the transient distributionand change law of the temperature and equivalentstress of the brake disc/pad in the braking process.Finally, the effectiveness of the method and the ration-ality of the model are verified by the inertial brake test.In this article, the thermal–structural coupling is ana-lysed during the braking process of the brake frictionpair. The law of temperature distribution, changes anddistribution in coupling on thermal deformation for thedisc/pad under high speed and heavy load conditionsare revealed. The results provide solutions for makingefficient large brakes. The following conclusions areobtained:
1. Through the transient FE analysis of the brakefriction pair, the transient distribution andchange law of the temperature and equivalentstress of the brake disc are obtained. Along thecircumferential direction of the brake disc, thetemperature decreases along the counterclock-wise direction starting from the contact positionof the brake disc/pad. This phenomenon shows
Figure 10. Test results from the inertia brake tester: (a) speeddata and (b) temperature data.
Figure 11. Comparison of the test temperature and simulationtemperature versus time.
12 Advances in Mechanical Engineering

that the displacement gradient circulationmethod can effectively simulate the distributiondifference along the circumferential direction ofthe brake disc.
2. The temperature gradient in the radial directionof the brake disc is very large, the maximumtemperature distributes close to the middle ofthe friction zone on the contact surface of thebrake disc, and the temperature rise is small inthe non-friction zone.
3. According to the analysis of the temperaturefield and stress field distributions of the brakedisc, it can be found that the equivalent stressdistribution of the contact surface is more uni-form than that of the temperature. During thewhole braking process, the stress difference nearthe position of the minimum radius in the fric-tion zone is large, which is easy to cause non-uniform deformation of the material.
Declaration of conflicting interests
The author(s) declared no potential conflicts of interest withrespect to the research, authorship and/or publication of thisarticle.
Funding
The author(s) disclosed receipt of the following financial sup-port for the research, authorship and/or publication of thisarticle: The research work was supported by the NationalNatural Science Foundation of China under Grant Nos51475066 and 51675075 and the Natural Science Foundationof Liaoning Province under Grant No. 2015020114.
ORCID iD
Jian Yin https://orcid.org/0000-0002-1844-9303
References
1. Huang J and Gao C. Numerical modeling and analysisof the thermal-structure coupling of the disc brake. ChinJ Mech Eng 2008; 2: 145–151 (in Chinese).
2. Lee K and Barber JR. Frictionally excited thermoelasticinstability in automotive disk brakes. ASME J Tribol
1993; 115: 607–614.3. Zagrodzki P, Lam KB, Bahkali EA, et al. Nonlinear
transient behavior of a sliding system with frictionally
excited thermoelastic instability. ASME J Tribol 2001;
123: 699–708.4. Bolk H. The flash temperature concept. Wear 1963; 6:
483–493.5. Evtushenko OO, Ivanyk EH and Horbachova NV. Ana-
lytic methods for thermal calculation of brakes. Mater
Sci 2000; 36: 857–862.6. Hua L and Xiang S. Study on the transient thermal field
of the air disc brake of vehicle. Lubr Eng 2007; 32: 8–11
(in Chinese).7. Azarkhin A and Barber JR. Transient thermoelastic con-
tact problem of two sliding half-planes. Wear 1985; 102:
1–13.8. Zagrodzki P. Analysis of thermomechanical phenomena
in multidisc clutches and brakes. Wear 1990; 140:
291–308.9. Shahzamanian MM, Sahari BB, Bayat M, et al. Transi-
ent and thermal contact analysis for the elastic behavior
of functionally graded brake disks due to mechanical and
thermal loads. Mater Des 2010; 31: 4655–4665.10. Wang X. The thermal-structural coupling analysis for the
brake of wind-turbine generation. Dalian, China: Dalian
University of Technology, 2010 (in Chinese).11. Belhocine A and Bouchetara M. Thermomechanical
modelling of dry contacts in automotive disc brake. Int J
Therm Sci 2012; 60: 161–170.12. Manjunath TV and Suresh PM. Structural and thermal
analysis of rotor disc of disc brake. Int J Innov Res Sci
Eng Technol 2013; 2: 7741–7749.13. Yevtushenko AA and Grzes P. 3D FE model of frictional
heating and wear with a mutual influence of the sliding
velocity and temperature in a disc brake. Int Commun
Heat Mass Trans 2015; 62: 37–44.14. Grzes P, Oliferuk W, Adamowicz A, et al. The numerical-
experimental scheme for the analysis of temperature field
in a pad-disc braking system of a railway vehicle at single
braking. Int Commun Heat Mass Trans 2016; 75: 1–6.15. Kennedy FE and Tian X. Modeling sliding contact tem-
peratures, including effects of surface roughness and con-
vection. J Tribol 2016; 138: 042101.16. Zhu SP, Liu Q, Lei Q, et al. Probabilistic fatigue life pre-
diction and reliability assessment of a HPT disc consid-
ering load variations. Int J Damage Mech. Epub ahead
of print 30 October 2017. DOI: 10.1177/10567895177
37132.17. Sha Z, Liu N, Liu Y, et al. Study on coupling analysis of
thermal-structure for megawatt wind turbine brakes. J
Dalian Jiaotong Univ 2016; 37: 66–71 (in Chinese).
Zhang et al. 13