performance evaluation case studies of traffic management ...€¦ · performance evaluation case...
TRANSCRIPT

7th Framework Programme Theme 7: TRANSPORT (including AERONAUTICS)
CONDUITS, Coordination Of Network Descriptors for Urban Intelligent Transport Systems Contract n° 218636
I. Kaparias, M.G.H. Bell
Reviewed by: M. Tomassini
Performance evaluation case studies of traffic management and Intelligent Transport Systems
Deliverable No. 3.6
DISSEMINATION LEVEL: PUBLIC
This document is property of the CONDUITS Consortium.
It shall not be copied or distributed without prior authorisation of its Assembly.

Title: Performance evaluation case studies of traffic management and Intelligent Transport Systems Version: v.2
WP no.: 3 Deliverable no.: 3.6
Planned submission date 28/02/2011
Actual submission date 26/03/2012
Document history Version Comments Date Issued by
v.1 Initial submission 23/03/2012 Imperial
v.2 Final submission 26/03/2012 Imperial
Number of pages: 28
Number of annexes: 0
Responsible organisation: Imperial College London Contributing organisation(s): City of Paris – Department of roads and transportation Rome Mobility Agency Technion Technische Universität München
Principal Author(s): Ioannis Kaparias Michael G. H. Bell Contributing Author(s): Patrick Lefebvre Justin Ledoux Valeria Ancidei Chiara di Maio Niv Eden Ayelet Gal-Tzur Marcus Gerstenberger Antonios Tsakarestos Fritz Busch
Quality Control Organisation Date Result
v.1 ISIS 23/03/2012 Fully accepted
v.2 ISIS 26/03/2012 Approved for delivery

CONDUITS Performance evaluation case studies of traffic management and Intelligent Transport Systems Deliverable no 3.6
1
Table of contents
Table of contents .............................................................................................................. 1
Executive summary .......................................................................................................... 2
1 Introduction .............................................................................................................. 4
2 Paris: Bus priority on three bus lines ......................................................................... 6
2.1 Description of the scheme ........................................................................................... 6
2.2 Performance evaluation – Traffic efficiency (Mobility) ............................................... 8
2.3 Performance evaluation – Traffic safety (Accidents) .................................................. 9
2.4 Discussion .................................................................................................................. 10
3 Paris: Construction of a tram line ............................................................................ 11
3.1 Description of the scheme ......................................................................................... 11
3.2 Performance evaluation – Traffic efficiency (Mobility) ............................................. 12
3.3 Performance evaluation – Traffic safety (Accidents) ................................................ 13
3.4 Discussion .................................................................................................................. 14
4 Tel Aviv: New signal strategies ................................................................................ 16
4.1 Description of the scheme ......................................................................................... 16
4.2 Performance evaluation – Traffic efficiency (Reliability) .......................................... 18
4.3 Discussion .................................................................................................................. 19
5 Munich: Speed feedback signs ................................................................................. 20
5.1 Description of the scheme ......................................................................................... 20
5.2 Performance evaluation – Traffic safety (Direct impacts) ........................................ 21
5.3 Discussion .................................................................................................................. 22
6 Rome: General assessment ..................................................................................... 23
6.1 Description of the scheme ......................................................................................... 23
6.2 Performance evaluation – Traffic efficiency (Mobility) ............................................. 24
6.3 Performance evaluation – Traffic efficiency (Reliability) .......................................... 25
6.4 Discussion .................................................................................................................. 26
7 Conclusions ............................................................................................................. 27
References ..................................................................................................................... 28

CONDUITS Performance evaluation case studies of traffic management and Intelligent Transport Systems Deliverable no 3.6
2
Executive summary
Within the framework of the CONDUITS project, Key Performance Indicators (KPIs) have
been developed for four strategic themes of urban traffic management (traffic efficiency;
traffic safety; pollution reduction; and social inclusion), with each theme consisting of
individual sub-themes (e.g. mobility, reliability, operational efficiency and system condition
as part of traffic efficiency). Operative definitions of the KPIs, along with detailed guidance
on their use, have been provided in a comprehensive reference document (D3.5). In this,
final, report, the KPIs are validated with the help of a number of case studies in four
European cities (Paris, Rome, Tel Aviv and Munich), each assessing a different aspect of
urban traffic management applications.
Two case studies are examined in the city of Paris: the implementation of systems granting
priority to buses at signalised junctions on three bus lines (26, 91 and 96), and the
construction of a new tram line (T3) on the “Boulevard des Maréchaux Sud” corridor. For
both case studies, a before- and after-analysis is carried out in order to quantify the impacts
of the two schemes in terms of mobility and traffic accidents. Using the appropriate KPIs fed
by data from the city, it is found that the bus priority scheme resulted in clearly better
public transport mobility for the three bus lines (lower travel times) and in marginally lower
private transport mobility on the corresponding road stretches, thus indicating an improved
overall mobility on the affected network parts. Similar results are obtained for the tram
scheme, with improved overall mobility being recorded. As concerns the accidents
assessment, it appears that the bus priority measures have been accompanied by a clear
reduction in the casualty rate of deaths and slight injuries, but by a marginal increase in the
rate of serious injuries, mainly involving pedestrians and cycles. The overall accidents rate,
however, appears to remain constant. Similar trends are observed in the casualty rates of
the tram scheme, where the slight injuries rates.
The reliability performance of the introduction of advanced traffic signalling strategies is
evaluated in the Tel Aviv case study. Using congestion occurrence and duration data from
the Ha’Shalom Expressway, it is found that the new signal programmes resulted in
significantly improved reliability, additionally supported by travellers’ perceptions.
Nevertheless, it is found through continuous monitoring that the index value has had a
decreasing tendency, becoming stable within a year following the implementation of the

CONDUITS Performance evaluation case studies of traffic management and Intelligent Transport Systems Deliverable no 3.6
3
scheme.
A safety performance evaluation is conducted in a case study in the city of Munich, where
the so-called direct safety impact of the installation of speed feedback dynamic message
signs for a certain test period is measured through an appropriate KPI. It is found that the
introduction of the signs resulted in a reduced speed warnings per vehicle value compared
to before, indicating an improvement in safety during the test period. However, the value
has returned to its previous level after the removal of the signs.
A different approach is adopted, finally, in the case study of the city of Rome, where a large-
scale performance evaluation of the various techniques and ITS technologies that have been
implemented within the framework of the Mobility Control Centre is conducted. Using
travel times between representative zones throughout the city of Rome, defined as the area
lying inside the “Grande Raccordo Anulare” (GRA) orbital motorway, as well as congestion
occurrence and duration data, a general performance assessment is carried out in terms of
mobility and reliability. The underlying conclusion of the former is that, as expected, private
transport mobility is better than public transport mobility, with index values ranging at
similar levels to the Paris case study. In the case of the latter, the city of Rome is found to
have a very high reliability index, with very few congestion occurrences as a whole. This,
however, may be attributed to the fact that the potentially unreliable and congested peak
hours are compensated by the long uncongested off-peak (night time) hours, highlighting
the need for a time-based reliability performance evaluation of the transport network.
Through the conduct of the case studies, it is concluded that the KPIs are easy to apply and
require already available data, thus forming a very useful evaluation tool for assisting
decision makers in the field of urban traffic management and ITS.

CONDUITS Performance evaluation case studies of traffic management and Intelligent Transport Systems Deliverable no 3.6
4
1 Introduction
The fact that cities today face a number of common problems when implementing traffic
management measures, and particularly Intelligent Transport Systems (ITS), has been
highlighted in the earlier stages of the CONDUITS project. It has also been realised that cities
often find it difficult to objectively assess the effects of their decisions and make use of
lessons learnt from urban traffic management examples elsewhere, as there is a
methodological gap in terms of a widely-accepted performance evaluation framework [1].
It has been the primary objective of the CONDUITS project to bridge this gap by defining and
testing a performance evaluation framework, consisting of a set of Key Performance
Indicators (KPIs). The first part of this work, entailing the methodological definition, has
recently been completed, with new KPIs having been developed for four themes of traffic
management (traffic efficiency; traffic safety; pollution reduction; and social inclusion and
land use). Operative definitions for the developed KPIs have been provided, with the
outcomes of the development stage being comprehensively documented in the CONDUITS
deliverable D 3.5 [2].
The present deliverable reports on the outcomes of the second part of the work, i.e. the
testing and validation of the new performance evaluation framework. The objective is to
apply the new KPIs to specific case studies of European cities, in order to demonstrate their
usefulness and applicability. Focussing on the themes of traffic efficiency and traffic safety, a
number of selected KPIs, five case studies in four European cities are conducted, namely in
Paris, Tel Aviv, Munich and Rome.
In Paris, a performance evaluation for the case studies of the implementation of systems
granting priority to buses at signalised junctions, and of the construction of a new tram line,
is conducted. For both case studies, a before- and after-analysis is carried out in order to
quantify the impacts of the two schemes in terms of mobility and traffic accidents. In Tel
Aviv, the impact of the introduction of advanced traffic signalling strategies is assessed in
terms of reliability. In Munich, the direct safety impact of the installation of speed feedback
dynamic message signs for a certain test period is measured. Finally, in Rome a different
approach is adopted, where a large-scale performance evaluation of the various techniques
and ITS technologies that have been implemented within the framework of the Mobility

CONDUITS Performance evaluation case studies of traffic management and Intelligent Transport Systems Deliverable no 3.6
5
Control Centre is conducted in terms of mobility and reliability.
The report is structured as follows. Chapter 2 documents the procedure and results of the
bus priority case study in Paris, while Chapter 3 has the same structure and presents the
results of the second Paris case study, dealing with the construction of tram line T3. Chapter
4 then reports on the results of the reliability assessment in the Tel Aviv case study, Chapter
5 documents the findings of the safety assessment in Munich, and Chapter 6 describes the
large-scale mobility and reliability assessment in the city of Rome. Finally, Chapter 7
summarises the conclusions of the report.

CONDUITS Performance evaluation case studies of traffic management and Intelligent Transport Systems Deliverable no 3.6
6
2 Paris: Bus priority on three bus lines
The first case study conducted involves the assessment of the implementation of a system
granting priority to public transport vehicles at traffic signals on three bus lines in Paris.
Assessment in terms of traffic efficiency and traffic safety is carried out. In the next section,
a description of the scheme is first given, followed by an account of the assessment
conducted and the results obtained.
2.1 Description of the scheme
In 2003 the Paris public transport authority (“Syndicat des transports d'Île-de-France (STIF)”)
investigated the potential application of a system granting priority to buses at traffic signals,
which resulted in the compilation of a set of technical specifications to traffic managers. The
investigation was followed up by a pilot experiment, during which bus priority was
implemented at four intersections in the city of Paris, the encouraging results of which led
to the decision of deploying the system on several bus lines. Installation work on lines 26, 91
and 96, the location of which within the inner city of Paris is shown in Figure 1, began in
2006.
Figure 1: Paris bus lines 26, 91 and 96 (Source: RATP)
The system employed was one of dynamic (on-demand) priority, whose concept of
operation relies on radio transmissions at 5-second intervals, through which the bus
communicates to the signal controller its current position and anticipated time of approach,

CONDUITS Performance evaluation case studies of traffic management and Intelligent Transport Systems Deliverable no 3.6
7
as shown in Figure 2. The priority system is managed by a specialised computer (the “PC
Véga”), whose architecture is shown in Figure 3.
Figure 2: Bus priority operation
Figure 3: Bus priority system architecture
Approximately 150 signalised junctions were affected, involving a total cost of installation in
excess of €3 million. It was anticipated that the application of the system on the three lines
would result in an average travel time saving of the order of 30 seconds per passenger.

CONDUITS Performance evaluation case studies of traffic management and Intelligent Transport Systems Deliverable no 3.6
8
Given an average volume of 10 million passengers per year on each of the lines, the
anticipated saving would correspond to a saving of one vehicle on each line for the bus
operating company.
2.2 Performance evaluation – Traffic efficiency (Mobility)
For the assessment of the mobility of travellers as a result of the introduction of the priority
measures each of the three bus lines has been broken up into four route segments of given
length per direction, resulting in eight route segments per line and 24 route segments in
total. Average peak-time bus travel times for each of the route segments have been
measured over periods before and after the implementation of the priority, in order to
identify travel time gains. Furthermore, a number of route segments of given length have
been identified on the private transport network as being affected by the priority scheme
(three for line 26, eight for line 91 and six for line 96, resulting in a total of 17), for which
average vehicle traffic travel times were measured for the same periods before and after
the implementation.
The mobility KPI, as defined in Equation (1) in [2], is used to perform an assessment of the
overall impact of the scheme in terms of mobility on each of the lines, for public and private
transport separately, taking equal weights for each of the route segments.
Table 1: Paris bus priority mobility assessment results
IMOB
(min/km)
Public transport Private transport Overall
Before After Change Before After Change Before After Change
Line 26 4.46 4.25 -4.82% 4.46 4.65 4.30% 4.46 4.37 -2.09%
Line 91 4.63 4.33 -6.55% 5.25 5.05 -3.89% 4.82 4.54 -5.68%
Line 96 5.03 4.67 -7.13% 2.71 3.02 11.55% 4.33 4.17 -3.63%
TOTAL 4.71 4.42 -6.21% 4.21 4.26 1.14% 4.56 4.37 -4.17%
The results of the mobility assessment are shown in Table 1. As can be seen, the priority
measures appear to have resulted in a reduction of the public transport travel rate values
(and hence in improved public transport mobility) for all three lines. Consequently, an
overall decrease from 4.71 min/km to 4.42 min/km for public transport is recorded across
the three lines, corresponding to an improvement (reduction) of 6.21% in public transport
mobility. On the other hand, the priority measures seem to have negatively affected private
transport mobility on lines 26 and 91, resulting in increased average travel rates, but not on
line 91, for which slightly improved private transport mobility is recorded. Consequently, the

CONDUITS Performance evaluation case studies of traffic management and Intelligent Transport Systems Deliverable no 3.6
9
overall private transport mobility has seen a marginal deterioration of 1.14%, expressed as a
slight increase in the average travel rate from 4.21 to 4.26 min/km.
In order to determine the overall change in mobility, the weights wPV = 0.3 and wPT = 0.7
have been set, following consultation with a group of experts from the Municipality of Paris.
As such, the overall mobility index is evaluated for the three lines separately, as well as for
the three lines together, and the results are included in Table 1. As can be seen, an
improvement (reduction) in the total mobility index on all the lines is found, corresponding
to an average travel rate saving of 0.19 min/km, i.e. 4.17%.
2.3 Performance evaluation – Traffic safety (Accidents)
In the evaluation of the bus priority scheme in terms of accidents, only data from line 91 has
been available, split in four segments per direction (i.e. a total of eight route segments).
Namely, the numbers of casualties due to road traffic accidents over four-year periods
before and after implementation of the priority scheme have been supplied, categorised
according to severity (death, serious injury, slight injury) and road user type (pedestrian,
cycle, 2-wheeler, 4-wheeler). In addition, average daily vehicle traffic flows have been
obtained for the respective segments and periods.
The accidents KPI, as expressed by Equation (4) in [2], is used to perform a safety
assessment of the priority system on line 91, for the different severity categories separately,
taking equal weights for each of the route segments. Following a consultation with a group
of experts from the Municipality of Paris, the weights for casualties of the different road
user groups have been set to wcyc = 0.25, w2w = 0.2, w4w = 0.15, and wped = 0.4 for cycles, 2-
wheelers, 4-wheelers and pedestrians respectively.
Table 2: Safety assessment results for Paris bus line 91
IACD
(casualties/million-veh)
Weights Deaths Serious injuries Slight injuries Overall
Before After Before After Before After Before After
Cycles 0.25 0 0 0 2 3 5 0.02 0.05
2-wheelers 0.2 0 0 3 3 71 36 0.40 0.24
4-wheelers 0.15 2 0 0 1 27 20 0.32 0.12
Pedestrians 0.4 1 1 6 11 51 51 0.42 0.50
TOTAL 1 0.07 0.04 0.31 0.63 4.10 3.57 0.30 0.28

CONDUITS Performance evaluation case studies of traffic management and Intelligent Transport Systems Deliverable no 3.6
10
The results of the accidents assessment are shown in Table 2. As can be seen, the priority
measures on bus line 91 appear to have resulted in marginally improved casualty rates for
deaths, and in notably improved slight injuries rates; corresponding occurrences per million
vehicles values seem to have dropped from 0.07 to 0.04 and from 4.1 to 3.57, respectively.
However, it can also be seen that these findings are accompanied by a worse serious injuries
rate, with the increased number of pedestrian and cycle serious injuries inducing a rise of
the corresponding index value from 0.31 to 0.63 occurrences per million vehicles.
Compiling the three partial indices to determine the overall change in casualty levels (with
the help of the experts the weights for the severity levels have been set to wdeath = 0.85, wser
= 0.1 and wsli = 0.05 for deaths, serious injuries and slight injuries respectively) per road user
category and overall, it can be seen that the accidents rates for cycles and pedestrians have
risen, while the ones of 2- and 4-wheelers have dropped. As a result, the total accidents
index has risen marginally, from 0.30 to 0.28 casualties per million vehicles.
2.4 Discussion
Given that the introduction of bus priority is a measure primarily aimed at improving public
transport mobility, the results obtained from the mobility assessment are in line with what
would be expected, i.e. better mobility for public transport without deterioration of private
transport mobility, and consequently better overall mobility on all three bus lines.
Accidents, on the other hand, appear to have stayed at fairly constant levels as a whole,
with the increased index values of serious injuries and pedestrians being largely attributed
to the fact that the smaller casualty occurrence numbers of those categories are weighted
more heavily than the higher occurrence numbers of slight injuries.
It should be noted that the priority measures have also resulted in a drop in vehicle traffic
volume along line 91, which may have further contributed to increases in accident index
values. Nevertheless, the study highlights a potential “collateral damage” of the bus priority
scheme, and it may be worth further investigating the circumstances of the pedestrian
casualties in question.

CONDUITS Performance evaluation case studies of traffic management and Intelligent Transport Systems Deliverable no 3.6
11
3 Paris: Construction of a tram line
The second case study conducted is concerned with the assessment of the construction of a
new tram line in Paris. As in the previous case study, assessment in terms of traffic efficiency
and traffic safety is carried out, and following the same structure, a description of the
scheme is first given, followed by an account of the assessment conducted and the results
obtained.
3.1 Description of the scheme
The construction of a tram line on the “Boulevards des Maréchaux Sud” corridor in the
southern part of the city of Paris (Figure 4) has been the objective of numerous studies, and
prompted the complete redevelopment of the corridor, that is the redesign of the entire 40-
metre wide urban expressway. The final study concluded on the implementation of the tram
line on a separate track alongside vehicle traffic, with full priority at traffic signals. Feasibility
studies were carried out since 2000, works started in 2003 and operation of the tram line T3
began on 16 December 2006.
Figure 4: Paris tram line T3 (source: RATP)

CONDUITS Performance evaluation case studies of traffic management and Intelligent Transport Systems Deliverable no 3.6
12
Apart from the complete redesign of the public space, one of the reasons for the
introduction of the T3 tram line was to find a way to enhance public transport supply, which
at the time was relying on a bus line with a frequency of 6 minutes. The entire project cost
nearly €320 million.
The main objectives of the construction of the T3 line were: to address the increasing need
for circumferential surface transport; to consolidate the link between the various existing
transport modes in the area; to improve the local transport supply in the area and reinforce
the link with the bordering municipalities; to revamp the urban streetscape of the
“Boulevards des Maréchaux Sud” corridor; and to facilitate daily life (ensure progress and
growth, organise commercial deliveries and residential parking, etc).
Focussing on the system granting priority at signalised intersections, its concept of
operation relies on the detection of the tram vehicle before the intersection through
magnetic loops and numerical counters, which enable the determination of the
approximate time of arrival at the intersection. Hence, the signal controller optimises the
phases of all vehicle streams of the junction, in order to provide a green phase to the tram
upon its arrival. The objective of the priority system is to ensure a commercial speed of 20
km/h, a daily passenger throughput of 100,000, and a line frequency of 4 minutes.
3.2 Performance evaluation – Traffic efficiency (Mobility)
For the assessment of the mobility of travellers as a result of the construction of T3, each
direction of the line is treated as a single segment, thus resulting in two route segments in
total. Average peak-time tram travel times for each direction have been measured following
the construction of the tram; however, no data are available for the pre-construction
period, i.e. for the bus line that was replaced by T3, which means that public transport
mobility can only be evaluated for the post-construction period. On the other hand, for the
respective route segments on the private transport network affected by the tram line (two
in total, i.e. one per direction), average vehicle traffic travel times were calculated from
measured average speeds for periods before (2002) and after the construction (2007), thus
making it possible to identify travel time gains/losses.
The mobility KPI, as defined in Equation (1) in [2], is used to perform an assessment of the
overall impact of the tram line construction in terms of mobility, for public and private
transport separately.
CONDUITS Performance evaluation case studies of traffic management and Intelligent Transport Systems Deliverable no 3.6
13
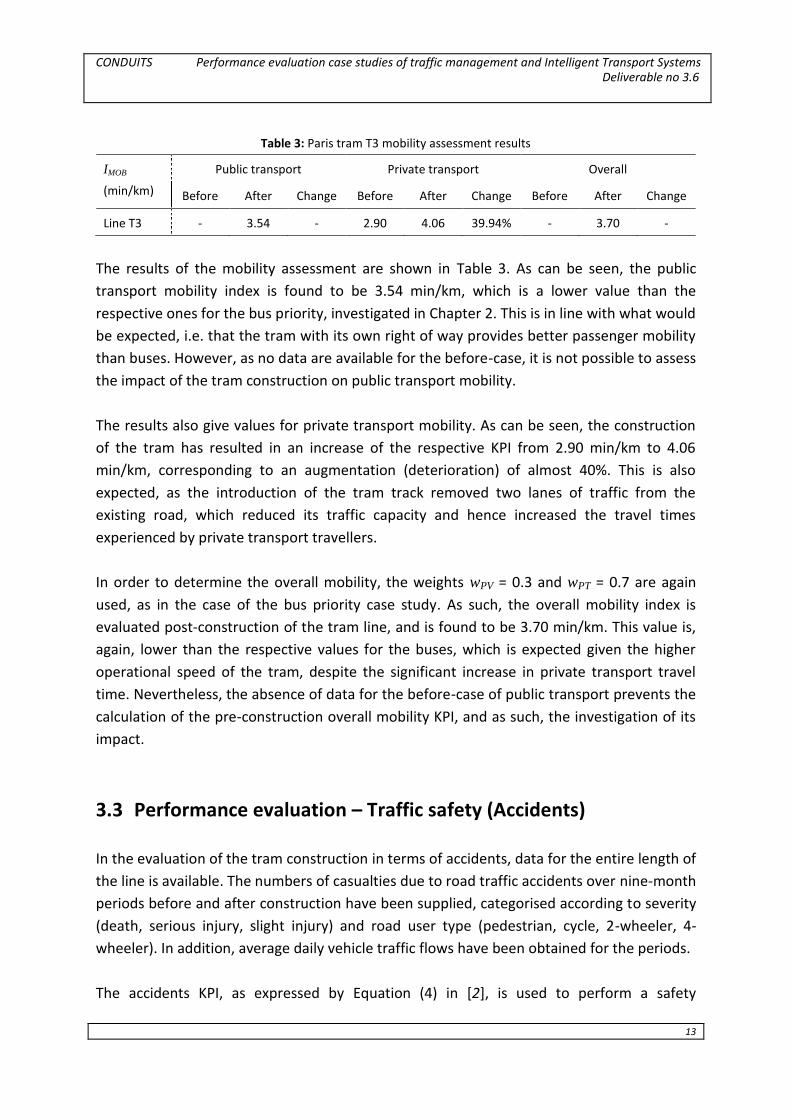
Table 3: Paris tram T3 mobility assessment results
IMOB
(min/km)
Public transport Private transport Overall
Before After Change Before After Change Before After Change
Line T3 - 3.54 - 2.90 4.06 39.94% - 3.70 -
The results of the mobility assessment are shown in Table 3. As can be seen, the public
transport mobility index is found to be 3.54 min/km, which is a lower value than the
respective ones for the bus priority, investigated in Chapter 2. This is in line with what would
be expected, i.e. that the tram with its own right of way provides better passenger mobility
than buses. However, as no data are available for the before-case, it is not possible to assess
the impact of the tram construction on public transport mobility.
The results also give values for private transport mobility. As can be seen, the construction
of the tram has resulted in an increase of the respective KPI from 2.90 min/km to 4.06
min/km, corresponding to an augmentation (deterioration) of almost 40%. This is also
expected, as the introduction of the tram track removed two lanes of traffic from the
existing road, which reduced its traffic capacity and hence increased the travel times
experienced by private transport travellers.
In order to determine the overall mobility, the weights wPV = 0.3 and wPT = 0.7 are again
used, as in the case of the bus priority case study. As such, the overall mobility index is
evaluated post-construction of the tram line, and is found to be 3.70 min/km. This value is,
again, lower than the respective values for the buses, which is expected given the higher
operational speed of the tram, despite the significant increase in private transport travel
time. Nevertheless, the absence of data for the before-case of public transport prevents the
calculation of the pre-construction overall mobility KPI, and as such, the investigation of its
impact.
3.3 Performance evaluation – Traffic safety (Accidents)
In the evaluation of the tram construction in terms of accidents, data for the entire length of
the line is available. The numbers of casualties due to road traffic accidents over nine-month
periods before and after construction have been supplied, categorised according to severity
(death, serious injury, slight injury) and road user type (pedestrian, cycle, 2-wheeler, 4-
wheeler). In addition, average daily vehicle traffic flows have been obtained for the periods.
The accidents KPI, as expressed by Equation (4) in [2], is used to perform a safety

CONDUITS Performance evaluation case studies of traffic management and Intelligent Transport Systems Deliverable no 3.6
14
assessment of the construction of tram line T3, for the different severity categories
separately, taking equal weights for each of the route segments. Again, the same weights
for casualties of the different road user groups as for the buses are used, i.e. wcyc = 0.25, w2w
= 0.2, w4w = 0.15, and wped = 0.4 for cycles, 2-wheelers, 4-wheelers and pedestrians
respectively.
Table 4: Safety assessment results for Paris tram line T3
IACD
(casualties/million-veh)
Weights Deaths Serious injuries Slight injuries Overall
Before After Before After Before After Before After
Cycles 0.25 0 0 1 0 6 7 0.09 0.15
2-wheelers 0.2 0 0 5 7 67 54 0.83 1.46
4-wheelers 0.15 0 0 1 0 67 19 0.74 0.41
Pedestrians 0.4 1 0 5 1 32 14 0.63 0.34
TOTAL 1 0.09 0.00 0.73 0.77 8.12 9.03 0.55 0.53
The results of the accidents assessment are shown in Table 4. As can be seen, the
construction of T3 appears to have resulted in a marginally improved casualty rate for
deaths (given that no death is recorded after the construction, as opposed to one death
observed before), which is, however, accompanied by worse serious and slight injuries
rates, with slightly increased accident occurrences for 2-wheeler serious injuries and cyclist
slight injuries. KPI values seem to have increased from 0.73 to 0.77 occurrences per million
vehicles for serious injuries, and from 8.12 to 9.03 occurrences per million vehicles for
serious injuries for slight injuries.
Compiling the three partial indices to determine the overall change in casualty levels (again
the weights for the severity levels are set to wdeath = 0.85, wser = 0.1 and wsli = 0.05 for
deaths, serious injuries and slight injuries respectively) per road user category and overall, it
can be seen that the accidents rates for cycles and 2-wheelers have risen, while the ones of
4-wheelers and pedestrians have dropped. As a result, the total accidents index has
dropped marginally, from 0.55 to 0.53 casualties per million vehicles.
3.4 Discussion
Given that the construction of a tram is primarily aimed at improving public transport
mobility, the results obtained from the mobility assessment (through the available data) are
in line with what would be expected, i.e. significantly better public transport mobility, with a

CONDUITS Performance evaluation case studies of traffic management and Intelligent Transport Systems Deliverable no 3.6
15
deterioration of private transport mobility, and consequently good overall mobility on the
tram line corridor (better than in the bus priority case study).
Accidents, on the other hand, appear to have stayed at fairly constant levels as a whole,
though some substantial increases in the indices for slight injuries, pedestrians and 2-
wheelers are recorded, despite overall drops in absolute accident numbers. It should be
noted, though, is that the calculated accident rates for the after-case are accompanied by a
significant decrease in traffic flow following the construction of the tram, due to the
rearrangement of the public space and the reduction of the traffic capacity of the corridor.
This explains why the generally observed drop in absolute accident occurrences is coupled
with increases in the respective KPI values.

CONDUITS Performance evaluation case studies of traffic management and Intelligent Transport Systems Deliverable no 3.6
16
4 Tel Aviv: New signal strategies
The third case study involves the assessment of the implementation of new traffic signal
control strategies in Tel Aviv. Assessment in terms of traffic efficiency is carried out, and in
particular of reliability, and following the same structure as the previous case studies, a
description of the scheme is first given, followed by an account of the assessment
conducted and the results obtained.
4.1 Description of the scheme
The city of Tel Aviv is the nucleus of the largest metropolitan area of Israel and as such it is
the main cultural and financial centre of the country. Most of the traffic in Tel Aviv
originates from towns in the vicinity and outside the metropolitan area. The majority of this
traffic enters the city during the morning peak period and leaves the city during the
afternoon/evening peak period.
In order to preserve its predominant role as a major city, Tel Aviv strives to improve the
quality of all transport modes and to reduce the congestion and environmental impacts of
traffic. One of the major measures applied by the city is a recurrent update of its signal
strategies library. Each year thousands of signal strategies updates are conducted, mostly
aiming at resolving congestion and at implementing the municipal policy.
At the end of 2008 as a result of a congestion levels’ analysis which took place at the
Ha'shalom arterial (Figure 5), the city decided to update the afternoon peak period signal
strategies along the entire arterial. The Ha'shalom arterial serves as the main entrance and
exit route for travellers to and from the south-eastern cities. The extension of the Ha'shalom
arterial stretches beyond the city of Tel Aviv and leads to Highway No. 4, one of the busiest
highways in the state.
The results of the congestion analysis on the Ha'shlom arterial are presented in Figure 8,
where the X-Axis denotes the time of day and the Y-Axis denotes the date. The plotted area
in Figure 8 is the level of congestion, where blue dots represent saturated flow and red dots
represent congestion. As can be observed in Figure 8, the congestion mostly occurs in the

CONDUITS Performance evaluation case studies of traffic management and Intelligent Transport Systems Deliverable no 3.6
17
afternoon/evening peak. In the end of 2008 the municipality of Tel Aviv redesigned the
signal strategies along the entire arterial according to the traffic Level of Service (LOS) of the
arterial and the crossing streets. The new signal strategies were downloaded to the signal
controllers at the beginning of February 2009.
Figure 5: Tel Aviv map (Ha'shalom Arterial in the blue rectangle)
Figure 6: Congestion Analysis at Ha'shalom Arterial

CONDUITS Performance evaluation case studies of traffic management and Intelligent Transport Systems Deliverable no 3.6
18
4.2 Performance evaluation – Traffic efficiency (Reliability)
For the assessment of the traffic efficiency reliability as a result of the newly introduced
signal strategies, the congestion duration was derived from the LOS algorithm integrated in
the Tel Aviv traffic management System (AVIVIM). The LOS calculation of AVIVIM is based on
detector measurements of volume and occupancy, retrieved from the signal controller at
the end of each signal cycle. The AVIVIM LOS algorithm combines the detector data and the
green splits in order to determine the existing LOS at each of the links in the network. The
AVIVIM LOS calculation provides discrete results: free flow, saturated flow and congestion.
The reliability KPI, as defined in Equation (2) in [2], is used to perform an assessment of the
overall impact of the new signal strategies in terms of mobility reliability. The Ha'shlom
arterial serves very few bus, lines, thus the KPI is calculated only for the private traffic.
The wl parameter in Equation (2) in [2] has been assigned according to the following logic:
• Inner links relative importance – the area is composed of a main arterial, a single
crossing minor arterial and several crossing local roads. Links in the main and minor
arterials were assigned with weights of 3 – 5 and local roads were assigned with
weights of 2 – 4.
• Seasonal importance – the Ha’shalom arterial is subjected only to the general
seasonal effects (i.e., weekends, school leave, etc.), as the example presented is in a
single season of the year.
• Time importance – the day was split up into five segments: midnight to 5 AM, 6 AM
to 10 AM, 11 AM to 1 PM, 2 PM to 7 PM and 8 PM to midnight. Such a fragmentation
reflects the basic schedule of the traffic management centre in Tel Aviv. The links
were divided into two categories: arterial/minor and inbound/outbound to the
Central Business District (CBD). Links along the main arterial to both directions were
given the weight 5 for four times of the day.
o Links to the major/minor arterial:
- Links leading to the CBD were assigned a weight of 3 during the
afternoon peak.
- Links leading out of the CBD were assigned with a value of 3 during
the morning peak.
o Links to the local roads:
- Links leading to the CBD were assigned a weight of 4 in the morning
peak, 2 in the afternoon peak and 3 in the rest of the time frames.
- Links leading out of the CBD were assigned with a value of 2 in the

CONDUITS Performance evaluation case studies of traffic management and Intelligent Transport Systems Deliverable no 3.6
19
morning peak, 4 in the afternoon peak and 3 in the rest of the time
frames.
The reliability KPI during the afternoon/evening peak period between 15:00 – 20:00 was
calculated to be 0.8 in January 2009 and 0.9 in February 2009, representing an increase of
nearly 10%.
4.3 Discussion
The increase in the mobility reliability as captured by the KPI was supported by the general
perception of representative travellers in the arterial. Further analysis conducted later
showed that the mobility reliability KPI remained at the same improved level for six months.
By the end of 2009, the mobility reliability KPI dropped below 0.8 but with an increased
throughput of 15%.

CONDUITS Performance evaluation case studies of traffic management and Intelligent Transport Systems Deliverable no 3.6
20
5 Munich: Speed feedback signs
In the case study of the city of Munich, a safety assessment of the introduction of dynamic
speed feedback signs in two locations is carried out. Assessment in terms of direct safety
impacts is carried out, and following the same structure, a description of the scheme is first
given, followed by an account of the assessment conducted and the results obtained.
5.1 Description of the scheme
Dynamic feedback signs are widely used to provide drivers with information on their current
driving behaviour. They aim at encouraging potential violators to obey to traffic regulations
without applying hard measures of enforcement. There is a vast variety of applications
targeting different aspects of driving behaviour, and the most common ones are related to
respecting speed limits and providing either quantitative or qualitative information.
In the city of Munich feedback signs for speed limitations were tested for a defined period
of time. The signs were installed at two locations near a school creating a significantly large
number of children crossing the street at random spots. The speed limits at the two
locations (Paosostrasse and Friedenspromenade) were 30 km/h and 50 km/h respectively.
The application was measuring the current speed of cars in both directions by the means of
laser detectors integrated in the signs’ bases. In case of a speed limit violation the signs gave
the message “Slow down!” in red letters to the driver. If the speed limit was respected the
signs showed “Thank you!” in green letters. Qualitative information was preferred over
quantitative, as it has been observed that the display of the current speed value led to
occurrences of “high scoring” during testing of such systems.
Through the sensors used for operating the signs, a sufficient database was provided to
calculate the KPI for the direct safety impact. The data consisted of
• Time of a vehicle passing the location
• Speed of the vehicle

CONDUITS Performance evaluation case studies of traffic management and Intelligent Transport Systems Deliverable no 3.6
21
Both sets were provided separately for each street and each direction. The data were
collected for a period of four weeks before the installation of the signs, during the complete
testing period of four weeks and for four additional weeks after the removal of the signs.
5.2 Performance evaluation – Traffic safety (Direct impacts)
For the evaluation of the application the KPI presented in equation (7) in [2] is used. The
information needed for the calculation consists of the daily traffic volume (DTV), the
number of detected critical situations (CS) and a weighting factor w for each link.
For this case study the DTV could be calculated for an average day through by using the
provided number of vehicles per day. Critical situations concerning the targeted system are
the average speed limit violations per day. They could be extracted from the speed record of
the vehicles passing the test site.
The weighting of the links is not an issue related with the ITS application and thus it cannot
be calculated from the data provided. It is moreover a matter of the respective values and
targets of the local policy. For this exemplary calculation, a weighting factor of 0.6 is used
for the major road (speed limit 50 km/h) and 0.4 is given to the subordinate street (speed
limit 30 km/h). Table 5 shows the results of the KPI calculation separately for each link and
each direction.
Table 5: Traffic safety assessment results for each link
IDS (actions/veh) Before During After
Paosostrasse (eastbound) 0.45 0.26 0.37
Paosostrasse (westbound) 0.73 0.48 0.70
Friedenspromenade (northbound) 0.15 0.12 0.15
Friedenspromenade (southbound) 0.29 0.18 0.30
By using the individual link weights a combined indicator is also calculated for the entire
field test, and the results are presented in Table 6.
Table 6: Traffic safety assessment results for all links
IDS (actions/veh) Before During After
Munich (Paosostrasse-Friedenspromenade) 0.37 0.24 0.35

CONDUITS Performance evaluation case studies of traffic management and Intelligent Transport Systems Deliverable no 3.6
22
5.3 Discussion
An analysis of the KPI results shows a general trend in the influence of driving behaviour
through feedback signs. A certain safety level that pre-existed is significantly improved by
the application in a short period of time. After the removal of the application safety levels
decrease instantly but get stabilised in a better level than before the installation of the
signs. This trend can be observed in the total KPI values as well as in most of the single link
values.
A closer look at the individual results, however, reveals some differences in the
performance of each link. The major road (Friedenspromenade) shows an anisotropic
behaviour with safety levels northbound being much better but yet showing less
improvement than the ones southbound. The reasons for that are somewhat speculative.
They can however be a result of differences of the demand peaks in the two directions, one
leaving less capacity for speeding up than the other.
The calculation and aggregation of the KPI results demonstrate the value of the KPI’s
scalability. Single effects like the anisotropy of a specific major road can become visible and
if necessary be closely investigated by experts. Through the aggregation on a network-wide
level such effects can blur out without falsifying the general trend which is of higher
relevance for the political stakeholders.

CONDUITS Performance evaluation case studies of traffic management and Intelligent Transport Systems Deliverable no 3.6
23
6 Rome: General assessment
In the case study in the city of Rome, a large-scale performance evaluation of the various
techniques and ITS technologies that have been implemented within the framework of the
Mobility Control Centre is conducted. Focussing on the area lying inside the “Grande
Raccordo Anulare” (GRA) orbital motorway, an assessment of traffic efficiency in terms of
mobility and reliability is carried out, using the outputs of large macroscopic simulation
models calibrated with real data.
6.1 Description of the scheme
Rome’s Mobility Control Centre was implemented in 1999 on the occasion of the Jubilee
2000. Since then its functionalities and features have evolved and improved.
The main Mobility Control Centre’s goals are:
• to gather and organise information concerning the mobility within the metropolitan
area of Rome;
• to share this information with all the citizens, tourists and city users, giving them the
tools to choose the best way to move around the city;
• and to control and regulate the mobility in order to progressively reduce road
congestion and travel times, as well as to improve safety, quality of life, and
environmental sustainability.
The general architecture of the Mobility Control Centre consists of an open-plan, modular
and expandable structure, based on two control levels: the first level consisting of
peripheral systems, which is managed intelligently by the second level consisting of the
central supervisor.
The ITS systems operating at the first level support the regulation of urban traffic and
contribute to the efficiency and sustainability of the movement of vehicles and people. The
main systems in use are: sensors for measuring traffic flows and journey times; video-
surveillance cameras; traffic signals; and electronic “access gates” for automatic access
CONDUITS Performance evaluation case studies of traffic management and Intelligent Transport Systems Deliverable no 3.6
24
control to limited traffic zones and to reserved bus lanes.
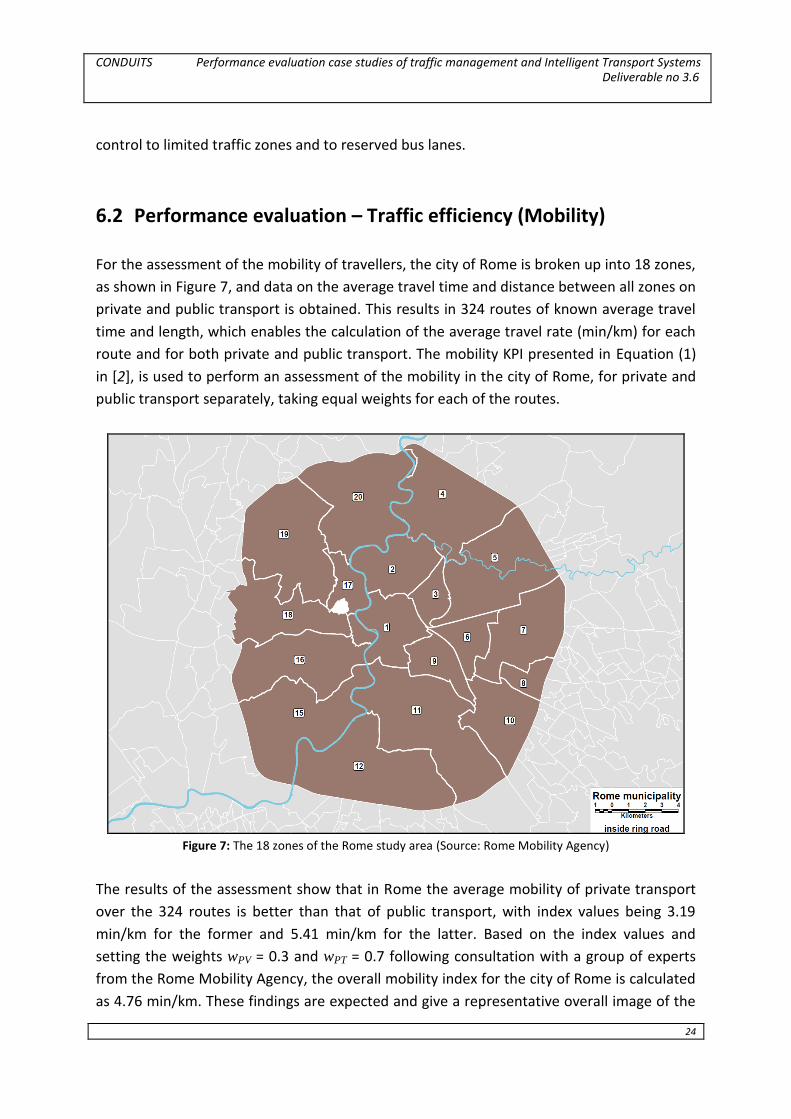
6.2 Performance evaluation – Traffic efficiency (Mobility)
For the assessment of the mobility of travellers, the city of Rome is broken up into 18 zones,
as shown in Figure 7, and data on the average travel time and distance between all zones on
private and public transport is obtained. This results in 324 routes of known average travel
time and length, which enables the calculation of the average travel rate (min/km) for each
route and for both private and public transport. The mobility KPI presented in Equation (1)
in [2], is used to perform an assessment of the mobility in the city of Rome, for private and
public transport separately, taking equal weights for each of the routes.
Figure 7: The 18 zones of the Rome study area (Source: Rome Mobility Agency)
The results of the assessment show that in Rome the average mobility of private transport
over the 324 routes is better than that of public transport, with index values being 3.19
min/km for the former and 5.41 min/km for the latter. Based on the index values and
setting the weights wPV = 0.3 and wPT = 0.7 following consultation with a group of experts
from the Rome Mobility Agency, the overall mobility index for the city of Rome is calculated
as 4.76 min/km. These findings are expected and give a representative overall image of the

CONDUITS Performance evaluation case studies of traffic management and Intelligent Transport Systems Deliverable no 3.6
25
actual situation, as validated by the experts.
6.3 Performance evaluation – Traffic efficiency (Reliability)
In the assessment of reliability, congestion data on 45 representative routes across the road
network of the city of Rome is used. This consists of the number of congestion incidents and
their duration for a period of reference of one year, based on the definition of a congestion
incident as the situation where the travel time on a route exceeds a certain threshold for 10
consecutive minutes. The threshold is, naturally, different for each route and depends on its
length as well as on a number of other factors identified by the Rome Mobility Agency. A
sample of the congestion data is shown in Figure 8.
Figure 8: Congestion data for the city of Rome (Source: Rome Mobility Agency)
Applying the reliability KPI defined in Equation (2) in [2] and making the assumption that the
routes are weighted equally, an index value of 0.9959 is obtained. This indicates a very high
reliability across the network throughout the period of reference of one year, and is
supported by the generally low number of congestion occurrences as a whole (1871
congestion incidents, with an average duration of approximately 57 minutes). This,
however, may be attributed to the fact that the potentially unreliable and congested peak
hours are compensated by the long uncongested off-peak (night time) hours.

CONDUITS Performance evaluation case studies of traffic management and Intelligent Transport Systems Deliverable no 3.6
26
6.4 Discussion
The main finding from this case study is that it is shown that the new traffic management
and ITS KPIs are also appropriate for large-scale performance assessment, in addition to the
evaluation of individual case studies. The mobility assessment results for the Greater Rome
region are in line with what would be expected, namely better mobility for private transport
than for public transport, with mobility index values of the same order of the ones in the
two Paris case studies. As concerns the reliability assessment result, on the other hand, the
obtained index value is, on one hand correct, based on the definition and occurrences of
congestion around the network, but is, on the other hand, not representative of the
situation at critical times (peak). The result, hence, shows that the mobility index is
appropriate, but highlights the need for a time-based reliability performance evaluation
(e.g. only at peak times) of the transport network.

CONDUITS Performance evaluation case studies of traffic management and Intelligent Transport Systems Deliverable no 3.6
27
7 Conclusions
Following the methodological definition of the new performance evaluation framework for
urban traffic management and ITS, developed in the previous stages of the CONDUITS
project, this report described the validation procedure for the new KPIs, which was carried
out with the help of five case studies in four European cities (Paris, Rome, Tel Aviv and
Munich), each assessing a different aspect of urban traffic management applications.
The evaluation of the KPIs with the help of the five real-world case studies demonstrated
the usability and accuracy of the new performance evaluation framework. The calculation
output was found to generally reflect major phenomena in the traffic conditions of the
respective city, as confirmed by the local transport experts used in each case study, but as
opposed to previous work, the output is single values and charts rather than manifold
assessments. Furthermore the validation of the KPIs demonstrated their scalability, since
they were applied successfully in small parts of networks (e.g. the case studies of Paris) as
well as in large caption areas (e.g. the general assessment for Rome).
The KPIs are immediately usable by local authorities, as they utilise common and available
data. This instance was not only confirmed through the application with data from four
different cities, but also by means of direct consultation with other local authorities through
the CONDUITS City Pool.
Nevertheless, it is recognised that the implementation of the KPIs requires the
consideration of several dimensions in order to become an effective tool of decision-making
in the field of traffic management and ITS, and therefore work in this direction continues.
The next steps will thus concentrate on applying the KPIs to more case studies of different
characteristics, so as to continue their validation and parameter fine-tuning. Further work
will also focus on the testing and validation of the KPIs for pollution and social inclusion, as
well as on the development of new measures and indices.

CONDUITS Performance evaluation case studies of traffic management and Intelligent Transport Systems Deliverable no 3.6
28
References
[1] Zavitsas, K., Kaparias, I., and Bell, M. G. H. Transport problems in cities - CONDUITS Deliverable 1.1. 2010.
[2] Kaparias, I., Bell, M. G. H., Eden, N., Gal-Tzur, A., Komar, O., Prato, C. G., Tartakovsky, L., Aronov, B., Zvirin, Y., Gerstenberger, M., Tsakarestos, A., Nocera, S., and Busch, F. Key Performance Indicators for traffic management and Intelligent Transport Systems - CONDUITS Deliverable 3.5. 2011.