performance-driven internet path selection
TRANSCRIPT
Performance-Driven Internet Path SelectionMaria Apostolaki
ETH ZürichSwitzerland
Ankit SinglaETH ZürichSwitzerland
Laurent VanbeverETH ZürichSwitzerland
ABSTRACTInternet routing can often be sub-optimal, with the chosen routesproviding worse performance than other available policy-compliantroutes. This stems from the lack of visibility into route performanceat the network layer. While this is an old problem, we argue thatrecent advances in programmable hardware finally open up thepossibility of performance-aware routing in a deployable, BGP-compatible manner.
We introduce ROUTESCOUT, a hybrid hardware/software systemsupporting performance-based routing at ISP scale. In the data plane,ROUTESCOUT leverages P4-enabled hardware to monitor perfor-mance across policy-compliant route choices for each destination,at line-rate and with a small memory footprint. ROUTESCOUT’scontrol plane then asynchronously pulls aggregated performancemetrics to synthesize a performance-aware forwarding policy.
We show that ROUTESCOUT can monitor performance acrossmost of an ISP’s traffic, using only 4 MB of memory. Further, itscontrol can flexibly satisfy a variety of operator objectives, withsub-second operating times.
CCS CONCEPTS• Networks → Programmable networks; Routing protocols; Con-trol path algorithms; Network performance evaluation; PublicInternet; Network dynamics.
ACM Reference Format:Maria Apostolaki, Ankit Singla, and Laurent Vanbever. 2021. Performance-Driven Internet Path Selection. In The ACM SIGCOMM Symposium onSDN Research (SOSR) (SOSR ’21), October 11–12, 2021, Virtual Event,USA. ACM, New York, NY, USA, 13 pages. https://doi.org/10.1145/3482898.3483357
1 INTRODUCTIONInternet routing uses cost-driven policies to select one interdomainpath per destination along which to direct traffic. To select onepath amongst multiple policy-compliant ones, the Internet’s BorderGateway Protocol (BGP) uses particularly crude criteria rather thandynamically optimizing for performance. For instance, BGP willfavor paths crossing fewer networks or paths crossing networks
Permission to make digital or hard copies of all or part of this work for personal orclassroom use is granted without fee provided that copies are not made or distributedfor profit or commercial advantage and that copies bear this notice and the full citationon the first page. Copyrights for components of this work owned by others than ACMmust be honored. Abstracting with credit is permitted. To copy otherwise, or republish,to post on servers or to redistribute to lists, requires prior specific permission and/or afee. Request permissions from [email protected] ’21, October 11–12, 2021, Virtual Event, USA© 2021 Association for Computing Machinery.ACM ISBN 978-1-4503-9084-2/21/10. . . $15.00https://doi.org/10.1145/3482898.3483357
whose identifiers are smaller.1 As a result, BGP selects routes thatare often suboptimal in terms of throughput, latency, and reliability.
This problem is far from new and the sub-optimality of Inter-net routing is long-established [54, 58, 59]. Yet, despite severalstrong attempts [8–11, 54, 61], limited progress has been made. Theproblem is that enabling performance-aware routing is particularlychallenging, requiring: scalable monitoring of path performance,handling path dynamics, stability and correctness of routing, andinsurmountable resistance to any approach incompatible with BGP.
Despite the problem’s difficulty and its long history, we posit itstime to revisit this problem for three reasons.
First, Internet application requirements have evolved, with asharper focus on reliably high network performance. For hyperscaleWeb services with numerous well-connected points-of-presenceacross the globe, BGP is, in fact, good enough most of the time [12].However, even in these best-case environments, the benefits of reduc-ing tail latency and performance variability in response to transientcongestion are valuable enough for providers like Google and Face-book to invest in performance-aware routing [55, 64]. Google’sEspresso showed that being able to dynamically reroute around tran-sient congestion improved mean time between rebuffers in theirvideo service by 35–170% [64]. Espresso explicitly pins these gainson being able to dynamically respond to performance variabilityacross paths (rather than just average-case improvement from aone-time evaluation), thus underscoring the need for making pathdecisions based on continuous assessments of the changing per-formance of paths. Beyond Web services, other applications areeven more demanding: in gaming, even small latency overheads canput players at a disadvantage [28]. The importance of tail latencyas opposed to mean latency is also demonstrated in CDN’s effortsto improve latency of the worst-performing clients[19]. Thus, ifperformance-aware routing were practical, the benefits would justifysignificant design effort.
Second, the available paths are increasingly diverse due to in-creased peering and the establishment of Internet Exchange Points(IXPs), which did not exist at BGP’s first design iteration (1989). Fur-ther, if plans for satellite-based global Internet connectivity [18, 57]come to fruition, the performance gap across different paths will alsoincrease. Two teams of researchers have separately argued in recentposition papers [14, 44] that these satellite systems exhibit contin-uous changes in both the performance and availability of routes,and thus, will pose challenges to the performance-oblivious andslow-to-converge BGP routing.
1One of BGP tie-breaking criteria is indeed to prefer routes announced by the routerwith the smallest IP address [51].
SOSR ’21, October 11–12, 2021, Virtual Event, USA Maria Apostolaki, Ankit Singla, and Laurent Vanbever
Third, the recent development of programmable switches thatallow line-rate, per-packet data plane operations enables new designprimitives. These heretofore unavailable primitives, as we shall show,drastically improve our ability to both evaluate and control multiplecandidate routes.
Motivated by the above factors, we present ROUTESCOUT, anovel software-hardware co-design for performance-aware routingthat runs at each edge of the network and independently controlsthe paths of the traffic exiting. ROUTESCOUT’s data plane estimatesloss and delay along different policy-compliant next-hop routesfor different destinations. It leverages probabilistic data structuresin programmable switches to aggregate delay and loss measure-ments on a per-destination-next-hop granularity. This in-data-planeaggregation eliminates the necessity of mirroring traffic to morepowerful general-purpose hardware, thus alleviating: (a) bandwidthand compute overheads; and (b) deterioration in monitoring capa-bilities when most needed, under congestion. Past methods (§2) areincapable of producing such accurate, high-coverage, real-time, andlow-overhead performance measurements for multiple candidatenext-hops for many destinations.
The succinct measurements allow ROUTESCOUT’s control planeto evaluate multiple policy-compliant candidate paths by measur-ing their performance systematically for small slices of live traf-fic. ROUTESCOUT then encodes the best path choices in the dataplane using a small memory footprint. ROUTESCOUT enforces thosechoices gradually while continually monitoring performance to avoidself-induced congestion and, therefore, oscillations [30].
While ROUTESCOUT could be used by any Autonomous System(AS), for tractability of control, we trim the problem’s scope: wetake the perspective of a stub AS, which offers no transit services toother ASes. This eliminates the risk of multiple parties concurrentlysensing and independently modifying the same end-to-end pathleading to transient loops and instability. We humbly suggest thatthis “relaxation” still leads to a highly non-trivial and useful setting:stubs comprise 85% of all ASes;2 and the majority of stubs are multi-homed and virtually all Internet traffic originates from some stub.In addition, despite sitting at the edge of the Internet, stubs oftenknow several paths to reach each destination: our measurementson CAIDA AS-level topologies [2] reveal that the majority of them(55%) can use at least two equally-preferred paths for at least 80% ofthe destinations.3 Stubs also tend to connect with their neighbors viaredundant links, further increasing path diversity [47]. Finally, whileROUTESCOUT can only control paths from the stub, not towardsit, the resulting reductions in round-trip time, and being able toavoid congestion/failures at least in one direction, are still valuableimprovements.
ROUTESCOUT is carefully designed to run on available pro-grammable switches, respecting constraints on memory, operationsper packet, memory accesses per packet, and constraints on accessesto memory blocks across pipeline stages. It requires no coordinationacross ASes and works over unmodified BGP. Within an AS, it yieldsbenefits starting with only one programmable switch deployed at theedge.
2A likely low estimate, computed from CAIDA’s AS-level topology [2].3For each stub we calculated the number of BGP-equivalent paths for 1000 randomlyselected destination prefixes, following [29].
Our main contributions are the following:• ROUTESCOUT, a system capable of rerouting traffic to test the
performance of alternative routes to each destination prefix in acontrolled and automated manner.
• Methods to compute delay and loss rates across different pathsthat are accurate and effective while respecting the constraints ofdata-plane hardware.
• Efficient interconnection between the control and data plane thatallows: (a) fast, fine-grained, and asynchronous changes in theforwarding and monitoring policy; (b) fast, fine-grained, and low-bandwidth retrieval of statistics.
• An implementation of ROUTESCOUT on a Barefoot Tofino switch [5],with an evaluation of its control- and data-plane.
2 MOTIVATIONPerformance-aware routing is an old problem [8, 10, 54, 58, 59], withseveral known solutions of varying ambition and complexity. Earlywork [32] narrowly targeted multi-homed end-users with perfectvisibility over their performance, cost being their first priority, anddirect links the only possible bottleneck. TeXCP [41] and MATE [25]focused on intra-domain routing, splitting traffic across already setuptunnels. We instead tackle the problem from the perspective of anAS picking routes to external destinations, with no end-host controland only observing its own traffic. In this setting, we discuss severalalternatives for monitoring path performance, whose limitationsmake a case for ROUTESCOUT.Active probing: One can actively probe routes with known tools [22,36]. Yet, probes may not be representative of real traffic’s perfor-mance — the volume of probing traffic is likely orders of magnitudeless than the actual traffic, and some ISPs are known to treat probingtraffic preferentially [24]. Most importantly, low-volume probing isinadequate for accurately measuring loss rate, while high-volumeprobing on all destinations via multiple paths would lead to signifi-cant extra load. Probing has been successfully used for performance-driven intra-domain routing in the past e.g., Contra [35]. Yet, suchtechniques are impractical in our inter-domain context as they wouldrequire one Vantage Point at each destination network.Passive sampling: Gathering statistics on live traffic is possibleusing sampling with sFlow [50] or NetFlow [23]. However, samplingsimply does not capture performance — measuring these metricsrequires capturing state across particular packets per flow (§4.2,§4.3), not arbitrary random samples.Mirroring: While mirroring captures the requisite information, itdoes not scale and is inflexible [49]. To avoid congestion from mir-rored traffic, one can rate-limit it, but this has limitations similar tosampling: naive rate-limiting will discard arbitrary packets acrossflows, impairing loss and delay estimation. Alternatively, one cantarget mirroring more narrowly, with systems like Everflow [67] andStroboscope [60]. However, for continuous, high-coverage monitor-ing across Internet prefixes and potential next-hops, such methodswould require a large and constantly changing set of monitoring rulesin network devices. Further, even if we could dynamically match ona given number of flows per prefix and mirror only those (e.g., withprogrammable switches to store flow identifiers), the mirrored trafficwill still be burdensome.
Performance-Driven Internet Path Selection SOSR ’21, October 11–12, 2021, Virtual Event, USA
As an illustration, consider an operator who wants to monitor theperformance for traffic sent to 1𝐾 destinations over only 2 alternativenext-hops and by mirroring only 50 flows per destination-next-hoppair. At the mean flow rate observed in CAIDA traces [1], such adesign would require mirroring 25.7 Gbps of traffic. In contrast, byaggregating measurements directly in the data plane, ROUTESCOUT
generates 108.4 kbps in performance reports, i.e., at 287,000× higherefficiency.End-system monitoring: Google [64] and Facebook [55] haverecently shared their solutions for path-aware routing. These ap-proaches leverage their unique control: one end of the monitoredconnections terminates at their own powerful servers, and the otherat a client application that also supplies performance data. This isobviously infeasible for ASes.Performance monitoring with programmable switches:ROUTESCOUT exploits programmable switches that open up av-enues unavailable to past efforts. To the best of our knowledge, noprior work leveraging programmable switches fully addresses eitherthe sensing/monitoring or flexible reroutes needed for performance-aware routing. Blink [34] detects outages, exploiting a failure-specificproperty: failed paths deterministically drop every retransmissionof a packet. This property simplifies Blink’s design but doesn’t holdfor congested paths. Observe that Blink can only detect the secondretransmission of a packet, thus cannot measure loss rate or delay.Lossradar [66] detects losses between pairs of deployed VPs. Mea-suring per-path loss-rate though requires significant additional efforti.e., adding per-path synchronized counters and mapping each lostpacket to a path. Also, Lossradar does not measure delay. In-bandNetwork Telemetry [43] provides intra-domain performance metrics.Yet, similarly to Lossradar, INT requires control over multiple VPs(one per destination). Dapper [31] detects performance problemsusing one VP but requires bidirectional traffic, which is unrealisticconsidering asymmetric routing. Sketches [42, 45, 46, 48, 63, 65]offer aggregate estimates for packet/flow counts and size distribu-tions, but do not capture latency and loss across routes. Finally,Marple [49] could be used to implement performance monitoring.Yet, implementing two levels of aggregating (per flow and & perprefix and next hop) is not straightforward. Even assuming that ispossible, such a solution would not run in today’s programmableswitches and does not provide flexible rerouting.
2.1 Design constraintsThe following constraints drive ROUTESCOUT’s design: :
R1 Respect routing policies: By default, ROUTESCOUT mustselect amongst equally-preferred routes, replacing arbitrarytie-breaks in BGP, and hot-potato routing.
R2 Ensure correctness and stability: ROUTESCOUT must preventloops and oscillatory behavior.
R3 Deployability: ROUTESCOUT should not require any coordi-nation between ASes. A single AS deploying ROUTESCOUT
should also benefit from it without upgrading its entire network.R4 Support asymmetric routing: Due to asymmetric routing, a
ROUTESCOUT switch may not see both directions of traffic, itmust, therefore, be able to estimate and improve performancefrom one-way traffic.
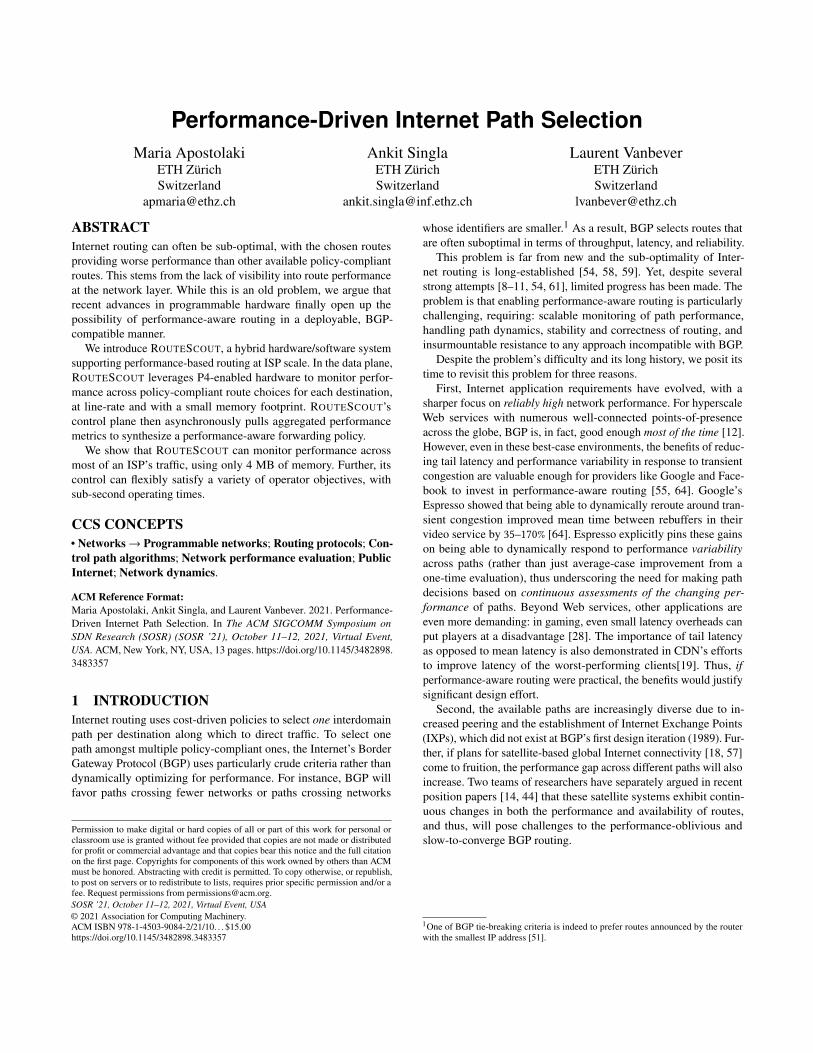
Figure 1: 𝐴𝑆𝐴 and 𝐴𝑆𝐵 are providers for the other three ASes. 𝐴𝑆𝑋has several legacy switches and a ROUTESCOUT-capable switch; notall edge switches in 𝐴𝑆𝑋 run ROUTESCOUT; no coordination amongROUTESCOUT-capable switches and/or legacy switches is required.
R5 Respect flow affinity: To avoid performance degradation dueto reordering of packets that could result from sending packetsof the same flow across different paths, ROUTESCOUT mustenforce flow-path affinity.
R6 Fit today’s switches: ROUTESCOUT should fit within thescarce memory (dozens of MB at best [40]), restricted opera-tions set (e.g., no floating points) and parallel memory accessesavailable to existing programmable network hardware.
R7 Limit bandwidth usage: ROUTESCOUT must limit bandwidthusage between the data and control planes, regardless of thetraffic rate and burstiness.
3 OVERVIEWROUTESCOUT is a closed-loop control system that dynamicallyadapts how a stub AS forwards its outgoing traffic across multiplepolicy-compliant routes according to observed performance andoperator’s objectives.
We illustrate ROUTESCOUT operations on a simple running ex-ample (Fig. 1) in which a stub network, 𝐴𝑆𝑋 , routes traffic to mul-tiple destinations, among which are 𝐴𝑆𝐶 and 𝐴𝑆𝐷. 𝐴𝑆𝑋 knowstwo equally-preferred paths to reach both destinations through itsproviders,𝐴𝑆𝐴 and𝐴𝑆𝐵, with whom𝐴𝑆𝑋 has 250 Gbps links. BGP’sarbitrary tie-breaking selects 𝐴𝑆𝐴 as the next-hop for traffic to 𝐴𝑆𝐶and 𝐴𝑆𝐵 for traffic to 𝐴𝑆𝐷 . Unbeknownst to 𝐴𝑆𝑋 , the path via 𝐴𝑆𝐵has a much lower delay to 𝐴𝑆𝐶 and a slightly lower delay to 𝐴𝑆𝐷.Only one (edge) devices of 𝐴𝑆𝑋 is programmable (R3).Inputs To use ROUTESCOUT, the operator first specifies the pre-fixes of interest4, together with their typical traffic demands.5 Inour example, 𝐴𝑆𝑋 ’s operator wants ROUTESCOUT to optimize fordestinations 𝐴𝑆𝐶 and 𝐴𝑆𝐷 , which drive 100 and 200 Gbps of trafficrespectively. Then, the operator specifies her objectives which in ourexample are to (a) minimize the delay to both destinations; and (b)load balance traffic across the next-hops, as long as the delay is notincreased by >10%. Note that ROUTESCOUT automatically learnsthe policy-compliant next-hops from BGP (R1). ROUTESCOUT runsindependently on a single edge device 6 and does not need to coordi-nate with other devices in or outside 𝐴𝑆𝑋 .
4few hundreds accounting for most of the traffic volume [27, 53]5adequately accurate estimates, are easy to obtain §6.1.6or multiple if there are multiple edges

SOSR ’21, October 11–12, 2021, Virtual Event, USA Maria Apostolaki, Ankit Singla, and Laurent Vanbever
AnalysisControl plane
Data planeOutgoingtra!c
Incoming tra!c
reroute x%of dstC
Actuation
…
Dst prefixesObjectivesDemand
…
port 1port 2
port n
Solver
Aggregators
ForwardingSelectordstC loss delay
A
B
dstC loss delay
A
B
dstC loss delayAB
monitor x%of dstC
Sensing
Loss & DelayMonitor
MonitoringSelector
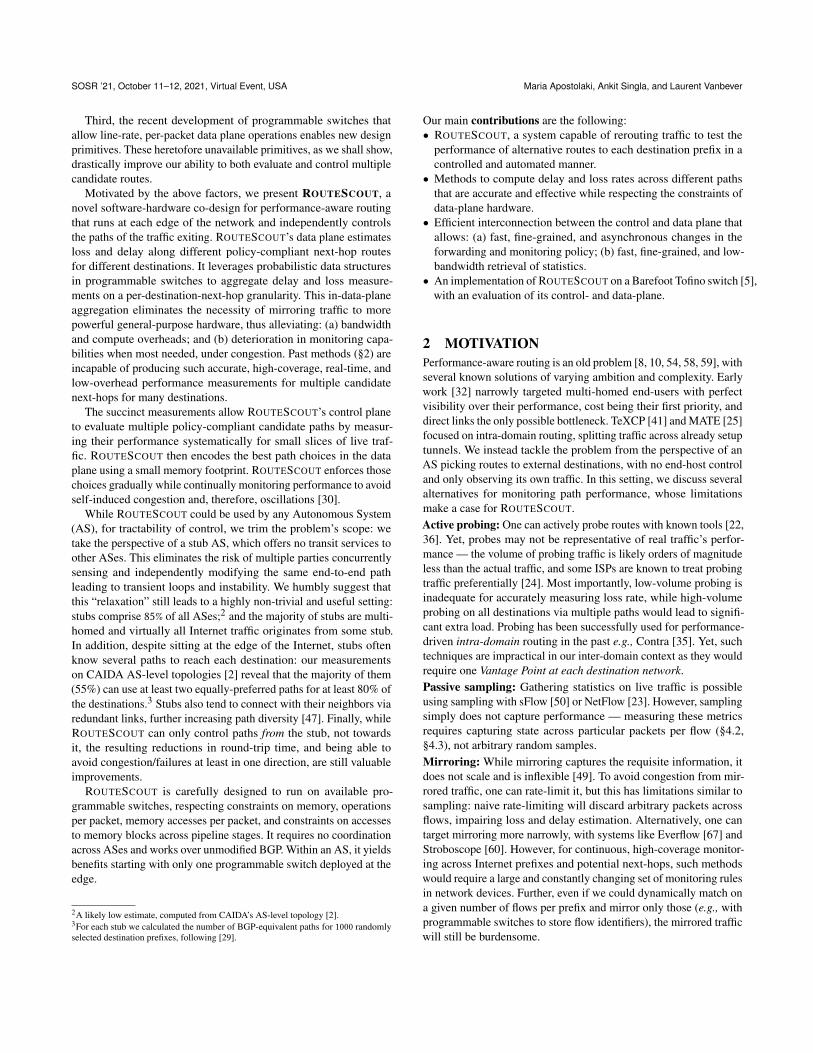
Figure 2: ROUTESCOUT is a closed-loop control system with sensing,analysis, actuation split across data and control planes.
System To satisfy the operator’s objectives, ROUTESCOUT imple-ments a control loop which. . .
. . . directs traffic to alternative next-hops
. . . monitors performance across prefix-nexthop pairs
. . . computes an optimized traffic allocation to next-hops
. . . actuates appropriate traffic shifts in the data plane
ROUTESCOUT splits the above functions across its control- anddata-planes (Fig 2). The data plane collects and aggregates mea-surements for the control plane to analyze (sensing). The controlplane decides which traffic to monitor and which traffic to reroute towhich next-hops (analysis). The data-plane receives and enforcesthese decisions (actuation). Sensing and actuation operate at thegranularity of a “slot”, which we define as a small amount of trafficto a particular prefix. The number of slots pertaining to each prefixis determined by the proportion of its traffic volume. Operating at aper-slot granularity provides measurement efficiency, improved sta-bility and better resource utilization. For instance, slot-based routingenables ROUTESCOUT to use paths that can not support all the trafficfor a given prefix. Coming back to our example,𝐴𝑆𝐷 receives twicethe traffic as 𝐴𝑆𝐶. Assuming a total of 3,000 slots, ROUTESCOUT
allocates 1,000 slots to 𝐴𝑆𝐶, and 2,000 slots to 𝐴𝑆𝐷 , with each slotcarrying around 0.1 Gbps of traffic.Data plane: ROUTESCOUT data plane enforces the per-slot mon-itoring and forwarding decisions made by the control plane. Toscalably monitor effectively satisfying R6, ROUTESCOUT exploitsTCP’s semantics together with probabilistic data structures to an-alyze the relevant packets, aggregate the measurements (R7), andactuate the corresponding forwarding decisions (§4). Note that, whileROUTESCOUT relies on TCP, it only requires some TCP flows to ex-ist per prefix, meaning it can still be useful even in QUIC-dominatedInternet. To flexibly forward, ROUTESCOUT uses two match-actiontables and a novel memory mapping scheme (§4.1), that allowsit to seamlessly adapt to BGP updates, prefix or policy changes,consistently satisfying R1.
In our example, ROUTESCOUT reroutes 1 slot of traffic to eachdestination via the alternative next-hop, namely 𝐴𝑆𝐵 (as decidedby the control plane) and monitors 4 slots one for each destination,next-hop pair. As a result, aggregated loss and delay measurementsfor each pair will be available to the control plane.
0port 4 port 7 port 3
index 1 index 2 index 3Forward prefX range [0,30) port 4
10030 70
Forward prefX range [30,70) port 7Forward prefX range [70,100] port 3
Monitor prefX range [0,10) index 1Monitor prefX range [30,40) index 2Monitor prefX range [70,80) index 3
Hashoutput
Rules
Forwarding SelectorMonitoring Selector
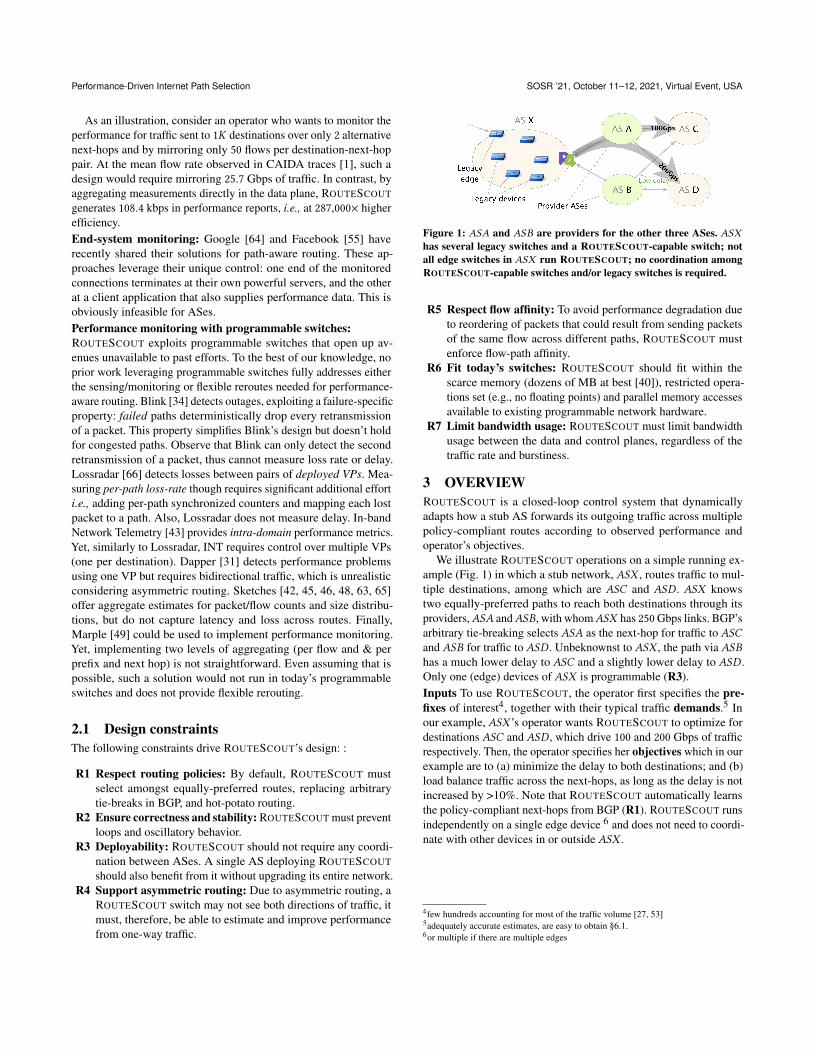
Figure 3: ROUTESCOUT uses two match-action tables to flexibly forwardthe traffic according to the control-plane decisions and flexibly monitora given fraction of traffic per next hop.
Control plane: ROUTESCOUT control plane pulls aggregated data-plane measurements and computes a new forwarding state based onthese and the operator objectives (§6.2) by formulating and solvinga linear optimization program(§6.2).
The main challenge in computing a new forwarding state is theconflicting objectives that the operators often have. In our example,the operator wants low delay (primary) and balanced load (sec-ondary). These cannot be satisfied together as 𝐴𝑆𝐵 offers lowerdelay for both destinations. This is a deliberately simple example:since performance for 𝐴𝑆𝐶 improves more, 𝐴𝑆𝐷’s traffic shouldbe load balanced. But the problem becomes more complex as thenumber of prefixes, next-hops, and objectives grows.
ROUTESCOUT moves to the computed forwarding state on aslot-by-slot basis while tracking and reactive any performance degra-dation to avoid heavily congesting remote bottlenecks potentiallyviolating R2. Slot-by-slot traffic shifts also reduce the risk of os-cillations, even when multiple ROUTESCOUT systems co-exist byadding randomness and therefore avoiding synchronization [30].
4 ROUTESCOUT DATA PLANEROUTESCOUT’s data plane uses compact data structures and ef-ficient algorithms to flexibly forward traffic (§4.1) and accuratelymeasure delay (§4.2) and loss (§4.3). We also discuss the impact ofadversarial inputs and defenses (§4.4).
4.1 Selector stageThe Selector enforces the forwarding and monitoring decisions com-municated by the control plane (§3) on a per-prefix basis. The for-warding decisions correspond to the number of slots to forward togiven next hops, while the monitoring decisions correspond to thenumber of slots to collect statistics for on given next hops.
The Selector implements slot-based forwarding and monitoringby first hashing each incoming packet to a range [0, 𝑘] and thenusing two match-action tables to identify sub-ranges [𝑖, 𝑗) of of therange [0, 𝑘] that need to be monitored or forwarded to a given port.The two tables, forwarding Selector and monitoring Selector, usethe same type of keys composed of: (i) a prefix; and (ii) a range [𝑖, 𝑗)which identifies a subset of traffic. In the forwarding Selector table,each key maps to a next-hop. In the monitoring Selector table, eachkey maps to the index of a memory block of a table (aggregator(§4.2-4.3)) in which the corresponding aggregated statistics will be

Performance-Driven Internet Path Selection SOSR ’21, October 11–12, 2021, Virtual Event, USA
stored. By adapting the contents of each table, the controller canflexibly adapt the forwarding and monitoring behavior.Example: Fig. 3 shows an example with a hash range of 0-100, andthree rules in each table. The rules are such that, in expectation, 30%of packets (subrange 0–30) to prefix ‘prefX’ will be forwarded toport 4. Additionally, 1/3 of these packets (subrange 0–10) will bemonitored before being forwarded, with the monitoring results storedin index 1 of the aggregator. Observe that the flexible design of themonitoring Selector table allows seamless adaptation to the system’sdynamics. For example, if the BGP peer at port 4 withdraws prefX,then the range of the green (second) rule in the forwarding Selectorcould be expanded to include hash outputs 0-30, and the red (first)rules in both the forwarding Selector and monitoring Selector will bedeleted. The index 1 of the aggregator used to store measurementsfor this prefix-next-hop pair can also be reset and assigned to anotherone.
4.2 Measuring delaysThis component is responsible for accurately and scalably measuringthe delay of any flow belonging to one of the monitoring slotsenforced by the Selector. It relies upon a monitor and an aggregator.The monitor estimates the delay observed by each flow by trackingspecific TCP metadata,7 while the aggregator accumulates thesestatistics, which are eventually pulled by the control plane.Estimating delay: To estimate the delay of a given flow in thepresence of asymmetric routing, the Delay monitor computes thetime elapsed between its TCP SYN and the first ACK (similarly to[39]). While doing so means that ROUTESCOUT only measures delayat connection setup, it also minimizes the noise from application-level effects, which are likely to be more significant for later packets.Moreover, using only SYN and ACK packets allows the Delaymonitor to operate with unidirectional traffic, thus accounting forasymmetric routing (unlike prior work [20]). Observe that mirroringSYN and ACK packets to a software component is unrealisticallycostly, as all ACKs would need to be mirrored and matched to SYNs.Moreover, measuring the delay between SYN and SYNACK wouldrequire bidirectional traffic effectively violating R4.
Recording timestamps at scale is challenging. Indeed, simplystoring the SYN timestamp and the 5-tuple in a hash table does notscale since it requires >100 bits per measurement. To address thisproblem, we use a combination of two probabilistic data structures:an Accumulator, for storing sums of timestamps at each index, anda Counter for counting how many timestamps are in each sum inthe Accumulator. In essence, the Counter can be seen as a CountingBloom Filter [26], while the Accumulator is similar to an InvertibleBloom Lookup Table [33]. We use XOR (⊕) as the sum operatorrather than a simple addition — while both + and ⊕ are recoverable(given 𝐴 and 𝐴 ⊕ 𝐵 or 𝐴 + 𝐵, one can recover 𝐵), ⊕ cannot causeoverflows. Unlike previous works [45, 66] that send their full Bloomfilters to the controller to be decoded (incurring both compute andbandwidth expense), we measure entirely in the data plane and only
7While ROUTESCOUT relies on TCP, it only requires some TCP flows to exist per prefixfor measuring the path’s performance. Yet, ROUTESCOUT’s decisions will also benefitQUIC/UDP traffic.
(a) (b) (c)
Figure 4: Delay monitor:(a) SYNs of different flows (blue/above & yel-low/below) increment different indexes; (b) The first ACK of the yellowflow checks that all its indexes (3,5,8) are set, and reads the timestamp ofthe yellow SYN from the reversible index 8; (c) The same ACK removesthe footprint of the yellow flow by XOR-ing T3 to the indexes of (3,5,8),and decrementing their counters.
expose aggregated statistics to the control plane, which can pullthem asynchronously.8
Example, Fig. 4: As SYNs of different flows arrive (Fig. 4a), wehash their 5-tuples with multiple hash functions, thus generatingmultiple indexes. Here the yellow (lower) flow is hashed to (3, 5, 8),and the blue (upper) flow to (1, 3, 6). Each entry of the Accumulatorin those indexes is ⊕-ed with the timestamp of the SYN. Additionally,the Counter of each entry is incremented. Different SYNs can endupdating the same index, e.g., index 3 in Fig. 4a.
On receiving an ACK, we first compute the corresponding indexesusing the same hash functions. If all the corresponding Counter val-ues are non-zero, then we know that the SYN timestamp is containedin the Counter. In Fig. 4b, the ACK of the yellow flow arrives andfinds its indexes set. To get the timestamp of its corresponding SYN,we need to find one index among the indexes to which the ACK ishashed, whose value in the Counter is one. We will call this indexreversible. The same index in the Accumulator yields the timestampfor this flow’s SYN, thus allowing us to compute its delay. In Fig. 4b,the ACK finds a value equal to 1 in the index 8, namely the third ofthe three indexes it is hashed to. Thus, the timestamp of the SYN isat index 8 in the Accumulator.
To erase the footprint of a SYN from the Delay monitor, we decre-ment each of the hashed indexes in the Counter, and ⊕ the recoveredtimestamp with the sums at these indexes in the Accumulator. InFig. 4c, we illustrate the result of this process; observe that by ⊕-ingthe timestamp in each of the hashed indexes, the effect of the yellowSYN vanishes.Keeping the Delay monitor healthy: In the common case, the Delaymonitor stores some per-flow state only during the handshake as anACK removes the memory footprint created by the correspondingSYN. This allows the Delay monitor to scale with the number offlows regardless of their rate and duration. Still, a large number ofSYNs not followed by corresponding ACKs can pollute the Delaymonitor. This challenge can be easily addressed by keeping track ofthe number of SYNs in the Delay monitor and not add new ones ifthe filter has exceeded its capacity (number of elements it can store
8Also observe that lossradar [66] cannot measure loss from a single VP as we explainin see § 2

SOSR ’21, October 11–12, 2021, Virtual Event, USA Maria Apostolaki, Ankit Singla, and Laurent Vanbever
1 1+12 03 1+14 2+15 06 07 08 0
S:5500E:6500
1 2-12 03 2-14 3-15 0+16 0+17 08 0+1
S:6500E:7500
1 32
3 14 25 16 17 08 1
S:4500E:5500
1 12 03 14 25 06 07 08 0
1 1+12 03 1+14 2+15 06 07 08 0
S:5500E:6500
1 2-12 03 2-14 3-15 06 07 08 0
S:6500E:7500
1 12 0+13 14 25 0+16 07 0+18 0
S:7500E:8500
ACC C
T2 1
T1 1
T2⊕ T3 2
ACC C
T1 1
T1⊕ T3 2
ACC C
T2 1
0 0
T3 1
Stage1 Stage2 Stage3
SYN
Packet #1 Packet #3Packet #2
0
Figure 5: Here the Loss monitor sees three packet arrivals, 2 in-orderand 1 retransmit. The first, with sequence number S:5500 has the nextexpected sequence number E:6500, and inserts the latter into the CBFby incrementing the indexes corresponding to the E:6500 (blue indexes,1, 3, and 4). The second packets finds its indexes (now yellow, 1, 3, and 4)non-zero, thus knows it was expected. It cleans itself out, and inserts thenext expected packet (blue indexes, lower) . The third one, a retransmit,finds one of its indexes (2) unset.
based on allocated memory, §7.2). Alternatively, the filter can bereset periodically.Aggregating statistics: The aggregator stores the delay measure-ments per prefix-next-hop pair in an array with two values per index:one for storing the sum of the delays and one for storing the num-ber of delay measurements contained in the former. The controlplane can pull the measurements for a prefix-next-hop pair or for allpairs at once and calculate the mean delay. For example, in Fig. 4c,once the ACK has read the timestamp of its SYN it calculates thetime elapsed since then and updates the values in the index thatis mapped to its prefix and output port. The mapping between theprefix-next-hop pair and the index in the aggregator is assigned bythe control plane and communicated via the monitoring Selector.Thus, to monitor different prefixes or a different number of nexthops for some prefixes, one just changes this mapping instead ofre-allocating memory and needing recompilation (see example in§4.1).
4.3 Measuring loss ratesThe design and challenges of the loss measurement componentare similar to those for the delay, with some key distinctions. Inparticular, to measure the loss rate, the monitor tracks the number ofretransmitted and regular packets, while the aggregator accumulatesthe counts for each category. Similar to the Delay monitor, themonitor only needs to observe one direction of each monitored flowand only a few TCP flows to monitor.Estimating loss rate: Measuring retransmissions at scale is chal-lenging since one cannot simply store every packet and comparenew arrivals against the history to identify duplicates. Our solution,somewhat surprisingly, requires only a few bits per flow at the costof one minor compromise: the inability to distinguish reorderingfrom retransmissions. Given that reordering also hurts TCP [15],mistakenly accounting for it as loss is not a significant downside ifit is one at all.
Our solution keeps only one element per flow by exploiting TCPsemantics and the fact that, given a TCP packet 𝑝, one can computethe next expected sequence number based on 𝑝 sequence number andpayload length. By storing this expected sequence number, we can
check whether the next packet is either a retransmitted or an out-of-order packet. Instead of storing a 32-bit (expected) sequence number,𝑒, we can insert it into a counting bloom filter (CBF), i.e., the samedata structure as our Counter for delay estimation. Since packetsacross flows can share sequence numbers, we insert the concatena-tion of the 5-tuple with the sequence number instead. Increasing thelength of the inserted value is immaterial, as the length of the hashoutput is the same.
Whenever a packet with sequence number 𝑠 arrives, we checkthe CBF for <5-tuple, 𝑠>: If the entry does not exist, the packetis out-of-order or a retransmit. If the entry exists, the packet is inorder and we delete it from our filter by decrementing all the indexes<5-tuple, 𝑠> hashes to. We then insert the next expected packet byincrementing all the indexes that <5-tuple, 𝑠 + 𝑡𝑐𝑝.𝑙𝑒𝑛> hashes to.
Not all packets carry information regarding previous segments.For instance, an ACK that does not carry any TCP data will befollowed by a packet of the same sequence number regardless ofwhether the former was lost or not. Similarly, KEEPALIVE messages(commonly used in Web traffic) contain an “unexpected” sequencenumber: one byte less than the previously sent sequence number. Toavoid these issues, we only use packets with TCP payload. This doesnot disrupt functionality, as for every non-zero-payload packet whosesubsequent sequence number we store, there will be a non-zero-payload packet that can remove it, even if it comes after multiplezero-payload ACKS.Example, Fig. 5: In this example, we illustrate how 3 packets (thelast one being a retransmitted one) of a flow update the CBF. Theyellow (upper) box contains their sequence number, and the blue box(lower), the sequence number of the expected packet. The first packetinserts the fingerprint of the expected (second) one by incrementingthe values stored in the indexes that the expected sequence number(concatenated with the 5-tuple of the flow) hashes to (blue indexes).Thus, when the second packet arrives, it will find all hashed indexesof its sequence number set (yellow indexes) and consider itselfexpected. This is not true for the third packet, whose indexes are notall set and is a retransmit.Keeping the monitor healthy: Similar to the Delay monitor, theLoss monitor contains one item per flow regardless of its rate as thestructure “cleans itself” with incoming packets. In particular, once aflow terminates, the corresponding RST or a FIN removes the flowpermanently. Still, out-of-order and lost packets will, in most cases,cause some packets to stay in the filter. However, this representsa very small fraction of packets, as we discuss in §7.3. To avoidoverflowing the monitor, a counter in the data plane can keep trackof the number of flows using it. If the filter’s capacity is exceeded,insertions are stalled until some of the flows terminate. Alternatively,the filter can be reset periodically, as we show in §7.3.Aggregating statistics: Similarly to the Delay aggregator, the ag-gregator stores the number of expected and unexpected packetsobserved per prefix and next hop.
4.4 Dealing with adversarial inputsLike any data-driven system, ROUTESCOUT is prone to attacks inwhich malicious endpoints or networks aim at faking signals in orderto influence its decisions. While possible and deserving a complete

Performance-Driven Internet Path Selection SOSR ’21, October 11–12, 2021, Virtual Event, USA
analysis in follow-up work, we briefly argue why such attacks onROUTESCOUT are hard to perform.
In order to influence ROUTESCOUT’s decisions, a malicious end-point could try to: (i) send repeated packets to fake retransmissions;(ii) send fake pairs of SYNs and ACKs with small/large timing dif-ferences to fool the delay monitor or (iii) send fake FIN or RSTpackets to prevent the loss monitor from measuring loss rates ofcertain flows. We note two things. First, such adversarial endpointsmust be hosted within the stub AS, since ROUTESCOUT optimizesexit traffic. Assuming basic anti-spoofing techniques are in place(e.g. [56]), each endpoint has a single IP address to source trafficfrom. As such, limiting the number of flows tracked per IP would besufficient to mitigate the attack. Second, ROUTESCOUT randomly as-sociates a flow to a next hop, depending on a hash function. As such,the attacker is equally likely to add noise to measurements of all nexthops, making targeting one next-hop difficult. ROUTESCOUT canalso defeat attempts to use traceroutes for probing such decisions byrandomly forwarding traceroutes to next hops.
Similarly, a malicious transit network can: (i) drop packets toincrease the loss rate; or (ii) drop/delay SYNs, SYN/ACK, or ACKsto fool the delay monitor. While this is possible, we note that, bydoing so, malicious networks can only make their performanceworse, not better. As such, malicious networks can only push awaytraffic, not attract more. Observe that an attacker cannot craft aSYN/ACK packet for every SYN it receives to fake low latency asshe does not know the sequence number that the receiver will useuntil the actual SYN/ACK packet is received.
Finally, attackers can also attempt to pollute ROUTESCOUT’sdata structures. An efficient way to mitigate such pollution is toperiodically reset the data structures, as we discuss in §7.Fault tolerance In case of a data-plane failure ROUTESCOUT willrebuild the monitoring state (kept in the monitors and aggregators)from scratch and will retrieve the forwarding state (kept in the Selec-tor) from the control plane. Thus, during the rebuilt ROUTESCOUT
will not be able to respond to new performance opportunities butwill instead use its previous decisions.
5 HARDWARE DESIGNOur design needs modification to fit a real Protocol IndependentSwitch Architecture (PISA) switch. We briefly explain the key con-straints imposed by PISA and how we adapted the Delay and Lossmonitors accordingly. Our design takes up 10 physical pipelinestages , and we have fully implemented it in a Barefoot TofinoWedge 100BF-32X.PISA constraints: A packet traversing a PISA switch goes througha pipeline of stages. Besides the limited memory and instructionset, which our design already addresses, there are constraints on thesequence of memory accesses [13, 62]. First, a packet cannot read orwrite multiple memory addresses in the same memory block. Second,memory blocks are tied to a single stage in the pipeline and can onlybe accessed in it. This is to avoid contention from stages processingdifferent packets simultaneously. Similarly, accessing stages in adifferent order or multiple times per packet is not possible.Delay Monitor modifications: To access any Bloom Filter, includ-ing those in the Delay Monitor, we need to access multiple indexes,each corresponding to the output of a hash. For instance, in Fig. 4a,
1 1+12 03 1+14 2+15 06 07 08 0
S:5500E:6500
1 2-12 03 2-14 3-15 0+16 0+17 08 0+1
S:6500E:7500
1 32
3 14 25 16 17 08 1
S:4500E:5500
1 12 03 14 25 06 07 08 0
1 1+12 03 1+14 2+15 06 07 08 0
S:5500E:6500
1 2-12 03 2-14 3-15 06 07 08 0
S:6500E:7500
1 12 0+13 14 25 0+16 07 0+18 0
S:7500E:8500
ACC C
T2 1
T1 1
T2⊕ T3 2
ACC C
T1 1
T1⊕ T3 2
ACC C
T2 1
0 0
T3 1
Stage1 Stage2 Stage3
SYN
Packet #1 Packet #3Packet #2
0
(a)
1 1+12 03 1+14 2+15 06 07 08 0
S:5500E:6500
1 2-12 03 2-14 3-15 0+16 0+17 08 0+1
S:6500E:7500
1 32
3 14 25 16 17 08 1
S:4500E:5500
1 12 03 14 25 06 07 08 0
1 1+12 03 1+14 2+15 06 07 08 0
S:5500E:6500
1 2-12 03 2-14 3-15 06 07 08 0
S:6500E:7500
1 12 0+13 14 25 0+16 07 0+18 0
S:7500E:8500
ACC C
T2 1
T1 1
T2⊕ T3 2
ACC C
T1 1
T1⊕ T3 2
ACC C
T2 1
0 0
T3 1
Stage1 Stage2 Stage3
SYN
Packet #1 Packet #3Packet #2
0
(b)
Figure 6: (a) We implement the Delay monitor as a series of arrays; (b)A packet can either check if it is expected or insert the next expectedpacket in the Loss monitor.
the yellow SYN would need to access three indexes correspondingto the yellow indexes. In PISA, though, one cannot concurrentlyaccess multiple indexes of the same memory block. We thus dividethe two tables of the monitor into smaller chunks and constrain eachhash to index a single chunk as seen in Fig. 6a. Now, chunks residein different stages of the pipeline and can be accessed serially.
Serializing accesses creates another issue. Particularly, when anACK arrives, the monitor first needs to find out if it corresponds tothe first ACK of a flow whose SYN is in the Accumulator (Fig. 4b),and if so, decrement all corresponding indexes in the Counter. Forthis, the SYN will need to traverse all three pipeline stages in Fig. 6ato check whether all corresponding indexes of the Counter are non-zero. But after doing so, the packet cannot return to stage 1 anddecrease their values in the Counter. To address this, the monitorrecirculates packets corresponding to the first ACKs. Observe thateven if we could rely on SYNACK, which is impractical due toasymmetric routing, we would still not be able to avoid recircula-tion. Indeed, even if an incoming ACK knew upon arrival that thetimestamp of the corresponding SYN is in the structure, it will stillneed to find a reversible index to read this timestamp and then ⊕ itto all (previous) stages. As an illustration, in Fig. 6a, the reversibleindex is in stage 3. When the packet reads it, it can no longer returnto stages 1 and 2, and ⊕ it to the corresponding indexes.Loss Monitor modifications: Similarly here we need to split theCBF into multiple chunks and stages. Recall that every incomingpacket needs to check if it is expected, remove itself, and insert thenext expected packet in the CBF. This results in two violations ofthe PISA constraints.
First, a packet needs to access each memory chunk (in each stage)in two different indexes, one corresponding to the output of itself,whose value it needs to decrement, and one corresponding to thenext expected packet, whose value it needs to increase. Second, theformer access is conditioned on whether the packet is expected orretransmission, something which will only be known after the packettraversed all stages.
To address the first violation, we allow each packet one of thetwo operations, either to remove itself if it is expected or to insertthe next expected one iteratively. To achieve this, we keep track ofthe number of packets seen by each flow. Particularly, when a packetarrives, it checks the number of non-zero-payload packets its flowhas already sent. If this number is even, as for S:5500 and S:7500in Fig. 6b, then the packet will insert the next expected one in theCBF. If the number is odd, as for S:6500 in Fig. 6b, the packet will

SOSR ’21, October 11–12, 2021, Virtual Event, USA Maria Apostolaki, Ankit Singla, and Laurent Vanbever
try to find its footprint in the CBF and remove it. We use a countingbloom filter to keep track of the number of packets efficiently.
To address the second violation, we assume all packets to beexpected and recirculate packets that violate this assumption. Inmore detail, on arrival, a packet whose flow has sent an odd numberof packets reads and decrements the indexes corresponding to itin the CBF. If the packet was indeed expected, i.e., all read valuesare non-zero (as for S:6500 in Fig. 6b), the packet increments theAccumulator and leaves the device. If the packet was retransmission,it is recirculated to re-increment the indexes it wrongly decremented.
6 ROUTESCOUT CONTROL PLANEIn this section, we describe ROUTESCOUT’s control plane and howit leverages measurements from the data plane to improve forward-ing decisions. This is a challenging problem as due to bandwidthlimitations, load-balancing preferences, or stability concerns trafficcannot always be forwarded to the most performant route. We startby describing the control-plane inputs (§6.1). We then explain howit solves the induced optimization problem (§6.2).
We describe the simplest version of the control plane that wouldenable performance-driven routing and support conflicting operatorobjectives. To cover additional operational needs, this control planecan be extended, for instance, to strengthen stability guarantees asshown in [30].
6.1 InputsROUTESCOUT triggers the Solver periodically giving as input adescription of the environment, a set of objectives, and optionally,some additional constraints for each prefix, together with fresh per-formance statistics.Environment: The network environment includes topological, traf-fic, and routing information. The former two are provided by theoperator and the latter by BGP. Topological information correspondsto the set of direct next-hops and their link capacities. Traffic in-formation consists of the set of prefixes that ROUTESCOUT shouldoptimize for, together with the volumes they drive. Routing informa-tion corresponds to the set of next-hops that ROUTESCOUT can useto route each prefix (obtained from routing tables and BGP policies).
Expecting traffic information is reasonable as important prefixesare few and stable over time [27, 53]. The traffic volumes to theseprefixes can also be estimated accurately [38, 52]. Note that inaccu-rate traffic volumes won’t affect ROUTESCOUT’s performance if thedirect links are not running at full capacity, which is true in moststub ISPs. If that’s not the case, ROUTESCOUT might indeed notfind the optimal solution but will never deteriorate the performanceby moving traffic to a worse next hop.Objectives: The operator can decide for each destination prefixwhether they want to: (i) optimize for the delay and/or loss; (ii) mini-mize the number of traffic shifts necessary to meet the requirements;or (iii) load-balance traffic by minimizing the difference betweenthe most- and the least-used next-hop. Linear combinations of theseor similar other objectives are easily implementable.
ROUTESCOUT also allows multiple objectives to be flexibly im-plemented. To do so, the operator needs to express how importanteach objective is by defining priorities and how valuable are the
differences among alternative forwarding states by defining toler-ance levels. Objectives with lower priority will only be optimizedif there are multiple equally-preferred solutions, namely solutionsthat differ from the optimal by no more than the tolerance level.For example, an operator might want to balance the load across thenext-hops, as long as the delay difference between the best- and theused next-hop is lower than 10%. The operator can communicatethis to ROUTESCOUT by assigning a high priority to delay with 10%tolerance and a lower priority to load-balancing.
Operational constraints: ROUTESCOUT admits constraints oftwo types: (i) those that limit the number of next-hops traffic can bespread on; and (ii) those that define performance constraints. Con-straining the maximum number of next-hops per destination mightbe useful, for instance, to ease debugging. Performance constraintsare maximum loss/delay values that traffic for a certain destinationshould experience. Defining such objectives is useful for meetingService Level Agreements (SLAs) or particular application require-ments.Data plane statistics: ROUTESCOUT periodically pulls measure-ments of loss and delay aggregated per prefix and next-hop from therespective aggregators.
6.2 SolverThe solver is responsible for synthesizing a forwarding state. To doso, it formulates each of the operator’s inputs into a constraint oran objective, creating a linear optimization problem. Since somevariables are integer, e.g., number of slots per prefix, our problem isan Integer Linear Problem.Problem statement: Let 𝑁 be a set of next-hops and 𝑃𝑟 the set ofdestination prefixes to optimize for. Let 𝑃𝑎 ⊆ 𝑃𝑟 × 𝑁 be the set ofall pairs of destinations and equally-preferred next-hops (learnedby BGP). The goal is to find a mapping 𝐹𝑡 : 𝑃𝑎 → N, namely thenumber of slots allocated to each pair (prefix, next-hop) at time 𝑡such that it optimizes the operator’s objectives while adhering to theenvironmental and operational constraints. We implement the Solverusing Gurobi [3].
7 EVALUATIONWe evaluate ROUTESCOUT’s Delay monitor (§7.2), Loss monitor(§7.3) and Solver (§7.4). For the monitors, we investigate the trade-off between accuracy and memory footprint using real traffic tracesand our practical hardware design (§5). We find that, with 1 MBof memory, the Delay monitor can accurately measure the delay ofhundreds of thousands of flows/sec. Moreover, the Loss monitor canaccurately measure the loss rate of 36𝐾 flows/sec with as little as312KB of memory. For the Solver, we focus on runtime and showthat it computes forwarding states for thousands of destinations,across tens of next hops and for various objectives, in less than asecond.
7.1 MethodologyTo evaluate ROUTESCOUT’s monitors, we estimate the memory theyuse as a function of their accuracy via both theoretical and practicalmeans. For the theoretical analysis, we assume perfectly behavedTCP traffic (in-order, with expected semantics), with flow rates

Performance-Driven Internet Path Selection SOSR ’21, October 11–12, 2021, Virtual Event, USA
0
5
10
15
20
25
0 5 10 15 20 25 30
Non
-Inve
rtibi
lity
(%)
Time (sec)
160K320K640K
(a) The probability of an ACK to decode its SYN’stimestamp is >95% with a 1MB (640K elems) Delaymonitor of 2 hashes.
0 2 4 6 8
10 12 14 16
0 5 10 15 20 25 30
Loss
Inac
cura
cy
Time (sec)
160K320K640K
(b) Using 625KB (640K elems) and 2 hashes, the Lossmonitor calculates the loss rate with high accuracy.
Target 50th 70th 95th
# moves 0.02 0.03 0.29balance 0.03 0.04 0.4performance 0.08 0.3 1.09combined 0.03 0.05 1.23
(c) Runtime percentiles in seconds depend on thecomplexity of the objective.
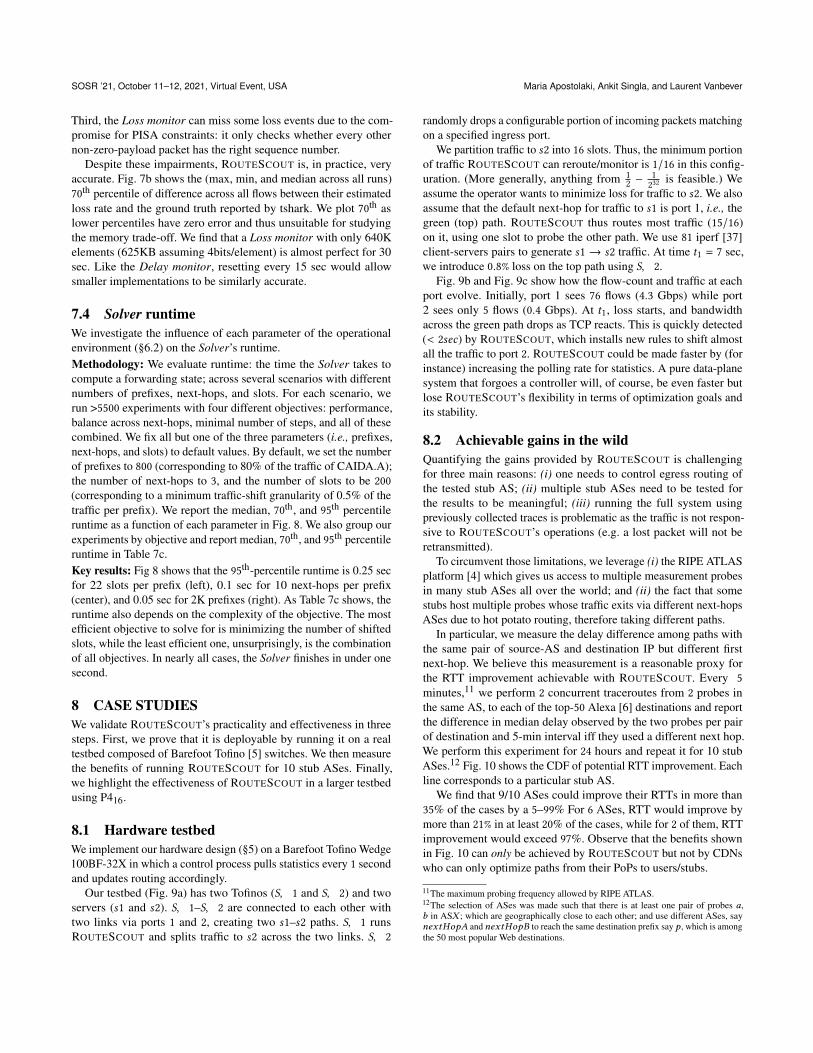
Figure 7
derived from real traces, and the original design as described in §4.2,§4.3 with 9 hash functions9 and without any additional hardwarelimitations. For the practical analysis, we use real traffic traces andour hardware design for Tofino, with only 2 hash functions10.
For the theoretical analysis, we use two different directions ofCAIDA traces (CAIDA.A, CAIDA.B) collected at the Equinix-Chicago monitor in March 2018 [1], and one from MAWI [21] fromJanuary 2018. Together, these contain ∼6 billion packets with anaverage rate ranging from 240-3200 Mbps. For the practical analysis,we use the CAIDA.A trace, which is the noisiest, and feed it to themonitors in 100 chunks of 30 seconds. While none of those tracesare from a stub network, this has no impact on our analysis, as weare only interested in estimating accuracy and resource usage.
7.2 Delay monitorAccuracy metric: We calculate the invertibility, namely the proba-bility of a successfully computed delay. The delay between a SYNand its corresponding ACK can be successfully computed if uponarrival of the ACK, there is at least one index that contains only thetimestamp of the SYN. Other than the memory used, invertibilitydepends on the number of concurrent delay measurements, the num-ber of hash functions used, and the pollution of the structure due totraffic noise, e.g., SYNs that are not followed by ACKs.Theoretical analysis: In theory, invertibility is the inverse of theprobability of false positive in a regular Bloom Filter: the probabilityof a SYN being ⊕ed to indexes that all contain other timestampsis the same as finding all hash outputs set in a regular Bloom Fil-ter during a lookup. We calculate the memory requirements for aninvertibility of 99.9% (false positive rate in BF of 0.1%) using theanalytical formula for optimal Bloom Filter design [16]. For thesecalculations, we assume that each handshake completes in <1 sec,and that ROUTESCOUT needs to monitor all flows in each trace. Theresults are summarized in Table 1. The Delay monitor would need12.9K-781.5K elements, corresponding to 6KB–381KB memory as-suming an implementation over an array of 16-bit values using 9hash functions.Practical analysis: In practice, the filter is gradually polluted bySYNs that are not followed by ACKs. This can happen, e.g., underSYN attacks, or when hosts try to reach an offline server. Such noise
9We chose 9 following the Bloom Filters heuristic [16].10More engineering effort might allow implementation of more hashes.
Trace SYNs/s Elements Delay M Flows/s Elements Loss M
CAIDA.A 3.8K 54.2K 26KB 36.8K 529.1K 1MBCAIDA.B 54.4K 781.5K 381KB 233.8K 3361.3K 6MBMAWI 899 12.9K 6KB 3.3K 47.8K 93KB
Table 1: Delay monitor and Loss monitor would combined need 6.4M tomonitor as many flows/s as there are in the CAIDA.B trace.
is common in our traces: in the noisiest trace (which we use for thisevaluation), only 40% of the SYNs are followed by ACKs. Fig. 7ashows the median, max, and min non-invertibility probability as afunction of time using {160K, 320K, 640K} elements in the datastructure. As expected, the failure probability increases with time asthe filter gets polluted. Still, ROUTESCOUT is very efficient. Indeed,a Delay monitor with only 320K elements has an invertibility of>90%. Another interesting insight is that we can do this with lessmemory if we periodically reset our Delay monitor, e.g., with only160K elements (312KB), we get the same >90% invertibility if wereset it every 15 seconds.
7.3 Loss monitorAccuracy metric: We compare the measured loss per flow to itsactual loss rate. ROUTESCOUT’s accuracy is affected by false pos-itives: a retransmitted packet can be considered expected (insteadof correctly being assessed as unexpected) and thus not countedtowards loss, if all the indexes it hashes to are set. As the Loss moni-tor is a CBF, its false-positive rate depends on the memory and thenumber of hashes used.Theoretical analysis: We use the same method as for the Delaymonitor, to calculate memory requirements for achieving a falsepositive rate of <0.1%. The results are summarized in Table 1. TheLoss monitor would need 47.8K–3.4M elements depending on thenumber of flows/sec in the trace. This corresponds to 93K–6M mem-ory if the Loss monitor is implemented as an array of 4-bit valueswith 9 hash functions.Practical analysis: In practice, the Loss monitor’s accuracy is deteri-orated by three more factors. First, out-of-order packets are not onlyclassified as losses but also pollute the structure as explained in §4.3.Second, flows terminating unexpectedly (i.e., without FIN/RST) re-main in the monitor until it is reset, decreasing its effective capacity.
SOSR ’21, October 11–12, 2021, Virtual Event, USA Maria Apostolaki, Ankit Singla, and Laurent Vanbever
Third, the Loss monitor can miss some loss events due to the com-promise for PISA constraints: it only checks whether every othernon-zero-payload packet has the right sequence number.
Despite these impairments, ROUTESCOUT is, in practice, veryaccurate. Fig. 7b shows the (max, min, and median across all runs)70th percentile of difference across all flows between their estimatedloss rate and the ground truth reported by tshark. We plot 70th aslower percentiles have zero error and thus unsuitable for studyingthe memory trade-off. We find that a Loss monitor with only 640Kelements (625KB assuming 4bits/element) is almost perfect for 30sec. Like the Delay monitor, resetting every 15 sec would allowsmaller implementations to be similarly accurate.
7.4 Solver runtimeWe investigate the influence of each parameter of the operationalenvironment (§6.2) on the Solver’s runtime.Methodology: We evaluate runtime: the time the Solver takes tocompute a forwarding state; across several scenarios with differentnumbers of prefixes, next-hops, and slots. For each scenario, werun >5500 experiments with four different objectives: performance,balance across next-hops, minimal number of steps, and all of thesecombined. We fix all but one of the three parameters (i.e., prefixes,next-hops, and slots) to default values. By default, we set the numberof prefixes to 800 (corresponding to 80% of the traffic of CAIDA.A);the number of next-hops to 3, and the number of slots to be 200(corresponding to a minimum traffic-shift granularity of 0.5% of thetraffic per prefix). We report the median, 70th, and 95th percentileruntime as a function of each parameter in Fig. 8. We also group ourexperiments by objective and report median, 70th, and 95th percentileruntime in Table 7c.Key results: Fig 8 shows that the 95th-percentile runtime is 0.25 secfor 22 slots per prefix (left), 0.1 sec for 10 next-hops per prefix(center), and 0.05 sec for 2K prefixes (right). As Table 7c shows, theruntime also depends on the complexity of the objective. The mostefficient objective to solve for is minimizing the number of shiftedslots, while the least efficient one, unsurprisingly, is the combinationof all objectives. In nearly all cases, the Solver finishes in under onesecond.
8 CASE STUDIESWe validate ROUTESCOUT’s practicality and effectiveness in threesteps. First, we prove that it is deployable by running it on a realtestbed composed of Barefoot Tofino [5] switches. We then measurethe benefits of running ROUTESCOUT for 10 stub ASes. Finally,we highlight the effectiveness of ROUTESCOUT in a larger testbedusing P416.
8.1 Hardware testbedWe implement our hardware design (§5) on a Barefoot Tofino Wedge100BF-32X in which a control process pulls statistics every 1 secondand updates routing accordingly.
Our testbed (Fig. 9a) has two Tofinos (𝑆𝑊 1 and 𝑆𝑊 2) and twoservers (𝑠1 and 𝑠2). 𝑆𝑊 1–𝑆𝑊 2 are connected to each other withtwo links via ports 1 and 2, creating two 𝑠1–𝑠2 paths. 𝑆𝑊 1 runsROUTESCOUT and splits traffic to 𝑠2 across the two links. 𝑆𝑊 2
randomly drops a configurable portion of incoming packets matchingon a specified ingress port.
We partition traffic to 𝑠2 into 16 slots. Thus, the minimum portionof traffic ROUTESCOUT can reroute/monitor is 1/16 in this config-uration. (More generally, anything from 1
2 − 1232 is feasible.) We
assume the operator wants to minimize loss for traffic to 𝑠2. We alsoassume that the default next-hop for traffic to 𝑠1 is port 1, i.e., thegreen (top) path. ROUTESCOUT thus routes most traffic (15/16)on it, using one slot to probe the other path. We use 81 iperf [37]client-servers pairs to generate 𝑠1 → 𝑠2 traffic. At time 𝑡1 = 7 sec,we introduce 0.8% loss on the top path using 𝑆𝑊 2.
Fig. 9b and Fig. 9c show how the flow-count and traffic at eachport evolve. Initially, port 1 sees 76 flows (4.3 Gbps) while port2 sees only 5 flows (0.4 Gbps). At 𝑡1, loss starts, and bandwidthacross the green path drops as TCP reacts. This is quickly detected(< 2𝑠𝑒𝑐) by ROUTESCOUT, which installs new rules to shift almostall the traffic to port 2. ROUTESCOUT could be made faster by (forinstance) increasing the polling rate for statistics. A pure data-planesystem that forgoes a controller will, of course, be even faster butlose ROUTESCOUT’s flexibility in terms of optimization goals andits stability.
8.2 Achievable gains in the wildQuantifying the gains provided by ROUTESCOUT is challengingfor three main reasons: (i) one needs to control egress routing ofthe tested stub AS; (ii) multiple stub ASes need to be tested forthe results to be meaningful; (iii) running the full system usingpreviously collected traces is problematic as the traffic is not respon-sive to ROUTESCOUT’s operations (e.g. a lost packet will not beretransmitted).
To circumvent those limitations, we leverage (i) the RIPE ATLASplatform [4] which gives us access to multiple measurement probesin many stub ASes all over the world; and (ii) the fact that somestubs host multiple probes whose traffic exits via different next-hopsASes due to hot potato routing, therefore taking different paths.
In particular, we measure the delay difference among paths withthe same pair of source-AS and destination IP but different firstnext-hop. We believe this measurement is a reasonable proxy forthe RTT improvement achievable with ROUTESCOUT. Every 5minutes,11 we perform 2 concurrent traceroutes from 2 probes inthe same AS, to each of the top-50 Alexa [6] destinations and reportthe difference in median delay observed by the two probes per pairof destination and 5-min interval iff they used a different next hop.We perform this experiment for 24 hours and repeat it for 10 stubASes.12 Fig. 10 shows the CDF of potential RTT improvement. Eachline corresponds to a particular stub AS.
We find that 9/10 ASes could improve their RTTs in more than35% of the cases by a 5–99% For 6 ASes, RTT would improve bymore than 21% in at least 20% of the cases, while for 2 of them, RTTimprovement would exceed 97%. Observe that the benefits shownin Fig. 10 can only be achieved by ROUTESCOUT but not by CDNswho can only optimize paths from their PoPs to users/stubs.
11The maximum probing frequency allowed by RIPE ATLAS.12The selection of ASes was made such that there is at least one pair of probes 𝑎,𝑏 in AS𝑋 ; which are geographically close to each other; and use different ASes, say𝑛𝑒𝑥𝑡𝐻𝑜𝑝𝐴 and𝑛𝑒𝑥𝑡𝐻𝑜𝑝𝐵 to reach the same destination prefix say 𝑝 , which is amongthe 50 most popular Web destinations.

Performance-Driven Internet Path Selection SOSR ’21, October 11–12, 2021, Virtual Event, USA
0 1 2 3 4 5 6
1 10 100 1000 10000 100000 1x10⁶ 1x10⁷ 1x10⁸
Run
Tim
e (s
ec)
# Slots
p50p70p95
0 0.1 0.2 0.3 0.4 0.5 0.6
1 10 100
Run
time
(sec
)
# Next Hops
p50p70p95
0 0.05
0.1 0.15
0.2 0.25
0.3 0.35
0.4 0.45
0.5 0.55
100 1000 10000
Run
time
(sec
)
# Prefixes
p50p70p95
Figure 8: ROUTESCOUT is fast even when run with an increasing number of slots, next hops and destinations.
RouteScoutDrops
S1 S2SW1 SW2
(a) Two Tofinos set up two 𝑠1-𝑠2 paths. 𝑆𝑊 1 runsROUTESCOUT and 𝑆𝑊 2 introduces loss in betweenthe experiment.
0 10 20 30 40 50 60 70 80 90
2 4 6 8 10 12 14 16 18 20
Flow
Num
ber
Time (s)
port 1port 2
(b) Number of flows routed via each alternative portchanges after the increased loss is detected. Trafficshift takes <2𝑠𝑒𝑐 .
0
1
2
3
4
5
2 4 6 8 10 12 14 16 18 20
Rat
e (G
Bps
)
Time (s)
port 1port 2
(c) Bandwidth drop in port 1 is visible immedi-ately after the loss is introduced and is clearer afterROUTESCOUT reroutes traffic.
Figure 9
Figure 10: CDF of the relative RTT improvement each source AS shouldexpect from delay-aware routing. 8 of the 10 ASes could improve thelatency of at least 20% of the cases by 12–99%.
8.3 ROUTESCOUT in a networkWe implement ROUTESCOUT in the P4 behavioral model (BMV2) [7]using ∼900 lines of P416. We emulate a network scenario with astub that runs ROUTESCOUT and 10 destination networks towardseach of which it has 3 next-hops. The network scenario has 14 ASes,and 33 10 Mbps AS-to-AS links. The end-end delays are configuredbased on the latency differences observed in our RIPE experiments(§8.2). We assume that BGP has selected the first next hop for allprefixes. The goal of ROUTESCOUT’s operator is to minimize thedelay.
We use D-ITG [17] to create 10 TCP flows of constant rate toeach of the destinations, resulting in 0.2 Mbps of aggregated traffic.We configure ROUTESCOUT to use 50 slots in total; as all prefixes
0
20
40
60
80
100
0 10 20 30 40 50 60 70 80 90 100
CD
F
Relative RTT improvement (%)
Figure 11: CDF of % delay improvement with ROUTESCOUT.
drive the same traffic volume, each gets 5 slots. We run the experi-ment 10 times and report (Fig. 11) the CDF of improvement on theaverage end-end delay compared with the initial state. We see thatROUTESCOUT improves the delay in half of the cases by 32% ormore.
9 CONCLUSIONROUTESCOUT is a modern answer to the old problem of performance-aware Internet routing. Leveraging the capabilities of programmableswitches, ROUTESCOUT continually and accurately monitors pathperformance at scale with low compute, memory, and bandwidthfootprints. Based on these measurements, ROUTESCOUT controlplane then reroutes traffic along policy-equivalent paths, fulfilling
SOSR ’21, October 11–12, 2021, Virtual Event, USA Maria Apostolaki, Ankit Singla, and Laurent Vanbever
the operators’ objectives. ROUTESCOUT is BGP-compatible, deploy-able without coordination across ASes and without network-wideupdates, improving Internet routing one switch at a time.
10 ACKNOWLEDGMENTSWe thank the NSG Group for their support and feedback during thiswork. We also thank the anonymous reviewers for their insightfulcomments and suggestions. This work was supported by a SwissNational Science Foundation Grant (“Data-Driven Internet Routing”,#200021- 175525).
REFERENCES[1] [n.d.]. Caida Anonymized Internet Traces 2015. http://www.caida.org/data/
passive/passive_2015_dataset.xml.[2] [n.d.]. CAIDA Macroscopic Internet Topology Data Kit. https://www.caida.org/
data/internet-topology-data-kit/.[3] [n.d.]. Gurobi Solver. http://www.gurobi.com/.[4] [n.d.]. RIPE NCC. RIPE Atlas. https://atlas.ripe.net.[5] 2018. Barefoot. Barefoot Tofino, World’s fastest P4-programmable Ether- net
switch ASICs. https://barefootnetworks.com/products/brief-tofino/.[6] 2018. The top 500 sites on the web. https://www.alexa.com/topsites.[7] 2019. P4 behavioral model. https://github.com/p4lang/behavioral-model.[8] Aditya Akella, Bruce Maggs, Srinivasan Seshan, and Anees Shaikh. 2008. On the
performance benefits of multihoming route control. IEEE/ACM Transactions onNetworking (TON) 16, 1 (2008), 91–104.
[9] Aditya Akella, Bruce Maggs, Srinivasan Seshan, Anees Shaikh, and RameshSitaraman. 2003. A measurement-based analysis of multihoming. In Proceedingsof the 2003 conference on Applications, technologies, architectures, and protocolsfor computer communications. ACM, 353–364.
[10] Aditya Akella, Srinivasan Seshan, and Anees Shaikh. 2004. Multihoming Perfor-mance Benefits: An Experimental Evaluation of Practical Enterprise Strategies..In USENIX Annual Technical Conference, General Track. 113–126.
[11] David Andersen, Hari Balakrishnan, Frans Kaashoek, and Robert Morris. 2002.Resilient overlay networks. ACM SIGCOMM Computer Communication Review32, 1 (2002), 66–66.
[12] Todd Arnold, Matt Calder, Italo Cunha, Arpit Gupta, Harsha V. Madhyastha,Michael Schapira, and Ethan Katz-Bassett. 2019. Beating BGP is Harder than WeThought. In ACM HotNets.
[13] Ran Ben-Basat, Xiaoqi Chen, Gil Einziger, and Ori Rottenstreich. 2018. EfficientMeasurement on Programmable Switches Using Probabilistic Recirculation. 2018IEEE 26th International Conference on Network Protocols (ICNP) (Sep 2018).https://doi.org/10.1109/icnp.2018.00047
[14] Debopam Bhattacherjee, Waqar Aqeel, Ilker Nadi Bozkurt, Anthony Aguirre,Balakrishnan Chandrasekaran, P Godfrey, Gregory Laughlin, Bruce Maggs, andAnkit Singla. 2018. Gearing up for the 21st century space race. In ACM HotNets.
[15] Ethan Blanton and Mark Allman. 2002. On making TCP more robust to packetreordering. ACM SIGCOMM Computer Communication Review 32, 1 (2002),20–30.
[16] Burton H. Bloom. 1970. Space/Time Trade-offs in Hash Coding with AllowableErrors. Commun. ACM 13, 7 (July 1970), 422–426. https://doi.org/10.1145/362686.362692
[17] Alessio Botta, Alberto Dainotti, and Antonio Pescapè. 2012. A tool for thegeneration of realistic network workload for emerging networking scenarios.Computer Networks 56, 15 (2012), 3531–3547.
[18] Alan Boyle. 2019. Amazon to offer broadband access from orbit with 3,236-satellite ‘Project Kuiper’ constellation. https://www.geekwire.com/2019/amazon-project-kuiper-broadband-satellite/.
[19] Fangfei Chen, Ramesh K Sitaraman, and Marcelo Torres. 2015. End-user mapping:Next generation request routing for content delivery. ACM SIGCOMM ComputerCommunication Review 45, 4 (2015), 167–181.
[20] Xiaoqi Chen, Hyojoon Kim, Javed M Aman, Willie Chang, Mack Lee, and JenniferRexford. 2020. Measuring tcp round-trip time in the data plane. In Proceedings ofthe Workshop on Secure Programmable Network Infrastructure. 35–41.
[21] Kenjiro Cho, Koushirou Mitsuya, and Akira Kato. 2000. Traffic Data Repositoryat the WIDE Project. In Proceedings of the Annual Conference on USENIX AnnualTechnical Conference (San Diego, California) (ATEC ’00). USENIX Association,Berkeley, CA, USA, 51–51. http://dl.acm.org/citation.cfm?id=1267724.1267775
[22] Cisco Performance Routing (PfR). [n.d.]. https://www.cisco.com/c/en/us/products/ios-nx-os-software/performance-routing-pfr/index.html.
[23] Benoit Claise. 2004. Cisco Systems NetFlow Services Export Version 9. RFC3954 (Informational). http://www.ietf.org/rfc/rfc3954.txt.
[24] D. Clark, S. Bauer, K. Claffy, A. Dhamdhere, B. Huffaker, W. Lehr, and M. Luckie.2014. Measurement and Analysis of Internet Interconnection and Congestion. In
Telecommunications Policy Research Conference (TPRC).[25] Anwar Elwalid, Cheng Jin, Steven Low, and Indra Widjaja. 2001. MATE: MPLS
adaptive traffic engineering. (2001).[26] Li Fan, Pei Cao, Jussara Almeida, and Andrei Z. Broder. 2000. Summary Cache:
A Scalable Wide-area Web Cache Sharing Protocol. IEEE/ACM Trans. Netw. 8, 3(June 2000), 281–293. https://doi.org/10.1109/90.851975
[27] Wenjia Fang and Larry Peterson. 1999. Inter-AS traffic patterns and their im-plications. In Seamless Interconnection for Universal Services. Global Telecom-munications Conference. GLOBECOM’99.(Cat. No. 99CH37042), Vol. 3. IEEE,1859–1868.
[28] Riot Games. 2016. Fixing the Internet for Real-time Applications. https://engineering.riotgames.com/news/fixing-internet-real-time-applications-part-ii.
[29] Lixin Gao and Jennifer Rexford. 2001. Stable internet routing without globalcoordination. IEEE/ACM Trans. Netw. 9 (December 2001), 681–692. Issue 6.https://doi.org/10.1109/90.974523
[30] Ruomei Gao, Constantinos Dovrolis, and Ellen W Zegura. 2006. Avoiding Oscil-lations Due to Intelligent Route Control Systems.. In INFOCOM.
[31] Mojgan Ghasemi, Theophilus Benson, and Jennifer Rexford. 2017. Dapper: DataPlane Performance Diagnosis of TCP. In Proceedings of the Symposium on SDNResearch (Santa Clara, CA, USA) (SOSR ’17). ACM, New York, NY, USA, 61–74.https://doi.org/10.1145/3050220.3050228
[32] David K Goldenberg, Lili Qiuy, Haiyong Xie, Yang Richard Yang, and Yin Zhang.2004. Optimizing cost and performance for multihoming. In ACM SIGCOMMComputer Communication Review, Vol. 34. ACM, 79–92.
[33] Michael T. Goodrich and Michael Mitzenmacher. 2011. Invertible Bloom LookupTables. CoRR abs/1101.2245 (2011). http://arxiv.org/abs/1101.2245
[34] Thomas Holterbach, Edgar Costa Molero, Maria Apostolaki, Alberto Dainotti,Stefano Vissicchio, and Laurent Vanbever. 2019. Blink: Fast connectivity recoveryentirely in the data plane. In 16th {USENIX} Symposium on Networked SystemsDesign and Implementation ({NSDI} 19). 161–176.
[35] Kuo-Feng Hsu, Ryan Beckett, Ang Chen, Jennifer Rexford, and David Walker.2020. Contra: A Programmable System for Performance-aware Routing. In 17thUSENIX Symposium on Networked Systems Design and Implementation (NSDI20). USENIX Association, Santa Clara, CA, 701–721. https://www.usenix.org/conference/nsdi20/presentation/hsu
[36] IP SLAs Configuration Guide. Cisco IOS. [n.d.]. https://www.cisco.com/c/en/us/td/docs/ios-xml/ios/ipsla/configuration/15-mt/sla-15-mt-book/sla_icmp_echo.html.
[37] iPerf - The ultimate speed test tool for TCP, UDP and SCTP. [n.d.]. https://iperf.fr/.[38] Muhammad Faisal Iqbal, Muhammad Zahid, Durdana Habib, and Lizy Kurian
John. 2019. Efficient Prediction of Network Traffic for Real-Time Applications.Journal of Computer Networks and Communications 2019 (2019).
[39] Hao Jiang and Constantinos Dovrolis. 2002. Passive Estimation of TCP Round-trip Times. SIGCOMM Comput. Commun. Rev. 32, 3 (July 2002), 75–88. https://doi.org/10.1145/571697.571725
[40] Xin Jin, Xiaozhou Li, Haoyu Zhang, Robert Soulé, Jeongkeun Lee, Nate Foster,Changhoon Kim, and Ion Stoica. 2017. NetCache: Balancing Key-Value Storeswith Fast In-Network Caching. In Proceedings of the 26th Symposium on Oper-ating Systems Principles (Shanghai, China) (SOSP ’17). ACM, New York, NY,USA, 121–136. https://doi.org/10.1145/3132747.3132764
[41] Srikanth Kandula, Dina Katabi, Bruce Davie, and Anna Charny. 2005. Walking thetightrope: Responsive yet stable traffic engineering. In ACM SIGCOMM ComputerCommunication Review, Vol. 35. ACM, 253–264.
[42] Jorma Kilpi. 2008. IP-availability and SLA. In Proc. of the International Euro-NFWorkshop on Traffic Management and Traffic Engineering for the Future Internet.
[43] Changhoon Kim, Anirudh Sivaraman, Naga Praveen Katta, Antonin Bas, Ad-vait Dixit, and Lawrence J Wobker. 2015. In-band Network Telemetry via Pro-grammable Dataplanes.
[44] Tobias Klenze, Giacomo Giuliari, Christos Pappas, Adrian Perrig, and DavidBasin. 2018. Networking in Heaven as on Earth. In ACM HotNets.
[45] Yuliang Li, Rui Miao, Changhoon Kim, and Minlan Yu. 2016. FlowRadar: ABetter NetFlow for Data Centers. In NSDI. USENIX Association, Santa Clara, CA,USA. https://www.usenix.org/conference/nsdi16/technical-sessions/presentation/li-yuliang
[46] Zaoxing Liu, Antonis Manousis, Gregory Vorsanger, Vyas Sekar, and VladimirBraverman. 2016. One sketch to rule them all: Rethinking network flow monitoringwith univmon. In Proceedings of the 2016 ACM SIGCOMM Conference. ACM,101–114.
[47] Pascal Mérindol, Virginie Van den Schrieck, Benoit Donnet, Olivier Bonaventure,and Jean-Jacques Pansiot. 2009. Quantifying Ases Multiconnectivity UsingMulticast Information. In Proceedings of the 9th ACM SIGCOMM Conferenceon Internet Measurement (Chicago, Illinois, USA) (IMC ’09). Association forComputing Machinery, New York, NY, USA, 370–376. https://doi.org/10.1145/1644893.1644937
[48] Masoud Moshref, Minlan Yu, Ramesh Govindan, and Amin Vahdat. 2014.DREAM: dynamic resource allocation for software-defined measurement. InACM SIGCOMM Computer Communication Review, Vol. 44. ACM, 419–430.

Performance-Driven Internet Path Selection SOSR ’21, October 11–12, 2021, Virtual Event, USA
[49] Srinivas Narayana, Anirudh Sivaraman, Vikram Nathan, Prateesh Goyal, VenkatArun, Mohammad Alizadeh, Vimalkumar Jeyakumar, and Changhoon Kim. 2017.Language-directed hardware design for network performance monitoring. In Pro-ceedings of the Conference of the ACM Special Interest Group on Data Communi-cation. ACM, 85–98.
[50] Peter Phaal, Sonia Panchen, and Neil McKee. 2001. InMon Corporation’s sFlow:A Method for Monitoring Traffic in Switched and Routed Networks. RFC 3176(Informational). http://www.ietf.org/rfc/rfc3176.txt.
[51] Y. Rekhter, T. Li, and S. Hares. 2006. A Border Gateway Protocol 4 (BGP-4).RFC 4271 (Draft Standard). http://www.ietf.org/rfc/rfc4271.txt
[52] Aimin Sang and San qi Li. 2000. A predictability analysis of network traffic.Proceedings IEEE INFOCOM 2000. Conference on Computer Communications.Nineteenth Annual Joint Conference of the IEEE Computer and CommunicationsSocieties (Cat. No.00CH37064) 1 (2000), 342–351 vol.1.
[53] Nadi Sarrar, Steve Uhlig, Anja Feldmann, Rob Sherwood, and Xin Huang. 2012.Leveraging Zipf’s law for traffic offloading. ACM SIGCOMM Computer Commu-nication Review 42, 1 (2012), 16–22.
[54] Stefan Savage, Thomas Anderson, Amit Aggarwal, David Becker, Neal Cardwell,Andy Collins, Eric Hoffman, John Snell, Amin Vahdat, Geoff Voelker, and JohnZahorjan. 1999. Detour: Informed Internet routing and transport. IEEE Micro(1999).
[55] Brandon Schlinker, Hyojeong Kim, Timothy Cui, Ethan Katz-Bassett, Harsha V.Madhyastha, Italo Cunha, James Quinn, Saif Hasan, Petr Lapukhov, and HongyiZeng. 2017. Engineering Egress with Edge Fabric: Steering Oceans of Content tothe World. In ACM SIGCOMM.
[56] Stephanie AC Schuckers. 2002. Spoofing and anti-spoofing measures. InformationSecurity technical report 7, 4 (2002), 56–62.
[57] SpaceX Starlink. [n.d.]. https://www.spacex.com/webcast.[58] Neil Spring, Ratul Mahajan, and Thomas Anderson. 2003. The causes of path
inflation. In Proceedings of the 2003 conference on Applications, technologies,architectures, and protocols for computer communications. ACM, 113–124.
[59] Hongsuda Tangmunarunkit, Ramesh Govindan, and Scott Shenker. 2001. Internetpath inflation due to policy routing. In ITCom 2001: International Symposium onthe Convergence of IT and Communications. International Society for Optics andPhotonics, 188–195.
[60] Olivier Tilmans, Tobias Bühler, Ingmar Poese, Stefano Vissicchio, and LaurentVanbever. 2018. Stroboscope: Declarative Network Monitoring on a Budget.In 15th USENIX Symposium on Networked Systems Design and Implementa-tion (NSDI 18). USENIX Association, Renton, WA. https://www.usenix.org/conference/nsdi18/presentation/tilmans
[61] Vytautas Valancius, Bharath Ravi, Nick Feamster, and Alex C Snoeren. 2013.Quantifying the benefits of joint content and network routing. In ACM SIGMET-RICS Performance Evaluation Review, Vol. 41. ACM, 243–254.
[62] Chen Xiaoqi, Feibish Shir, Landau, Rexford Yaron, Koral andJ ennifer, and Rot-tenstreich Ori. 2018. Catching the Microburst Culprits with Snappy. https://www.cs.princeton.edu/~jrex/papers/snappy18.pdf.
[63] Tong Yang, Jie Jiang, Peng Liu, Qun Huang, Junzhi Gong, Yang Zhou, Rui Miao,Xiaoming Li, and Steve Uhlig. 2018. Elastic sketch: Adaptive and fast network-wide measurements. In Proceedings of the 2018 Conference of the ACM SpecialInterest Group on Data Communication. ACM, 561–575.
[64] Kok-Kiong Yap, Murtaza Motiwala, Jeremy Rahe, Steve Padgett, Matthew Holli-man, Gary Baldus, Marcus Hines, Taeeun Kim, Ashok Narayanan, Ankur Jain,Victor Lin, Colin Rice, Brian Rogan, Arjun Singh, Bert Tanaka, Manish Verma,Puneet Sood, Mukarram Tariq, Matt Tierney, Dzevad Trumic, Vytautas Valancius,Calvin Ying, Mahesh Kallahalla, Bikash Koley, and Amin Vahdat. 2017. Takingthe Edge off with Espresso: Scale, Reliability and Programmability for GlobalInternet Peering. In ACM SIGCOMM.
[65] Minlan Yu, Lavanya Jose, and Rui Miao. 2013. Software Defined Traffic Measure-ment with OpenSketch. In Presented as part of the 10th {USENIX} Symposiumon Networked Systems Design and Implementation ({NSDI} 13). 29–42.
[66] Li Yuliang, Miao Rui, Kim‡ Changhoon, and Yu Minlan. 2016. LossRadar:Fast Detection of Lost Packets in Data Center Networks. In CoNEXT (Irvine,California, USA). ACM, New York, NY, USA, 15 pages.
[67] Yibo Zhu, Nanxi Kang, Jiaxin Cao, Albert Greenberg, Guohan Lu, Ratul Mahajan,Dave Maltz, Lihua Yuan, Ming Zhang, Ben Y. Zhao, and Haitao Zheng. 2015.Packet-Level Telemetry in Large Datacenter Networks. In Proceedings of the 2015ACM Conference on Special Interest Group on Data Communication (London,United Kingdom) (SIGCOMM ’15). ACM, New York, NY, USA, 479–491. https://doi.org/10.1145/2785956.2787483