performance challenges encountered with permeable reactive...
TRANSCRIPT

Performance Challenges Encountered with Permeable Reactive Barriers
David Blowes
University of Waterloo

Permeable Reactive BarrierPermeable Reactive Barrier
PermeablePermeableReactiveReactiveBarrierBarrierContaminantContaminant
SourceSource
Contaminant PlumeContaminant Plume

Reactive Barriers for Dissolved Reactive Barriers for Dissolved Metals and Inorganic ContaminantsMetals and Inorganic Contaminants•• Designed to:Designed to:
•• Change redox state of dissolved metalChange redox state of dissolved metal•• Precipitate insoluble solidsPrecipitate insoluble solids•• Adsorb contaminantsAdsorb contaminants
•• Objective:Objective:•• Passive treatment consistent with the scale and Passive treatment consistent with the scale and
duration of contamination problemsduration of contamination problems•• Status:Status:
•• Initial installations now in place for > 10 yearsInitial installations now in place for > 10 years

PRB for Treating Inorganic PRB for Treating Inorganic ContaminantsContaminants
United States
Canada
Pilot-ScaleFull-Scale
EuropeEuropeEuropeEurope

Typical Cost ComparisonTypical Cost Comparison
$0
$1,000,000
$2,000,000
$3,000,000
$4,000,000
$5,000,000
$6,000,000
$7,000,000
$8,000,000
$9,000,000
$10,000,000
0 2 4 6 8 10 12 14 16 18 20 22 24 26 28 30
Cum
ulat
ive
Pre
sent
Cos
tC
umul
ativ
e P
rese
nt C
ost
Time (Years)Time (Years)
Pump And Treat
Natural Attenuation
PRB with NA (10 yr life cycle)
PRB (10 yr life cycle)
R. Landis, R. Landis, DuPontDuPont Inc.Inc.
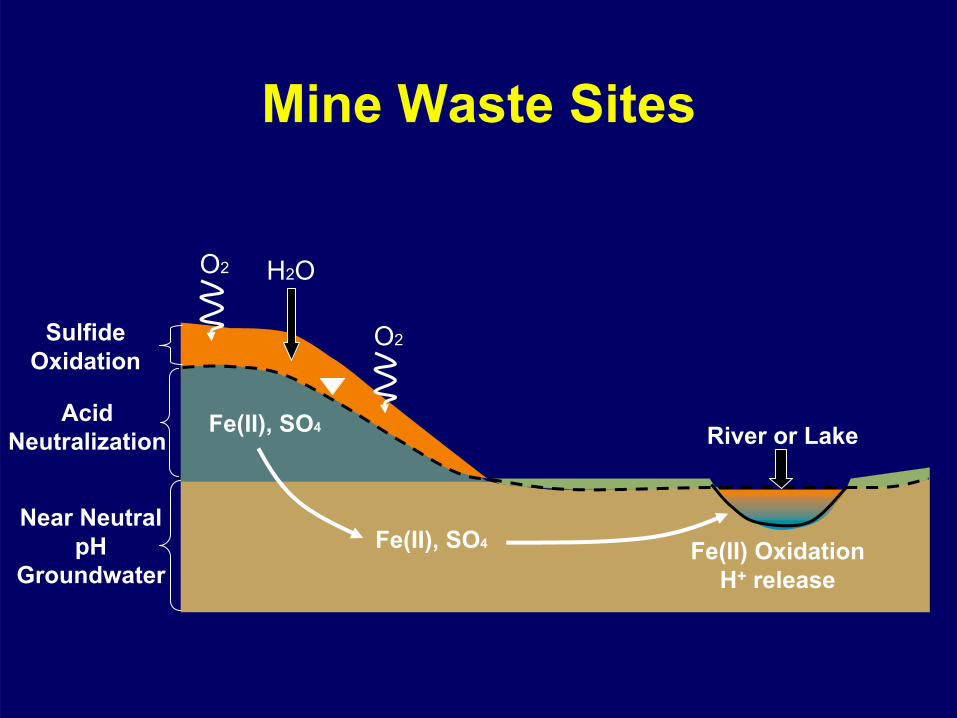
Fe(II), SO4
Fe(II) oxidationH release+
Fe(II), SO4Near Neutral
pH Groundwater
Acid Neutralization
Sulfide Oxidation
Fe(II), SO4
Fe(II), SO4 Fe(II) Oxidation H+ release
River or Lake
H2OO2
O2
Mine Waste Sites
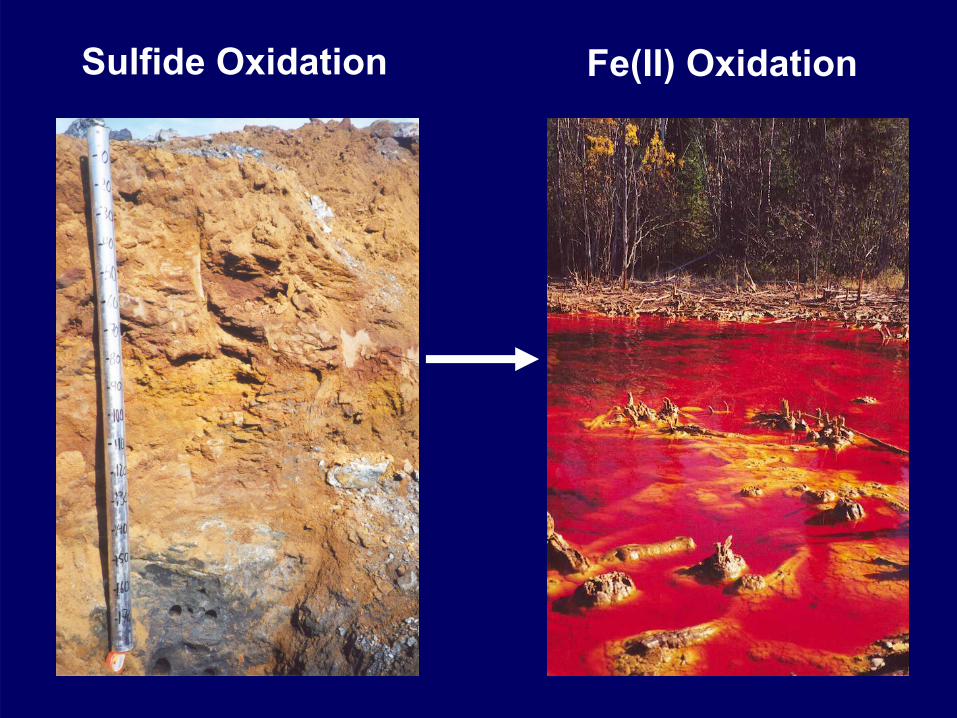
Sulfide Oxidation Fe(II) Oxidation

Permeable Reactive Barrier
Groundwater Flow
Bedrock
Fluvial/Glacial Deposits
Mine Tailings
Earthen/Rock TailingsDam (permeable)
AMD Plume

Reactive MaterialsReactive Materials
Reduction and PrecipitationReduction and Precipitation•• Zero Zero valentvalent ironiron•• Organic carbonOrganic carbon•• MixturesMixtures
AdsorptionAdsorption•• Basic Oxygen Furnace (BOF) oxides and Basic Oxygen Furnace (BOF) oxides and
slagsslags•• ZeolitesZeolites

Construction Challenges Construction Challenges
•• Depth of plumeDepth of plume•• Most techniques limited to <100 mMost techniques limited to <100 m
•• InfrastructureInfrastructure•• Buildings, service corridors, utilitiesBuildings, service corridors, utilities
•• Regulatory approvalsRegulatory approvals•• Land titlesLand titles•• CostCost

Implementation Challenges Implementation Challenges •• Inadequate site characterizationInadequate site characterization
•• Poorly defined plume characteristicsPoorly defined plume characteristics•• Size, depth, concentration rangesSize, depth, concentration ranges
•• Insufficient characterization of aquifer Insufficient characterization of aquifer propertiesproperties
•• Incomplete data interpretationIncomplete data interpretation•• Unrealistic expectationsUnrealistic expectations
•• Overly pessimistic Overly pessimistic –– high costshigh costs•• Overly optimistic Overly optimistic –– incomplete incomplete
treatmenttreatment

Performance Challenges Performance Challenges
Zero Zero valentvalent ironiron•• Residence time/high velocityResidence time/high velocity
•• Exceed reaction rate limitationsExceed reaction rate limitations•• pH increase pH increase •• Excessive carbonate precipitation Excessive carbonate precipitation YY CloggingClogging

Contaminants Suitable for Contaminants Suitable for Treatment using Zero Treatment using Zero ValentValent IronIron
•• ChromiumChromium•• SeleniumSelenium•• ArsenicArsenic•• UraniumUranium•• TechnetiumTechnetium•• MercuryMercury•• MolybdenumMolybdenum•• VanadiumVanadium•• Other elements with lower Other elements with lower solubilitiessolubilities in in
reduced formsreduced forms

Treatment of ChromateTreatment of Chromate--Contaminated Contaminated GroundwaterGroundwater
Reduction:Reduction:8H8H++ + CrO+ CrO44
22-- + Fe+ Fe00(s)(s) ⇒⇒ FeFe3+3+ + Cr+ Cr3+3+ + 4H+ 4H22OO
FeFe00 + 2H+ 2H22O O YY FeFe2+2+ + H+ H2(g) 2(g) + 2OH+ 2OH--
Precipitation: Precipitation: CrCr3+3+ + 3OH+ 3OH-- ⇒⇒ Cr(OH)Cr(OH)33 (s)(s)
CrCr3+ 3+ + Fe+ Fe3+3+ +3OH+3OH-- ⇒⇒ (Fe,Cr)(OH)(Fe,Cr)(OH)3(s)3(s)

Scale (km)Scale (km)
00
22
NixontonNixontonWeeksvilleWeeksville
ElizabethElizabethCityCity
REACTIVEREACTIVEBARRIERBARRIERSTUDY SITESTUDY SITE
Elizabeth City Reactive BarrierElizabeth City Reactive Barrier
Installed: 1996
Collaborators
US EPA
US Coast Guard

0 10
meters
N
Cr (mg/L)June 1994
Building 78
Pasquotank River
1.6
<0.01
<0.01 <0.01
<0.01
<0.01
<0.01
<0.01
<0.01
5.6
8.2
0.22
3.8
0.08<0.01
0.050.05
2.52.5
0.050.05
2.52.5
Bui
ldin
g 78
HANGAR 79

Reactive MaterialReactive Material
•• 150 m150 m33 zero zero valentvalent iron (280 tons)iron (280 tons)•• 46 m long, 7.3 m deep and 0.6 m wide barrier46 m long, 7.3 m deep and 0.6 m wide barrier

Continuous Trenching MachineContinuous Trenching Machine

USCG Wall InstallationUSCG Wall Installation

pHpH
--66
--44
--22
Depth (m)
Groundwater flow directionGroundwater flow direction 00 50 cm50 cm
55667788991010
WallWall
Dep
th (m
)D
epth
(m)

Eh (mV S.H.E.)Eh (mV S.H.E.)
--66
--44
--22
Depth (m)
Groundwater flow directionGroundwater flow direction 00 50 cm50 cm
--600600--400400--20020000200200400400
WallWall
Dep
th (m
)D
epth
(m)

Cr(VI) (mg/L)Cr(VI) (mg/L)
--66
--44
--22
Depth (m)
Groundwater flow directionGroundwater flow direction 00 50 cm50 cm
000.050.051.01.02.02.0
WallWall
Dep
th (m
)D
epth
(m)

Electrical Conductivity (Electrical Conductivity (μμSS/cm)/cm)
--66
--44
--22
Groundwater flow directionGroundwater flow direction 00 50 cm50 cm
200200400400600600800800
WallWall170.01
00
Dep
th (m
)D
epth
(m)

CaCOCaCO33 (mg/L)(mg/L)
--66
--44
--22
Depth (m)
Groundwater flow directionGroundwater flow direction 00 50 cm50 cm
00202040406060
WallWall
135.00
Dep
th (m
)D
epth
(m)
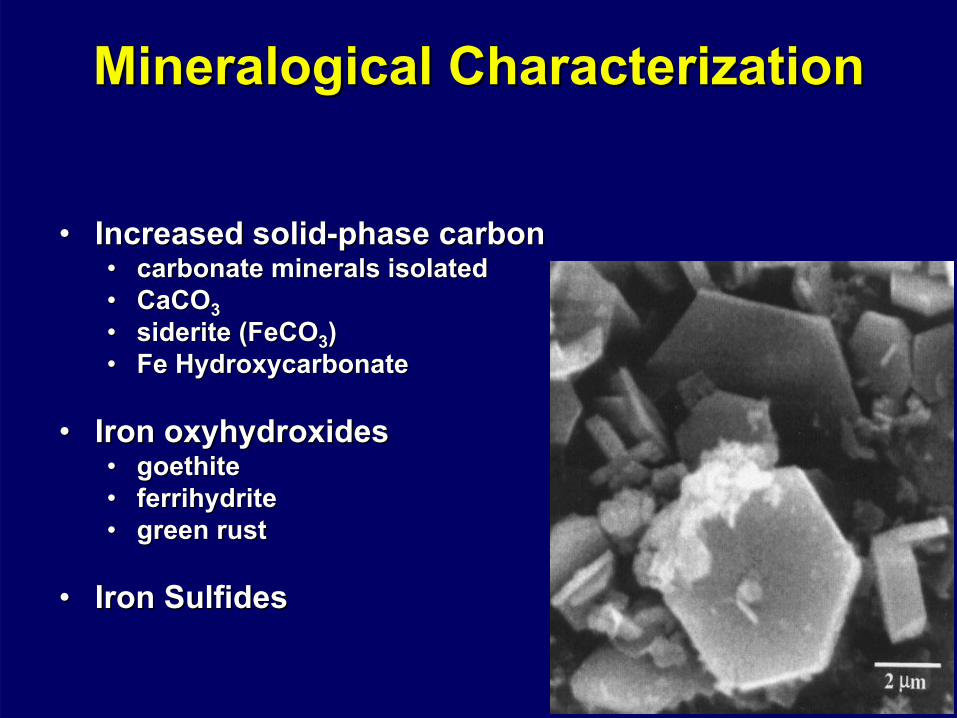
Mineralogical CharacterizationMineralogical Characterization
•• Increased solidIncreased solid--phase carbonphase carbon•• carbonate minerals isolated carbonate minerals isolated •• CaCOCaCO33•• siderite (FeCOsiderite (FeCO33))•• Fe Fe HydroxycarbonateHydroxycarbonate
•• Iron oxyhydroxides Iron oxyhydroxides •• goethitegoethite•• ferrihydriteferrihydrite•• green rust green rust
•• Iron SulfidesIron Sulfides

Modelling Barrier PerformanceModelling Barrier Performance
•• Reactive transport model: MIN3PReactive transport model: MIN3P
•• Groundwater transportGroundwater transport•• Use siteUse site--specific data specific data
•• Reaction kineticsReaction kinetics•• Lab determined rate constantLab determined rate constant•• Field observationsField observations

0 0.5 1 1.5 2 2.5 3 3.5 4distance [m]
4
4.5
5
5.5
6
6.5
7
dept
h[m
]11.010.29.48.67.87.06.2
pH
[-]
0 0.5 1 1.5 2 2.5 3 3.5 4distance [m]
4
4.5
5
5.5
6
6.5
7
dept
h[m
]
6.0E-032.4E-039.6E-043.8E-041.5E-046.1E-052.4E-05
Fe(OH)2
[-]
pH and Fe(OH)pH and Fe(OH)22
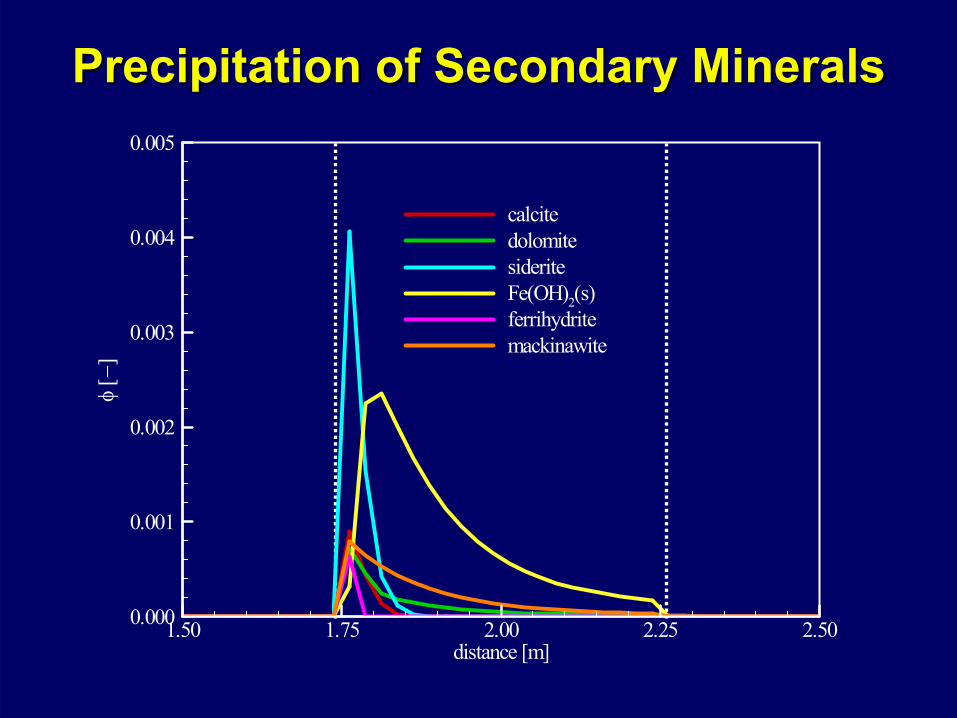
Precipitation of Secondary MineralsPrecipitation of Secondary Minerals
1.50 1.75 2.00 2.25 2.50distance [m]
0.000
0.001
0.002
0.003
0.004
0.005
φ[−]
calcitedolomitesideriteFe(OH)2(s)ferrihydritemackinawite

Inorganic Carbon and SulfurInorganic Carbon and Sulfur
Sediment treatment material mixing zoneSediment treatment material mixing zone
Data from Wilkins et al., 2002Data from Wilkins et al., 2002
distance [cm]
conc
entra
tion
[ppm
]
0 10 20 30 40 50 600
1000
2000
3000
4000
5000
6000
Inorganic carbon - simulatedSulfur - simulated
distance [cm]
conc
entra
tion
[ppm
]
0 10 20 30 40 50 600
1000
2000
3000
4000
5000
6000
Inorganic carbon - observedSulfur - observed

LongLong--Term EfficiencyTerm Efficiency
0.0 0.1 0.2 0.3 0.4 0.5distance [m]
0.0
0.1
0.2
0.3
0.4
0.5
0.6
0.7
0.8
0.9
1.0
ϕ Fe
[-]
0.0
0.1
0.2
0.3
0.4
0.5
0.6
0.7
0.8
0.9
1.0
φ[-
]
ϕFe - T = 5 yearsϕFe - T = 10 yearsϕFe - T = 20 yearsφ - T = 5 yearsφ - T = 10 yearsφ - T = 20 years
porosity
volume fraction of secondary minerals
volume fraction ofzero-valent iron

Porosity ChangesPorosity Changes
distance [cm]
poro
sity
loss
[%]
0 10 20 30 40 50 6001234567
porosity loss - calculatedbased on solid phasecharacterization(Wilkins et al., 2002)
porosity loss - simulated
distance [cm]
poro
sity
loss
[%]
0 10 20 30 40 50 6001234567

Monticello CanyonMonticello CanyonReactive BarrierReactive Barrier
Installed: 1998
Decline in permeability limits performance

Potential SolutionsPotential Solutions
Mix zero Mix zero valentvalent iron and organic carboniron and organic carbon+− ++→+ HCOaqCHOHOCH 2
321
421
221
2 )(
OHaqSHHCOSOOCH 2221
32
421
2 )( ++→+ −−
Reactions release H+ and CO2 and buffer pH
Avoid funnel & gate installations for high TDS water
PRB’s not suitable for some waters types

Challenges EncounteredChallenges Encountered
Organic carbonOrganic carbon•• Permeability variations in mediaPermeability variations in media
•• Insufficient preparationInsufficient preparation•• Decline in reactivityDecline in reactivity•• Temperature effectsTemperature effects

Nickel Rim Barrier InstallationNickel Rim Barrier Installation

SandSand
SandSand
CompostCompost
Nickel Rim WallNickel Rim WallInstalled 1995Installed 1995
Sampled Sampled annuallyannually

Nickel Rim Groundwater PlumeNickel Rim Groundwater Plume
•• Sulfate Sulfate 20002000-- 4000 mg/L4000 mg/L•• IronIron 500500--2000 mg/L2000 mg/L•• pHpH slightly acidic (pH 6)slightly acidic (pH 6)•• AlkalinityAlkalinity 00--50 mg/L CaCO50 mg/L CaCO33

BedrockBedrock
SandSand
Sand
Reactive MaterialReactive Material
Direction ofDirection ofGroundwater flowGroundwater flow
4 m4 m8 m8 m
3.6 m3.6 m
15 m
Permeable Reactive Barrier InstallationPermeable Reactive Barrier Installation
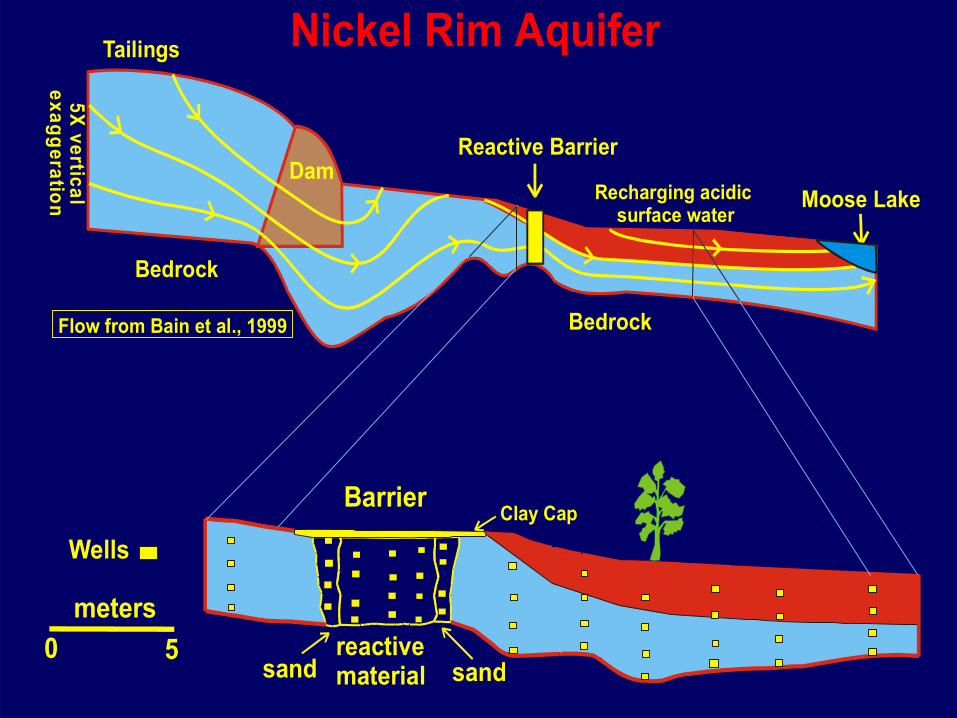
reactivematerial
Barrier
sand sand
Clay Cap
Wells
0 5meters
Recharging acidic surface water
Reactive Barrier Dam
Bedrock
Bedrock
Tailings
Moose Lake
5X verticalexaggeration
Flow from Bain et al., 1999
Nickel Rim Aquifer

Acid Generating Potential (meq/L)
Sulfate (mg/L)
Iron (mg/L)
groundwater flow direction
meters
0 5 mreactivematerial sandsand
>2010 - 200.0 - 10-10 - 0.0<-10
>2000 1500-2000 1000-1499 500-999 <500
>350250-350150-24950-149<50
Treatment ResultsTreatment Results

Fe Concentrations (mmol/L)
November1995
groundwater flow direction 0 5meters
September1996
October1998
October1997
No Data
surface recharge
surface recharge
surface recharge
surface recharge
14-21>21
7-141-7<1

Sulfa
te (m
mol
/L)
0
5
10
15
20
25
Date6/95 12/95 6/96 12/96 6/97 12/97 6/98 12/98 6/99
Alk
alin
ity (m
mol
/L)
0
10
20
30
40
Fe (m
mol
/L)
0
2
4
6
8
10
12
SO4removed
Feremoved
Alkalinity (CaCO3) generated
November
June
September
June
October
May
October
November
June
September
JuneOctober
May
October
November
June
September
June
October
May
October

ResultsResultsCores A and 6
S concentration (μmol g-1)
0 100 200 300 400 500
Dep
th (c
m)
0
50
100
150
200
250
300
Acid Volatile Sulphides 2002Total Reduced Sulphides 2002Acid Volatile Sulphides 1997Total Reduced Sulphides 1997
Cores B and 7S concentration (μmol g-1)
0 100 200 300 400 500
Dep
th (c
m)
0
50
100
150
200
250
300
Cores C and 8S concentration (μmol g-1)
0 100 200 300 400 500
Dep
th (c
m)
0
50
100
150
200
250
300

Sulfide AccumulationSulfide Accumulation
0
10
20
30
40
50
60
70
80
90
0 10 20 30 40 50 60 70 80 90
Time (months)
Rat
e (
μm
ol S
cm
-3a
-1)
Up-gradient core (NRW29)
Mid-gradient core (NRW30)
Down-gradient core (NRW31)

Sulfate Removal RatesSulfate Removal Rates
observed sulfate removal rate
observed sulfate removal rate(m odified from Benner et al., 2002)
0 1 2 3 4 5 6 7 80
30
60
90
120
150
180
simulated sulfate removal rate
Time (years)
Rat
e (m
mol
L-1
a-1 )
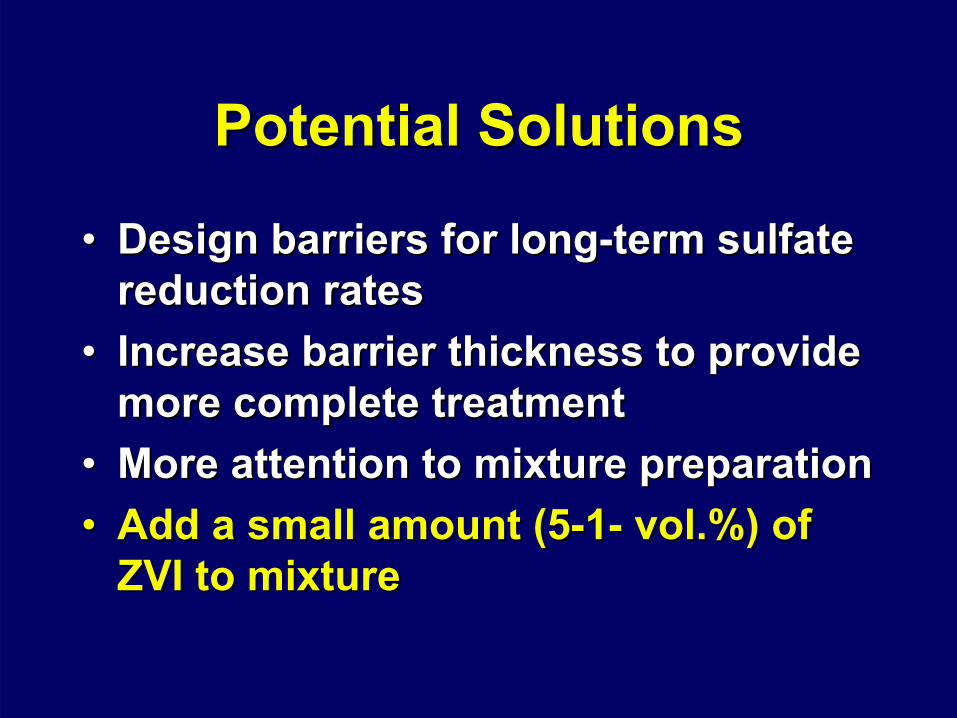
Potential SolutionsPotential Solutions
•• Design barriers for longDesign barriers for long--term sulfate term sulfate reduction ratesreduction rates
•• Increase barrier thickness to provide Increase barrier thickness to provide more complete treatmentmore complete treatment
•• More attention to mixture preparationMore attention to mixture preparation•• Add a small amount (5Add a small amount (5--11-- vol.%) of vol.%) of
ZVI to mixtureZVI to mixture

Dissolved Hydrogen GasDissolved Hydrogen Gas
•• HH2(g)2(g) is produced by iron corrosionis produced by iron corrosionFeFe00 + 2H+ 2H22O O ⇒⇒ FeFe2+2+ + + HH2(g)2(g) + 2OH+ 2OH--
•• HH2(g)2(g) is an electron donor is an electron donor 2CH2CH22O + SOO + SO44
22-- ⇒⇒ 2HCO2HCO33-- + 2H+ 2H++ + S+ S22--
4H4H2(g)2(g) + SO+ SO4422-- ⇒⇒ 4H4H22O + SO + S22--
•• Two mechanisms supporting sulfate reduction Two mechanisms supporting sulfate reduction

Test cell and pump shedTest cell and pump shed
FlowFlow
DischargeDischarge
InflowInflow
Balmer Balmer LakeLake
2 m
4.5
m

3015
45
mg/L
60
0
7 to 22
0
22
?
?
16
6
22
41
8
0
17
0
3
23
16
24
0
12
0
1
21
0
0
9
70
0
Br North Side(8 to 14 days after injection)
Inflow OutflowJune 2004
Experiment Experiment -- Inject and Monitor Inject and Monitor Movement of Bromide TracerMovement of Bromide Tracer
•• Br tracer movement shows flow variabilityBr tracer movement shows flow variability•• Improved understanding of As removal Improved understanding of As removal trendstrends
8080--140 m/a140 m/a
3030--50 m/a50 m/a
? m/a? m/aParticle path
with fluctuating water table

DissDiss. H. H2(g)2(g)
0.10.05
0.15
mg/L
0.2
H , North Side2
0.0
0.00
0.00
0.0 0
0.02
0.00
0.00
0.12
0.00
0.10
0.09
0.00
0.00
0.00
0.06
0.04
0.03
0.05
0.00
0.00
0.00
0.0 7
0.36
0.00
0.08
0.00
0.00
0.05
H , North Side2Inflow OutflowJune 2004
0.10.05
0.15
mg/L
0.2
H , South Side2
0.0
0.0
0.06
0.00
0.0 0
0.00
0.00
0.00
0.07
0.00
0.08
0.12
0.00
0.05
0.00
0.02
0.04
0.00
0.05
0.00
0.0 7
0.14
0.17
0.07
0.00
0.00
0.06
H , South Side2
0.00
Inflow Outflow
FeFe00 + 2H+ 2H22O O ⇒⇒ FeFe2+2+ + + HH2(g)2(g) + 2OH+ 2OH--

ArsenicArsenicJune 2004 June 2004
100001000
10
ppb
100
0
152 17 3807
23300
As (ppb) South Side
269
806 6
6 9
10087
16
129
2
162
854
12
77
3131
4
14
30
2
3
2
2
2
1
9 72
Inflow Outflow
23300
141 5
685 0
18100 585
6
3
2641
1
2
As (ppb) North Side
1705
2
1
3
2
852 199
10087
580
16
458
2978
3
2
2
2
2 4
Inflow Outflow
'B' Points June 2004
0
5
10
15
20
25
0 1 2 3 4
Distance into Mixture (m)
mg/
LAs SAs N

ConclusionsConclusions•• LongLong--term monitoring indicates term monitoring indicates
continued treatment for > 10 yearscontinued treatment for > 10 years•• Treatment limitations:Treatment limitations:
•• Capacity of reactive materialsCapacity of reactive materials•• Permeability lossesPermeability losses
•• Alternative mixtures can alleviate Alternative mixtures can alleviate some problemssome problems

AcknowledgementsAcknowledgementsColleagues and StudentsColleagues and Students
C. C. PtacekPtacek, J. , J. JamborJamborR. R. PulsPuls, D. Gould, U. Mayer, S. Benner, E. , D. Gould, U. Mayer, S. Benner, E. FrindFrind, S. Morrison, R. , S. Morrison, R. Ludwig, C. Palmer, A. Pratt, J. Ludwig, C. Palmer, A. Pratt, J. WilkensWilkensJ. Bain, M. J. Bain, M. MoncurMoncur, C. , C. HantonHanton--Fong, D. Smyth, L. Fong, D. Smyth, L. GrozaGrozaT. Bennett, R. McGregor, C. McRae, N. T. Bennett, R. McGregor, C. McRae, N. DoerrDoerr, R. Johnson, , R. Johnson, S. Sale, E. S. Sale, E. DaignaultDaignault, R. Williams, R. Williams
FundingFundingNSERC: Discovery grants, CRC program, CRD program, NCENSERC: Discovery grants, CRC program, CRD program, NCEOntario: OCE, PREA, MOE, URIFOntario: OCE, PREA, MOE, URIFCanada: NR Can (CANMET), Environ. CanadaCanada: NR Can (CANMET), Environ. CanadaUS EPA, US DOE, USGSUS EPA, US DOE, USGSFalconbridge Ltd., Placer Dome Inc., Falconbridge Ltd., Placer Dome Inc., DuPontDuPont Company (USA)Company (USA)