performance and energy efficiency testing of a lightweight fcev
TRANSCRIPT

EEVC European Electric Vehicle Congress 1
European Electric Vehicle Congress Brussels, Belgium, 3rd – 5th December 2014
Performance and energy efficiency testing of a lightweight FCEV Hybrid Vehicle
Dylan Ryan1, Jinlei Shang1*, Christophe Quillivic, Bernard Porter 1 Department of Automotive, Mechanical & Manufacturing Engineering, Coventry University, Gulson Road, Coventry,
UK, CV1 2JH
Abstract The Microcab H2EV is a 4 seat lightweight niche vehicle, which with a top speed of under 90 km/h and a
kerb weight of 750 kg’s, is primarily intended for urban use. It is a plugin series hybrid powered by an air-
cooled PEM type fuel cell.
As part of ongoing development of the Microcab H2EV a series of tests were conducted to determine the
power consumption and energy efficiency of the vehicle operating under urban traffic conditions. This
included extensive testing of the vehicle both under battery power and fuel cell power operating in active
traffic conditions and steady speed tests at a range of different speeds. The Microcab has also been
subjected to rolling road tests in accordance with the UDC cycle.
This paper will provide a review of the testing methods undertaken, the results of this study and how it has
feedback into future improvements of the vehicle as well as providing data to support vehicle modelling.
The observed energy performance, TTW, WTW and Wh/km of the vehicle under both fuel cell and pure
EV power, will be discussed for a variety of conditions, as well as the factors influencing this performance.
The differences in vehicle performance between those observed under real traffic conditions and the UDC
cycle testing will also be discussed in context of the suitability of the UDC cycle as a measure of urban
vehicle performance.
Keywords: FCEV, fuel economy, vehicle testing
1 Introduction Microcab is a spin-off company of Coventry University, with close links to both Coventry School of Art and Design (CSAD) and the Department of Mechanical, Automotive and Manufacturing engineering (MAM). The company has links to University of Birmingham and numerous other hydrogen research organisations throughout the UK.
The present vehicle, the H2EV [1], is a 4 seat lightweight niche vehicle, primarily intended for urban use. It has a kerb weight of 750 kg’s and a top speed of under 90 km/h. It is a plugin series hybrid FCEV, powered by a 3kW air-cooled Horizon open cathode H-3000 fuel cell [2]. This is fed by a 350 bar 74 litre hydrogen tank (holding 1.8 kg’s of hydrogen), the fuel cell is connected, via a DC/DC converter, to a 72V 4.3kWh LiFe PO4 battery. A set of two 12.5 kW front wheel drive DC motors (Lynch LEM-200/d127) which supply a combined peak power of 40 kW.

EEVC European Electric Vehicle Congress 2
Figure 1: Microcab H2EV [1]
The H2EV is currently participating in two major projects, LREV (Hydrogen for Long Range Electric Vehicle), a collaborative project with Cella Energy, MIRA and Productiv, which is investigating the storage of Hydrogen in the form of a solid compound [3]. And also SWARM (Demonstration of Small 4-Wheel fuel cell passenger vehicle Applications in Regional and Municipal transport) [4], whose aim is to deploy several small fleets of FCEV’s to customers for use in real world driving situations, in the UK, Belgium and Germany. This project also includes a commitment to monitor vehicle performance throughout the project and implement any required changes to the drive train as required.
Figure 2: Schematic of the H2EV Power train
The range of the H2EV had been previously estimated (based on prior vehicle models) to be 30 km’s under battery power and up to 270 km’s under combined FC and Battery power. Given that the SWARM project involves the vehicles being utilised in a normal everyday scenario in the West Midlands area, it was deemed crucial to the success of this project to determine the performance of the Microcab in just such scenarios.
In particular it was important to get an accurate value of the vehicle range, operating under realistic driving conditions, both under EV range (in a scenario where the user sought to operate the car effectively as a BEV using the FC only
for the occasionally longer journey) as well as the FCEV range. Such data would give confidence to the users, getting around the issue of “range anxiety” that tends to restrict EV use.
2 Literature Review The disparity between naturalistic drive cycles and those corresponding to testing such as the NEDC or UDDS has long been noted. Such tests often do not correlate with real world driving conditions, such as weather, traffic and driver behaviour. The latter is particularly important, as some studies have noted that drivers in the present era are prone to more aggressive acceleration [5] than has traditionally been the case, particularly in heavy traffic.
In [6] the impact of such naturalistic driving cycles on a PHEV (Petrol Hybrid Electric Vehicle) are discussed. While this study was based on a Matlab/Simulink program, it drew on data from the 2001 NHTS report (national housing travel survey) and data logged during a series of road tests by the University of Michigan Transportation Research Institute (UMTRI). These models indicated that naturalistic drive cycles have a higher fuel consumption rate than all standard American drive cycles, other than the US06 (which is itself an aggressive version of the FTP-75).
It is concluded that designing vehicles to the US06 cycle would satisfy the requirements of 91% of drivers in terms of power demand [6]. They also noted that battery efficiency increased with battery size up to approximately 6 kWh’s (for a medium sized Hybrid vehicle). The AER (all electric range) increases linearly with battery size.
However a vehicle’s fuel economy is not sensitive to engine size. The crucial factor in sizing the engine for Charge Sustaining mode is the need for it to output sufficient power to match demand.
[7] conducted a validation of real world drive cycles. Again, the baseline was Naturalistic driving data in Southeast Michigan collected by the UMTRI through the Field Operational Tests (FOT). This study showed a good correlation between their model and realistic driving cycles. Even so the model failed to capture the higher levels of acceleration during realistic drive cycles.
In a further study [8] it was noted that vehicles are not normally driven at low speed in city conditions. Instead a series of stop-go traffic is more common. Longer commutes also increase the

EEVC European Electric Vehicle Congress 3
mean velocity, but also results in a decrease in periods of acceleration.
Analytical simulations of a wide range of parallel and series hybrid power trains were conducted by [9]. They note that the fuel economy benefits of a hybrid vehicle and its regenerative braking ability diminish in the case of an ICEV which already features a high level of fuel economy.
A study of the degradation on PEM fuel cells, operating under a vehicle drive cycle was conducted by [10]. They noted that sudden and repeated cycles of acceleration and deceleration can also impact on the fuel cell by producing overvoltage or undervoltage conditions, which can starve the fuel cell of hydrogen or oxygen, leading to corrosion and degradation of the catalyst. It should be noted that the Microcab’s series powertrain limits these issues, as the fuel cell operates at a fixed voltage and power output.
Using a lumped parameter mathematical model, [11] investigated the optimum size of the various vehicle components of a small, lightweight, 2 seater, fuel cell hybrid vehicle. In particular the optimum fuel cell size was considered. It was concluded that for a 676 kg urban vehicle a fuel cell size of 3.4 kW’s would be ideal.
3 Vehicle Energy Consumption The energy consumption of any vehicle is directly related to the engine power needed to overcome resistant forces [12]:
( ) ( )agwrtrtfv FFFFFFdtdvM +++−+= (1)
Where Fr is the rolling resistance of the tyres, Fw the aerodynamic drag, Fg grade climbing resistance, Fa acceleration resistance and Mv is the mass of the vehicle.
The drivetrain efficiency η t would be [12]: 𝜂𝑡 = 𝑇𝑤
𝑖𝑜𝑇𝑝 (2)
Where Tw is the torque to the drive wheels, Tp the torque from the traction engine and io is the gear ratio of the drive (the H2EV uses a belt drive directly to the front wheels). For a plugin hybrid vehicle, we need to consider the fact that the energy flows will be coming from multiple sources (figure 3), i.e. the fuel cell will be providing power to the drive system or battery, potentially at the same time the car is gaining power from regenerative braking.
Figure 3: Power flow within the H2EV drive train,
adapted from [13]
Reconsidering equation (2) in terms of power output:
𝜂𝑡 = 𝜂𝑒𝑒𝑒𝑒 .𝜂𝑡𝑡𝑡𝑡𝑡 = 𝑃𝑤ℎ𝑒𝑒𝑒𝑒[𝑃𝑒𝑒]
(3)
Where Pel is the electric power to the motor η trans is the efficiency of the transmission and ηelec the electrical efficiency of the motor and motor controllers. Pel equals:
𝑃𝑒𝑒 = 𝑃𝑏𝑡𝑡𝑡 + 𝑃𝑡𝑎𝑎 − 𝑃𝐹𝐹 − 𝑃𝑡𝑒𝑟 (4)
Where, Paux the parasitic load of the vehicle’s systems, PFc the Fuel cell power, while Preg represents regeneration. If the RHS of equation (4) is positive, then the resultant power gained will flow to the battery. As Preg is dependent on the ηelec and η trans both factors have an influence on the effectiveness of regenerative braking.
Hydrogen consumption was recorded during these tests using two methods. Firstly recording the changes in tank pressure. Secondly by monitoring the flow rate into the fuel cell, typically a rate of 28NL/min at full power. In both cases the variation in hydrogen density [14] relative to pressure was accounted for.
4 Methodology of Testing The H2EV was originally designed to operate using a different fuel cell system (HT-PEM). Technical problems with this fuel cell resulted in it being withdrawn (prior to the start of SWARM) and replaced with the Horizon stacks. Several of the vehicles are awaiting the installation of the new PEM fuel cells. However they are still capable of operating as a Battery Electric Vehicle, although the lack of a fuel cell does severely limit the range.
The weight of the fuel cell and its associated systems is known to be approximately 60 kg’s (excluding the weight of the tank and other apparatus which is integrated into the vehicle chassis), hence by ensuring an equivalent amount of weight in the vehicle (e.g. a second person) the performance of the H2EV in EV mode can be

EEVC European Electric Vehicle Congress 4
compared to actual tests with a functioning fuel cell.
Several different testing regimes were applied. Firstly the testing of the vehicle on a rolling road in accordance with the UDC cycle. These tests were conducted on a rolling road, both at MIRA and in Warwickshire College.
Figure 4: H2EV undergoing static test in Microcab, note the Horizon Stack and its location (centre), as
well as the charging socket (upper left)
The H2EV is intended for extra-Urban use, given the nature of the road infrastructure in the West Midlands region which would be expected to include the occasion stretches of dual carriageway travel at speeds of +50 mph.
The second set of tests therefore included on road monitoring of the vehicles as they were utilised to perform normal everyday tasks, e.g. collecting parts from suppliers, travel to Birmingham University, city centre commuting, driving to events, etc.
Monitoring consisted of using a KVASER Memorator Datalogger to extract CAN bus data (capturing for example battery voltage & current, state of charge, fuel cell power output, etc.) as well as a RACElogic GPS logging system.
These driving tests were useful in extracting the performance of the H2EV under real world conditions. However the performance tended to be influenced by outside factors, e.g. weather, traffic, cargo, etc. As a consequence relating such trip data to another trip was problematic.
So for this reason two additional sets of tests were conducted. The first consisted of steady speed tests, conducted either on a closed track or on the road (preferably straight and flat) in quiet traffic conditions. The vehicle was then accelerated to a series of set speeds ranging from 10-50 mph (i.e. 16 – 80 km/h). Such tests would include an acceleration phase, a straight run period, followed by a deceleration phase (usually
with regenerative braking, where traffic, if any, allowed). In all cases a second run in the opposite direction would be applied to account for any slope in the road, with the average of the two taken after multiple runs.
This data was useful in revealing what sort of power demand could be expected both to accelerate to a particular speed as well as hold the car at that speed. This is particularly important in the context of the on board fuel cell. To maintain dual carriageway speed, the power output from the fuel cell must match the demand from the EV powertrain.
Figure 5: The Coventry Drive Cycle, 3.58 km’s
Finally all of these testing concepts were combined by driving the H2EV’s on a fixed set of laps around a road testing circuit, under normal traffic conditions, otherwise known as “the Coventry Drive Cycle” (hence forth referred to as the CDC) shown in figure 5.
Figure 6: CDC, elevation profile, route was reasonably
flat but intentionally included some undulations
This 3.58 km circuit was specifically planned to incorporate a set of realistic conditions a car would encounter within a typical West Midlands driving

EEVC European Electric Vehicle Congress 5
circuit. This included stop-go traffic (e.g. several traffic lights), roundabouts, hill climbs and hill descend (with regenerative breaking) and a section of dual carriageway. In total over 60 laps of this urban circuit were completed.
In all cases multiple vehicles were used to perform the same test. Where possible two were taken out simultaneously (so they would be exposed to similar driving conditions). While the same set of drivers were used for the bulk of tests (to discount any inaccuracies due to driver behaviour), at other times different drivers were purposely used to allow the effects of driver behaviour to be correlated with vehicle performance.
5 Results
5.1 Rolling road test results Drive cycle tests were conducted on a rolling road in MIRA. This consisted of 8 UDC/ECE-15 cycles each representing a distance of 0.994 km’s for a total of 7.952 km’s. These tests revealed an average urban power consumption of 102 Wh/km.
The powertrain efficiency of the Microcab H2EV was also estimated at 42.2% at an average speed of 18 km/h, although this varies depending on power output (see figure 7). This calculation accounts for the losses in rolling resistance, drive train and motor controllers, calculated via equation (3).
Figure 7: Microcab Powertrain Efficiency vs. Power
Output at Wheels
Subsequent testing by MIRA (table 1) consisted of 32 sets of UDC cycles undertaken in 4 stages (i.e. 4 sets of 7.952 km tests for a total distance of 31.8 km’s). During these tests, the H2EV was operating under fuel cell power.
These tests revealed an average energy consumption rate of 128.3 Wh/km in terms of EV performance and 275 Wh/km once the balance of plant of the fuel cell is considered. Results indicated a fuel cell efficiency of 49.1% (accounting for parasitic loads of the fuel cell and its associated systems).
Table 1: Rolling Road results UDC Cycles x32, total test distance: 32 km’s
Wh/km (EV)
gH2/km
Wh/km (FC)
FC efficiency
Mean 128.3 6.8 274.9 49.1%
STD 4.96 0.01 35.20 0.04
5.2 CDC results Over the course of the CDC tests, the average speed observed was in the order of 31.5 km/h. This neglects periods when the vehicle was stopped, 28 km/h if stops are accounted for. This is despite the fact that the circuit included a dual carriageway section, during which speeds could peak at 70 km/h. A typical drive cycle is shown in figure 8.
Figure 8: Typical CDC results set for the H2EV, vehicle velocity and battery power output v’s time, 3.58 km lap For the case of a single driver with BEV operation (i.e. no fuel cell on board) the H2EV has an average power consumption of 126 Wh/km (equivalent to 1.42 L/100 kme or 198 mpge). Table 2: CDC Results Wh/km, by vehicle, driver only,
EV mode (i.e. no FC on board)
Vehicle Mean Max Min STD V2 123.31 136.9 115.4 8.42 V4 133.09 142.9 124.2 6.19 V5 126.26 144.1 112.9 8.58
While the average values do show some correlation, the deviation between individual laps is significant. Again real world factors in terms of traffic and driver behaviour will be behind this deviation. Vehicle No. 2 demonstrates the best
EEVC European Electric Vehicle Congress 6
performance with 123 Wh/km against 133 Wh/km for Vehicle No.4 (8% difference). Interestingly V4 is a van conversion (although identical specification) battery system. It should be noted however that the bulk of these tests were conducted with vehicles 2 and 5, both of which show an average power consumption level within 2% of each other.
5.2.1 Driver Behaviour The issue of driver behaviour is emphasised when comparing results from different drivers in table 3. There is an 18% difference between the mean value for the most energy efficient driver and the least.
Table 3: CDC Results Wh/km, by driver, EV mode
Driver Mean Max Min STD No.1 117.37 123.5 112.9 4.24 No.2 128.04 142.9 115.4 8.17 No.3 138.51 182.7 126.2 19.4 No.4 140.78 147.8 132.1 6.9
This demonstrates that driver behaviour, in particular how they can respond differently to conditions such as traffic, can have a significant effect on vehicle performance. As noted in the methodology section, on several occasions two vehicles (typically 2 and 5) would be taken out on the road simultaneously in order to expose them to similar traffic conditions. No significant differences between the two data sets were observed, other than those that could be related to driving behaviour.
5.2.2 CDC with FC installed weight With the FC hardware installed and/or a second passenger (e.g. approximately 60 kg’s of extra weight) the energy consumption of the H2EV increases to an average of 137.9 Wh/km (equivalent to 1.56 L/100 kme or 182 mpge). Variations based on driver behaviour and variations between the individual vehicles (even though they operate a near identical powertrain) were observed, with magnitudes similar to those discussed earlier.
Table 4: CDC Results, by vehicle, EV mode, FC install weight
Vehicle Mean Max Min STD V2 128.3 139.6 113.2 7.55 V3 153.2 167.6 133.1 11.05 V4 154.1 162.1 144.5 8.92 V5 140.4 150.6 127.9 6.99
5.2.3 Effects of Traffic Traffic, in particular stop go traffic, could have an adverse effect on vehicle energy consumption. However this is largely dependent on the behaviour of the driver, as seen in table 3. In particular one must consider the difference between the maximum and minimum energy consumptions for the same driver.
A driver who drove economically (i.e. anticipating a change in the lights, avoiding stopping if safe to do so, etc.) would see little or no significant difference, as the effect of traffic slowing the vehicle down and preventing high speed cancels out the extra power demand of stop and go traffic. However a driver who drove more aggressively could see as much as a 15% increase above what was seen on a subsequent lap in lighter traffic.
5.2.4 Effects of wet weather Similarly the vehicle’s energy consumption in wet conditions owed a lot to the driver. The number of laps in wet conditions (i.e. more than a little bit of drizzle) are limited, as it was intended to try and keep road conditions reasonably consistent. Thus it is difficult to conclude any difference, other than a slightly slower lap time. In essence the driver slows down, reducing energy consumption, effectively compensating for any weather related effects. But again, this is based on a very limited data set.
5.2.5 Regenerative braking Some experiments were conducted into altering the motor controller settings to adjust the vehicles regenerative braking capabilities.
Assuming normal driver behaviour (i.e. no anticipating on approach to traffic lights, etc.) increasing the regenerative braking to its maximum setting could decrease the vehicles energy consumption by up 15%. However, an already economic driver would only see at most a 7% improvement.
By contrast, disabling the regenerative braking system increased energy consumption by 10-12%. An economic driver would however only see a moderate decrease of 3-4%, although this assumes relatively light traffic and/or weather related effects.
5.3 Steady Speed test results Steady speed tests reveal an exponential relationship (figure 9) between increasing speed

EEVC European Electric Vehicle Congress 7
and energy consumption. At a steady speed of 30 km/h the powertrain requires 2.7 kW to maintain this speed. At 50 km/h this increases to 4.9 kW and at 65 km/h (e.g. 40 mph) the power demand is 7.6 kW.
Figure 9: H2EV steady speed results, vehicle target
velocity v’s average power consumption after acceleration
5.3.1 Acceleration energy The energy required to accelerate the vehicle from rest up to steady speed is another important consideration.
Peak power demand varied depending on circumstances (i.e. driver behaviour, which relates to local traffic conditions), 24 kW’s was the maximum recorded, although it should be noted that the conditions of the test indicates steady acceleration, where possible.
The Wh requirement tended to follow an exponential relationship (figure 10). Acceleration to 50 km/h for example, requires an average of 43 Wh, while acceleration to 86 km/h requires 177 Wh.
Figure 10: H2EV Energy Consumption to achieve
acceleration to a specific speed
5.4 Road Testing of Fuel Cell Under normal operating mode, the H2EV acts as a Series hybrid. If the on board Fuel cell (3 kW Horizon stack) is enabled it will monitor the battery voltage and if this drops below a certain
pre-set value, the fuel cell starts up. It will power up to full power initially, recharging the battery until such time as the battery voltage rises above a certain pre-set value (typically the maximum battery voltage of 87V), at which point the Fuel cell will power down to an idle mode of 300W, ramping up again if a sufficient power demand appears. Otherwise it automatically switches off after 30 minutes.
It should be noted that Horizon 3kW FC is air cooled and includes a purge cycle every 10 seconds of running time. The purge is nitrogen (from an onboard tank) during shut down and start up, but otherwise hydrogen throughout. The purge can result in some modest, loss of hydrogen, but this is acceptable given the improvements in Fuel Cell life.
Fuel cell tests included extensive lab based testing, the noted laps, rolling road tests and monitored urban driving. Over 685 km’s of driving were logged under fuel cell power. These tests involved dual carriageway driving, urban commuting, on the track test, CDC cycles, etc. A typical test drive is shown in figure 11.
Figure 11: FC drive Testing, track testing
These tests showed an average BEV energy consumption of 135.06 Wh/km. These readings should be put in the context that the car was typically being driven along an urban route, often with the battery at least partially topped up from its plugin port, before setting off.
Table 5: FCEV driving testing, urban duty cycle, various realistic driving conditions
Wh/km (EV)
gH2/km
Wh/km (FC)
FC efficiency
Mean 135.1 6.57 248.1 46.3% STD 25.6 2.1 57.4 0.036
EEVC European Electric Vehicle Congress 8
Hydrogen consumption by the fuel cell was estimated at a rate of 6.57 g/H2 per km. As noted earlier, this was calculated by two methods. Firstly by recordings of tank pressure, and secondly monitoring of the H2 flow rate.
This hydrogen consumption corresponds with a power consumption level of 248.07 Wh/km (accounting for balance of plant as well as regenerative braking and, as noted, a battery with some level of prior charging from the grid) or the equivalent of 2.8 L/100 km of petrol. Fuel cell efficiency during on the road performance was estimated at 46.3%.
A significantly higher level of deviation between these results and those for the CDC tests should be noted. Again, this is not surprising given that the vehicles were being driven in a variety of real world conditions.
5.4.1 Parasitic loads The H2EV draws approximately 1.1 – 1.4 Amps of current to power all the vehicles electronics. Turning on indicators, lights, radio, etc. increases static power consumption to at most 3 Amps, or a maximum of 400 Watts. Operating the fuel cell adds a further 300 Watts to this.
The cabin heater and demister however can draw up to 30 Amps of current (i.e. 2.4 kW’s). This, combined with the power consumption of the vehicle can rapidly deplete the battery and drastically alter the vehicle’s energy consumption.
The impact of the combination of heaters, slow traffic (recall the FC purge cycle means expending hydrogen) and prolonged running time can be particularly deleterious to vehicle fuel economy, particularly when operating the vehicle on Fuel Cell mode.
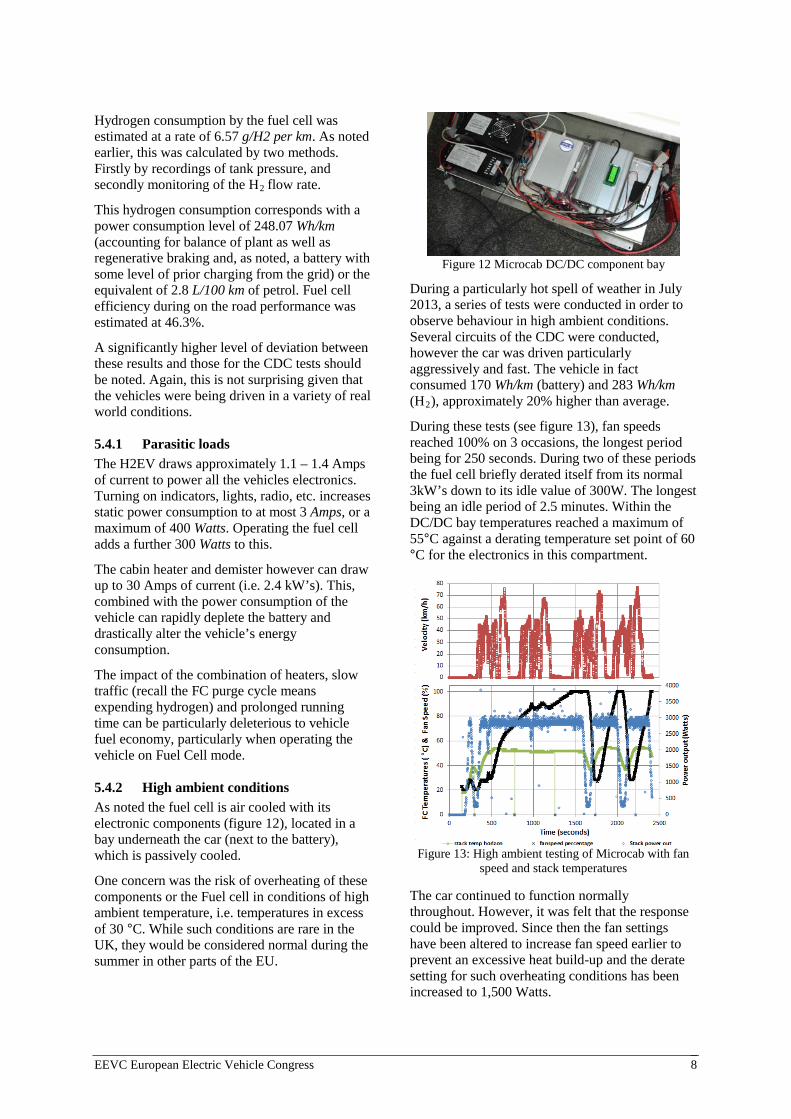
5.4.2 High ambient conditions As noted the fuel cell is air cooled with its electronic components (figure 12), located in a bay underneath the car (next to the battery), which is passively cooled.
One concern was the risk of overheating of these components or the Fuel cell in conditions of high ambient temperature, i.e. temperatures in excess of 30 °C. While such conditions are rare in the UK, they would be considered normal during the summer in other parts of the EU.
Figure 12 Microcab DC/DC component bay
During a particularly hot spell of weather in July 2013, a series of tests were conducted in order to observe behaviour in high ambient conditions. Several circuits of the CDC were conducted, however the car was driven particularly aggressively and fast. The vehicle in fact consumed 170 Wh/km (battery) and 283 Wh/km (H2), approximately 20% higher than average.
During these tests (see figure 13), fan speeds reached 100% on 3 occasions, the longest period being for 250 seconds. During two of these periods the fuel cell briefly derated itself from its normal 3kW’s down to its idle value of 300W. The longest being an idle period of 2.5 minutes. Within the DC/DC bay temperatures reached a maximum of 55°C against a derating temperature set point of 60 °C for the electronics in this compartment.
Figure 13: High ambient testing of Microcab with fan
speed and stack temperatures The car continued to function normally throughout. However, it was felt that the response could be improved. Since then the fan settings have been altered to increase fan speed earlier to prevent an excessive heat build-up and the derate setting for such overheating conditions has been increased to 1,500 Watts.

EEVC European Electric Vehicle Congress 9
In general it was felt that these measures should be sufficient for a Microcab operating in the UK or Central/Northern Europe. However one operating in Southern Europe would likely need supplementary cooling. Investigations into using heat pipes and other passive techniques are being considered.
6 WTW calculations It is important to remain aware of the bigger picture, i.e. what is the carbon footprint of a H2EV? How does this compare to other low carbon vehicles? Table 6: Fuel Economy estimations Microcab H2EV
Wh/km Battery Power
FC Power
g H2/km
UDC (EV mode) 102 UDC (FCEV) 128.3 274.9 6.82 CDC (EV mode) 126 CDC (FCEV wgt but EV mode)
137.9
Road testing, FCEV
135.1 245.0 6.57
Table 6 summarises the test results described in section 5. To calculate the carbon footprint, we shall take the H2EV value for EV mode from the CDC results, i.e. 137.9 Wh/km and for FCEV mode the results from road testing, i.e. 6.57 gH2/km.
6.1 WTW EV mode According to [16] the average efficiency of the EU grid is 86%. A charger efficiency of 90% (a value taken from [17]) and a UK grid carbon intensity of 507 gCO2/kWh [18] shall be assumed.
C𝑓 = 𝑃𝐵𝐵𝐵.𝐹𝑔𝑔𝑔𝑔𝜂𝑔𝑔𝑔𝑔η𝑐ℎ𝑎𝑔𝑔𝑒
(5)
Where Pbatt is the energy consumed in EV mode, Cgrid is our grid carbon intensity and ηgrid and ηcharge are our efficiencies for the grid and charger. Thus, we calculate a carbon footprint C f of 90.3 gCO2/km. However if we were to swap to a low carbon grid, e.g. the carbon intensity of the Norwegian grid is 3 gCO2/kWh [17], the carbon footprint in EV mode drops to 0.53 gCO2/km.
6.2 WTW FCEV mode Spath & Mann of the NREL have previously calculated the carbon intensity of hydrogen production as a result of steam reforming of gas at 11,888 gCO2/ kg H2 [19] and via electrolysis combined with wind power they have estimated it as 970 gCO2/ kg H2 [20]. Note these studies consider all the major WTT issues other than transportation, compression and storage.
C𝑓 = 𝐹𝐻2.𝐹𝐻2𝜂𝑐𝑜𝑐𝑝η𝑡𝑔𝑎𝑡𝑒
(6)
Given an efficiency figure of 88% [17] for compression and transport of hydrogen by truck. Compression to 700 bar yields an efficiency of 78%. Accounting for the difference in pressure in accordance with equation (7) from [21] we can estimate an efficiency of 87% for 350 bar storage.
∆E = 𝑅.𝑇𝑜𝜂𝑐𝑜𝑐𝑝
ln �𝑃2 𝑃1� � (7)
Where ∆E is the energy losses in compression, R is the Gas constant, T the absolute temperature, ηcomp the efficiency of compression and P1,2 are the pressures at inlet and exhaust.
Assuming the values discussed and applying the results to equation (6) yields a figure of 101.5 gCO2/km for a H2EV powered by Natural gas sourced H2. Alternatively if we assume wind powered electrolysis at the filling station H2 consumption falls to 7.4 gCO2/km (eliminating transport losses, although we will assume a loss rate of 2% regardless).
6.3 WTW Comparison The above figures for the H2EV will now be compared with a range of WTW values for other vehicles. These include a VW Blue motion Up! [22] at 95 gCO2/km, a Prius [22] 89 gCO2/km, and a “standard” ICE engine car from the EUCAR report [23] with emissions of 133 gCO2/km. All three of these petrol powered vehicles are then adjusted by 20% to account for the WTT factors, as supported by data from [17 & 23]
According to Nissan [24] the Leaf BEV has an energy consumption rate of 150 Wh/km. We can thus calculate the WTW GHG using the same data applied for equation (5) for the H2EV.
Hyundai’s ix35 (a Fuel Cell conversion of an SUV) has a fuel economy of 9.5 gH2/km as stated by its manufacturer [25]. This vehicle requires a 700 bar tank, so we will use the efficiency values from [17] for a 700 bar tank. Assuming similar GHG values to the H2EV for carbon intensity of

EEVC European Electric Vehicle Congress 10
hydrogen and transport efficiency we can thus calculate a carbon footprint for the ix35 depending on the source of our hydrogen.
Figure 14: WTW GHG emissions for various vehicles,
depending on electricity and H2 sources
7 Discussion The WTW values in figure 14 indicate the need to decarbonise the grid and hydrogen supply, as well as the vehicles themselves. That said, when operated from low carbon sources the H2EV’s lightweight design does produce a lower carbon footprint than many other on the road vehicles, notably the Hyundai ix35.
Part of the problem for car manufacturers in their approach to hydrogen vehicles has been to solve the bulky nature of many of the components of a FCEV by using a relatively large vehicle (such as an SUV or minivan), to package the relevant hardware. However the result is a much higher carbon footprint and lower energy efficiency, particularly when factors such as the operating pressure of the hydrogen tank are considered. While the ix35, requires a 144L tank at 700 bar the H2EV can get by with only a 74L at 350 bar tank.
Also, figure 14 only considers the usage phase of the vehicle’s life time carbon emissions. Inevitably building and then disposing of a vehicle which is nearly 3 times the weight of a H2EV will have a much larger environmental impact.
As shown in table 6, energy consumption estimations from the UDC cycle testing clearly underestimated the EV mode on the road performance of the H2EV, but also overestimated the FCEV performance by up 11%. Furthermore this merely covers the mean
value, the maximum and minimum values show even greater level of deviation.
Overestimation by the UDC cycles, probably relates to the fact the H2EV is a plugin hybrid, hence the charging of the battery prior to any journey results in a lower rate of energy consumption. Extended periods in stop/go traffic however, can result in higher hydrogen consumption due to the purge cycle on certain journey’s however.
The CDC and other on the road tests also revealed that driver behaviour has a significant influence on the energy consumption patterns of a vehicle. Even though the bulk of the laps involved driving in a consistent (but not necessarily eco-drive) manner, differences between drivers could be observed. Although, as noted, the overall average from these laps did match the UDC cycle results more closely.
Unfortunately, most drivers don’t drive in a consistent, manner. Even with two H2EV’s driven in identical traffic conditions, variations in energy consumption were observed. To what degree factors such as weather, regenerative braking settings and traffic affected energy use effect driver behaviour and therefore fuel economy warrants further research. As several sources [5-8] discuss, the length and nature of any journey has a major influence on vehicle fuel economy.
One of the reasons for these tests, both the steady speed and CDC tests, was to determine whether the components of the H2EV were adequately sized for the task they would be required to perform.
In theory a 3kW fuel cell should be adequate, given that at the average speed of 30 km/h even if we neglect stopping time, the fuel cell should be able to keep pace with energy consumption from the battery. However, prolonged periods of faster driving (e.g. dual carriageways) as well as vehicle acceleration in stop-go traffic will have an adverse effect on fuel economy, as well as depleting the battery far more quickly, particularly if the heaters are on and thus a high parasitic load is present. A fuel cell size of 4-5kW is probably more realistic. Microcab’s FC supplier, Horizon UK, is working on providing just such a system.
One of the unique features of the H2EV is that it is one of the few FCEV’s with the ability to act as a plugin hybrid. Certainly this plugin feature is useful, both in terms of improving vehicle fuel economy (as noted), but also to deal with the lack of hydrogen infrastructure in some locations. This
EEVC European Electric Vehicle Congress 11
raises the question as to whether the vehicle should be fitted with a larger battery, perhaps at the expense of hydrogen capacity.
While such a position would appear to be justified by the aforementioned paper by [11], who utilised a 3.4 kW Fuel Cell in conjunction with a 10 kWh battery. However, it should be remembered that adding batteries would increase the weight of the vehicle, which of course would also mean opting for larger and more powerful motors. Given the higher energy density of the hydrogen tank, this would obviously have a negative influence on the vehicle’s fuel economy.
Also, while it takes only minutes to refill the hydrogen tank, the battery takes up to 4 hrs to recharge. Indeed given that the key role of the battery is merely to act as a reserve of energy while the FC warms up, as well as a buffer between engine demand and Fuel Cell power output, one could argue that the H2EV’s present battery is over specified.
With regard to regenerative braking, given the factors discussed in section 5.2.5, the instinct might be to set the regenerative braking at its maximum possible setting. However, it is important to balance the regenerative braking setting with other vehicle requirements. Too high a setting can result in amongst other things, higher rolling resistance, increased wear on drive train and power train, increased fuel cell degradation, poor handling, etc. Research into this area by Microcab and Coventry University is ongoing.
With due consideration, while the sizing of components within the H2EV was inevitably limited by market availability, they are sufficient to perform the present tasks required of them, although a larger fuel cell would certainly be advantageous.
Heat recovery systems (using an air-to-air heat exchanger or heat pipes) would also be useful in improving energy efficiency (for cabin heat/demisting purposes) and might be required to deal with the issue of overheating should the vehicle need to be operated in hotter southern climates.
8 Conclusions The energy efficiency of a lightweight Plugin FCEV was studied, both in terms of on the road performance and UDC testing on a rolling road.
These tests directly contributed towards the development of the existing H2EV as well as future vehicle developments by Microcab and its partners.
These tests did show some reasonable correlation between the two testing methods, however it also revealed that many real world factors, can have a significant effect on vehicle performance.
Well-to-Wheel performance, both for EV mode operation and hydrogen FC fuel economy were estimated. These calculations showed the need for decarbonising the source of fuel for future alternative vehicles, as well as the importance of factoring WTW considerations into the design of the vehicle itself.
Acknowledgments The authors would like to acknowledge the support of the staff of Microcab, notably John Jostins, Peter Jostins and John Castell as well as Coventry University PhD student Mike Apicella.
This research was conducted as part of the FP7 SWARM project and Innovate UK funded LREV project. The authors would like to thank the EU Commission, the Technology Strategy Board and our other project partners for their continuing support of this research.
References [1] Microcab, About the
H2EV, http://www.microcab.co.uk/the-new-h2ev/
[2] Horizon Inc., H-Series Stack Specifications, http://www.horizonfuelcell.com/#!h-series-stacks/c52t
[3] LREV Project website http://gtr.rcuk.ac.uk/project/54806AB2-5187-458E-8516-D95710C3A3FE
[4] SWARM Project, About the Swarm Project, http://swarm-project.eu/index.php?id=21
[5] Carlson R., Lohse-Busch H., Duoba M. Shidore N., Drive Cycle Fuel Consumption Variability of Plug-In Hybrid Electric Vehicles Due to Aggressive Driving, SAE Journals, 2009-01-1335.
[6] Patil R., Adornato B. & Filipi Z., Impact of Naturalistic Driving Patterns on PHEV Performance and System Design, SAE Journals, 2009-01-2715.
[7] Lee T. K., and Filipi Z., Synthesis and Validation of Representative Real-World Driving Cycles for Plug-In Hybrid Vehicles,
EEVC European Electric Vehicle Congress 12
Vehicle Power and Propulsion Conference (VPPC), 2010 IEEE, ISBN: 978-1-4244-8220-7.
[8] Lee T. K., and Filipi Z., Real-World Driving Pattern Recognition for Adaptive HEV Supervisory Control: Based on Representative Driving Cycles in Midwestern US, SAE International, 2012-01-1020.
[9] Banjac T., Trenc F. & Katrašnik T., Energy conversion efficiency of hybrid electric heavy-duty vehicles operating according to diverse drive cycles, Energy Conversion and Management 50 (2009), 2865–2878.
[10] Wang F., Yang D., Li B., Zhang H. et al, Investigation of the recoverable degradation of PEM fuel cell operated under drive cycle and different humidities, International Journal of Hydrogen Energy (2014), 1-7.
[11] Cipollonea R., Battista D. D., et al (2014), Model based design and optimization of a fuel cell electric vehicle, Energy Procedia 45, 71 – 80.
[12] Sakka A.M., Mierlo J.V., Gulaous H., Electric Vehicles - Modelling and Simulations, book edited by Soylu S. (2011), ISBN 978-953-307-477-1
[13] Ehsani M., Gao Y., Gay S. E. & Emadi A., Modern Electric, Hybrid Electric and Fuel Cell Vehicles: Fundamentals, Theory and Design, 2nd Edition, CRC Press (2012), ISBN 978-1-4200-5398-2.
[14] Rao Y. V.C., An Introduction to Thermodynamics, ISBN-13: 978-8173714610, University Press, 2004.
[15] AIP (American Insitute of Physics), The Industrial Physists Journal, Vol 10, Issue 1, pg 20.
[16] European Commission, Analysis and Guidelines for implementation of the CHP Directive, 2004.
[17] Campanari S., Manzolini G., Garcia DLI. (2009), Energy analysis of electric vehicles using batteries or fuel cells through well-to-wheel driving simulations, Journal of Power Sources , Vol. 186, 464-477
[18] IPCC (2003), Special Reports, Table 3.5. Carbon dioxide intensities of fuels and electricity for regions and countries, https://www.ipcc.ch/pdf/special-reports/sroc/Tables/t0305.pdf
[19] Spath M. L. & Mann M. K. (2001), Life Cycle Assessment of Hydrogen Production via Natural Gas Steam Reforming, NREL Publications.
[20] Spath M. L. & Mann M. K. (2004), Life Cycle Assessment of Renewable Hydrogen Production via Wind/Electrolysis, NREL Publications.
[21] Granovskii M., Dincer I., Rosen M. A., Life cycle assessment of hydrogen fuel cell and gasoline vehicles, Int. Journal of Hydrogen Energy: Fuel Cells, Vol. 31, Issue 3, March 2006, 337–352
[22] VCA (Vehicle Certification Agency), Car fuel data, CO2 and vehicle tax tools, http://carfueldata.direct.gov.uk/
[23] EUCAR, CONCAWE and JRC Report, Well-to-Wheels analysis of future automotive fuels and powertrains in the European context, Version 2c, March 2007.
[24] Nissian, New Leaf: Technical Specification, June 2013.
[25] Hyundai, iX35 Fuel Cell Vehicle data, http://worldwide.hyundai.com/WW/Showroom/Eco/ix35-Fuel-Cell/PIP/index.html
Authors
Dr Dylan Ryan is currently working as a lecturer in Sustainability in Oil and Gas with Coventry University. He obtained his PhD in Glasgow Caledonian University in 2007, and has working on several renewable & energy related FP7 projects. Dr Jinlei Shang is currently working in the EV System Research group of Coventry University. Specifically on automotive PEM fuel cell reliability and durability, plug-in hybrid strategy, powertrain efficiency, hydrogen storage method and light-weight vehicles. Christophe Quillivic obtained his MSc in Automotive Engineering in Coventry University in 2010. And is presently reading for PhD in Fuel Cell powered vehicles Bernard Porter is Director of Low Carbon Vehicle projects at Coventry University. An experienced mechanical engineer with a background in control systems development, he is currently engaged in a number of advanced powertrain integration projects.