performance and economic analysis of … · web viewdirect injection – side mounted magneti...
TRANSCRIPT
PERFORMANCE AND ECONOMIC ANALYSIS OF A DIRECT INJECTION SPARK IGNITION
ENGINE FUELED WITH WET ETHANOL
Thompson Diórdinis Metzka Lanzanova*, Macklini Dalla Nora, Hua Zhao
Brunel University London, Centre for Advanced Powertrain and Fuels Research (CAPF), Kingston Lane,
Uxbridge, Middlesex UB8 3PH, United Kingdom
* Corresponding author at: Brunel University London, Centre for Advanced Powertrain and Fuels Research
(CAPF), Kingston Lane, Uxbridge, Middlesex UB8 3PH, United Kingdom. Tel.: +44 7477640793; fax: +44
1895266698.
E-mail address: [email protected], [email protected] (T.D.M. Lanzanova)
HIGHLIGHTS
- Stable SI engine operation with 20% water-in-ethanol and λ=1.3;
- Greater water-in-ethanol content reduced NOx emissions;
- Operational cost reduction of up to 31% was achieved;
ABSTRACT
The use of wet ethanol with higher water content than the conventionally used in internal
combustion engines can reduce fuel production costs due to lower energy expense during the
distillation phase. However, during its combustion the extra water content may result in the
deterioration of fuel conversion efficiency and therefore a global energy evaluation should be
considered. This research investigated the operation of a single cylinder direct injected spark ignition
engine running with gasoline, anhydrous ethanol and several wet ethanol compositions (5% to 20%
of water-in-ethanol volumetric content) under stoichiometric and lean air/fuel ratios. Two part load
conditions of 3.1 bar and 6.1 bar indicated mean effective pressure were evaluated at 1500 RPM.
The impacts of increased water-in-ethanol content and lean operation on combustion and emissions
were discussed. Higher water content affected the heat release rate, which increased the
combustion duration and initial flame development phase. Lower nitrogen oxides emissions could be
achieved with higher water-content ethanol at the expense of higher unburned hydrocarbon
emission. An analysis of wet ethanol energy production costs and engine operation conditions was
carried out. The lean engine operation with 10% (v/v) water-in-ethanol fuel showed global energy
savings around 31% compared to anhydrous ethanol at stoichiometric conditions.
1
2
3
4
5
6
7
8
9
10
11
12
13
14
15
16
17
18
19
20
21
22
23
24
25
26
27
28
29
30
31
32
33
34
35
1. INTRODUCTION
In the last decades the growing concern on carbon dioxide emissions has increased the demand on
renewable biofuels in order to complement, or even substitute, fossil fuels for automotive
applications. More recently with the adoption of the Paris Protocol [1] several nations have agreed
to reduce global greenhouse gas emissions in order to hold the global average temperature below 2
°C above pre-industrial levels. In this scenario, bioethanol produced from fermented sugars from
various agricultural crops has been explored worldwide as an alternative to gasoline in spark ignition
(SI) internal combustion engines (ICE).
Ethanol production can be adapted according to the local crop availability, which does not only
reduce oil dependency and increases energy security but also stimulates the local agricultural,
industrial and commercial activities in emerging countries [2,3]. In a well-to-wheel analysis, when
land usage for ethanol crop production is in accordance with some policies, the greenhouse gas
(GHG) emission of ethanol is much lower than that of fossil fuels, as most of the GHG generated
during its combustion and industrialization is absorbed during the crop cultivation [4–6].
Nevertheless, ethanol usage is still linked to its production price, which is directly related to the
energy consumption during the whole biofuel production cycle.
The use of ethanol in SI engines has been explored both as an anti-knock additive to gasoline and a
dedicated fuel. The conventional water volumetric content is around 5% when used as dedicated
fuel. When mixed with gasoline, the water content is usually below 1% to avoid phase separation.
Compared to gasoline, ethanol presents higher knock resistance and higher latent heat of
vaporization (904 kJ/kg for ethanol against 350 kJ/kg for gasoline). The increased ethanol charge
cooling effect can lead to higher volumetric efficiency [7] and lower in-cylinder heat transfer [8].
Ethanol direct injection (DI) with concomitant gasoline port fuel injection has been also investigated
[9]. In order to take advantage of the greater cooling effect, ethanol DI must be controlled in order
to provide enough cooling effect without fuel impingement and cold start issues. Moreover,
ethanol’s lower heating value (LHV) is 37% lower than that of gasoline, which increases the
volumetric fuel consumption for the same energy substitution. It also presents corrosive effects in
some alloys [7].
The energy usage for ethanol production may vary from place to place due to the chosen crop [10–
12] and distinct industrial technologies. In most situations the net energy balance from ethanol
1
2
3
4
5
6
7
8
9
10
11
12
13
14
15
16
17
18
19
20
21
22
23
24
25
26
27
28
29
30
31
32
33
34
production cycle is positive. The main ethanol production steps from cereals are milling,
saccharification, fermentation, distillation and dehydration. If ethanol is produced from sugar syrups
(molasses), which is a by-product from sugar refining processes, only fermentation, distillation and
dehydration processes are needed. As ethanol and water are fully miscible and form an azeotrope
mixture, distillation cannot be used to achieve ethanol-in-water volumetric concentrations beyond
95.6%. As shown in some studies [13–15], the energy expense trend to achieve ethanol-in-water
volume fractions up to 80% increases in a linear trend. From 80% towards the azeotropic point, the
energy requirement trend for distillation becomes exponential. This fact highly reduces the net
energy balance of the bioethanol life cycle and consequently increases its final market price. To
achieve anhydrous ethanol, distinct dehydration processes are used. Although great energy
reduction has been achieved through the use of more sustainable dehydration techniques, such as
molecular sieves, the energy expense is still considerably high [16]. In most cases, the ratio of gained
energy of fuel LHV in MJ/L to the expended energy to dehydrate the same volume of ethanol (99%
of ethanol or more) is very low, which further reduces the bioethanol net energy balance.
Using distillation and dehydration energy requirement data presented elsewhere [13–15] and the
total energy expense to produce one litre of ethanol from distinct crops worldwide [11,12,17–19], it
is possible to estimate the ratio of gained energy per unit of volume of fuel LHV to the expended
energy Eind to produce the same volume for distinct water in ethanol volume fractions. This
calculation shows that LHV/Eind reaches its maximum value for mixtures containing between 80 and
90% of ethanol-in-water. These ethanol-water mixtures would provide the best net energy balance
compromise and the best monetary profit once the fuel conversion efficiency could be kept similar.
Nevertheless, a deeper analysis of using such fuels in current spark ignition engines has not been
fully proposed.
Previous studies using wet ethanol were carried out in different engines. The use of a catalytic
igniter has been explored to efficiently burn wet ethanol with up to 30% of water content [20,21].
Lower NOx emission and higher brake conversion efficiency were obtained compared to gasoline
operation. Homogeneous Charge Compression Ignition (HCCI) through intake air heating in high
compression ratio engines has also been extensively explored in an effort to reduce gaseous
emissions and achieve higher engine efficiencies while using wet ethanol (up to 40% of water
content) [22–24]. Negative valve overlap (NVO) has been explored to reach HCCI operation through
hot residuals trapping – achieved through early exhaust valve closure and late intake valve opening –
with up to 20% water wet ethanol for boosted operation. The water content showed a negative
1
2
3
4
5
6
7
8
9
10
11
12
13
14
15
16
17
18
19
20
21
22
23
24
25
26
27
28
29
30
31
32
33
34

effect on reducing the pressure rise rates and the maximum operational lambda [25,26]. Studies
conducted on a pre-chamber SI combustion engine concept have shown that it was possible to
maintain the hydrous ethanol (5% of water) engine operation efficiency at part load operation with
up to 30% of water in ethanol [27,28]. The simultaneous use of port fuel injection of hydrous ethanol
and direct injection of diesel has also been investigated in heavy duty engines using reactivity-
controlled compression ignition (RCCI) [29,30]. It has been shown that diesel like efficiencies can be
achieved with RCCI combustion for a wide range of loads. Diesel could be replaced by wet ethanol
(30% of water-in-ethanol in mass), whilst reducing NOx and soot emissions.
The expected effects of water addition in spark ignition engines at full load are lower flame growth
speed [31] and reduced heat release rate and peak in-cylinder pressure. The water dilution effect
reduces the peak temperatures and hence NOx emissions [32], although combustion efficiency is
penalized by higher aldehyde and total hydrocarbon (THC) emissions [33]. One of the main concerns
about wet ethanol operation in SI engines is the excessive wall wetting in port fuel injection engines
or fuel impingement in DI engines. Both events reduce the combustion efficiency and further
increase THC and aldehyde emissions.
Although some researches in SI wet ethanol operation have been carried out [27,28,31–33], none of
them presented an in-depth analysis of the part load operation. The lean SI operation with wet
ethanol has been not yet investigated. Therefore, this paper compares the combustion and emission
characteristics of a DI SI single cylinder engine operating with anhydrous ethanol (E100), hydrous
ethanol (E95W05), and two ethanol-in-water mixtures containing 10% and 20% of water in volume
(E90W10 and E80W20, respectively). Two operation loads of 3.1 bar and 6.1 bar indicated mean
effective pressure (IMEP) at 1500 rpm, with distinct air dilution strategies (lean operation), were
investigated. Herein, all ethanol-in-water mixtures will be called wet ethanol. Commercial RON 95
unleaded gasoline (GRON95) was also employed in the study. Finally, a brief energy cost analysis of
the wet ethanol production and engine operation efficiency was carried out so the economic impact
of wet ethanol could be accessed. As a result, the use of wet ethanol in a modern direct injection
spark ignition engine at part load under stoichiometric and lean operation was investigated. A
complete engine performance, combustion and emission analysis was carried out. The possible
economic benefits and challenges of using wet ethanol were also discussed.
1
2
3
4
5
6
7
8
9
10
11
12
13
14
15
16
17
18
19
20
21
22
23
24
25
26
27
28
29
30
31
32
33
34

2. EXPERIMENTAL SETUP
The engine used in this work is a Ricardo Hydra single cylinder direct injection engine. It has an
electro-hydraulic fully variable valve train (FVVT) system providing independent control over the four
valves. It also enables the operation in both two/four-stroke modes [34], though in this work only
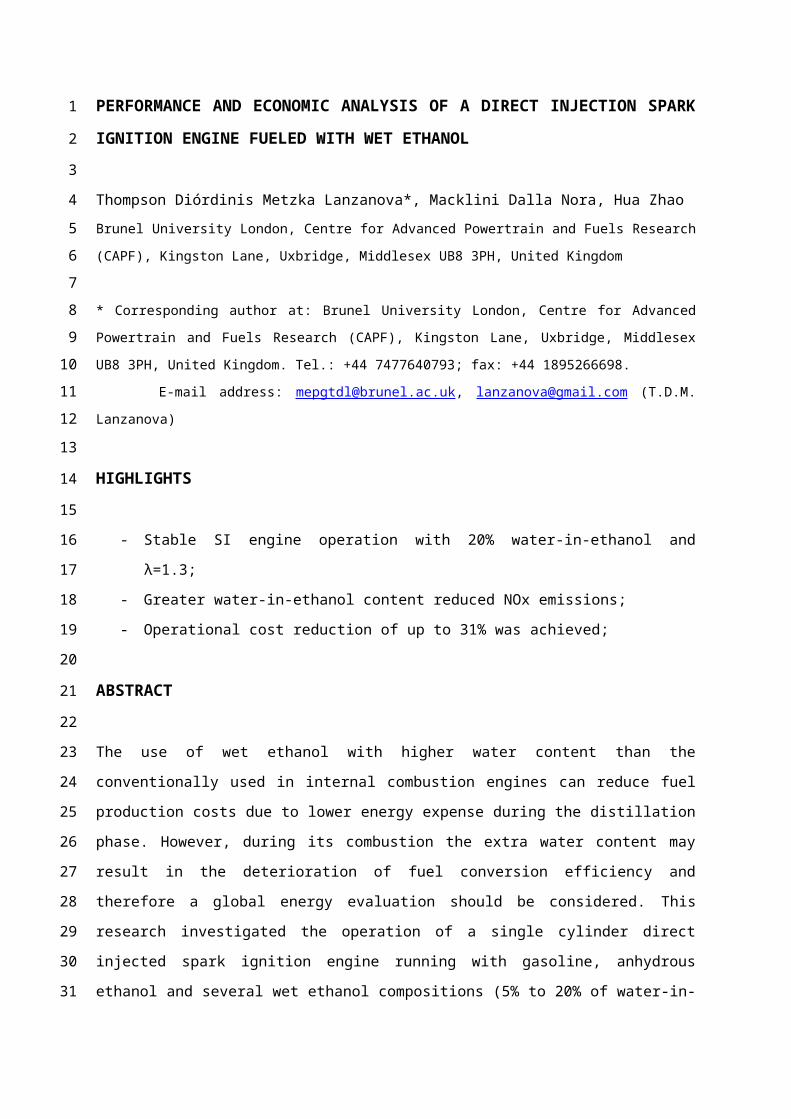
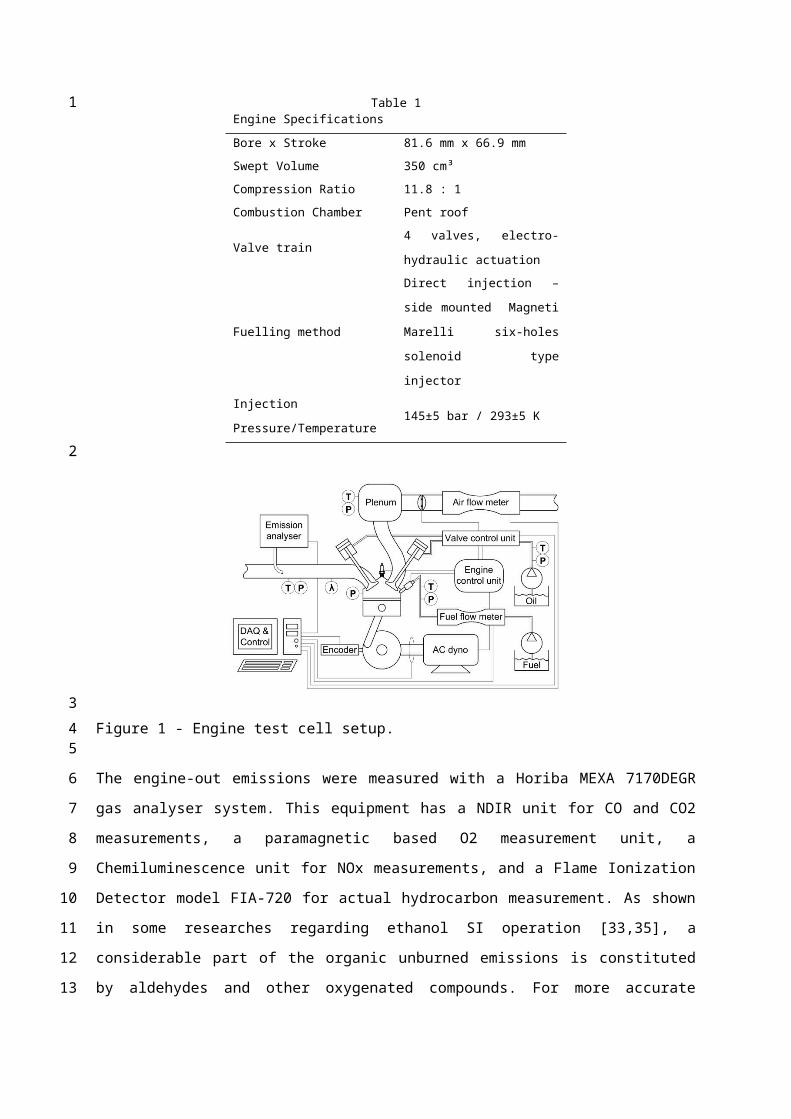
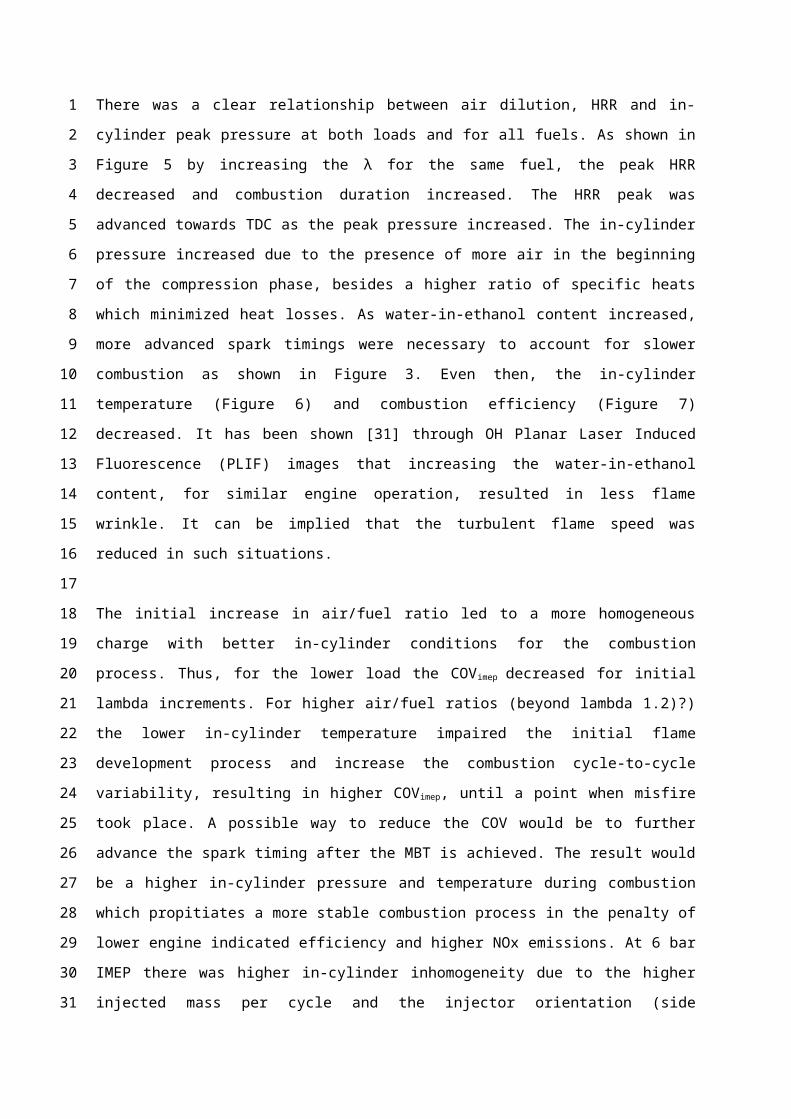
the four-stroke cycle was explored. Table 1 provides the main engine specifications and Figure 1
presents the test cell setup, where symbols containing T and P represent temperature and pressure
transducers, respectively, and λ represents the wide band universal exhaust gas oxygen (UEGO)
sensor. Spark timing and fuel injection timing/quantity were assessed via an engine control unit. A
valve control unit managed the intake and exhaust valve opening and closure timings and the
maximum lifts. The engine load was manually controlled by an intake throttle and the speed was
kept constant at 1500 rpm by means of an active AC dynamometer
The fuel and air mass flow rates were measured through a Coriolis fuel flow meter and a laminar
flow meter, respectively. Two piezo-resistive pressure transducers were used to monitor the intake
and exhaust port instantaneous pressures, whilst a piezo-electric transducer coupled to a charge
amplifier recorded the in-cylinder pressure. K-type thermocouples were installed for measurements
of average temperatures in the intake and exhaust ports, oil and coolant galleries, etc. Engine
coolant and oil temperatures were kept constant at 363 K.
Table 1Engine Specifications
Bore x Stroke 81.6 mm x 66.9 mm
Swept Volume 350 cm³
Compression Ratio 11.8 : 1
Combustion Chamber Pent roof
Valve train4 valves, electro-hydraulic
actuation
Fuelling method
Direct injection – side mounted
Magneti Marelli six-holes
solenoid type injector
Injection Pressure/Temperature 145±5 bar / 293±5 K
1
2
3
4
5
6
7
8
9
10
11
12
13
14
15
16
17
18
19
20
21
22
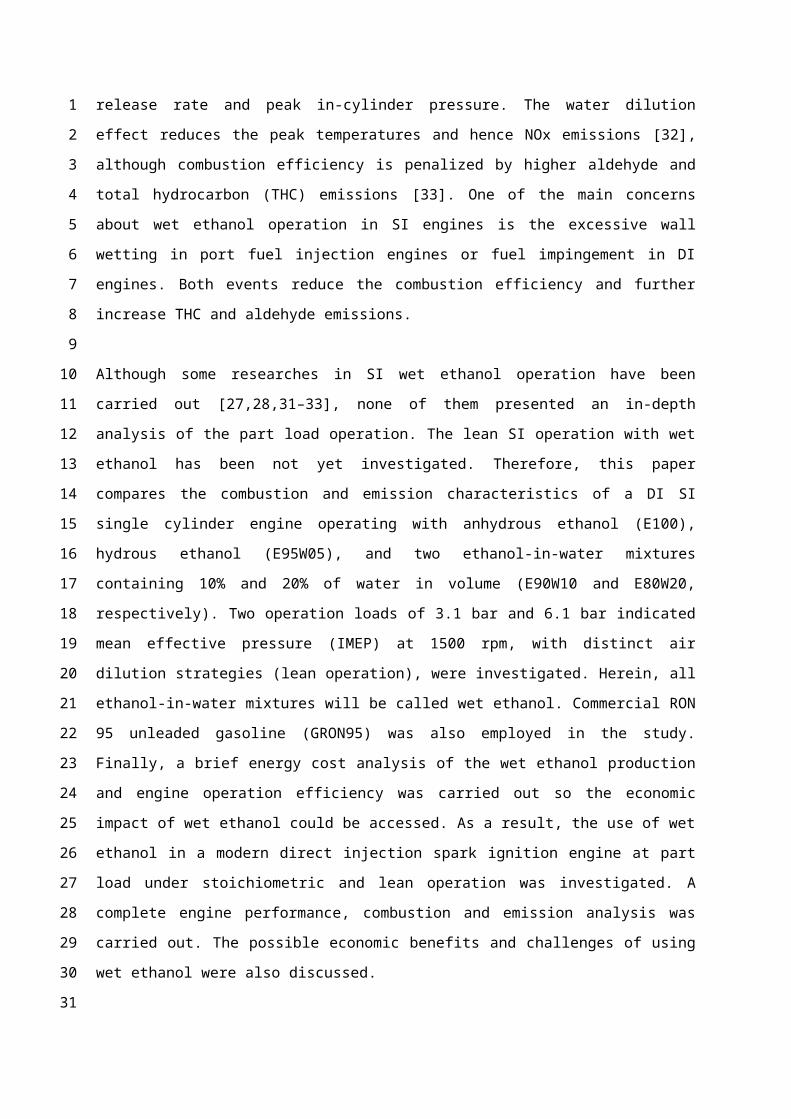
Figure 1 - Engine test cell setup.
The engine-out emissions were measured with a Horiba MEXA 7170DEGR gas analyser system. This
equipment has a NDIR unit for CO and CO2 measurements, a paramagnetic based O2 measurement
unit, a Chemiluminescence unit for NOx measurements, and a Flame Ionization Detector model FIA-
720 for actual hydrocarbon measurement. As shown in some researches regarding ethanol SI
operation [33,35], a considerable part of the organic unburned emissions is constituted by aldehydes
and other oxygenated compounds. For more accurate estimation of total organic unburned emission
accounting for the oxygenated compounds when using a FID detector, a correction factor (k FID) was
applied to the raw FID (FI D ppm) measurement depending on the ethanol volumetric content (e) in
the fuel (which accounts only for fuels containing carbons) [36,37]. In this work the FI Dppm raw
measurement was corrected by the method presented in [36] using an updated factor of 0.68
presented in [37]. This way, an estimative of the oxygenated unburned compounds (excluding CO
and CO2) in the THC measurement was also considered. The corrected FID measurement ¿) and the
k FID were calculated as
THC❑ppm=FI D ppm∗k FID (1)
k FID=1
1−(1−0.64)(0.608 e2+0.092e ) (2)
Finally, the indicated specific emissions were calculated following the procedures presented in [38]
on a wet basis. As wet ethanol contains high amount of water, its water content has been
introduced in the calculations of the dry-to-wet correction factorkw, adding the fuel water content
to the induced water due to air humidity. The specific NOx humidity correction factor has not been
123
4
5
6
7
8
9
10
11
12
13
14
15
16
17
18
19
20
21
22
23
24
25

used once the aim of such factor is to eliminate the charge humidity effect due to distinct day-to-day
and local-to-local temperature and humidity from the thermodynamic influence in the NOx
formation. The indicated specific gaseous emissions of each exhaust components evaluated ( ISga si)
were calculated as
ISga si=ui [ xi ]kwmexh
P I (3)
where: ui and [ xi ] are the raw gas exhaust factor [38] and the concentration (in ppm) of the i gas in
the exhaust flow; kw is the dry to wet correction factor applied to CO and NOx; mexh is the exhaust
mass flow rate calculated as the sum of the instantaneous fuel and mass flow rates; P I is the
indicated power.
All measurements were acquired through a high speed data acquisition system, synchronized to the
crank position through a 720 pulse per revolution encoder. Engine operational parameters were
monitored and saved through in-house built Matlab based software. The results were averaged over
300 consecutive cycles.
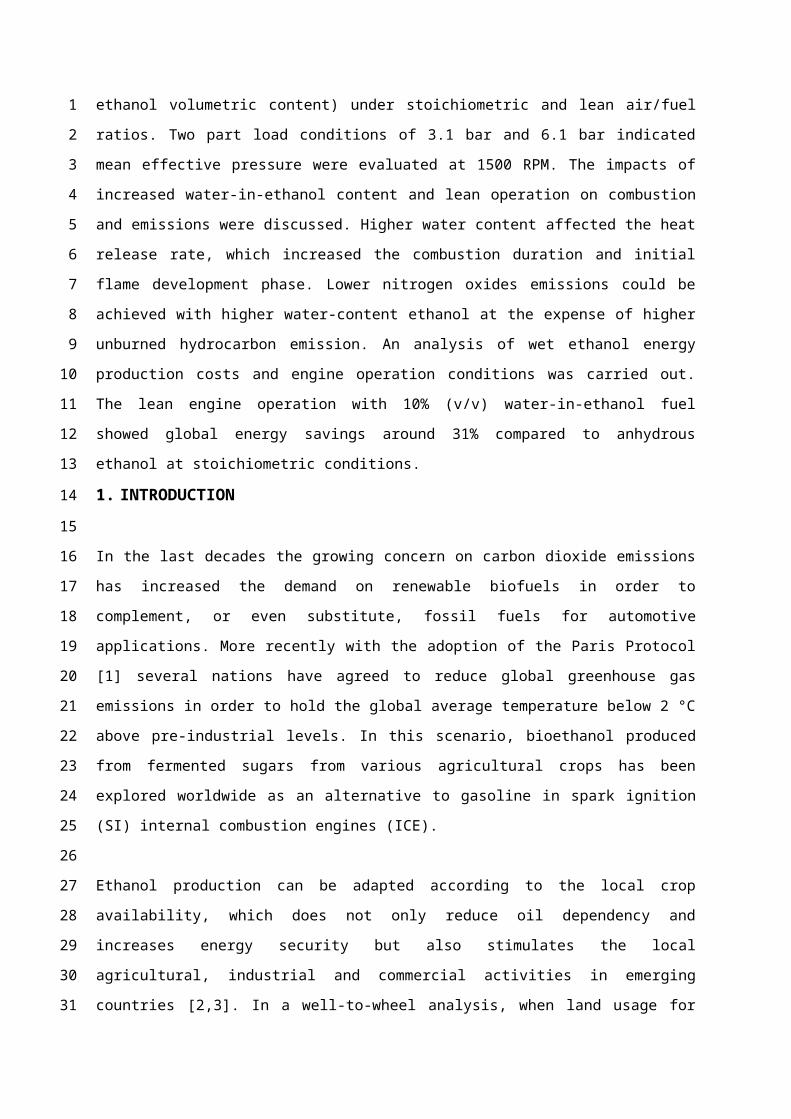
The chosen valve train strategy for the present study was a positive valve overlap (PVO). This profile
was chosen to emulate the operation of conventional cam driven valve train. The exhaust valve
opens a few crank angle degrees (CAD) before the bottom dead centre (BDC) of the exhaust phase,
and closes after the top dead centre (TDC). The intake valve opens some degrees before the TDC and
closes after the BDC, as presented in Figure 2. As schematically represented in the figure, due to the
electro-pneumatic valve actuation, the valve lift profile is trapezoidal instead of the conventional
elliptical cam profile shape. The injection timing was kept constant at the centre of the intake stroke
at 450 CAD after the firing top dead centre. This injection timing has been chosen to promote good
charge homogeneity due to the side mounting injector positioning, between the intake and exhaust
valves. Injection quantity has been varied according to each fuel in order to result in the desired
load.
In this operation mode and during the valve overlapping period, there is backflow of burned gas into
the intake ports. During the start of the intake stroke, these gases return to the cylinder and some
exhaust gases from the exhaust ports can also be returned to the cylinder. As shown in [39], the
1
2
3
4
5
6
7
8
9
10
11
12
13
14
15
16
17
18
19
20
21
22
23
24
25
26
27
28
29
30
31
32
positive valve overlap can be used to obtain internal exhaust gas recycled (iEGR) fraction between
10 and 20%.
0 180 360 540 720
PVO Valve ProfileInlet ValvesExhaust ValvesInjection
Figure 2 – Positive valve overlap valve events, injection timing and spark timing representation.
The tests were conducted at the loads of 3.1±0.10 bar and 6.1±0.15 bar IMEP. The relative air/fuel
ratio (lambda λ) was varied in steps of approximately 0.1, starting from stoichiometric operation
until the leanest possible condition for most fuels when the cyclic variability, monitored by the
coefficient of variation of IMEP (COVimep) reached 5%. Lambda was monitored using an automotive
wide-band UEGO sensor. For unleaded gasoline, the leanest dilution tested was around λ = 1.3.
The load and air/fuel ratio were iteratively adjusted through throttle and injection quantity. To
enable comparison with previous work done in the same engine at similar loads to the 3.1 bar IMEP
load, the valve lift was set to 2 mm. As this low lift would excessively increase the pumping loop
work for the higher load, the lift was increased to 6mm for the 6.1 bar IMEP case. The spark timing
for each operating point was swept for the maximum indicated efficiency.
Commercial unleaded RON 95 UK standard Gasoline (herein named as GRON95) was used. According
to the UK fuel legislation, the maximum oxygen mass content in the fuel is 3%, which is the result of
approximately 8% of ethanol-in-gasoline volume fraction. Using the densities and LHV values of 44.0
and 26.9 MJ/kg for gasoline and E100 [39], respectively, the GRON95 fuel mixture’s LHV could be
calculated. Ethanol containing a maximum volumetric water content of 0.9% from Hayman Group
was used as the anhydrous ethanol (E100). The ethanol and water mixtures containing 5%, 10% and
20% of water volumetric content, herein named as E95W05, E90W10 and E80W20, respectively,
were prepared by splash-blending E100 with de-ionized water. A bulb alcoholmeter was used to
ensure the right water content. The LHV of wet ethanol was calculated according to the ethanol
mass fraction.
1
2
3
456
7
8
9
10
11
12
13
14
15
16
17
18
19
20
21
22
23
24
25
26
27
28
29
30

3. RESULTS
3.1. Engine performance and combustion analysis
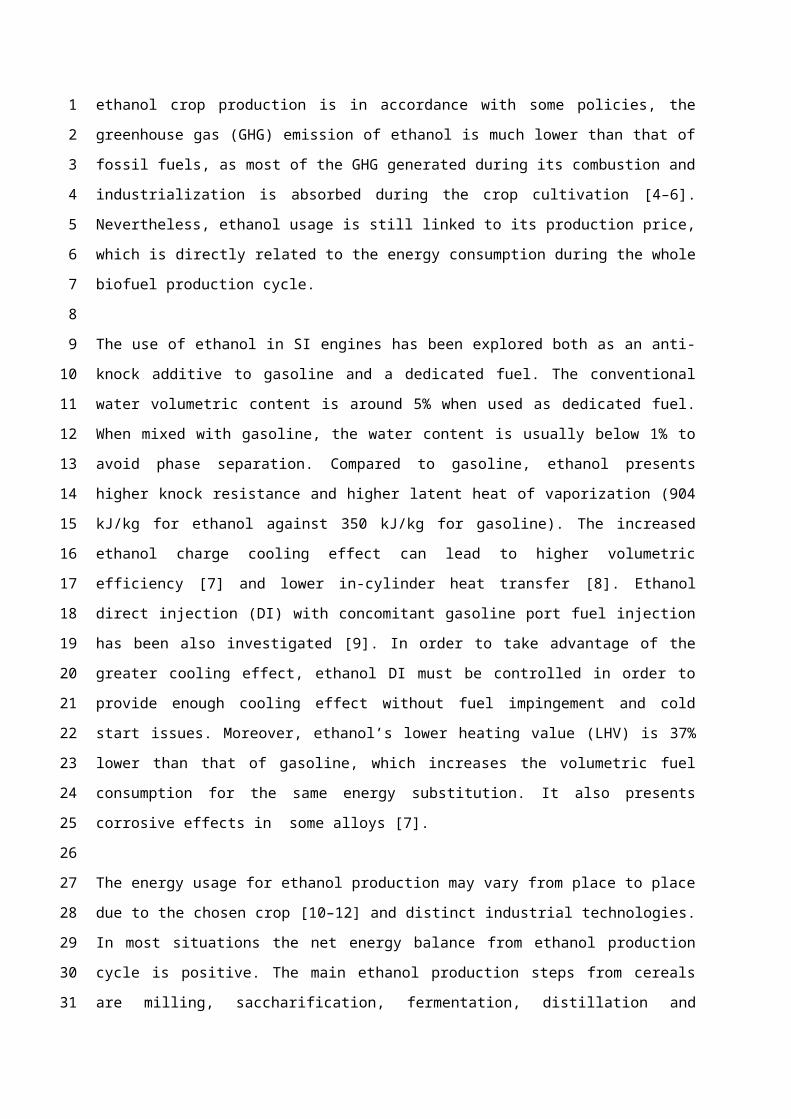
The load achieved in each operational point, spark timing, flame development angle (0-10% of mass
fraction burnt - MFB), combustion duration (10-90% MFB period), and COV imep are shown in Figure 3.
At both loads, the optimum spark timing near the stoichiometric operation (λ≈1.00) was advanced as
the water content in ethanol increased to achieve the best indicated efficiency. As the wet ethanol’s
water content acts as a diluent by reducing the charge temperature and decreasing its reactivity, the
initial flame development angle (FDA) increased. The higher in-cylinder temperature for the 6.1 bar
IMEP operation reduced the 0-10% MFB period as the temperature and pressure were higher near
stoichiometric operation for all tested fuels. Beyond λ≈1.2 the higher air mass content seemed to
affect the initial flame development in a higher degree and the initial FDA increased for the higher
load comparing to the lower load.
As water-in-fuel content increased, the combustion duration increased due to the higher charge
heat capacity and dilution effect. The same was valid for increased air dilution. The higher charge
heat capacity decreased the in-cylinder temperatures as the diluent absorbed the flame generated
heat and hampered the flame propagation process, further reducing the charge temperature. These
two combined effects resulted in lower flame propagation speeds with longer combustion durations,
which is in agreement with studies regarding laminar flames with higher water dilution [40–43]. The
increase in the combustion duration with the load was a result of higher in-cylinder charge
inhomogeneity and greater fueling rate. Gasoline low load combustion tended to be as fast as E100
combustion which also increased with the load.
The pressure and Heat Release Rate (HRR) trends at 3.1 bar presented in Figure 4 and Figure 5 show
that the highest peak of the heat release rate occurred for E100 and decreased almost linearly with
the increase in water content. At the same conditions, ethanol presents higher laminar flame speed
than gasoline. On the other hand, higher ethanol charge cooling effect decreased in-cylinder
temperatures which resultd in similar combustion periods for E100 and GRON95. As water content
increased, more expressive charge cooling effects were expected, reducing the in-cylinder
temperature and decreasing the heat release rate. The trend for the reduction in the peak HRR with
1
2
3
4
5
6
7
8
9
10
11
12
13
14
15
16
17
18
19
20
21
22
23
24
25
26
27
28
29
30
31
32
33
34

the increase in the water content (Figure 4) for the same air/fuel ratio was confirmed at both loads.
However, there was no clear correlation between the water content and the maximum in-cylinder
pressure shown in Figure 6. This fact occurred due to the distinct spark timing used for each fuel in
order to achieve the minimum spark advance for best torque (MBT), which affected the maximum
in-cylinder pressure.
Low Load
High Load
1
2
3
4
5
6
7

Figure 3 – Operating conditions and combustion parameters. Filled symbols represent 3.1 bar IMEP
whilst hollow symbols represent 6.1 bar IMEP load.
-20 -10 0 10 20 30 40-5
0
5
10
15
20
25
0
3
6
9
12
15
18
21
24
GRON95 E100 E95W05E90W10 E80W20
Crank Angle Degree
In-c
ylin
der P
ress
ure
(bar
)
Hea
t Rel
ease
Rat
e (J
/CAD
)
TDC
Figure 4 – Pressure and Heat Release Rate traces for 3.1 bar IMEP stoichiometric operation with
distinct fuels.
-30 -20 -10 0 10 20 30 40 50-10
-5
0
5
10
15
20
25
30
0
3
6
9
12
15
18
21
24
27
1.0 1.21.4 1.5
Crank Angle Degree
In-c
ylin
der P
ress
ure
(bar
)
Hea
t Rel
ease
Rat
e (J
/CAD
)
Lambda
Figure 5 – Pressure and Heat Release Rate traces of E100 at 3.1 bar IMEP.
There was a clear relationship between air dilution, HRR and in-cylinder peak pressure at both loads
and for all fuels. As shown in Figure 5 by increasing the λ for the same fuel, the peak HRR decreased
and combustion duration increased. The HRR peak was advanced towards TDC as the peak pressure
1
2
3
45
6
7
89
10
11
12
13

increased. The in-cylinder pressure increased due to the presence of more air in the beginning of the
compression phase, besides a higher ratio of specific heats which minimized heat losses. As water-in-
ethanol content increased, more advanced spark timings were necessary to account for slower
combustion as shown in Figure 3. Even then, the in-cylinder temperature (Figure 6) and combustion
efficiency (Figure 7) decreased. It has been shown [31] through OH Planar Laser Induced
Fluorescence (PLIF) images that increasing the water-in-ethanol content, for similar engine
operation, resulted in less flame wrinkle. It can be implied that the turbulent flame speed was
reduced in such situations.
The initial increase in air/fuel ratio led to a more homogeneous charge with better in-cylinder
conditions for the combustion process. Thus, for the lower load the COV imep decreased for initial
lambda increments. For higher air/fuel ratios (beyond lambda 1.2)?) the lower in-cylinder
temperature impaired the initial flame development process and increase the combustion cycle-to-
cycle variability, resulting in higher COVimep, until a point when misfire took place. A possible way to
reduce the COV would be to further advance the spark timing after the MBT is achieved. The result
would be a higher in-cylinder pressure and temperature during combustion which propitiates a more
stable combustion process in the penalty of lower engine indicated efficiency and higher NOx
emissions. At 6 bar IMEP there was higher in-cylinder inhomogeneity due to the higher injected
mass per cycle and the injector orientation (side mounted),. This fact resulted in higher combustion
variability with the increase in air/fuel ratio. The more pronounced COV imep of the 6.1 bar gasoline
cases seems to be the result of both poorer gasoline vaporization and in-cylinder mixture formation
process. The evidence was provided by emissions results discussed in a later section. Even then, the
COVimep values are between 2% and 3%, which can be considered stable operation. The optimization
of the injection timing for each load and fuel would possibly reduce the COV imep, but, would result in
distinct in-cylinder conditions and make the direct comparison of other parameters harder.
For all tested conditions the maximum pressure rise rate (PRRm) was kept below 3 bar/CA (Figure 6),
and there was no audible knocking noise. The PRRm seemed to be more directly related to the load
and spark timing than to the water-in-ethanol content. For all operating conditions, MBT could be
achieved at both loads with gasoline and all ethanol mixtures.
1
2
3
4
5
6
7
8
9
10
11
12
13
14
15
16
17
18
19
20
21
22
23
24
25
26
27
28
29
30
31
32

Figure 6 – Pressure and temperature related parameters.
The reduction in exhaust temperature with the increase in water content and air dilution was
consistent with the in-cylinder pressure traces. The investigation of the pressure traces by the end of
combustion, for both Figure 4 and Figure 5, presented very similar pressure levels. It implied that the
temperatures in the expansion phase were lower for higher water content fuel mixtures (higher in-
Low Load
High Load12
3
4
5
6
7

cylinder mass), resulting in lower exhaust temperature. This trend agreed with the tendency shown
in [32]. The exhaust temperatures in the 3.1 bar at stoichiometric operation would be high enough
for the efficient use of a three-way catalytic converter. Previous studies [33] showed that this after-
treatment systems would be efficient enough to manage the engine-out emissions of wet ethanol.
The leaner the operation gets, the lower is the exhaust temperature and the use of three-way
catalysts is no longer possible. For the 3.1 bar IMEP load and conditions leaner than λ=1.3, exhaust
temperatures below 600 K would also impair the conversion efficiency of oxidation catalysts. Other
after-treatment systems as lean NOx trap would also need to be considered. The use of higher
internal and/or external residual gas recirculation (EGR) should also be considered for NOx
mitigation, but THC and CO would still be a challenge at lower loads.
The indicated efficiency presented in Figure 7 represented the relationship between the developed
work to the amount of energy delivered by the fuel per cycle. In the four-stroke SI throttled
operation the gas exchange and combustion efficiencies directly affect the indicated efficiency.
Throttled operation increases the pumping work during the intake stroke as a method to reduce the
amount of induced air, reducing the gas exchange efficiency. At low load as the water-in-ethanol
content increased, the charge cooling effect became more pronounced and the throttle needed to
be closed in order to keep the load, resulting in 10% difference between the low and high load
conditions. At higher load both throttling and charge cooling effect were less pronouced and the gas
exchange efficiency was virtually the same for all fuels. At the same load, the increase in the air/fuel
ratio resulted in reduced pumping loses and better thermodynamic characteristics (higher polytropic
coefficient), which increased the indicated efficiency. Considering only this effect, the lean SI
operation indicated efficiency would increase linearly with the increase in the gas exchange
efficiency, but the combustion effects on the indicated efficiency must also be considered.
The combustion efficiency was affected by the quantity of fuel injected per cycle, in-cylinder
temperature and homogeneity of the charge. As more fuel was injected (load increased), higher
charge stratification occurred and led to the formation of over- rich zones. It has been shown that
part of ethanol organic emissions is constituted by unburned ethanol [35]. While in DI gasoline
engines the fuel stratification may lead to soot formation and distinct unburnt hydrocarbon
components, DI ethanol operation produces mostly unburned ethanol emissions and aldehydes.
Therefore, the increased stratification at higher load led to lower combustion efficiency near
stoichiometric operation. As the mixture became globally leaner, the combustion efficiency
increased and reached its maximum around λ≈1.2 (for the high load operation), whilst the best
1
2
3
4
5
6
7
8
9
10
11
12
13
14
15
16
17
18
19
20
21
22
23
24
25
26
27
28
29
30
31
32
33
34

combustion efficiency for low load occurred at λ≈1.1. The water content decreased the combustion
efficiency not only due to the higher in-cylinder cooling effect, but also due to the diluting effect. The
combustion efficiency seemed to be more sensitive to water content at higher loads, where the
mass of water injected per cycle was higher and impaired the whole fuel vaporization process. On
the other hand, the initial increase in the air/fuel ratio raised the combustion efficiency due to
higher oxygen availability. For further increases in air/fuel ratio, the average in-cylinder temperature
during combustion decreased quickly, leading to partial oxidation. Although gasoline combustion
efficiency was lower, the trends were exactly the same as those of alcohol fuels.
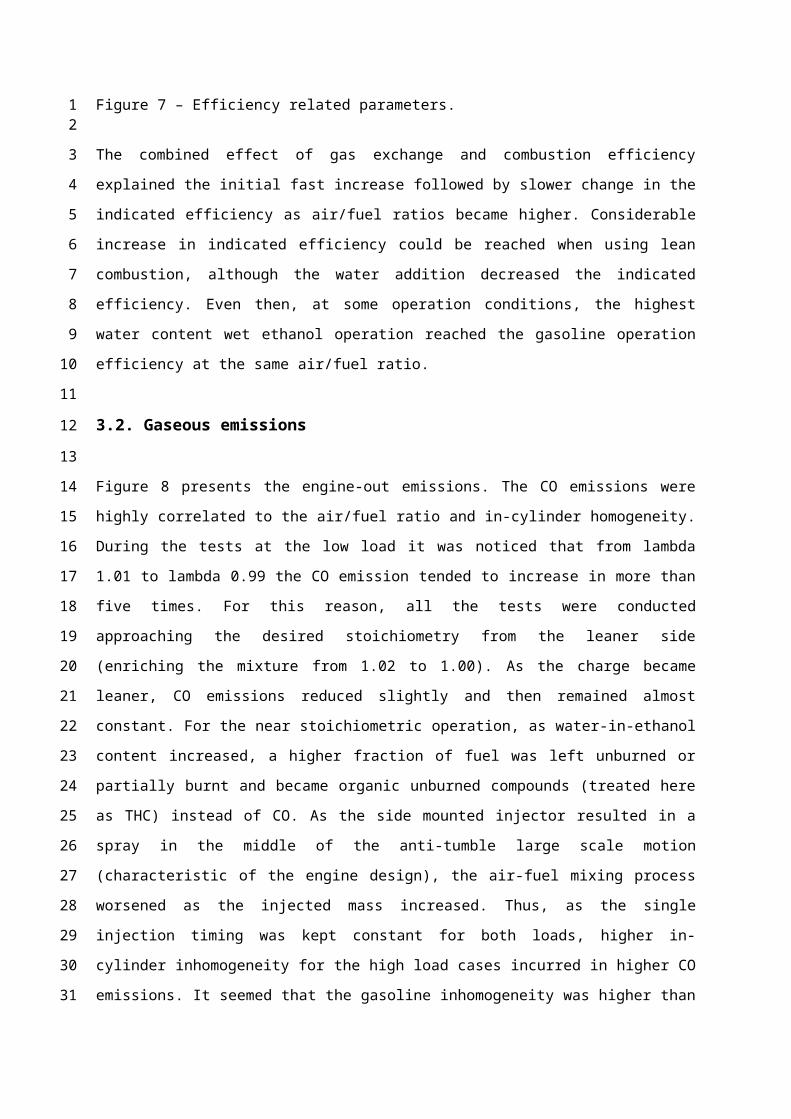
Figure 7 – Efficiency related parameters.
The combined effect of gas exchange and combustion efficiency explained the initial fast increase
followed by slower change in the indicated efficiency as air/fuel ratios became higher. Considerable
increase in indicated efficiency could be reached when using lean combustion, although the water
addition decreased the indicated efficiency. Even then, at some operation conditions, the highest
Low Load
High Load
1
2
3
4
5
6
7
8
9
101112
13
14
15
16

water content wet ethanol operation reached the gasoline operation efficiency at the same air/fuel
ratio.
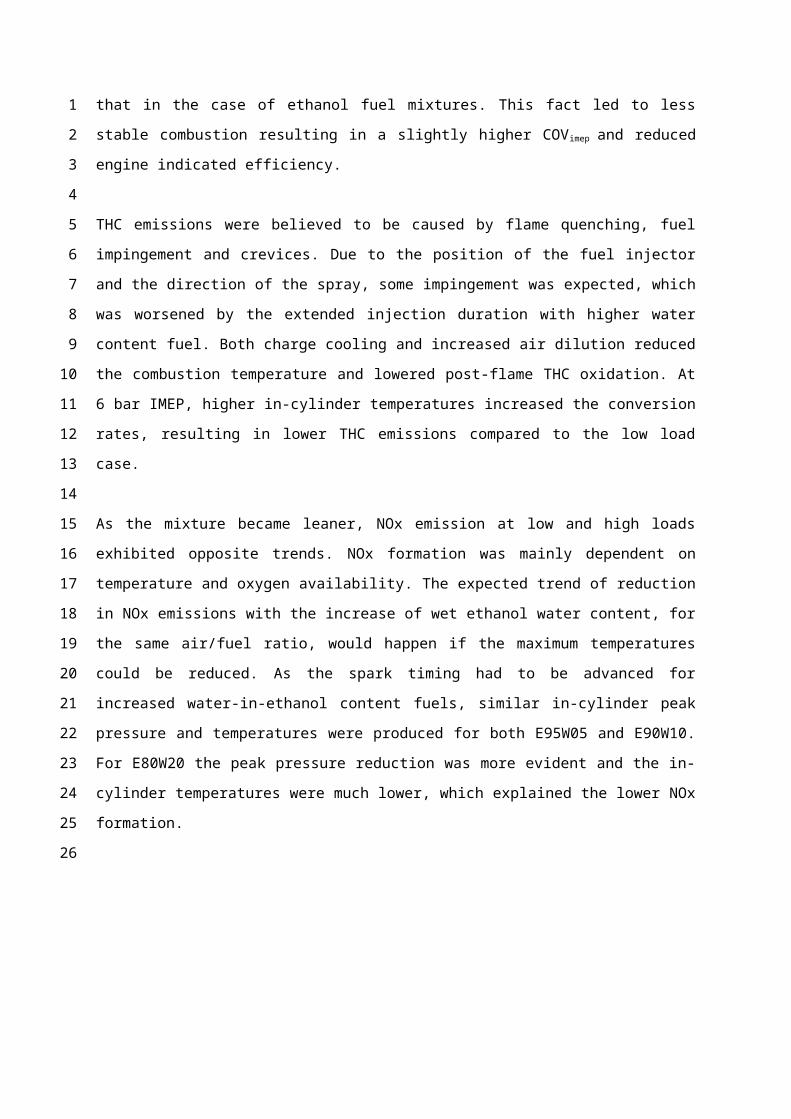
3.2. Gaseous emissions
Figure 8 presents the engine-out emissions. The CO emissions were highly correlated to the air/fuel
ratio and in-cylinder homogeneity. During the tests at the low load it was noticed that from lambda
1.01 to lambda 0.99 the CO emission tended to increase in more than five times. For this reason, all
the tests were conducted approaching the desired stoichiometry from the leaner side (enriching the
mixture from 1.02 to 1.00). As the charge became leaner, CO emissions reduced slightly and then
remained almost constant. For the near stoichiometric operation, as water-in-ethanol content
increased, a higher fraction of fuel was left unburned or partially burnt and became organic
unburned compounds (treated here as THC) instead of CO. As the side mounted injector resulted in
a spray in the middle of the anti-tumble large scale motion (characteristic of the engine design), the
air-fuel mixing process worsened as the injected mass increased. Thus, as the single injection timing
was kept constant for both loads, higher in-cylinder inhomogeneity for the high load cases incurred
in higher CO emissions. It seemed that the gasoline inhomogeneity was higher than that in the case
of ethanol fuel mixtures. This fact led to less stable combustion resulting in a slightly higher COV imep
and reduced engine indicated efficiency.
THC emissions were believed to be caused by flame quenching, fuel impingement and crevices. Due
to the position of the fuel injector and the direction of the spray, some impingement was expected,
which was worsened by the extended injection duration with higher water content fuel. Both charge
cooling and increased air dilution reduced the combustion temperature and lowered post-flame THC
oxidation. At 6 bar IMEP, higher in-cylinder temperatures increased the conversion rates, resulting in
lower THC emissions compared to the low load case.
As the mixture became leaner, NOx emission at low and high loads exhibited opposite trends. NOx
formation was mainly dependent on temperature and oxygen availability. The expected trend of
reduction in NOx emissions with the increase of wet ethanol water content, for the same air/fuel
ratio, would happen if the maximum temperatures could be reduced. As the spark timing had to be
advanced for increased water-in-ethanol content fuels, similar in-cylinder peak pressure and
temperatures were produced for both E95W05 and E90W10. For E80W20 the peak pressure
1
2
3
4
5
6
7
8
9
10
11
12
13
14
15
16
17
18
19
20
21
22
23
24
25
26
27
28
29
30
31
32
33
reduction was more evident and the in-cylinder temperatures were much lower, which explained
the lower NOx formation.
Figure 8 – Engine-out emissions.
The increase in air/fuel ratio reduced the in-cylinder average temperature, which should have
reduced the NOx formation for a homogeneous mixture as occurring in the low load cases. The
higher stratification at higher loads increased the temperature in some flame reaction zones due to
stoichiometric to slightly rich mixture spots. Even with an average lower in-cylinder temperature, the
NOx formation increased due to the higher flame temperature achieved in these zones [44].
Gasoline NOx emissions were relatively higher due to the increased in-cylinder temperature resulted
from faster combustion.
Low Load
High Load
1
2
3
456
7
8
9
10
11
12
13
14
15
16
17

4. COST-BENEFIT ANALYSIS
The practical use of wet ethanol in SI engines is directly connected to the ethanol price. Although
much has been said about the price reduction of the wet ethanol production process compared to
anhydrous (E100) or hydrous (E95W05) ethanol [14,20–23,27,28,33], an energy usage and
conversion based comparison has not been provided elsewhere. The data presented in [14] has been
considered regarding the energy expense for the production of one litre of ethanol from corn
(considering co-products). It has been assumed that around 68% of the total energy used during the
water removal processes is used for the distillation process to reach around 95% of ethanol-in-water
volumetric content. The 32% left is used in the dehydration process to reach 99.5% of ethanol-in-
water volumetric content. By using the distillation energy expense presented in [13], a normalized
water removal energy expense (NWREE) trend and a normalized energy expense in the production
of wet ethanol (NEEPWE) curve to produce one litre of different water-in-ethanol mixtures could be
obtained as shown in Figure 9. This figure presents the energy requirement for water removal during
the wet ethanol production, the normalized energy production costs of corn ethanol, the engine fuel
consumption, and energy based operational cost evaluation.
It is known that depending on the crop used and the possible co-products obtained, as well as the
ethanol production process, the energy fraction of the total production cost regarding the water
removal process varies and affects the final fuel cost. As the net-energy balance for ethanol is
positive for most of the production scenarios [17], the use of the NEEPWE instead of the absolute
monetary cost better illustrates the influence of water content in total energy expense for a more
general evaluation. The higher the energy fraction for the water removal process is (in the total
energy expensed during the ethanol production), the lower is the wet ethanol fuel cost and the
higher is the impact on the final engine operational costs.
When multiplying the NEEPWE by fuel consumption, for both loads tested and distinct fuel
compositions, the result is the normalized energy engine operational cost (NOpC), calculated as:
NOpC=( mfρf ) . NEEPWE (4)
1
2
3
4
5
6
7
8
9
10
11
12
13
14
15
16
17
18
19
20
21
22
23
24
25
26
27
28
29
30
31

where: mf is the engine mass fuel consumption, directly provided by the fuel flow meter; ρ f is fuel
density (ethanol-water mixtures) at 25 °C, calculated according to [45]. The ratio ( mfρ f ) is the
volumetric fuel consumption. The NOpC relates the normalized energy expense for wet ethanol
production and the engine volumetric fuel consumption based on the engine fuel conversion
efficiency. The lower the NOpC (looking at each load individually), the lower is the engine
operational cost on an energy bases and the lower is the real monetary operational cost reduction.
As shown in Figure 9, the very high energy expense for the production of anhydrous ethanol makes
the operational cost of such fuel the highest amongst the others. When using only the distillation to
reach around 95% of ethanol-in-water, the operational cost dropped considerably. The fitted curves
show that the best energy based operational cost would be achieved for water-in-ethanol mixtures
with water content between 85 and 90%. Although the production cost of one litre of E80W20
would be the cheapest amongst the fuels tested, the volumetric fuel consumption increased as a
consequence of the higher water content and lower engine efficiency. Comparable energy based
operational costs to the anhydrous ethanol can be expected for mixtures with more than 25% of
water in volume by analysing the extrapolated fitted curves.
Comparing the stoichiometric operational cost of anhydrous ethanol to the stoichiometric and lean
operational costs of wet ethanol (the average costs of both loads), the cost reduction in the
operational cost on an energy bases could be accessed. The highest operational cost reduction
occurred for E90W10 at lean conditions, according to the evaluated scenarios. The trend shows that
the lowest operational cost was achieved for wet ethanol containing around 12.5% of water content
in volume. It is also interesting to access the reduction in the operational cost of wet ethanol to
hydrous ethanol (E95W05), which is commercially available in some countries as Brazil. In this case
the operational cost reduction was lower than that compared to hydrous ethanol, but it was still
significant. Table 2 summarizes the operational cost reduction of wet ethanol compositions
compared to anhydrous (E100) and hydrous (E95W05) ethanol.
Table 2Operational Cost Reduction
Compared FuelsE90W10 E80W20
λ=1.0 λ=1.3 λ=1.0 λ=1.3
E100* 25% 31% 19% 25%
E95W05* 12% 19% 5% 11%
* λ=1.0
1
2
3
4
5
6
7
8
9
10
11
12
13
14
15
16
17
18
19
20
21
22
23
24
25
26
27
28

Figure 9 – Wet ethanol production and usage cost as function of the ethanol-in-water volumetric content. +[13]; ++[14].
Distilation+
Dehydration++
IMEP: 6.1 bar3.1 bar
1
2345
6
7
8
9
10
11
12
13
14
5. CONCLUSIONS
Tests were conducted in a direct injection single cylinder spark ignition engine with anhydrous
ethanol (E100), hydrous ethanol (E95W05), two wet ethanol blends (E90W10 and E80W20), and
unleaded UK gasoline (GRON95). Two part load operating conditions were tested, 3.1 and 6.1 bar
IMEP. The main findings regarding the engine operation can be summarized as follows:
- Stable engine operation could be achieved for lean mixture of λ=1.3 for all tested fuels at both
low and high loads;
- Flame development angle and combustion duration increased as the water-in-ethanol volumetric
content increased. This was a consequence of lower in-cylinder temperatures due to water
dilution, which lead to decreased heat release rate;
- In order to achieve maximum indicated efficiency through MBT operation, the location of the
peak pressure tended to advance towards TDC with the increase of the water-in-ethanol content.
The maximum in-cylinder pressure increased with the load but there was no clear trend between
water content and maximum pressure;
- The indicated efficiency increased for lean operation due to lower pumping loses and better
mixture characteristics. Combustion efficiency was initially improved by increasing the air/fuel
ratio until λ=1.2. For leaner mixtures, the lower in-cylinder temperature increased THC and CO
emissions and decreased the combustion efficiency.
- THC and CO engine-out emissions trend for all ethanol fuels were similar to gasoline operation. In
general as the water-in-ethanol content increased, CO engine-out emissions dropped whilst THC
increased. Gasoline THC emission was comparable to the anhydrous ethanol, whilst CO emissions
were the highest, attributed to the injection timing and poor mixing process;
- Low load NOx emissions with E80W20 were almost half of all other ethanol fuels for all air/fuel
ratios. E95W05 and E90W10 presented similar NOx emissions to E100. Gasoline presented the
highest NOx emissions amongst all cases tested (almost three times higher than the E80W20);
- Improvements in the fuel injection system are required to improve the SI engine efficiency and
combustion process. Port fuel injection should also be evaluated in future studies.
Regarding the engine operating parameters and engine-out gaseous emissions, it could be
concluded that the water-in-ethanol content diluent effect was more pronounced at the lowest load
than at the highest load. Indicated and combustion efficiencies were proportionally more impaired
1
2
3
4
5
6
7
8
9
10
11
12
13
14
15
16
17
18
19
20
21
22
23
24
25
26
27
28
29
30
31
32
33
34
and the effects on NOx emissions were more pronounced. For a real engine application it can be
expected that its operation will be slightly less efficient for wet ethanol with up to 10% volumetric
content than anhydrous ethanol, but similar to the gasoline operation regarding combustion
processes and CO and THC emissions.
Comparing E95W05 with E90W10 the impact on real engine operating conditions would be minor,
but the expected operational cost reduction would be in the order of 10%. Regarding their
application in flexible fuel cars, Gasoline and E90W10 miscibility problems would occur at low
temperatures (below 10 °C) and some gasoline additive to support higher water content in the
ternary mixture (gasoline-ethanol-water) are required. E80W20 would be practical only in dedicated
ethanol engines. Due to the lower LHV of water-ethanol mixtures, volumetric fuel consumption
would increase compared to anhydrous ethanol. Oil contamination and engine corrosion need to be
further investigated.
The comparison of NOpC showed that the most profitable scenario is the lean operation with
E90W10. It provided a reduction on the engine operational cost around 31% and 19% with E100 and
E95W05, respectively, when compared to the conventional stoichiometric operation. Although it has
been already shown in the literature that a three-way catalyst is effective to manage wet ethanol
stoichiometric emissions [33], after treatment systems for lean-burn operation is still a costly
challenge.
Finally, the use of wet ethanol reduced the energy requirement during the whole ethanol life cycle.
The saved energy in the production process can help to further reduce fossil fuel dependency whilst
mitigating greenhouse gas emissions.
6. ACKNOWLEDGEMENTS
The authors would like to acknowledge the Brazilian Council for Scientific and Technological
Development (CNPq – Brasil) for supporting the PhD studies of Mr. Lanzanova and Mr. Dalla Nora at
Brunel University London.
1
2
3
4
5
6
7
8
9
10
11
12
13
14
15
16
17
18
19
20
21
22
23
24
25
26
27
28
29
30
31
32
33
34

7. REFERENCES
[1] United Nations. Adoption of the Paris Agreement. Framew. Conv. Clim. Chang., 2015, p. 32.
[2] (EREC) EREC. Renewable Energy in Europe: Markets, Trends, and Technologies. Second Ed. London: Earthscan Ltd; 2010.
[3] Maroun MR, La Rovere EL. Ethanol and food production by family smallholdings in rural Brazil: Economic and socio-environmental analysis of micro distilleries in the State of Rio Grande do Sul. Biomass and Bioenergy 2014;63:140–55. doi:10.1016/j.biombioe.2014.02.023.
[4] The European Union Parliament. L 140/88 2009:88–113.
[5] Walter A, Dolzan P, Quilodrán O, de Oliveira JG, da Silva C, Piacente F, et al. Sustainability assessment of bio-ethanol production in Brazil considering land use change, GHG emissions and socio-economic aspects. Energy Policy 2011;39:5703–16. doi:10.1016/j.enpol.2010.07.043.
[6] Elbehri A, Segerstedt A, Liu P. Biofuels and the sustainability challenge: A global assessment of sustainability issues, trends and policies for biofuels and related feedstocks. Rome: 2013.
[7] Jeuland N, Montagne X, Gautrot X. Potentiality of Ethanol As a Fuel for Dedicated Engine. Oil Gas Sci Technol 2004;59:559–70. doi:10.2516/ogst:2004040.
[8] PANA C, NEGURESCU N, POPA, M. G, CERNAT A, SOARE D. ASPECTS OF THE USE OF ETHANOL IN SPARK IGNITION ENGINE. JSAE Tech Pap 2007. doi:10.4271/2007-01-2040.
[9] Huang Y, Hong G, Huang R. Investigation to charge cooling effect and combustion characteristics of ethanol direct injection in a gasoline port injection engine. Appl Energy 2015;160:244–54. doi:10.1016/j.apenergy.2015.09.059.
[10] Shapouri H, Duffield J, Wang M. The energy balance of corn ethanol revisited. Trans Soc Agric Eng 2003;46:959–68.
[11] Dai D, Hu Z, Pu G, Li H, Wang C. Energy efficiency and potentials of cassava fuel ethanol in Guangxi region of China. Energy Convers Manag 2006;47:1686–99. doi:10.1016/j.enconman.2005.10.019.
[12] Salla DA, Furlaneto F de PB, Cabello C, Kanthack RAD. Avaliação energética da produção de etanol utilizando como matéria-prima a cana-de-açúcar. Ciência Rural 2009;39:2516–20.
[13] Ladisch MR, Dyck K. Dehydration of ethanol: new approach gives positive energy balance. Science 1979;205:898–900. doi:10.1126/science.205.4409.898.
[14] Flowers DL, Aceves SM, Frias JM. Improving Ethanol Life Cycle Energy Efficiency by Direct Utilization of Wet Ethanol in HCCI Engines. SAE Tech. Pap., 2007, p. 1070–8. doi:10.4271/2007-01-1867.
[15] López-Plaza EL, Hernández S, Barroso-Muñoz FO, Segovia-Hernández JG, Aceves SM, Martínez-Frías J, et al. Experimental and Theoretical Study of the Energy Savings from Wet Ethanol Production and Utilization. Energy Technol 2014;2:440–5. doi:10.1002/ente.201300180.
1
2
3
4
56
789
10
111213
1415
1617
1819
202122
2324
2526
2728
2930
3132
333435
[16] Chen W-C, Sheng C-T, Liu Y-C, Chen W-J, Huang W-L, Chang S-H, et al. Optimizing the efficiency of anhydrous ethanol purification via regenerable molecular sieve. Appl Energy 2014;135:483–9. doi:10.1016/j.apenergy.2014.08.112.
[17] Lorenz D, Morris D. How much energy does it take to make a gallon of ethanol? Institute for Local Self-Reliance; 1995.
[18] Salla DA, Furlaneto F de PB, Cabello C, Kanthack RAD. Estudo energético da produção de biocombustível a partir do milho Energetic study of ethanol production from the corn crops. Ciência Rural 2010;40:2017–22.
[19] Nguyen TLT, Gheewala SH, Garivait S. Energy balance and GHG-abatement cost of cassava utilization for fuel ethanol in Thailand. Energy Policy 2007;35:4585–96. doi:10.1016/j.enpol.2007.03.012.
[20] Cordon D, Clarke E, Beyerlein S, Steciak J, Cherry M. Catalytic Igniter to Support Combustion of Ethanol-Water/Air Mixtures in Internal Combustion Engines 2002. doi:10.4271/2002-01-2863.
[21] Olberding J, Beyerlein DCS, Steciak J, Cherry M. Dynamometer Testing of an Ethanol-Water Fueled Transit Van. SAE Tech. Pap., 2005. doi:10.4271/2005-01-3706.
[22] Mack JH, Aceves SM, Dibble RW. Demonstrating direct use of wet ethanol in a homogeneous charge compression ignition (HCCI) engine. Energy 2009;34:782–7. doi:10.1016/j.energy.2009.02.010.
[23] Saxena S, Schneider S, Aceves S, Dibble R. Wet ethanol in HCCI engines with exhaust heat recovery to improve the energy balance of ethanol fuels. Appl Energy 2012;98:448–57. doi:10.1016/j.apenergy.2012.04.007.
[24] Saxena S, Vuilleumier D, Kozarac D, Krieck M, Dibble R, Aceves S. Optimal operating conditions for wet ethanol in a HCCI engine using exhaust gas heat recovery. Appl Energy 2014;116:269–77. doi:10.1016/j.apenergy.2013.11.033.
[25] Megaritis a., Yap D, Wyszynski ML. Effect of water blending on bioethanol HCCI combustion with forced induction and residual gas trapping. Energy 2007;32:2396–400. doi:10.1016/j.energy.2007.05.010.
[26] Megaritis a., Yap D, Wyszynski ML. Effect of inlet valve timing and water blending on bioethanol HCCI combustion using forced induction and residual gas trapping. Fuel 2008;87:732–9. doi:10.1016/j.fuel.2007.05.007.
[27] Lanzanova TDM, Vielmo HA, Sari RL, Dornelles HM, Tatsch GA, Martins MES, et al. Performance Analysis of a Spark Ignited Engine Running on Different Water-in-Ethanol Mixtures. SAE Tech. Pap., 2013. doi:10.4271/2013-36-0202.
[28] Martins M, Lanzanova T, Sari R. Low Cost Wet Ethanol for Spark-Ignited Engines: Further Investigations. SAE Int J Fuels Lubr 2015;8:2015–01 – 0954. doi:10.4271/2015-01-0954.
[29] Dempsey AB, Das Adhikary B, Viswanathan S, Reitz RD. Reactivity Controlled Compression Ignition Using Premixed Hydrated Ethanol and Direct Injection Diesel. Proc. ASME. 44427; ASME 2011 Intern. Combust. Engine Div. Fall Tech. Conf., vol. 134, 2012, p. 963–75. doi:10.1115/1.4006703.
[30] Fang W, Kittelson DB, Northrop WF. An Experimental Investigation of Reactivity-Controlled Compression Ignition Combustion in a Single-Cylinder Diesel Engine Using Hydrous Ethanol. Proc ASME 2013 Intern Combust Engine Div Fall Tech Conf 2013;137:1–9. doi:10.1115/ICEF2013-19209.
123
45
678
910
1112
1314
1516
171819
202122
232425
262728
293031
3233
343536
373839
[31] Augoye A, Aleiferis P. Characterization of Flame Development with Hydrous and Anhydrous Ethanol Fuels in a Spark-Ignition Engine with Direct Injection and Port Injection Systems. SAE Tech. Pap., 2014. doi:10.4271/2014-01-2623.
[32] Brewster S, Railton D, Maisey M, Frew R. The Effect of E100 Water Content on High Load Performance of a Spray Guide Direct Injection Boosted Engine. SAE Tech. Pap., 2007. doi:10.4271/2007-01-2648.
[33] Munsin R, Laoonual Y, Jugjai S, Imai Y. An experimental study on performance and emissions of a small SI engine generator set fuelled by hydrous ethanol with high water contents up to 40%. Fuel 2013;106:586–92. doi:10.1016/j.fuel.2012.12.079.
[34] Zhang Y, Zhao H. Investigation of combustion, performance and emission characteristics of 2-stroke and 4-stroke spark ignition and CAI/HCCI operations in a DI gasoline. Appl Energy 2014;130:244–55. doi:10.1016/j.apenergy.2014.05.036.
[35] Melo T de, Brito M de, Machado G, Paiva C. Procedure for Uncertainty of Measurement Determination of Spark Ignition Engine Emission Tests. SAE Tech Pap 2012.
[36] Kar K, Tharp R, Radovanovic M, Dimou I, Cheng WK. Organic gas emissions from a stoichiometric direct injection spark ignition engine operating on ethanol/gasoline blends. Int J Engine Res 2010;11:499–513. doi:10.1243/14680874JER610.
[37] Wallner T. Correlation Between Speciated Hydrocarbon Emissions and Flame Ionization Detector Response for Gasoline/Alcohol Blends. J Eng Gas Turbines Power 2011;133:082801. doi:10.1115/1.4002893.
[38] Economic Commission for Europe of the United Nations. Regulation No 49 of the Economic Commission for Europe of the United Nations (UN/ECE). Off J Eur Union 2013:1–390.
[39] Heywood JB. Internal Combustion Engine Fundamentals. vol. 21. 1st ed. McGraw-Hil; 1988.
[40] Koda S, Oda K, Hirano M, Hirano T, Akita K. Burning characteristics of methanolwaterair mixtures in a constant volume combustion vessel. Combust Flame 1982;46:17–28. doi:10.1016/0010-2180(82)90004-9.
[41] Parag S, Raghavan V. Experimental investigation of burning rates of pure ethanol and ethanol blended fuels. Combust Flame 2009;156:997–1005. doi:10.1016/j.combustflame.2008.10.011.
[42] Mazas a. N, Fiorina B, Lacoste D a., Schuller T. Effects of water vapor addition on the laminar burning velocity of oxygen-enriched methane flames. Combust Flame 2011;158:2428–40. doi:10.1016/j.combustflame.2011.05.014.
[43] Rahman KM, Kawahara N, Tsuboi K, Tomita E. Combustion characteristics of wet ethanol ignited using a focused Q-switched Nd:YAG nanosecond laser. Fuel 2015;165:331–40. doi:10.1016/j.fuel.2015.10.067.
[44] Zhao F, Lai M-C, Harrington D. Automotive spark-ignited direct-injection gasoline engines. Prog Energy Combust Sci 1999;25:437–562. doi:10.1016/S0360-1285(99)00004-0.
[45] Khattab IS, Bandarkar F, Fakhree MAA, Jouyban A. Density, viscosity, and surface tension of water+ethanol mixtures from 293 to 323K. Korean J Chem Eng 2012;29:812–7. doi:10.1007/s11814-011-0239-6.
123
45
678
91011
1213
141516
171819
2021
22
232425
2627
282930
313233
3435
363738
39

8. NOMENCLATURE
ICE Internal combustion engineBDC Bottom dead centreCAD Crank angle degreeCAI Controlled auto ignitionCO Carbon monoxideCO2 Carbon dioxideCOVimep Coefficient of variation of IMEPDI Direct Injectione Ethanol volumetric contentE100 Anhydrous EthanolEind Expended Energy in fuel productionEVC Exhaust Valve ClosureEVO Exhaust Valve OpeningExxWyy Mixture of xx% ethanol and yy% Water (v/v)FDA Flame Development AngleFID Flame Ionization DetectorFI D ppm Raw FID measurementFVVT Fully Variable Valve TrainGHG Green House Gases
GRON9595 RON United Kingdom standard unleaded gasoline
HCCI Homogeneous Charge Compression IgnitionHRR Heat Release RateIMEP Indicated Mean Effective Pressurein-Cyl T In-cylinder TemperatureISCO Indicated Specific CO emissionISga si Indicated Specific gas emissionISNOx Indicated Specific NOx emissionISTHC Indicated Specific THC emissionIVC Inlet Valve ClosureIVO Inlet Valve Openingk FID FID correction factork w Dry-to-wet correction factorLHV Lower Heating ValueMBT Minimum spark advance for best torqueMFB Mass Fraction BurnedNOpC Normalized Energy Engine Operational Cost
NEEPWENormalized Energy Expense in the Production of Wet Ethanol
NOx Nitrogen Oxides
1
2
3
4

NVO Negative valve overlapNWREE Normalized water removal energy expenseOH HydroxylP I Indicated powerPLIF Planar Laser FluorescencePRRm Maximum Pressure Rise RatePVO Positive Valve Overlapqexh Exhaust mass flow rateRCCI Reactivity-controlled compression ignitionRON Research Octane Numberrpm Revolution per minuteSI Spark IgnitionTDC Top dead centreTDCf Firing top dead centre
THCTotal Hydrocarbon (used in this work as a total unburned organic emission estimative)
THC❑ppm Corrected FID measurementUEGO Universal Exhaust Gas Oxygenui Raw gas exhaust factorv/v volume/volumeλ Excess of air factor – Lambda[ x i ] gas concentration in ppm
1