performance analysis of a water pumping system supplied...
TRANSCRIPT

Performance analysis of a water pumping system supplied by a photovoltaic generator with different MPPT techniques
Abstract—In this paper investigations are made with different maximum power point tracking (MPPT) techniques for a
photovoltaic generator (PVG). The PVG is used to supply an induction motor driving a centrifugal pump. Boost converter
and inverter are connected in between PVG and motor for power conditioning. Three MPPT techniques are designed and
compared. These techniques are incremental conductance (IC), constant voltage controlled (CVC) and fuzzy based
perturbation and observation (FPO). Rule Base of FPO is designed with nine rules only, so that it can be implemented on
limited memory and speed processors. System performance is analyzed with the help of developed simulation models. A
comparative study of these techniques is also summarized. The obtained simulation results indicate that FPO scheme yields
better performance.
Keywords- Constant voltage controller (CVC), Fuzzy logic, Incremental conductance (IC), induction motor, Perturbation
& Observation (PO), PV generator
1 Introduction
Despite of high generating cost, Photovoltaic (PV) energy generation has given lots of
attention and encouragement. This is due to its capability to accommodate the three major
challenges world is facing: deficit energy, depleting conventional sources and the
environmental concerns (Kuo and Liang, 2001). Use of PV power can also be economical,
particularly in areas where grid connected electricity is not readily available. Furthermore, as
the need of water and sun’s availability are interdependent so it becomes more suitable to use
PV power for water pumping applications in the remote areas ( Kun et al., 2012; Mekhilef et
al., 2013).
PV array captures the solar energy and converts into the useful form. However, low
conversion efficiency and extraction of maximum available power from PV array are two
major concerns. For first concern research is generally directed towards the engineering

materials. For second, the use of maximum power point tracking (MPPT) technique is
unavoidable due to nonlinear characteristic of PV array (Gao et al., 2013; Kuo et al., 2001).
In the literature different MPPT techniques have been discussed which can be broadly
categorized into: incremental conductance (IC) technique (Fangrui Liu et al., 2008; Safari
and Mekhilef, 2011) and perturb & observe (PO) technique (Femia et al., 2005; Sera et al.,
2013). It is reported that IC technique offers a good tracking capability, however the
implementation is more complex. The implementation of PO technique is much simpler, but
technique fails during rapid changing weather conditions. Now days, conventional PO
technique are used in conjunction with AI algorithms for their improvement. Fuzzy logic
(FL) due to its well known advantageous features is preferred among various AI techniques
for control applications (Benlarbi et al., 2004; Algazar et al., 2012).
In general, there is direct relation among the size of rule base and the performance of FL
based system. The increase in the size of a rule base can increase the complexity. In most of
the works on MPPT authors had used the reduced rule base of twenty five (25) rules in
comparison to the forty nine (49) rules (Messai et al., 2011; Kottas et al., 2006; Larbes et al.,
2009; Alajmi et al., 2011).
Elgendy et al., 2010 presented a Constant voltage controller (CVC) based MPPT
technique. The technique requires the measurement of the array voltage only and was easily
implementable with both analogue and digital circuits. The scheme offers better energy
utilization only at low cell temperatures. However, more sophisticated MPPT algorithms are
required to improve the performance at normal temperature and fast varying irradiance level.
The aim of this paper is to present a detailed analysis of a water pumping system powered
from a PV source. Extensive simulation study has been carried out by developing

MATLAB/Simulink model of the complete system. The system is assisted with MPPT
technique for maximum power extraction. In this paper, performance of PV based water
pumping system with proposed fuzzy based perturb & Observe (FPO) MPPT technique is
presented and compared with the IC and CVC techniques at varying weather conditions.
Figure 1 Schematic diagram for constant voltage controlled system
2 System Description and Modeling
The system under investigation consists of a PV array, power conditioning unit, induction
motor, and centrifugal pump. Simple but accurate model of PV array and centrifugal pump
are developed in order to simulate the complete system. All components are modeled
separately and then joined together. The Schematic diagram of the system under
investigation is shown in Figure 1.
2.1 PV Array
In order to meet the load requirements, number of PV modules are interconnected and called
as PV array. PV modules are formed by interconnecting the solar cell in series/parallel
combinations.
Figure 2 Equivalent circuit of solar cell
For describing the electrical behavior and of solar cell different mathematical models had
been reported in the literature. Perhaps, the simplest equivalent model is one diode model

shown in Figure 2. The output voltage of PV generator formed by such equivalent model can
be given as:
)ln( spvgr
pvgrscCpvg RI
IIII
qnkTV −⎟⎟
⎠
⎞⎜⎜⎝
⎛ −+= (1)
(1)
Where pvgV and pvgI are output voltage and currents of the PV generator respectively, sR is
cell resistance, scI is photocurrent or short circuit current, rI is reverse saturation current of
diode, q is electron charge, k is Boltzmann constant, rT is reference operating temperature of
cell and n is the ideality factor. The effect of variation in operating temperature due to the
variation in irradiance level is also incorporated.
2.2 Power Conditioning Unit
Figure 3 Boost Converter (a) switch is closed (b) switch if open
In this work, a two stage power conditioning unit is used. In the first stage a boost
converter shown in figure 3 is used to implement a MPPT scheme for PV generator. During
steady state operations, the input-output relationship of boost converter is given by:
DVV
in −=
110 (2)
In second stage, a three phase inverter is employed to convert the available DC into AC
for feeding the induction motor. The output is controlled by a PWM control circuit forcing
the voltage frequency ratio to remain constant.

2.3 Induction Motor
Several types of DC and AC motors are available for photovoltaic based water pumping
applications. Various factors such as size, reliability, availability and price are considered
during the selection of motor. Induction motors due to inherent advantages are preferred over
dc motors for water pumping application (Bhat et al., 1987). The dynamic equivalent circuit
of a three phase induction motor expressed in d-q synchronously rotating reference frame is
shown in Figure 4.
Figure 4 Dynamic equivalent circuits of machine
where, sR & rR are the stator and rotor resistances resp., lsL & lrL are the stator and rotor
leakage inductances respectively, mL is the mutual inductance, dsV & drV are the d-axis stator
and rotor voltages respectively, qsV & qrV are q-axis stator and rotor voltages resp., qsψ &
qrψ are the q-axis stator and rotor flux linkages resp., dsψ & drψ are the d-axis stator and rotor
flux linkages respectively.
The electromagnetic torque developed by an induction motor is given by:
)(22
3qrdsdrqsme IIIILPT −= (3)
(7)

The mechanical part modeling of an electric motor is given by:
Lmme TBJpT ++= ωω (4)
(8)
where J is the total inertia of motor shaft, B is the friction coefficient, and LT is the load
torque.
2.4 Centrifugal Pump
The selection of the size of pump is crucial as it represents the mechanical load of the
induction motor and it identifies the ratings of the other system components. For this work a
centrifugal pump of nominal power ( nP ) = 1.5 kW and nominal speed ( nω ) =145.5 rad/sec is
used.
A centrifugal pump load is generally modeled in the form of a load torque
requirement of a motor shaft. This load torque depends on the process requirements of head
to be overcome, flow rate requirement, and the operating speed. The torque speed
characteristic of the motor for a pump load can be given by:
2rPL KTT ω== (5)
Here K is defined in terms of nominal pump power nP and speed nω as:
3n
nPKω
=

3 MPPT techniques
All the three MPPT techniques namely: PO, IC and CVC are basically based on the same
concept of regulating the PV array’s voltage to follow an optimal set point, which represents
the voltage of maximum power operating point.
3.1 Incremental Conductance
For this work, IC based MPPT technique is designed on the conventional approach of
tracking the zero slope region ( 0/ =dVdP ) on the power curve.
Since VIVI
VdIVI
dVIVd
dVdP
ΔΔ
+≅+==)( (6)
For MPP tracking instantaneous conductance (I/V) and the incremental conductance (ΔI/ΔV)
are compared till the relationship (ΔI/ΔV) = - (I/V) is satisfied. A fixed gain PI controller is
employed to adjust the duty ratio of a boost converter.
3.2. Constant Voltage Controlled
This technique utilizes the fact that region of MPP for all the operating conditions for a PV
generator vary in a narrow band of voltage range. So, a fixed value for the MPP voltage
equal to 180 V is selected as the reference voltage in this work. This value is used as a set
point for the feedback control loop. Here also, a fixed gain PI controller is employed to
adjust the duty ratio of a boost converter.
3.3 Fuzzy based Perturbation & Observation (FPO)
In this work, FL controller is used instead of a conventional PI controller to adjust the duty
ratio. MPP locator is based on the PO technique of perturbing the array operating voltage. FL

controller is proposed to overcome the demerits such as initial tuning and detuning (with
change in operating conditions) of conventional PI controller. FL controller importantly
consists of three stages: fuzzification, rule base table lookup, and defuzzification. The inputs
of the FL controller are:
)1()()1()(
)(−−
−−=
kVkVkPkP
kEpvgpvg
pvgpvg (7)
)1()( −−=Δ kEkEE (8)
(11)
and the output control signal is given as:
)1()( −−=Δ kDkDD (9)
(12)
where )(kE is the error, )(kEΔ is the change in error, and DΔ is change in duty cycle of
boost converter.
Figure 5 used membership functions for inputs/output
The inputs/output of the FL controller is normalized using scaling factors chosen by trial
and error method. Scaling factors play an important role in fixing the optimization problem.
Trapezoidal and triangular shape membership functions for both inputs and output shown in

figure 5 are selected. The universe of discourse is divided into three fuzzy subsets functions:
NE (negative), ZE (zero) and PE (positive). Total nine rules are formulated and summarized
in the table 1. The output before being given to the boost converter is defuzzified using a
center of area method.
Table 1 Rule base for FPO
4 Results & Discussion
To study the steady state and transient performance of the system under investigation the
system is designed using equations (1)-(9) in the Simulink/MATLAB environment. The
results obtained after simulating the system in discrete mode with sampling frequency of 20
KHz under various operating conditions are discussed as follows:
4.1 PV Array Characteristics
The P-V and I-V characteristics of photovoltaic array are shown in Figure 6(a) and Figure
6(b) respectively for insolation level of 1000 W/m2, 800 W/m2, 600 W/m2, 400 W/m2 at
constant temperature of 20°C. The increase in insolation level from 400 W/m2 onwards
results into increase of both open circuit voltage and short circuit current. The corresponding
open circuit voltage, short circuit current and maximum power available is shown in table 2
for given insolation level.
Figure 6(a) P-V (b) I-V characteristic for different insolation level
Table 2 The open circuit voltage, short circuit current and maximum power for different insolation level
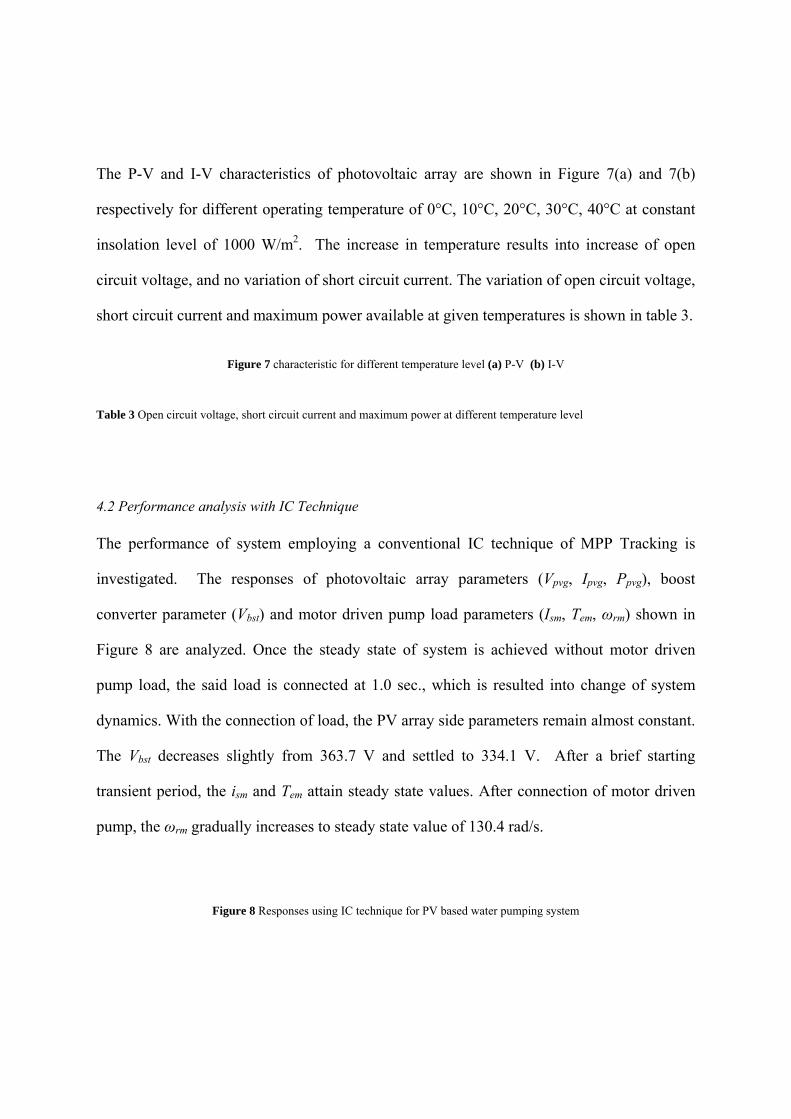
The P-V and I-V characteristics of photovoltaic array are shown in Figure 7(a) and 7(b)
respectively for different operating temperature of 0°C, 10°C, 20°C, 30°C, 40°C at constant
insolation level of 1000 W/m2. The increase in temperature results into increase of open
circuit voltage, and no variation of short circuit current. The variation of open circuit voltage,
short circuit current and maximum power available at given temperatures is shown in table 3.
Figure 7 characteristic for different temperature level (a) P-V (b) I-V
Table 3 Open circuit voltage, short circuit current and maximum power at different temperature level
4.2 Performance analysis with IC Technique
The performance of system employing a conventional IC technique of MPP Tracking is
investigated. The responses of photovoltaic array parameters (Vpvg, Ipvg, Ppvg), boost
converter parameter (Vbst) and motor driven pump load parameters (Ism, Tem, ωrm) shown in
Figure 8 are analyzed. Once the steady state of system is achieved without motor driven
pump load, the said load is connected at 1.0 sec., which is resulted into change of system
dynamics. With the connection of load, the PV array side parameters remain almost constant.
The Vbst decreases slightly from 363.7 V and settled to 334.1 V. After a brief starting
transient period, the ism and Tem attain steady state values. After connection of motor driven
pump, the ωrm gradually increases to steady state value of 130.4 rad/s.
Figure 8 Responses using IC technique for PV based water pumping system

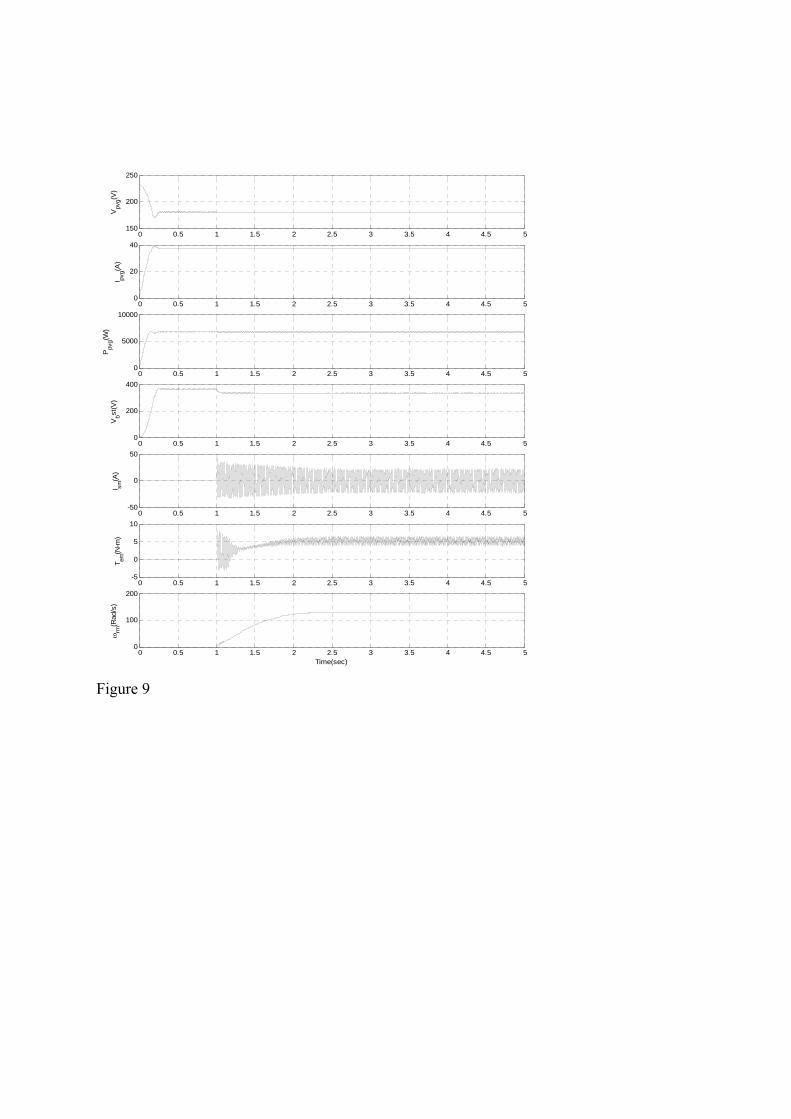
4.3 Performance analysis with CVC
Figure 9 shows the performance responses of PV based system employing a CVC for MPP
Tracking. The responses of Vpvg, Ipvg, Ppvg, Vbst, Ism, Tem, ωrm are obtained in time domain and
then analyzed. At starting, the induction motor is under no load condition and after attaining
steady state the pump load is connected at time t =1.0 sec to the motor. When the load is
connected, the PV array parameters remain almost constant and Vbst decreases slightly from
367.7 V and settled at 331.5 V. After a brief starting transient period, the ism and Tem attain
steady state values of 8.3 A and 5.1 N-m respectively. After connection of motor driven
pump, the ωrm gradually increases to steady state value of 129.5 rad/s.
Figure 9 Responses using CVC technique for PV based water pumping system
4.4 Performance analysis with FPO
Figure 10 shows the responses of system employing a FLC for MPP tracking. The responses
of Vpvg, Ipvg, Ppvg, Vbst, Ism, Tem, ωrm are obtained under constant temperature and insolation
level. The system under observation is brought from no load condition to loaded condition at
time t=1 sec by connecting a pump load. Under loaded condition, the PV array side
parameters are almost constant and Vbst decreases slightly from 363.6 V and settled to 330.9
V. After a brief starting transient period, the ism and Tem attain steady state values of 7.8 A
and 5.2 N-m respectively. After connection of motor driven pump, the ωrm gradually
increases to steady state value of 132.5 rad/sec.

Figure 10 Responses using FPO for PV based water pumping system
The responses obtained for analyzing the performance of the system under consideration with
three of MPPT techniques individually are summarized in table 4 for the comparative study.
It is evident that FPO based MPPT scheme has better performance
Table. 4
5 Conclusion
Detailed simulation analysis of a 3-phase induction motor driven water pumping system
sourced by a PV generator is presented. A minimal rule base FL controller for MPP tracking
is also designed. The performance of the system is obtained with three different MPPT
techniques namely: Incremental conductance, Fuzzy based Perturbation & Observation and
Constant voltage control. The performance of the FPO is found superior in comparison to
other two techniques.
References
Alajmi, B. N., Ahmed, K. H., Finney, S. J. and Williams, B.W. 2011. Fuzzy logic control
approach of a modified hill-climbing method for maximum power point in microgrid
standalone photovoltaic system. IEEE Trans. Power Electronics. 26(4), 1022-1030.
Altas, I. H., and Sharaf, A. M. 2008. A novel maximum power fuzzy logic controller for
photovoltaic solar energy systems. Renewable Energy. 33(3), 388-399.
Algazar, M M., AL-monier, H., Abd EL-halim, H., and Salem, M. 2012. Maximum power
point tracking using fuzzy logic control. International Journal of Electrical Power &
Energy Systems. 39(1), 21-28.

Benlarbi, K., Mokrani, L., and Nait-Said, M. 2004. A fuzzy global efficiency optimization of
a photovoltaic water pumping system. Solar Energy. 77(2), 203-16.
Bhat, S. R., Pittet, A., and Sonde, B. S. 1987. Performance Optimization of Induction Motor-
Pump System Using Photovoltaic Energy Source. IEEE Trans. Industrial Applications.
23(6), 995-1000.
Elgendy, M. A., Zahawi, B., and Atkinson, D. J. 2010. Comparison of Directly Connected
and Constant Voltage Controlled Photovoltaic Pumping Systems. IEEE Trans.
Sustainability Energy. 1(3), 184-192.
Femia, N., Petrone, G., Spagnuolo, G., and Vitelli. M. 2005. Optimization of perturb and
observe maximum power point tracking method. IEEE Trans. Power Electronics.
20(4), 963-973.
Gao, X., Li, S., and Gong, R. 2013. Maximum power point tracking control strategies with
variable weather parameters for photovoltaic generation systems. Solar Energy. 93,
357-367.
Kun, D., XinGao, B., HaiHao L., and Tao, P. 2012. A MATLAB-Simulink-Based PV
Module Model and Its Application Under Conditions of Nonuniform Irradiance. IEEE
Transactions on Energy Conversion. 27(4), 864 – 872.
Kuo, Y.C, and Liang, T. J. 2001. Novel maximum-power-point-tracking controller for
photovoltaic energy conversion system. IEEE Trans Industrial Electronics. 48(3), 594–
601.

Kottas, T. L., Boutalis, Y. S., and Karlis, A. D. 2006. New maximum power point tracker for
PV arrays using fuzzy controller in close cooperation with fuzzy cognitive networks.
IEEE Trans. Energy Conversion. 21(3), 793–803.
Liu, F., Duan, S., Liu, F., Liu, B., and Kang, Y. 2008. A Variable Step Size INC MPPT
Method for PV Systems. IEEE Trans. Industrial Electronics. 55(7), 2622-2628.
Larbes, C., Ait Cheikh, S. M., Obeidi, T., and Zerguerras, A. 2009. Genetic algorithms
optimized fuzzy logic control for the maximum power point tracking in photovoltaic
system. Renewable Energy. 34(10), 2093-2100.
Mekhilef, S., Faramarzi,S. Z., Saidur, R., and Salam, Z. 2013. The application of solar
technologies for sustainable development of agricultural sector. Renewable and
Sustainable Energy Reviews. 18, 583-594.
Messai, A., Mellit, A., Massi, P. A., Guessoum, A., and Mekki, H. 2011. FPGA-based
implementation of a fuzzy controller (MPPT) for photovoltaic module. Energy
Conversion Management. 52(7), 2695-2704.
Safari, A., and Mekhilef, S. 2011. Simulation and Hardware Implementation of Incremental
Conductance MPPT With Direct Control Method Using Cuk Converter. IEEE Trans.
Industrial Electronics. 58(4), 1154-1161.
Sera, D., Mathe, L., Kerekes, T., Spataru, S.V., and Teodorescu, R. 2013. On the Perturb-
and-Observe and Incremental Conductance MPPT Methods for PV Systems. IEEE
Journal of Photovoltaics. 3(3), 1070 – 1078.

Appendix A
Parameters of 3-phase Induction Motor:
3 HP, 4 pole, 220 V, 50 Hz, Stator Resistance ( sR ) = 0.435 Ω, Rotor Resistance ( rR ) = 0.816
Ω, Stator Inductance ( lsL ) = 2.0 mH, Rotor Inductance ( lrL ) = 2.0 mH, Mutual inductance
( mL ) = 69.3 mH, Inertia Constant ( J ) = 0.02 Kg-m2, Friction Factor ( F ) = 0.002 N-m-s

P VArray
I MPump
MPPT
BoostConverter
PWMInverter
Power conditioning unit
Figure 1
scI
sR
pvgV
rI
pvgI
Figure 2
inVoV
L
C
inVoV
L
C
(a) (b)
Figure 3
iqs
RsLls Llr Rr
Lm
_+ +_
ωeψdsψdr(ωe-ωr)
ψqs ψqr
Vqs Vqr
iqr
q - axis circuit

ids
RsLls Llr Rr
Lm
ωeψqsψqr(ωe-ωr)
ψds ψdr
Vds Vdr
idr_++_
d - axis circuit
Figure 4
1− 105.0− 5.0
ZENE PE
Membership function for inputs
1− 105.0− 5.0
ZENE PE
1.0− 1.0 Membership function for output
Figure 5
80 100 120 140 160 180 200 220 2400
2000
4000
6000
PV Output Voltage (V)
PV
Out
put P
ower
(W)
80 100 120 140 160 180 200 220 240
0
10
20
30
40
PV Output Voltage (V)
PV
Out
put C
urre
nt (A
)
(a) (b)
Figure 6

100 150 200 2500
2000
4000
6000
8000
PV Output Voltage (V)
PV
Out
put P
ower
(W)
100 150 200 250
0
10
20
30
40
PV Output Voltage (V)
PV
Out
put C
urre
nt (A
)
(a) (b)
Figure 7
0 0.5 1 1.5 2 2.5 3 3.5 4 4.5 5150
200
250
Vpv
g(V)
0 0.5 1 1.5 2 2.5 3 3.5 4 4.5 50
20
40
I pvg(A
)
0 0.5 1 1.5 2 2.5 3 3.5 4 4.5 50
5000
10000
Ppv
g(W)
0 0.5 1 1.5 2 2.5 3 3.5 4 4.5 50
200
400
Vbst
(V)
0 0.5 1 1.5 2 2.5 3 3.5 4 4.5 5-50
0
50
I sm(A
)
0 0.5 1 1.5 2 2.5 3 3.5 4 4.5 5-5
0
5
10
T em(N
-m)
0 0.5 1 1.5 2 2.5 3 3.5 4 4.5 50
100
200
ωrm
(Rad
/s)
Time(sec) Figure 8
0 0.5 1 1.5 2 2.5 3 3.5 4 4.5 5150
200
250
Vpv
g(V)
0 0.5 1 1.5 2 2.5 3 3.5 4 4.5 50
20
40
I pvg(A
)
0 0.5 1 1.5 2 2.5 3 3.5 4 4.5 50
5000
10000
Ppv
g(W)
0 0.5 1 1.5 2 2.5 3 3.5 4 4.5 50
200
400
Vbst
(V)
0 0.5 1 1.5 2 2.5 3 3.5 4 4.5 5-50
0
50
I sm(A
)
0 0.5 1 1.5 2 2.5 3 3.5 4 4.5 5-5
0
5
10
T em(N
-m)
0 0.5 1 1.5 2 2.5 3 3.5 4 4.5 50
100
200
ωrm
(Rad
/s)
Time(sec)
Figure 9

0 0.5 1 1.5 2 2.5 3 3.5 4 4.5 5180
200
220
240
Vpv
g(V)
0 0.5 1 1.5 2 2.5 3 3.5 4 4.5 50
20
40
I pvg(A
)
0 0.5 1 1.5 2 2.5 3 3.5 4 4.5 50
5000
10000
Ppv
g(W)
0 0.5 1 1.5 2 2.5 3 3.5 4 4.5 50
200
400
Vbst
(V)
0 0.5 1 1.5 2 2.5 3 3.5 4 4.5 5-50
0
50
I sm(A
)
0 0.5 1 1.5 2 2.5 3 3.5 4 4.5 5-5
0
5
10
T em(N
-m)
0 0.5 1 1.5 2 2.5 3 3.5 4 4.5 50
100
200
ωrm
(Rad
/s)
Time(sec) Figure 10

Table 1
)(kEΔ )(kE
NE ZE PENE ZE NE NE
ZE NE ZE PE
PE PE PE ZE
Table 2
Insolation level Max. Current Max. Voltage Max. Power
1000 40.15 233.9 6823
800 32.17 230.2 5351
600 24.19 225.3 3905
400 16.21 218.1 2498
Table 3
Temperature Level Max. Current Max. Voltage Max. Power
0 40.12 252.6 7359
10 40.13 243.2 7092
20 40.15 233.9 6823
30 40.16 224.5 6555
40 40.17 215.2 6286
Table 4 MPPT scheme
Instantaneous values (t = 0.8 sec)when motor is at rest
Instantaneous values ( t = 2.4 sec) when motor is running with load
Vpvg Ipvg Ppvg Vbst smI emT rmω Vpvg Ipvg Ppvg Vbst
smI emT rmω IC 186.1 36.6 6819 363.6 0 0 0 185.4 36.7 6816 330.9 -7.8 5.6 132.5CVC 181.2 37.4 6777 367.7 0 0 0 180.1 37.5 6763 331.5 -8.3 5.1 129.5FPO 187.8 36.4 6823 363.7 0 0 0 187.8 36.5 6823 334.1 -8.2 5.2 130.4