percentage of agricultural area under … · under productive and sustainable agriculture ....
TRANSCRIPT

SDG INDICATOR 2.4.1
PERCENTAGE OF AGRICULTURAL AREA
UNDER PRODUCTIVE AND SUSTAINABLE AGRICULTURE
Methodological concept note
Prepared for the FAO expert meeting Rome, Italy
April 3-5, 2017

2
Methodological concept note - SDG Indicator 2.4.1

3
Methodological concept note - SDG Indicator 2.4.1
Contents Contents .................................................................................................................................................... 3
1. Introduction ....................................................................................................................................... 5
Background to SDG indicators .............................................................................................................. 5
Target 2.4: Sustainable agriculture ....................................................................................................... 5
Process for developing an indicator for Target 2.4 ............................................................................... 6
Links to other SDG indicators ................................................................................................................ 6
2. The concept of sustainable agriculture ............................................................................................. 7
Sustainable development and sustainable agriculture ......................................................................... 7
Internal and external perspectives ....................................................................................................... 8
3. Approaches to measuring sustainable agriculture ............................................................................ 9
Broad approaches to measuring sustainability ..................................................................................... 9
Overview of steps involved in compiling a threshold based aggregate indicator ................................ 9
Potential tabulations of indicator 2.4.1 .............................................................................................. 10
4. Details on compilation steps ........................................................................................................... 10
Scale of sustainability assessment ...................................................................................................... 10
Measurement scope ........................................................................................................................... 11
Determining dimensions ..................................................................................................................... 13
Selecting themes ................................................................................................................................. 14
Choosing sub-indicators ...................................................................................................................... 15
Describing thresholds ......................................................................................................................... 17
Assessing farm level sustainability ...................................................................................................... 21
Assessing aggregate sustainability ...................................................................................................... 22
Annex 1: Sustainable Development Indicator Target 2.4: Methodological Note ................................... 24
Annex 2: Stylised reporting tables, potential structures ........................................................................ 26
Annex 3: Water use sub-indicator example ............................................................................................ 29
References .................................................................................................................................................. 31

4
Methodological concept note - SDG Indicator 2.4.1

5
Methodological concept note - SDG Indicator 2.4.1
Version 2.1, 22 March, 2017
1. Introduction
Background to SDG indicators In September 2015, the United Nations General Assembly adopted the 2030 Development Agenda and an associated 17 Sustainable Development Goals (SDGs). The resultant SDGs are accompanied by 169 target under the various goals and, at this time, work was ongoing to establish relevant indicators to both baseline and monitor progress toward the SDGs.
There is a high recognition of the importance of measurement and the relevance of data in supporting progress towards the SDGs. Responsibility for the development of indicators is given to the UN Statistical Commission which established an Inter-Agency Expert Group for SDG indicators (IAEG-SDG) comprising 28 member countries.
While the international system of official statistics is embodied in the UNSC and member countries, in practice the measurement and international reporting of the comprehensive set of SDG topics is co-ordinated through a range of international agencies. These agencies, including the OECD, WHO, FAO, IMF, World Bank, ILO, have developed statistical and measurement expertise in the particular areas that fall within their broader roles. FAO, for example, has led the development of international measurement in agriculture, forestry, fisheries, water, soil and related topics such as food security and rural livelihoods. Recognizing this, under the auspices of the IAEG-SDG, various agencies were given “custodianship” for the finalization of the appropriate indicators for the different SDG targets and for the co-ordination of data collection following endorsement of the indicators, including leading the co-ordination with other international agencies.
In light of FAO’s extensive history of data collection and development across a wide range of SDG relevant targets, it was given custodianship of 21 indicators across 6 SDGs. For more information see http://www.fao.org/sustainable-development-goals/tracking-progress/en/.
Among the large number of SDG indicators, some of the indicators are based on currently established methods and data (Tier I); others have methods but data collection is more limited (Tier II); and finally there are indicators for which agreed definitions and methods need to be developed (Tier III). The indicator for sustainable agriculture falls into this final Tier III category.
Target 2.4: Sustainable agriculture This document focuses on the indicator for Target 2.4 concerning sustainable food production systems. Target 2.4 is one of eight targets under Goal 2: End hunger; achieve food security and improved nutrition and promote sustainable agriculture. Specifically Target 2.4 is to:
“By 2030, ensure sustainable food production systems and implement resilient agricultural practices that increase productivity and production, that help maintain ecosystems, that strengthen capacity for adaptation to climate change, extreme weather, drought, flooding and other disasters and that progressively improve land and soil quality.”

6
Methodological concept note - SDG Indicator 2.4.1
Target 2.4 links closely to progress in relation to Target 2.3 on agricultural productivity and incomes of small-scale food producers and Target 2.5 on the maintenance of genetic diversity. Other targets under Goal 2 focus on the health outcomes of hunger and lack of food security (such as undernourishment and stunting) and on the economic structures surrounding food production (such as research and investment, markets and trade and price volatility).
Process for developing an indicator for Target 2.4 Led by FAO work progressed through 2015 to establish a suitable indicator for Target 2.4. The results of this process were encapsulated in a two page methodology note (see Annex 1) that was submitted by FAO to the IAEG-SDG and endorsed in March 2016. It defines the Indicator 2.4.1 as the:
Percentage of agricultural area under productive and sustainable agriculture
The methodology note describes, in broad terms, an approach to the measurement of this indicator of which the most challenging is the definition of productive and sustainable agriculture.
Through 2016 research continued with the main output a broad ranging literature review on approaches to the measurement of sustainable agriculture (Hayati, 2017). A key aspect of all approaches to measuring sustainable agriculture is agreement on the coverage of themes and sub-indicators within the indicator. To this end a technical meeting was convened in December 2016 involving a number of experts in sustainable agriculture to establish priority areas for measurement for indicator 2.4.1.
The results of this meeting have then been drawn together to draft this discussion paper aimed at supporting discussion at the Expert Group Meeting on indicator 2.4.1 to be held from 3-5 April, 2017. An earlier draft of this paper was presented to the February 2017 meeting of the Global Strategy’s Scientific Advisory Committee (SAC) and their feedback on the indicator has been incorporated in this paper.
The purpose of the expert meeting is to review the methodology developed in this paper and come to an agreement on the approach, the dimensions, themes and sub-indicators offered for discussion, as well as the modalities to construct indicator 2.4.1.
Links to other SDG indicators From a measurement perspective, the focus in Target 2.4 on sustainable food production has many conceptual connections to Target 14.7 concerning sustainable fisheries, aquaculture and tourism and Target 15.2 on sustainable forestry. In all of these cases, the measurement ambition involves assessing the sustainability of a specific activity. While different considerations will emerge for each activity, conceptually the framing of sustainability for measurement purposes should be relatively aligned. At this stage however, the types of indicator proposed for Targets 14.7 and 15.2 do not provide clear guidance towards the development of the indicator being considered under Target 2.4.

7
Methodological concept note - SDG Indicator 2.4.1
2. The concept of sustainable agriculture
Sustainable development and sustainable agriculture At the heart of the concept of sustainability is the notion of balance over the long term among a full range of aspects concerning human activity on Earth. Thus, while there are 17 distinct SDGs, they are, at the same time, seen as providing coverage for an integrated challenge. Meeting this challenge will require taking a systems-based perspective on how the different aspects combine.
Most commonly, sustainability is considered in the context of three dimensions – economic, environmental and social – but other dimensions may be considered such as resilience and governance. Depending on the location and circumstance any one of the dimensions may be in or out of balance such that the situation or activity is considered unsustainable. A discussion on the choice of dimensions for this indicator is in the following section.
While the issue of sustainability is not new, discussion of the concept at the international level was especially renewed at the 1992 Rio Summit on Sustainable Development which came in the wake of the release of the 1987 Brundtland Commission report. The discussion of sustainable development in international and national policy circles at that time was wide ranging and many sectors took it upon themselves to considerably extend discussion of sustainability at a sector level. Agriculture was no exception. The literature review (Hayati, 2017) highlights the broad range of approaches that have been developed.
The approaches to framing and defining sustainable agriculture vary in terms of their coverage of the three primary dimensions of sustainability, i.e. economic, environmental and social and in terms of the scale that they assess sustainability from field and farm levels, to national and global levels. Some approaches consider different features of sustainability, for example whether current practices are economic feasible, environmentally sound and socially desirable (to name but three of the options). Many approaches to considering sustainable agriculture focus on particular practices such as organic, regenerative or low-input agriculture and can equate these with sustainable agriculture.
The conclusion from the literature review is that the multi-dimensional approach developed by FAO in 1988 is a meaningful framing of the concept. Thus, sustainable agriculture can be considered as:
“The management and conservation of the natural resource base, and the orientation of technological and institutional change in such a manner as to ensure the attainment and continued satisfaction of human needs for present and future generation. Such development (in agriculture, forestry and fishing etc.) conserves land, water, plant and animal genetic resources, environmentally non-degrading, technically appropriate, economically viable and socially acceptable.” (FAO, 1988)
More recently, in 2014, the FAO built on these broad principles embodied in this definition of sustainable agriculture, to describe a vision for sustainable food and agriculture. Recognizing the current “unprecedented confluence of pressures” including poverty and hunger, inadequate diets, land and water scarcity, loss of biodiversity and the effects of climate change, the FAO described a vision based on five principles applicable across five sectors: crops, livestock, forestry, aquaculture and fisheries. The five principles (FAO, 2014) are:
• Improving efficiency in the use of resources is crucial to sustainable agriculture.
8
Methodological concept note - SDG Indicator 2.4.1
• Sustainability requires direct action to conserve, protect and enhance natural resources
• Agriculture that fails to protect and improve rural livelihoods, equity and social well-being is unsustainable
• Enhanced resilience of people, communities and ecosystems is key to sustainable agriculture
• Sustainable food and agriculture requires responsible and effective governance mechanisms.
Internal and external perspectives In consideration of the approaches to sustainable agriculture it is possible to discern an internal and an external perspective on sustainability. An internal perspective takes a view of sustainability that focuses on those economic, environmental and social aspects that might be considered more direct inputs, for example, to the sustainable production of crops. Put differently, an internal perspective might consider whether the farmer has sufficient economic, environmental and social resources to continue to operate well into the future.
An external perspective takes a view of sustainability that considers the sustainability of agricultural practices in a broader context, for example in terms of the off-farm environmental impacts of agricultural activities or societal perceptions on the use of traditional farming practices.
Internal and external perspectives on sustainability exist along a continuum but it is not difficult to imagine that, even within a generous framing of sustainable agriculture as supplied in the 1988 FAO definition above, there will be quite different considerations as to what should be the issues of primary focus within the economic, environmental and social dimensions.
The idea of internal and external perspectives on sustainability is particularly important when reaching a determination on whether a given situation (set of farming practices) is sustainable. As noted above, sustainability requires a balance to be found for the long term as well as ensuring that current economic, environmental and social outcomes are appropriate. How these requirements can be described will depend directly on whether the agricultural activities are being considered in some degree of isolation or within a broader, more dynamic social, economic and environmental context. For example, farming in a particular region might be considered sustainable - provided that there are no changes to the number of water users. The measurement of sustainability from a farm level perspective is therefore not simply a question of identifying a set of relevant themes. It should also take into consideration the changing internal and external circumstances faced by the farmer, as reflected in a set of thresholds.
At the extreme, a very complete external perspective, would potentially imply taking into consideration all of the SDGs in the context of sustainable agriculture, and thus recognizing that everything is linked to everything else. However, this step is well beyond the intention and capacity for conceptualization and measurement.
Given this, the measurement approach outlined here involves describing a suitable measurement boundary, beyond a purely internal view of agriculture but limited to certain specific external connections. Thus, the indicator should be able to be considered in the context of other SDG indicators in a relatively non-overlapping manner. For those looking to consider the sustainability of agriculture in very broad contexts, it will be relevant to use additional information and indicators.

9
Methodological concept note - SDG Indicator 2.4.1
3. Approaches to measuring sustainable agriculture
Broad approaches to measuring sustainability Given the array of conceptualizations of sustainable agriculture noted above and brought together in the literature review (ref), there is an associated array of measurement approaches. To navigate the different approaches the following terminology is applied:
• Indicator: Overall measure of sustainable agriculture • Dimension: Broad areas encompassed by the indicator (e.g. economic, environmental,
social) • Themes: Specific areas within a dimension (e.g. productivity, water quality, poverty) • Sub-indicators: Measures of a theme
The approaches to measuring sustainable agriculture can be characterized into two groups that may be applied at both small scale (field and farm levels) and large scale (national and global levels). The first is establishing indicator sets or “dashboards” covering a number of dimensions and themes within a given definition of sustainable agriculture. This approach does not involve making an explicit, “bottom-line” estimate of sustainability but rather brings together relevant information to aid in the assessment process.
The second approach is to establish a single indicator of sustainability. From a measurement perspective, and as will be discussed further in this document, there is currently no single conceptual framing of sustainability that provides a means to provide an aggregate measure of sustainability that takes into account the variety of dimensions and themes. Thus, in order to establish a single indicator it is necessary to weight together data on the selected dimensions and themes in some way. This is commonly referred to as a composite index. One concern about composite indexes is that the overall movement of the indicator will reflect both positive and negative movements in the various sub-indicators. Potentially then, one large positive movement might offset a series of smaller negative movements and hence the composite indicator result may provide misleading signals.
The proposal explained in this paper involves establishing a dashboard of sub-indicators for selected themes, assessing sustainability in the context of each theme/sub-indicator with reference to an external threshold, and then an overall measure of sustainability is determined on the basis of these individual theme based assessments. This approach is referred to here as a threshold based aggregate indicator and is described in detail through this paper.
In developing this indicator it will be necessary to gather a range of data across multiple dimensions and themes. As a result, a useful database covering key issues in sustainable agriculture will be established. Thus, aside from consideration of changes in a single aggregate indicator, it is also considered important that the indicator compilation process enables analysis of individual themes and the development and assessment of policy at this level of detail.
Overview of steps involved in compiling a threshold based aggregate indicator Compiling a threshold based aggregate indicator involves a number of steps. This short overview provides a structure for the remainder of the paper.
1. Choosing the scale for sustainability assessment: The choice made for indicator 2.4.1 is farm level with aggregation to higher levels.

10
Methodological concept note - SDG Indicator 2.4.1
2. Determining the scope of activities: The choice made for indicator 2.4.1 is to focus on crops and livestock production thus excluding forestry, fisheries and aquaculture. Other issues concerning the measurement scope for the indicator also need to be considered, e.g. the treatment of subsistence agriculture.
3. Determining coverage of dimensions: The choice made for indicator 2.4.1 is to include environmental, economic and social dimensions in the sustainability assessment.
4. Selecting the themes within each dimension: The ambition is to include a total of around 10 themes across the three dimensions.
5. Choosing a sub-indicator for each theme: The aim here is to identify sub-indicators that fulfill a number of criteria (e.g. measurability) and which are focused on the measurement of outcomes rather then measurement of agricultural practices or farmers’ perceptions.
6. Describing a sustainability threshold for each sub-indicator: A range of considerations is relevant in describing thresholds and different approaches will need to be applied for different sub-indicators.
7. Assessing sustainability at farm level: The intention here is for sustainability of the farm to be determined when a farm is considered sustainable against each of the sub-indicators.
8. Deriving aggregate measures of sustainability: Based on farm level assessments, results for regional and national levels can be derived using appropriate weighting factors.
Although these steps are presented in a linear fashion, in practice a degree of iteration will be required through processes of discussion and investigation. This is especially the case for steps 5 and 6 in which the description of the relevant threshold will depend on the sub-indicator, but by the same token, the choice of sub-indicator will likely be closely informed by the relevant threshold and the associated interpretation of sustainability that is implied.
Potential tabulations of indicator 2.4.1 Before examining each of these steps in more detail, it is important to recall that the broad intention in constructing this indicator is to provide information to support policy discussion and implementation. There is always a risk in discussion of an indicator of this nature that the focus becomes solely on the detail of the various sub-indicators and the larger picture is lost. Annex 2 provides a set of five tables intended to give an initial indication of the type of reporting level information that could be generated using the measurement approach described in this paper. The stylized tables in the annex have been prepared assuming that there are three countries (A, B and C) and 10 themes/sub-indicators across the economic, environmental and social dimensions. The figures are purely indicative and not reflective of any specific country.
4. Details on compilation steps
Scale of sustainability assessment In terms of scale, the ultimate ambition for SDG measurement is to provide an indicator that gives a national result but which also can be disaggregated to provide information of direct relevance for

11
Methodological concept note - SDG Indicator 2.4.1
policy development and monitoring. In this context, an important question is the spatial level at which sustainability should be assessed, or put differently, the level at which the balance between the dimensions of sustainability should be assessed. The conclusion reached in the context of indicator 2.4.1 is that this balance should be primarily assessed at the farm level. The development of a national level indicator for SDG reporting purposes is then a matter of aggregation. The choice to use a farm level scale for assessing sustainability aligns best to a more internal perspective on sustainability as discussed in the previous section.
On balance, the alternatives of using a landscape scale or broader national level scales for assessing sustainability have not been used as they will tend to imply the use of averages for comparison between agricultural activities in different regions that may face quite different circumstances – for example concerning water scarcity, soil type and access to markets. A focus at a farm level, at least conceptually, allows these and other differences to be taken into account.
Measurement scope
The scope of agricultural activities The measurement scope of the indicator concerns the types of farms and the types of agricultural production that are to be included in the indicator. Of the five agricultural sectors, it has been agreed that for the purposes of indicator 2.4.1 the focus should be on crops and livestock. Thus, the sectors of forestry, aquaculture and fisheries are excluded. It is noted that the measurement of sustainable fisheries and sustainable forestry will be captured in some way through measurement of SDG 14 and 15. The sustainability of aquaculture activities is not captured elsewhere.
This choice is most consistent with the intended use of a country’s agricultural area as the denominator of the sustainability indicator. Agricultural area is defined as arable land plus permanent crops plus permanent meadows and pastures. The assessment of sustainable agriculture is thus constrained to assessing the production of crops and livestock that takes place within a country’s defined agricultural area.
While this provides an initial framing for analytical purposes it is not sufficient for statistical purposes. The following points explain proposed treatment in relation specific measurement boundary issues. The explanation of these boundary issues is important in being able to appropriately interpret the results.
• Agro-forestry systems are within scope.
• On-farm aquaculture, including rice-fish systems. Rice-fish and similar systems should be included. Aquaculture will generally be excluded but to the extent that some aquaculture is considered to take place within the agricultural area then some fish production would be in scope.
• Food harvested from the wild. In some countries and for some population groups this might be an important source of nutrition. However, since it is likely that these food sources will be sourced from outside of agricultural areas then the sustainability of such activity will not be within scope of the indicator.
• Subsistence agriculture. This should be included in the indicator. It is likely that a range of production of crops and livestock within agricultural areas will be subsistence in nature – i.e., the production is consumed by the producer’s household. A key challenge for

12
Methodological concept note - SDG Indicator 2.4.1
measurement will be estimation of the volume of production although this production is often conceptually within scope of agricultural surveys and also within scope of standard production measures of the national accounts.
• Non-food crops and livestock. Crops such as tobacco, and livestock raised for non-food products (e.g. sheep for wool), may be significant in some countries and under the proposed scope would be included in the assessment of sustainable agriculture.
• Crops grown for fodder or for energy purposes. Many crops that may be grown for food are in fact grown for non-food purposes – maize is perhaps the best example. To the extent that increasing areas of land are being used to grow crops for non-food purposes the interpretation of sustainability with respect to SDG 2 on ending hunger in relation to this production might need to be assessed differently. A related question is the appropriate treatment of fodder crops grown to support livestock production – the production of both fodder and livestock is within scope of the indicator at present even though one is an input to the other. All of these crops, for whatever purpose, are included in the indicator.
• Intensive production. On the whole, the framing of the indicator considers production processes that are more extensive in nature such that production can be clearly related to the area of land under cultivation or grazing. Production of crops and livestock using intensive means including in feedlots, greenhouses, etc. changes the nature of the relationship between production and land area. In some case, intensive but small scale farming systems have been practiced traditionally but the issue here relates to large scale intensive production of, for example, beef and chicken. Both intensive and extensive production of agricultural outputs is included in the indicator.
• Common lands. These are lands that are jointly used by farmers, particularly for livestock. The agricultural products from these lands and the associated agricultural areas should be within the scope of the indicator although attribution of some information to generate farm level indicators may be challenging.
• Production from gardens and backyards. This production, which is conceptually within scope of aggregate food production, will be excluded from the indicator as this production is not considered to take place within agricultural areas.
• Production from hobby and similar farms. Production from these farms will be in scope of the indicator since these farms will generally be included in scope of a country’s agricultural area.
• Non-farm income. In many cases a proportion of the income earned by a farming household will arise from non-farm activities. This may include through labour supplied to other farmers but may also represent employment of family members in other industries or the earning of income on-farm but through the production of non-agricultural products, e.g. via tourism related activities. The indicator will aim to include only that income attributable to the production of agricultural products on the farm to ensure a focus on the sustainability of the farming operations as distinct from the broader question of the sustainability of rural livelihoods.
Some of these issues are likely to be at the margins in terms of assessing overall sustainability in agriculture. Others may well be significant in some circumstances. Careful consideration of the desired treatment is required to ensure that the measurement is appropriately targeted.

13
Methodological concept note - SDG Indicator 2.4.1
Overall, the challenge posed in the measurement of this indicator is coping with the sheer diversity of agricultural outputs. It may be considered that, on the whole, the issues raised above do not substantially affect the likely messages to emerge from the aggregate indicator. This may be true however since the intention is to construct the indicator from farm level, the characteristics of the farm will be of direct relevance in the assessment of sustainability and the diversity of farming situations may mean that subsequent aggregation is more difficult.
Other scoping issues Beyond defining the measurement boundary for agricultural production the following additional considerations are noted.
First, the scope of assessment does not extend to the sustainability of the transportation, storage, and retailing of agricultural products although it is accepted that the efficiency and effectiveness of the delivery of these services may be significant in assuring the provision of food. Of particular relevance here is the issue of food waste, which, for varying reasons depending on the country, is likely a very significant issue in the assessment of sustainable provision of food.
Second, the proposed approach does not take into consideration directly the sustainability of supply chains that provide inputs to agricultural production. For example, the general concerns about the availability of phosphorous as a key element in fertilizers, will not be captured except to the extent that reductions in availability increase the price of fertilizers and hence reduce profitability at farm level. Note though that, in this specific case, the decline in soil productivity at farm level due to a lack of phosphorous will be within scope of the sub-indicators.
Third, a final consideration is the way in which production for export is interpreted. In the framing of the indicator there is an implicit assumption that sustainable agriculture in a country would imply sustainable provision of nutrition in that same country. However, given the extent of agricultural trade this connection between local production and local consumption may not be the case. It might be possible to constrain the indicator, for example by considering only that agricultural production that was domestically consumed but this is highly unlikely to be tractable. Explanation and interpretation of the indicator at national level will therefore need to be carefully considered since it is unlikely to be the case that the most sustainable situation requires self-sufficiency at national level.
Determining dimensions In terms of process it is important to distinguish between the selection of dimensions (e.g. economic), themes (e.g. employment) and the sub-indicators that are used to reflect them in the overall measure or indicator set (e.g. number of jobs or hours worked). Given the lack of a single conceptual framing for measurement, the process of selecting dimensions and themes is essentially one of individual rationalization or participatory approaches building on relevant experience, literature and discussion. Since the outcomes of these approaches are not likely to generate the same conclusions (e.g. different groups of experts will reach different conclusions), even in cases where the focus of measurement is the same, there are no standard or widely adopted sets of dimensions and themes for the measurement of sustainable agriculture.
At the same time, there are some dimensions that are more readily identified in the literature. The clear trend in measurement of sustainability is for coverage of all primary dimensions, i.e. economic, environmental and social.

14
Methodological concept note - SDG Indicator 2.4.1
In recent years, other broad aspects associated with sustainability have been considered as additional dimensions, notably resilience and governance. For this indicator, governance is considered to be a means by which sustainability is secured and is not considered part of the assessment of sustainability itself.
The concept of resilience is considered important and aspects of resilience will be captured through measurement of the changing quality and condition of economic, environmental and social capitals that underpin the delivery of sustainable outcomes. More generally, it is clear that in many ways resilience and sustainability are related rather than dependent concepts and hence using measures of resilience to help form an assessment of sustainability is inappropriate.
Selecting themes In terms of themes, the outcomes can be quite diverse depending on the number of themes considered appropriate to encapsulate the concept of sustainable agriculture being considered. In a number of examples more than 30 themes are measured. The targeted number of themes for indicator 2.4.1 is 10 across the three dimensions.
The literature review identified a broad range of potential themes for inclusion and for each theme usually a number of different sub-indicators can be considered. Based on expert engagement the themes shown in Table 1 have been proposed and investigated in more depth. Of these, there are 11 that have been noted as preferred based on discussion within the FAO. Further discussion of the choices and the precise number of themes to be included will be an area for discussion at the expert meeting.
One consideration in this discussion will be measurability. In this regard a possible approach is to identify a limited set of “core” themes for which measurement is expected in all countries and a broader set of themes for which measurement might only be undertaken in a sub-set of countries.
Concerning the themes in Table 1, there is a balance across economic, environmental and social themes noting that there is somewhat additional emphasis on economic and environmental factors recognizing (i) that the assessment of sustainability is taking place at farm level, (ii) that the negotiated focus of target 2.4 emphasizes economic and environmental sustainability and (iii) that this indicator must be seen in the context of other SDG indicators that cover the full range of economic, environmental and social themes.
Other themes considered in the discussion to this point have included nutrient balances and impacts (N and P), gender, contamination of food products, access to finance and markets, and farm household quality of life.

15
Methodological concept note - SDG Indicator 2.4.1
Table 1: Proposed themes Themes Preferred
Economic Labour productivity X Land productivity X Farm income / profitability X Environmental Soil X Water use X Water quality X Land-use change Biodiversity Energy use GHG emissions X Social Decent work X Household poverty X Household/farm resilience X
Choosing sub-indicators
General observations Choosing indicators is a distinct step in the process. For any given theme there may be multiple sub-indicators that are relevant and/or possible. Consequently, it is common for those establishing a set of indicators to posit requirements for indicator selection and while differently worded there are some generally sound principles that are utilized. The five key principles to be considered in choosing sub-indicators for indicator 2.4.1 are:
• Policy relevance • Universality • Comparability • Measurability • Cost effectiveness
In practice, the selection of indicators will be partly based on principle and partly based on the likelihood of data availability in a given country and context.
Sub-indicators may be of three broad types. They may be:
• Impact / outcome indicators that record what the state or change in state of environmental, economic and social factors and associated flows of benefits or costs.
• Practice indicators that record the type of agricultural practices and processes that a farm is undertaking
• Perception indicators that record views of various stakeholders about different aspects of sustainability.

16
Methodological concept note - SDG Indicator 2.4.1
For the purposes of SDG reporting and consistent application across countries it is considered that impact/outcome indicators should be the focus of measurement, noting that practice indicators may be useful in certain situations. Perception indicators are not considered to be amenable to broad scale measurement and aggregation.
Proposed sub-indicators The proposed sub-indicators are listed in Table 2 below for each theme. They are described in detail in individual templates provided in three supporting documents covering, respectively economic sub-indicators, environmental sub-indicators and social sub-indicators. The templates provide descriptions of the relevance, definition, data and measurement issues, and considerations with respect to thresholds.
Table 2: Proposed sub-indicators Themes Sub-indicators
Economic Labour productivity Farm volume of ag. production / Hours worked Land productivity Farm volume of ag. production / Farm area (ha) Farm profitability Net farm income Environmental Soil Rates of soil erosion (tonnes /ha) Soil organic carbon (tonnes /ha) Water use Water abstraction for agriculture from surface and groundwater as a
percentage of available water Water quality Fertilizer and pesticide use in excess Land-use change Impact of agricultural expansion Biodiversity Conservation area as a proportion of total farm area Energy use Final energy use / Farm volume of ag. production (joules/tonne) GHG emissions GHG emissions (tonnes CO2 eq.) / Farm output volume Social Decent work Working poverty rate for employed in agriculture Household income &
poverty Rural poverty headcount ratio at national poverty lines
Household/farm resilience <<to be determined>>
Data collection and reporting As discussed above, the intention is to measure all of the relevant sub-indicators at farm level. Perhaps ideally, all of the required information would be collected through a single data collection vehicle, a farm survey. In practice this will not be possible but, as far as possible, the collection of data via farm surveys is to be encouraged.
Other data sources to be considered, including for assessing data coherence and accuracy, include:
• general agricultural statistics (e.g. agricultural census, commodity specific production and price data)
• administrative data (e.g. taxation or land related datasets) • remote sensing, other geo-spatial data sources and associated modeling • household and labour force surveys.

17
Methodological concept note - SDG Indicator 2.4.1
The precise mix of data sources will depend on the final choices for sub-indicators and will also vary by country depending on the precise scope and design of different collections, the availability of administrative data and other considerations. As far as possible existing data collection approaches should be used or enhanced to provide the required information.
Where farm level data sources are not available, it will be necessary to consider how national level data sets might be appropriately attributed to farm level. The potential to develop measures and methods at a national level that can underpin farm level measurements will be considered in the development of the metadata surrounding each sub-indicator. This may lead to the development of a tiered approach to measurement in which data collection is progressively improved towards best practice.
The intention is for reporting on each of the sub-indicators described here to be undertaken by each country on a regular basis, ideally annually but since trends in some sub-indicators may change relatively slowly over time, reporting every 2 years may be more appropriate and provide information that is fit for purpose. While collection and compilation of individual sub-indicators may be staggered, it is recommended that overall measures of sustainable agriculture be derived each year with appropriate assumptions made concerning the estimates of those sub-indicators for which data have not been collected in a specific year.
In terms of initial implementation, an important consideration will be the need to provide a baseline or benchmark estimate of sustainability and for this purpose data for all sub-indicators should be estimated for a reference year for each country. Beyond the testing required to further refine the indicator described in this document, a suggested approach is for countries to use the relevant year for the current 2020 round of the World Census of Agriculture for all sub-indicators as this provides an excellent opportunity to establish comprehensive farm level information.
Describing thresholds
Introduction, terminology, and general considerations In the context of indicators generally, and agricultural and sustainability related indicators specifically, there are a number of terms associated with the use of indicator thresholds, such as reference values, benchmarks, cutoff points, targets, and baseline values (Acosta-Alba et al, 2011; Binder et al, 2010; OECD, 2008; Srebotnjak et al, 2010). For the purposes of developing SDG Indicator 2.4.1, the general term “threshold” is used to refer to the cutoff point for sub-indicator specific reference values, above or below which (depending on the sub-indicator) a given theme/system is considered “sustainable” or “unsustainable”. The discussion here is intended to provide a basis for discussion of thresholds for the various themes and sub-indicators as presented above.
The choice of a specific threshold value (i.e., cutoff point) is, in most cases, necessarily based on reference or baseline values. For most types or distributions of underlying reference values (e.g. binary, ordinal, discrete, continuous), the established threshold will serve as a dichotomous cutoff point between sustainable and unsustainable indicator values. Depending on the specific sub-indicator, the sustainability region may be above or below the threshold value, and there may also be cases where the sustainability region falls within, or outside of, value boundaries. A number of hypothetical examples are provided in Figure 1.

18
Methodological concept note - SDG Indicator 2.4.1
Figure 1: Shaded areas represent sustainability thresholds/regions for hypothetical indicator values
For SDG 2.4.1 specifically, thresholds are the cut-off points established based on the metrics used for each sub-indicator, above or below which point the situation for a given “theme” is to be considered sustainable. In addition to serving as a cutoff point, the thresholds for most sub-indicators will also provide a measure of how far above (i.e., the sustainability buffer) or below (i.e., the sustainability shortfall) a given farm/region/country is from the cut-off point – see Figure 2. Thus, many of the sub-indicator thresholds may be used to provide an assessment of sustainability as well as to monitor and compare progress towards (or away from) sustainability goals within and across farms/regions/countries.
Figure 2: Sustainability shortfalls and buffers for hypothetical indicator values
Accounting for and incorporating uncertainty Another key factor related to the use of thresholds in this context is that of uncertainty. Uncertainty may be present due to limited and/or poor quality data underlying the reference values, biases inherent in the processes used to select a specific threshold value, or due to poor sampling designs and/or underpowered samples (an issue of particular note with regard to the use of farm survey data to estimate variables which may not have been sufficiently accounted for in the original study/sampling design).
Consequently, some effort should be made to identify, estimate, and represent the degree of uncertainty around specified threshold values. In light of the expected variation in data availability and quality across countries, this need not be done by attempting to calculate 95% confidence

19
Methodological concept note - SDG Indicator 2.4.1
intervals in all cases; rather, a more flexible approach would likely be appropriate (e.g., IHME’s use of “uncertainty intervals” (Murray et al, 2012).
Incorporating uncertainty into the sustainability thresholds would have an added benefit of providing a built-in safeguard of sorts which could help ensure that farms on the borderline of sustainability would not inadvertently fall back into unsustainable states as a result of relatively minor shocks. For example, by comparing the first two hypothetical situations outlined in Figure 2 with the same situations after uncertainty is incorporated, as shown in Figure 3, one can see that for those currently operating in an unsustainable fashion, the distance to the threshold increases once an uncertainty level is added. For those above the sustainability threshold, with uncertainty incorporated the “sustainability buffer” decreases, meaning the risk of falling into unsustainable practices is greater than initially assumed. Depending on the degree of uncertainty, it may even be the case that values once assumed to be sustainable may not be (as shown in the right-most image in Figure 3).
Figure 3: The impact of uncertainty on sustainability shortfalls and buffers for hypothetical indicator values
Given these considerations, clearly defined values and reference conditions/criteria are needed to demarcate sustainability, incorporate an estimate of uncertainty, and to provide a mechanism to help policy makers better understand what may be needed to move closer to (or further above) specific thresholds. With this in mind, and in the interests of transparency generally, it is important therefore to document the rationale and methods used to establish thresholds and their accompanying reference values, as well as any associated conditions, qualifications, and contingencies used for periodic adjustments or to inform uncertainty estimates.
Types of thresholds and associated considerations There is no widely agreed upon classification system for indicators thresholds. The classification and types of thresholds provided in Table 3 represent the primary methods and options to be considered for developing sub-indicator specific thresholds. Depending on the sub-indicator in question, however, some of these approaches may not be suitable, and most will have a variety of associated pros and cons. Consequently, there is no universally established method for determining which threshold approach is most appropriate for any given sub-indicator, and associated decisions are

20
Methodological concept note - SDG Indicator 2.4.1
often primarily a function of the metrics under consideration and the availability, and quality, of the underlying data.
Table 3: Threshold type/method classification
Threshold values are …and based on Notes
Pred
efin
ed
Primarily science based
A target value Preferred condition/s or situation which is in turn based
on evidence-based criteria
A system critical or limit value
Based on an estimated tipping point (or set distance to a tipping point) derived from empirical data and/or models
Primarily policy based
The precautionary principle
Based on often uncertain science and a risk-averse and/or long-term policy planning perspective
Socio-political considerations
Determined based on political pressures, societal expectations, assumed feasibility, costs, etc.
Mixed science & policy based Established regulatory
standards Such as national water quality standards or standards
based on international agreements and protocols
Rela
tive*
Absolute or universal comparisons
The current situation Many approaches, including ranking and min-max
Historical trends Distance or deviation from, or degree of variability around,
a trend-derived measure of central tendency
Location specific comparisons
The current situation Many approaches, including min-max
Historical trends Distance or deviation from, or degree of variability around,
a trend-derived measure of central tendency
Notes: The structure and content for this classification table was adapted from Acosta-Alba et al. (2011) and Binder et al. (2010) and then revised and expanded upon by the author.
With those considerations in mind, for many sub-indicators certain threshold approaches will be more aligned with the available data and overarching measurement objectives than others. As shown in Table 3, a useful initial distinction is whether the threshold value is a predefined normative one, or whether it is determined relative to a range of contemporary data/values, or relative to historical trends. For thresholds based on relative comparisons, issues of spatial scale should also be considered. For example, are farms to be compared with each other in one region, one country, or based on some sort of agricultural typology? And should the comparison be based on the most recent calendar year trends, or a three or five-year average trend?
Similarly, for some sub-indicators, universal thresholds may be appropriate, whereas for others regional and/or agricultural-typology-based thresholds will be more suitable. For the latter, it may be that in some instances there is sufficient reason for establishing country-specific baselines so that future measurements and thresholds are determined relative to existing conditions and/or past

21
Methodological concept note - SDG Indicator 2.4.1
“performance”. As mentioned above, such considerations are in turn largely a function of the data needed to establish thresholds which is, of course, a function of what data is available or can reasonably be collected.
For trend-based environmental thresholds, flexibility is often needed to make adjustments in response to climatic variations and/or in response to time-bound natural shocks, such as floods and droughts. For trend-based economic thresholds, flexibility is also needed in order to adjust baseline values in response to national, regional, and/or global economic shocks, or to fluctuations in agricultural product demand and supply. As discussed above, the variability associated with such fluctuations can be incorporated into estimates of threshold uncertainty.
On this note, just as environmental thresholds will likely need to be adjusted in accordance with climatic shifts and natural shocks, so too the uncertainty estimates for a given sub-indicator and threshold value may also fluctuate temporally, and will likewise require periodic adjustment. In this context, it may be the case that for some sub-indicators, the degree of estimated uncertainty may increase such that values which were previously considered sustainable may now fall within the expanded area of uncertainty (as displayed in the right-most example in Figure 3). These sorts of considerations ought to be discussed when determining which types of data to use for reference values and how to decide upon a specific threshold value and estimate associated uncertainty.
In order to provide further context for the discussion of thresholds, Annex 3 discusses the development of thresholds for sub-indicators of water use.
Assessing farm level sustainability Assuming information is available at a farm level, assessment of sustainability involves comparing the actual outcomes measured for each theme through the relevant sub-indicator with the appropriate threshold as discussed in the previous section. Through this comparison an assessment can be made as to whether the target farm is sustainable or unsustainable with respect to that theme.
The overall assessment of farm sustainability requires that the farm is considered sustainable for all of the themes being assessed. This logic can also be applied at the level of an individual dimension, e.g. economic sustainability is measured when all of the economic themes are assessed as sustainable.
An important consideration in assessing sustainability is the time period over which the assessment should be made. Thus, it is unlikely to be the case that an assessment can be made based on information at a specific point in time, rather it is likely to be assessment of outcomes over recent periods that will be needed to offset the possibility that the current period is unusual and not part of an overall pattern. Some of this extended assessment requirement will be embedded in the selection of a suitable threshold but it is also likely to be required in the data on sub-indicators.
In order to build towards the aggregate indicator, it is important to recall that the indicator’s focus is on the share of the total agricultural area. While the process of aggregation is considered in the following step below, it is relevant to note that if a farm is assessed as sustainable then all of the agricultural area (in hectares) of that farm is considered sustainable.

22
Methodological concept note - SDG Indicator 2.4.1
It may be considered that the requirement that all themes be assessed as sustainable is too high a barrier. However, recalling the proposed tabulations from section 3, it is also clear that the potential to analyse the results at a disaggregated level, by dimension and theme gives sufficient potential to move beyond a binary assessment and to focus on particular issues and potential policy responses.
The requirement for all themes to be sustainable also works actively against the idea that a suitable outcome is progress against a simple majority of themes – a “two out of three isn’t bad” rationale. Such a mindset has plagued progress in sustainable development and has not encouraged or forced a focus on all themes across all dimensions that is essential for substantive progress to take place.
Assessing aggregate sustainability If all farms within a country were able to be assessed following the process just described, and these farms encompassed all of the agricultural area of the country, then the aggregate indicator would be formed by simply summing the area of farms considered sustainable.
In all likelihood, only a small sub-set of farms will be assessed. Since the primary data instrument is intended to be farm surveys, the size of the sub-set will be determined by the design of the farm survey within a country and the associated resources allocated for data collection. A general rule of thumb is that a farm survey might cover around 1% of farms within a country.
Using standard statistical sampling practice, aggregated results for a country would be formed by weighting together the sampled farms taking into account the formation of different strata using information on, for example, farm size, location (e.g. in terms of water catchment and soil type), type of output (crops, livestock, horticulture, etc.) and farm operation (e.g. household, commercial scale).
In forming the aggregate measures and ensuring complete coverage, an important aspect will be determining the total agricultural area of a country since this provides both the denominator and the conceptual scope for the sustainability assessment. Two practical points that will need to be considered here are
• determining the extent to which the coverage and design of the farm survey encompasses the entire agricultural area
• determining the extent to which the total area of land under the management of farmers (the farm holding) is different from the associated agricultural areas. Differences will emerge due to, for example, conservation areas on farm holdings.
Also related to the farm survey design, it will be necessary to understand whether cut-offs are used in establishing the frame for the collection. For example, some farm surveys limit their coverage to farms with a value of operations above a certain monetary threshold. This would tend to exclude smaller and subsistence farms whose contribution to total agricultural area and overall sustainability may be very important in some countries. Overall, have a clear understanding of the coverage of farm surveys will be an important aspect in ensuring the meaningfulness of the aggregate results.

23
Methodological concept note - SDG Indicator 2.4.1
5. Next steps
Following the Expert Group Meeting it is intended to revise this paper and prepare documentation for submission to the next IAEG-SDG meeting in May 2017. Pending their comments the methodology will be further refined and further endorsement will be sought from the IAEG-SDG meeting in October 2017. From May 2017 onwards a process of testing and feasibility assessment will be undertaken in selected countries through the remainder of 2017 and further refinement and testing through to mid 2018. This work should provide a firm basis to proceed to extending data collection to a larger number of countries.

24
Methodological concept note - SDG Indicator 2.4.1
Annex 1: Sustainable Development Indicator Target 2.4: Methodological Note Proposed by FAO, 14 December 2015
Target 2.4 By 2030, ensure sustainable food production systems and implement resilient agricultural practices that increase productivity and production, that help maintain ecosystems, that strengthen capacity for adaptation to climate change, extreme weather, drought, flooding and other disasters and that progressively improve land and soil quality
Indicator 2.4.1 Percentage of agricultural area under productive and sustainable agriculture
Definition and method of computation
The indicator is defined by the following formula: 𝑃𝑃𝑃𝑃𝑃𝑃𝑃𝑃𝑃𝑃𝑃𝑃𝑃𝑃 𝑜𝑜𝑜𝑜 𝑙𝑙𝑎𝑎𝑃𝑃𝑎𝑎 𝑢𝑢𝑃𝑃𝑎𝑎𝑃𝑃𝑃𝑃 𝑝𝑝𝑃𝑃𝑜𝑜𝑎𝑎𝑢𝑢𝑃𝑃𝑃𝑃𝑝𝑝𝑝𝑝𝑃𝑃 𝑎𝑎𝑃𝑃𝑎𝑎 𝑠𝑠𝑢𝑢𝑠𝑠𝑃𝑃𝑎𝑎𝑝𝑝𝑃𝑃𝑎𝑎𝑠𝑠𝑙𝑙𝑃𝑃 𝑎𝑎𝑎𝑎𝑃𝑃𝑝𝑝𝑃𝑃𝑢𝑢𝑙𝑙𝑃𝑃𝑢𝑢𝑃𝑃𝑃𝑃
=𝐴𝐴𝑃𝑃𝑃𝑃𝑎𝑎 𝑢𝑢𝑃𝑃𝑎𝑎𝑃𝑃𝑃𝑃 𝑝𝑝𝑃𝑃𝑜𝑜𝑎𝑎𝑢𝑢𝑃𝑃𝑃𝑃𝑝𝑝𝑝𝑝𝑃𝑃 𝑎𝑎𝑃𝑃𝑎𝑎 𝑠𝑠𝑢𝑢𝑠𝑠𝑃𝑃𝑎𝑎𝑝𝑝𝑃𝑃𝑎𝑎𝑠𝑠𝑙𝑙𝑃𝑃 𝑎𝑎𝑎𝑎𝑃𝑃𝑝𝑝𝑃𝑃𝑢𝑢𝑙𝑙𝑃𝑃𝑢𝑢𝑃𝑃𝑃𝑃
𝐴𝐴𝑎𝑎𝑃𝑃𝑝𝑝𝑃𝑃𝑢𝑢𝑙𝑙𝑃𝑃𝑢𝑢𝑃𝑃𝑎𝑎𝑙𝑙 𝑎𝑎𝑃𝑃𝑃𝑃𝑎𝑎
Where
𝐴𝐴𝑎𝑎𝑃𝑃𝑝𝑝𝑃𝑃𝑢𝑢𝑙𝑙𝑃𝑃𝑢𝑢𝑃𝑃𝑎𝑎𝑙𝑙 𝑎𝑎𝑃𝑃𝑃𝑃𝑎𝑎 = 𝑎𝑎𝑃𝑃𝑎𝑎𝑠𝑠𝑙𝑙𝑃𝑃 𝑙𝑙𝑎𝑎𝑃𝑃𝑎𝑎 + 𝑝𝑝𝑃𝑃𝑃𝑃𝑝𝑝𝑎𝑎𝑃𝑃𝑃𝑃𝑃𝑃𝑃𝑃 𝑃𝑃𝑃𝑃𝑜𝑜𝑝𝑝𝑠𝑠 + 𝑝𝑝𝑃𝑃𝑃𝑃𝑝𝑝𝑎𝑎𝑃𝑃𝑃𝑃𝑃𝑃𝑃𝑃 𝑝𝑝𝑃𝑃𝑎𝑎𝑎𝑎𝑜𝑜𝑚𝑚𝑠𝑠 𝑎𝑎𝑃𝑃𝑎𝑎 𝑝𝑝𝑎𝑎𝑠𝑠𝑃𝑃𝑢𝑢𝑃𝑃𝑃𝑃𝑠𝑠
The denominator, agricultural area, is a well-known and established indicator that are collected by statistical bodies in countries and compiled internationally via a questionnaire by FAO. These data are available in FAO’s database FAOSTAT. The numerator captures the three dimensions of sustainable production: environmental, economic and social. The measurement instrument – farm surveys – will give countries the flexibility to identify issues related to sustainability that are most relevant to priorities/challenges within these three dimensions. Land under productive and sustainable agriculture will be those farms that satisfy indicators selected across all three dimensions.
Rationale and interpretation
There has been considerable discussion over the past thirty years on how to define “sustainable agriculture.” Sustainability was often understood mainly in its environmental dimension. Yet, it is well established that sustainability needs to be considered in terms of its social, environmental and economic dimensions. The indicator has been operationalized in order to capture its multidimensional nature.
Challenges to sustainable agriculture vary within and across countries, and by region and are affected by socio-economic and bio-physical conditions. By addressing sustainability across its three dimensions, countries can select those metrics within their measurement instrument that best capture the priorities most relevant to them. A further metric will be added to capture the resilience dimension of the target.
A set of possible metrics for each dimension will be established in order to ensure relevance across the whole range of possible socio-economic and bio-physical conditions. Farm surveys will be designed on the basis of a limited set of these measurements, established at national level in order to cover the most relevant aspects of these dimensions of sustainability. Each surveyed farm will be assessed against targets for each of these measurements, decided at national level. The area of farm that satisfy the targets in all dimensions would be considered as sustainable; otherwise no. Progress would be measured against a benchmark, which would show trends over time.
Data sources Data on sustainable production will most likely be collected through agricultural surveys or agricultural modules in integrated household surveys organized by the national statistical agencies, with support from FAO or other international agencies to ensure methodological rigor and harmonization. It is expected that these measurements will be integrated and complemented by earth observation technologies, either by or under the overall supervision of national statistical agencies.
Disaggregation As long as farm or household level data are available, the indicator can be computed for specific population groups and geographical areas. The level of disaggregation depends on the sample design and sample size in each specific country, but, in general, data can be tabulated

25
Methodological concept note - SDG Indicator 2.4.1
Target 2.4 By 2030, ensure sustainable food production systems and implement resilient agricultural practices that increase productivity and production, that help maintain ecosystems, that strengthen capacity for adaptation to climate change, extreme weather, drought, flooding and other disasters and that progressively improve land and soil quality
Indicator 2.4.1 Percentage of agricultural area under productive and sustainable agriculture
by geographical area, size of the farm, gender and age of the enterprise manager.
Comments and limitations
Data from farm surveys can be supplemented with information from other sources, including geospatial data/remote sensing or other techniques to capture environmental data. Data collection or data sharing may be difficult in some countries.
Data for global and regional monitoring
Data for global and regional monitoring will be obtained from aggregation of national data. They can be complemented or enhanced by the use of well selected earth observation data.
Supplementary information
The methodological development of the indicator could benefit from the support from the Global Strategy to improve agricultural and rural statistics, a program aiming at improving countries’ capacities to produce agricultural and rural statistics in support to more effective food security and agricultural and rural development policies. As part of this program, FAO, in collaboration with IFAD and the World Bank, are working towards the establishment of a harmonized and cost-effective program of Agricultural and Rural Integrated Surveys (AGRIS) that could form the basis for the collection of data on indicator 2.4. Through this program, methodological guidelines on how to conduct enterprise surveys in agriculture will be developed and provided to countries, together with technical support in the implementation of the farm surveys.
___
The proposed indicator for 2.4 is directly linked – and may either draw from or provide information to – other proposed SDG targets:
• 2.3 (agricultural productivity). The link between SDG 2.3 and 2.4 is especially strong. Data for these two indicators can be jointly collected through the same integrated survey.
• 6.3 (Improving water quality) • 6.4 (water use efficiency) • 12.2 (efficient use of natural resources) • 15.2 (sustainable management of forests) • 15.3 (land degradation)
References Land use data: http://faostat3.fao.org/download/R/RL/E
Sustainable agriculture:
- http://www.fao.org/sustainability/en/ - Building a Common Vision for Sustainable Food and Agriculture
Global Strategy to Improve Agricultural and Rural Statistics: http://www.fao.org/3/a-i3940e.pdf

26
Methodological concept note - SDG Indicator 2.4.1
Annex 2: Stylised reporting tables, potential structures The following tables, introduced in Section 3, are intended to provide a general impression of the type of reporting that would be possible using the threshold based aggregate indicator approach described in this paper. The figures are illustrative only.
Thousand ha %
Total 4 889 048 100.0 Productive & sustainable 332 728 6.8 Economic sustainable 869 037 17.8 Environmentaly sustainable 835 100 17.1 Socially sustainable 1 874 940 38.3
Table 1 - World percentage of productive and sustainable agricultural area by sustainable dimension
Dimensions of sustainabilityWorld agricultural area
Thousand ha
% A B C
Total 4 889 048 100.0 100.0 100.0 100.0 Productive and sustainable agriculture 332 728 6.8 3.7 8.7 10.3 Non sustainable agriculture 4 556 320 93.2 96.3 91.1 89.7 Non sustainable due to:
1 sub-indicator 151 512 3.1 1.8 3.8 5.0 2 sub-indicators 766 251 15.7 17.0 14.7 14.5 3 sub-indicators 898 149 18.4 22.7 16.8 8.4 4 sub-indicators 1099 977 22.5 22.1 23.1 21.3 5 sub-indicators 716 334 14.7 10.8 16.7 20.3 6 sub-indicators 539 493 11.0 14.1 8.0 12.2 7 sub-indicators 384 304 7.9 7.7 8.0 8.0
Country
Table 3 - Sustainability of agricultural area by countries
Sustainability
World agricultural area

27
Methodological concept note - SDG Indicator 2.4.1
%
Economic Environmental Social
World 6.8 17.8 17.1 38.3 Livestock 3.4 3.5 21.2 37.8 Crops 2.9 20.7 10.6 37.7 Mixed 24.9 41.4 25.7 41.3
Table 4 - Percentage sustainable agricultural area according sustainable dimension by type of activity
Type of activityProductive and
sustainableDimensions
Table 5 - Percentage sustainable agricultural area according sub-indicators and countries%
A B C6,8 3,7 8,7 10,3
Labour productivity 72,8 87,2 66,0 46,8 Land productivity 43,8 28,0 51,6 70,7
Profitability Farm profitability 58,6 67,1 54,7 42,9 Erosion 63,4 52,0 69,9 79,5 Carbon soil 60,2 53,3 63,4 73,0
Water Water polution 53,5 48,6 56,4 60,2 Biodiversity Conservation 67,7 74,9 64,4 54,1 Energy Energy efficiency 80,0 71,4 85,5 89,4 Decent work Working poor 39,6 36,0 41,8 44,2 Household income Poverty 39,6 96,6 81,1 64,2
Table 6 - Percentage sustainable agricultural area according sub-indicators by farm size%
Subsistance
Small farms
Medium farms
Large farms
Very large farms
6,8 1,8 14,3 11,2 2,5 2,3 Labour productivity 72,8 2,9 49,5 40,6 100,0 100,0 Land productivity 43,8 100,0 79,7 70,6 23,7 12,5
Profitability Farm profitability 58,6 3,7 14,3 60,2 68,2 70,7 Erosion 63,4 100,0 100,0 69,5 61,9 41,8 Carbon soil 60,2 100,0 99,3 99,3 50,6 50,9
Water Water polution 53,5 68,1 65,1 61,0 61,0 44,3 Biodiversity Conservation 67,7 22,6 37,5 62,4 81,0 81,0 Energy Energy efficiency 80,0 98,8 89,0 89,1 72,9 70,9 Decent work Working poor 39,6 11,4 33,4 60,3 28,2 29,6 Household income Poverty 85,7 3,0 24,5 89,9 100,0 100,0
Table 7 - Percentage sustainable agricultural area according sub-indicators by type of activity%
Livestock Crops Mixed
6,8 3,4 2,9 62,5 Labour productivity 72,8 84,7 62,5 74,2 Land productivity 43,8 21,6 52,1 70,5
Profitability Farm profitability 58,6 51,9 62,0 64,3 Erosion 63,4 50,8 74,7 60,9 Carbon soil 60,2 66,2 49,0 77,3
Water Water polution 53,5 73,7 41,2 42,2 Biodiversity Conservation 67,7 79,0 55,8 75,1 Energy Energy efficiency 80,0 95,2 72,1 67,8 Decent work Working poor 39,6 38,1 37,7 48,1 Household income Poverty 85,7 93,9 87,0 64,3
Country
Social
Dimension / Theme / Sub-indicator World
Productive and sustainable area
Economic Productivity
Environmental
Soil
Environmental
Soil
Social
Size
Dimension / Theme / Sub-indicator Worldtype
Dimension / Theme / Sub-indicator World
Productive and sustainable area
Economic Productivity
Social
Productive and sustainable area
Economic Productivity
Environmental
Soil

28
Methodological concept note - SDG Indicator 2.4.1
Thousent ha
% A B C
Total 4 889 048 100,0 100,0 100,0 100,0 Productive and sustainable agriculture 332 728 6,8 3,7 8,7 10,3 Non sustainable agriculture 4 556 320 93,2 96,3 91,1 89,7
Economic 276 272 5,7 5,1 5,7 7,5 Social - - - - - Environmental 137 243 2,8 3,5 2,5 1,6 Economic + social 226 555 4,6 2,2 6,2 7,4 Environmental + social 399 551 8,2 9,6 7,5 5,8 Economic + environmental 1 130 090 23,1 23,5 23,1 21,6 Economic + social + environmental 2 386 309 48,8 52,4 46,2 45,8
Thousent ha
% A B C
Total 4 889 048 100,0 100,0 100,0 100,0 Productive and sustainable agriculture 332 728 6,8 3,7 8,7 10,3 Non sustainable agriculture 4 556 320 93,2 96,3 91,1 89,7 Non sustainable due to:
1 sub-indicator 151 512 3,1 1,8 3,8 5,0 2 sub-indicators 766 251 15,7 17,0 14,7 14,5 3 sub-indicators 898 149 18,4 22,7 16,8 8,4 4 sub-indicators 1099 977 22,5 22,1 23,1 21,3 5 sub-indicators 716 334 14,7 10,8 16,7 20,3 6 sub-indicators 539 493 11,0 14,1 8,0 12,2 7 sub-indicators 384 304 7,9 7,7 8,0 8,0
Country
Table 9 - Sustainability of agricultural area by countries
Country
Table 8 - World agricultural area acoording productive and sustainable dimensions
Dimensions of sustainability
World agricultural area
Sustainability
World agricultural area
29
Methodological concept note - SDG Indicator 2.4.1
Annex 3: Water use sub-indicator example As with most of the themes and sub-indicators under consideration for SDG 2.4.1, there is no clear international consensus on how or where to set a sustainability threshold for agricultural water use at the farm level. For the theme of water use, a potential sub-indicator could be based on a measure of surface and groundwater use/abstraction for agriculture. Context is crucially important in setting an environment sustainability threshold, as well as mechanisms to adjust such a threshold should total water availability fluctuate significantly from historic norms.
At a watershed level, one metric often considered is based on a comparison of annual water withdrawals relative to mean annual renewal. There are a number of limitations to such an approach, however, in part because the focus is usually only on blue water resources (surface and groundwater). Because SDG comparisons will be primarily country-based, trans-national watersheds add another layer of complexity to such would-be assessments. In the context of SDG 2.4.1, if the emphasis is on farm-level sustainability, the location of any given farm with respect to groundwater access and/or its position downstream of other surface water users makes standardization of such a metric especially challenging.
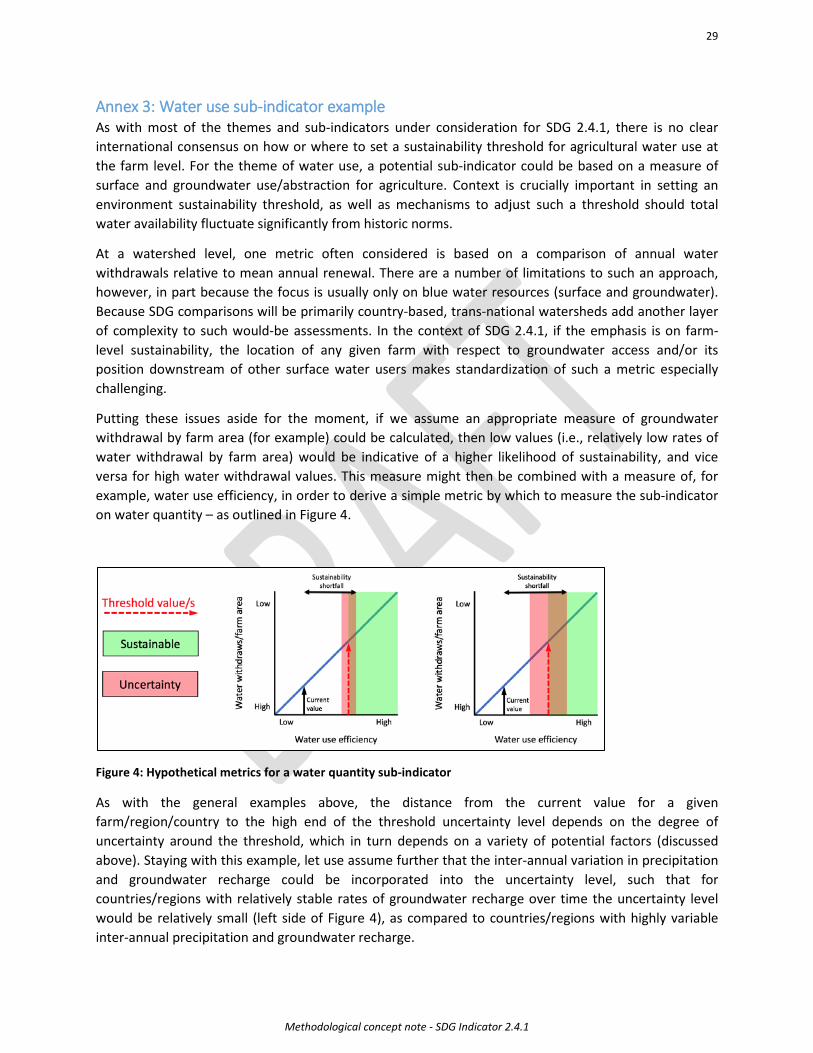
Putting these issues aside for the moment, if we assume an appropriate measure of groundwater withdrawal by farm area (for example) could be calculated, then low values (i.e., relatively low rates of water withdrawal by farm area) would be indicative of a higher likelihood of sustainability, and vice versa for high water withdrawal values. This measure might then be combined with a measure of, for example, water use efficiency, in order to derive a simple metric by which to measure the sub-indicator on water quantity – as outlined in Figure 4.
Figure 4: Hypothetical metrics for a water quantity sub-indicator
As with the general examples above, the distance from the current value for a given farm/region/country to the high end of the threshold uncertainty level depends on the degree of uncertainty around the threshold, which in turn depends on a variety of potential factors (discussed above). Staying with this example, let use assume further that the inter-annual variation in precipitation and groundwater recharge could be incorporated into the uncertainty level, such that for countries/regions with relatively stable rates of groundwater recharge over time the uncertainty level would be relatively small (left side of Figure 4), as compared to countries/regions with highly variable inter-annual precipitation and groundwater recharge.

30
Methodological concept note - SDG Indicator 2.4.1
If we assume further that there were five countries which received approximately equal scores on this metric of sustainable water use, and we then adjusted the uncertainty level proportionately by the degree of inter-annual variation in precipitation and groundwater recharge, we could use one standardized metric in different regions while adjusting for inter-regional variation. As shown in Figure 5, if we assume there are three regions, each with five countries receiving the same scores on our water quantity sub-indicator, we see then that the regional context (variability of water recharge) is incorporated into the uncertainty level such that two countries are considered sustainable in one region (left-most figure), but at the same water withdraw/efficiency level, only one country falls safely within the sustainability region in the other two regions. This example demonstrates how a measure of uncertainty can be used to incorporate differences in time-trend data and/or provide a mechanism for incorporating future fluctuations or climatic shocks.
Figure 5: Hypothetical water use sustainability results for five countries under varying levels of uncertainty

31
Methodological concept note - SDG Indicator 2.4.1
References
Acosta-Alba I, Van der Werf MH. 2011. The Use of Reference Values in Indicator-Based Methods for the Environmental Assessment of Agricultural Systems. Sustainability. 2011;3(2). doi: 10.3390/su3020424.
Binder CR, Feola G, Steinberger JK. 2010. Considering the normative, systemic and procedural dimensions in indicator-based sustainability assessments in agriculture. Environmental Impact Assessment Review. 2010;30(2):71-81. doi: http://dx.doi.org/10.1016/j.eiar.2009.06.002.
FAO. 1988. Report of the FAO Council, 94th Session, 1988. Rome.
FAO. 2014. Building a common vision for sustainable food and agriculture: Principles and approaches, FAO Rome.
Hayati, D. 2017. Literature Review: A Literature Review on Frameworks and Methods for Measuring and Monitoring Sustainable Agriculture. Technical Report n.22. Global Strategy Technical Report: Rome
Murray CJ, Ezzati M, Flaxman AD, Lim S, Lozano R, Michaud C, et al. 2012. GBD 2010: design, definitions, and metrics. The Lancet. 2012;380(9859):2063-6.
OECD. 2008. Handbook on constructing composite indicators: Methodology and user guide. OECD & European Commission Joint Research Centre, 2008.
Srebotnjak T, Polzin C, Giljum S, Herbert S, Lutter S. 2010. Establishing Environmental Sustainability Thresholds and Indicators: Final report. Brussels: Ecologic Institute and SERI, 2010.