pepsico, inc. - climate change 2018
TRANSCRIPT

PepsiCo, Inc. - Climate Change 2018
C0. Introduction
C0.1
(C0.1) Give a general description and introduction to your organization.
PepsiCo products are enjoyed by consumers more than one billion times a day in more than 200 countries and territories around theworld. PepsiCo generated more than $63 billion in net revenue in 2017, driven by a complementary food and beverage portfolio thatincludes 22 brands that generate more than $1 billion each in estimated annual retail sales (e.g., Frito-Lay, Gatorade, Pepsi-Cola,Quaker and Tropicana). At the heart of PepsiCo is Performance with Purpose (PwP) – our goal to deliver top-tier financialperformance while creating sustainable growth and shareholder value. In practice, PwP means providing a wide range of foods andbeverages from treats to nutritious eats; trying to find innovative ways to reduce our impact on the environment and lower ouroperating costs; working to provide a safe and inclusive workplace for our employees globally; and respecting, supporting andinvesting in the local communities where we operate.
Cautionary Statement - Statements in this submission that are “forward-looking statements” are based on currently availableinformation, operating plans and projections about future events and trends. Terminology such as “aim,” “anticipate,” “believe,” “drive,”“estimate,” “expect,” “expressed confidence,” “forecast,” “future,” “goal,” “guidance,” “intend,” “may,” “objective,” “outlook,” “plan,”“position,” “potential,” “project,” “seek,” “should,” “strategy,” “target,” “will” or similar statements or variations of such terms areintended to identify forward-looking statements, although not all forward-looking statements contain such terms. Forward-lookingstatements inherently involve risks and uncertainties that could cause actual results to differ materially from those predicted in suchforward-looking statements. Such risks and uncertainties include, but are not limited to: changes in demand for PepsiCo’s products;changes in, or failure to comply with, applicable laws and regulations; imposition or proposed imposition of new or increased taxesaimed at PepsiCo’s products; imposition of labeling or warning requirements on PepsiCo’s products; changes in laws related topackaging and disposal of PepsiCo’s products; PepsiCo’s ability to compete effectively; political conditions, civil unrest or otherdevelopments and risks in the markets where PepsiCo’s products are made, manufactured, distributed or sold; PepsiCo’s ability togrow its business in developing and emerging markets; uncertain economic conditions in the countries in which PepsiCo operates;the ability to protect information systems against, or effectively respond to, a cybersecurity incident or other disruption; increasedcosts, disruption of supply or shortages of raw materials and other supplies; business disruptions; product contamination or tamperingor issues or concerns with respect to product quality, safety and integrity; damage to PepsiCo’s reputation or brand image; failure tosuccessfully complete or integrate acquisitions and joint ventures into PepsiCo’s existing operations or to complete or managedivestitures or refranchisings; changes in estimates and underlying assumptions regarding future performance that could result in animpairment charge; increase in income tax rates, changes in income tax laws or disagreements with tax authorities; failure to realizeanticipated benefits from PepsiCo’s productivity initiatives or global operating model; PepsiCo’s ability to recruit, hire or retain keyemployees or a highly skilled and diverse workforce; loss of any key customer or disruption to the retail landscape; any downgrade orpotential downgrade of PepsiCo’s credit ratings; PepsiCo’s ability to implement shared services or utilize information technologysystems and networks effectively; fluctuations or other changes in exchange rates; climate change or water scarcity, or legal,regulatory or market measures to address climate change or water scarcity; failure to successfully negotiate collective bargainingagreements, or strikes or work stoppages; infringement of intellectual property rights; potential liabilities and costs from litigation,claims, regulatory, or legal proceedings, inquiries or investigations; and other factors discussed in the risk factors section ofPepsiCo’s filings with the Securities and Exchange Commission. Investors are cautioned not to place undue reliance on any suchforward-looking statements, which speak only as of the date they are made. PepsiCo undertakes no obligation to update any forward-looking statements.
C0.2
CDP Page of 941

(C0.2) State the start and end date of the year for which you are reporting data.
Start date End date Indicate if you are providing emissions data for pastreporting years
Select the number of past reporting years you will be providingemissions data for
Row1
January 12017
December 312017
No <Not Applicable>
Row2
<NotApplicable>
<NotApplicable>
<Not Applicable> <Not Applicable>
Row3
<NotApplicable>
<NotApplicable>
<Not Applicable> <Not Applicable>
Row4
<NotApplicable>
<NotApplicable>
<Not Applicable> <Not Applicable>
C0.3
CDP Page of 942

(C0.3) Select the countries/regions for which you will be supplying data.ArgentinaAustraliaBelgiumBosnia and HerzegovinaBrazilCanadaChileChinaColombiaCosta RicaCyprusCzechiaDominican RepublicEcuadorEgyptEl SalvadorEstoniaFranceGeorgiaGermanyGreeceGuatemalaHondurasHungaryIndiaIrelandItalyJordanKyrgyzstanMexicoNetherlandsNew ZealandPakistanPanamaPeruPolandPortugalRomaniaRussian FederationSaudi ArabiaSerbiaSingaporeSlovakiaSouth AfricaSpainTaiwan (Province of China)ThailandTurkeyUkraineUnited Kingdom of Great Britain and Northern IrelandUnited States of AmericaUruguayViet Nam
C0.4
(C0.4) Select the currency used for all financial information disclosed throughout your response.USD
CDP Page of 943

C0.5
(C0.5) Select the option that describes the reporting boundary for which climate-related impacts on your business are beingreported. Note that this option should align with your consolidation approach to your Scope 1 and Scope 2 greenhouse gasinventory.Operational control
C-AC0.6/C-FB0.6/C-PF0.6
(C-AC0.6/C-FB0.6/C-PF0.6) Are emissions from agricultural/forestry, processing/manufacturing, distribution activities oremissions from the consumption of your products – whether in your direct operations or in other parts of your value chain –relevant to your current CDP climate change disclosure?
Relevance
Agriculture/Forestry Both own land and elsewhere in the value chain [Agriculture/Forestry only]
Processing/Manufacturing Both direct operations and elsewhere in the value chain [Processing/manufacturing/Distribution only]
Distribution Both direct operations and elsewhere in the value chain [Processing/manufacturing/Distribution only]
Consumption Yes [Consumption only]
C-AC0.7/C-FB0.7/C-PF0.7
CDP Page of 944

(C-AC0.7/C-FB0.7/C-PF0.7) Which agricultural commodity(ies) that your organization produces and/or sources are the mostsignificant to your business by revenue? Select up to five.
Agricultural commodityPalm Oil
% of revenue dependent on this agricultural commodity40-60%
Produced or sourcedSourced
Please explainRevenue dependent on this commodity is disclosed as an aggregate of all commodities listed here. We do not have sufficient datato determine revenue dependence of each commodity at this time.
Agricultural commoditySugar
% of revenue dependent on this agricultural commodity40-60%
Produced or sourcedSourced
Please explainRevenue dependent on this commodity is disclosed as an aggregate of all commodities listed here. We do not have sufficient datato determine revenue dependence of each commodity at this time.
Agricultural commodityWheat
% of revenue dependent on this agricultural commodity40-60%
Produced or sourcedSourced
Please explainRevenue dependent on this commodity is disclosed as an aggregate of all commodities listed here. We do not have sufficient datato determine revenue dependence of each commodity at this time.
Agricultural commodityOther, please specify (Potatoes)
% of revenue dependent on this agricultural commodity40-60%
Produced or sourcedSourced
Please explainRevenue dependent on this commodity is disclosed as an aggregate of all commodities listed here. We do not have sufficient datato determine revenue dependence of each commodity at this time.
Agricultural commodityOther, please specify (Corn)
% of revenue dependent on this agricultural commodity40-60%
Produced or sourcedSourced
Please explainThis includes High Fructose Corn Syrup sourcing. Revenue dependent on this commodity is disclosed as an aggregate of allcommodities listed here. We do not have sufficient data to determine revenue dependence of each commodity at this time.
CDP Page of 945

C1. Governance
C1.1
(C1.1) Is there board-level oversight of climate-related issues within your organization?Yes
C1.1a
(C1.1a) Identify the position(s) of the individual(s) on the board with responsibility for climate-related issues.
Position ofindividual(s)
Please explain
Board/Executiveboard
Under PepsiCo’s By-Laws and Corporate Governance Guidelines, the board has the responsibility to manage the business of the Company.Sustainability matters, including climate change, are integrated into our business. Therefore, the board considers them an integral part of itsbusiness oversight. To clarify its role, the board amended PepsiCo’s Corporate Governance Guidelines in 2015 to add “sustainability” to the keyaspects of PepsiCo’s businesses over which the board has oversight. In 2016, PepsiCo reviewed our sustainability governance structure tostrengthen the integration of Performance with Purpose (PwP) into our business agenda. The PepsiCo Executive Committee (PEC) thenassumed direct oversight of the sustainability agenda, including strategic decisions and performance management. The PEC is made up of thechairman & CEO, the president, the CFO, sector CEOs and functional heads, ensuring that sustainability is a key accountability for everymember of our senior leadership team
C1.1b
CDP Page of 946

(C1.1b) Provide further details on the board’s oversight of climate-related issues.
Frequencywithwhichclimate-relatedissues areascheduledagendaitem
Governancemechanismsinto whichclimate-related issuesare integrated
Please explain
Scheduled– somemeetings
Reviewing andguidingstrategyReviewing andguiding majorplans of actionReviewing andguiding riskmanagementpoliciesReviewing andguiding annualbudgetsReviewing andguidingbusiness plansSettingperformanceobjectivesMonitoringimplementationandperformance ofobjectivesOverseeingmajor capitalexpenditures,acquisitionsanddivestituresMonitoring andoverseeingprogressagainst goalsand targets foraddressingclimate-relatedissues
The board oversees PepsiCo’s integrated risk management framework designed to identify, assess, prioritize, address, manage,monitor and communicate our top strategic, financial, operating, business, compliance, safety, reputational and other risks, includingclimate-related risks across the organization. The PepsiCo Risk Committee (PRC) is a cross-functional diverse group that meetsregularly and is responsible for reporting progress on risk mitigation efforts to the board. The board receives updates on key risksthroughout the year. Key risks related to climate change and water scarcity identified by the Company are included in our 2017Annual Report on Form 10-K. In addition the Public Policy and Sustainability Committee created in 2017 assists the Board in providingmore focused oversight over the company’s policies, programs and related risks that concern key sustainability matters.
C1.2
(C1.2) Below board-level, provide the highest-level management position(s) or committee(s) with responsibility for climate-related issues.
Name of the position(s) and/or committee(s) Responsibility Frequency of reporting to the board onclimate-related issues
Other C-Suite Officer, please specify (Chief ScientificOfficer & Vice Chairman)
Both assessing and managing climate-related risksand opportunities
Quarterly
C1.2a
CDP Page of 947

(C1.2a) Describe where in the organizational structure this/these position(s) and/or committees lie, what their associatedresponsibilities are, and how climate-related issues are monitored.
Dr. Mehmood Khan, PepsiCo’s chief scientific officer and vice chairman, who reports directly to our chairman and CEO, oversees thecompany’s Performance with Purpose (PwP) program. With his background as a physician, with expertise in endocrinology,metabolism and nutrition, Dr. Khan brings deep science-based knowledge and insights to guide the company’s product portfoliotransformation efforts, as well as an intimate understanding of the challenges and opportunities that lie at the intersection of food, theenvironment and people. Dr. Khan is involved in the day-to-day management of our strategy toward delivery of our PwP agenda, andhis responsibilities include providing strategic direction, guidance and leadership on critical climate-related issues facing theCompany and actions the Company must take. Climate-related issues monitoring and overseeing the delivery of our climate goalunder PwP fall directly under the responsibilities of Dr. Khan. Each quarter, Dr. Khan is apprised of our progress towards our climategoal and related issues. Based on this, Dr. Khan is involved in aligning the PepsiCo Executive Committee (PEC) and the board onstrategic decisions toward mitigating climate risks, enhancing PepsiCo's reputation and positioning the business for future success.
C1.3
(C1.3) Do you provide incentives for the management of climate-related issues, including the attainment of targets?Yes
C1.3a
(C1.3a) Provide further details on the incentives provided for the management of climate-related issues.
Who is entitled to benefit from these incentives?Corporate executive team
Types of incentivesMonetary reward
Activity incentivizedEmissions reduction target
CommentOur corporate executive team has strategic objectives based on an individual executive’s role and accountabilities that are alignedwith Performance with Purpose (PwP), which is our goal to deliver top-tier financial performance while creating sustainable growthin shareholder value. Performance against these objectives impacts a portion of both annual and long-term incentives.
Who is entitled to benefit from these incentives?Chief Executive Officer (CEO)
Types of incentivesMonetary reward
Activity incentivizedEmissions reduction target
CommentOur executive officers, including our chairman and CEO, have strategic objectives based on an individual executive’s role andaccountabilities that are aligned with PwP, which is our goal to deliver top-tier financial performance while creating sustainablegrowth in shareholder value. Performance against these objectives impacts a portion of both annual and long-term incentives.
Who is entitled to benefit from these incentives?Business unit manager
Types of incentivesMonetary reward
Activity incentivizedEmissions reduction target
Comment
CDP Page of 948

Business unit managers have objectives based on their roles and accountabilities that are aligned with PwP, which is our goal todeliver top-tier financial performance while creating sustainable growth in shareholder value. Performance against these objectivesimpacts a portion of both annual and long-term incentives.
Who is entitled to benefit from these incentives?Energy manager
Types of incentivesMonetary reward
Activity incentivizedEmissions reduction target
CommentEnergy managers have annual energy and fuel reduction (as a proxy for greenhouse gas (GHG) emissions reduction) performancetargets. PepsiCo has a pay-for-performance philosophy and the annual performance rating impacts annual merit increases,including bonuses. In addition, a wide range of complementary awards recognizes teams and associates for exceptionalperformance in sustainability, including projects that reduce GHG emissions.
Who is entitled to benefit from these incentives?Facilities manager
Types of incentivesMonetary reward
Activity incentivizedEmissions reduction target
CommentSome facility managers have annual energy and fuel reduction (as a proxy for GHG emissions reduction) performance targets.PepsiCo has a pay-for-performance philosophy and the annual performance rating impacts annual merit increases, includingbonuses. In addition, a wide range of complementary awards recognizes teams and associates for exceptional performance insustainability, including projects that reduce GHG emissions.
Who is entitled to benefit from these incentives?Process operation manager
Types of incentivesMonetary reward
Activity incentivizedEmissions reduction target
CommentSome process operation managers have annual energy and fuel reduction (as a proxy for GHG emissions reduction) performancetargets. PepsiCo has a pay-for-performance philosophy and the annual performance rating impacts annual merit increases,including bonuses. In addition, a wide range of complementary awards recognizes teams and associates for exceptionalperformance in sustainability, including projects that reduce GHG emissions.
C2. Risks and opportunities
C2.1
CDP Page of 949

(C2.1) Describe what your organization considers to be short-, medium- and long-term horizons.
From (years) To (years) Comment
Short-term 0 1
Medium-term 1 5
Long-term 5 10
C2.2
(C2.2) Select the option that best describes how your organization's processes for identifying, assessing, and managingclimate-related issues are integrated into your overall risk management.Integrated into multi-disciplinary company-wide risk identification, assessment, and management processes
C2.2a
(C2.2a) Select the options that best describe your organization's frequency and time horizon for identifying and assessingclimate-related risks.
Frequencyofmonitoring
How far intothe futureare risksconsidered?
Comment
Row1
Six-monthlyor morefrequently
>6 years The board oversees PepsiCo’s integrated risk management framework designed to identify, assess, prioritize, address, manage,monitor and communicate our top strategic, financial, operating, business, compliance, safety, reputational and other risksincluding climate related risks across the organization. The PepsiCo Risk Committee (PRC) is a cross-functional diverse groupthat meets regularly and is responsible for reporting progress on risk mitigation efforts to the board. The board receives updateson key risks throughout the year. Key risks related to climate change and water scarcity identified by the Company are included inour 2017 Annual Report on Form 10-K.
C2.2b
CDP Page of 9410

(C2.2b) Provide further details on your organization’s process(es) for identifying and assessing climate-related risks.
At the company level, to align with our Performance with Purpose (PwP) 2025 agenda, our board refined the roles of its committeesin 2017 by creating a new Public Policy and Sustainability Committee. This committee assists the Board in providing more focusedoversight over the company’s policies, programs and related risks that concern key sustainability matters. The committee, whichmeets three times per year, beginning in 2017, is comprised entirely of independent directors, and was carefully chosen to representexpertise in the scientific, financial, technological and non-profit sectors. The primary agenda item for these meetings is a review ofPepsiCo’s company-wide progress on our PwP goals, including progress against our goal to reduce greenhouse gas (GHG)emissions across our value chain by 20% in absolute terms by 2030. At one level below the board, the PepsiCo ExecutiveCommittee (the CEO and each of her direct reports), meets quarterly to review progress against PwP goals; progress against broaderenvironmental risk mitigation (such as our efforts to mitigate supply chain-wide risk due to water scarcity and packaging); and toensure that we are adapting our sustainability strategy to changes in science, stakeholder expectations and marketplace conditions.Other risks considered at each level of our business include changes in agricultural raw material supply due to climate change-drivenimpacts, regulatory initiatives (e.g., The European Union Emission Trading System (EU-ETS)), and impacts of increased water-related risks.
At the asset level, our manufacturing plants report key environmental performance data, including GHG emissions, on a monthlybasis – these data are used to evaluate performance against targets and as an assessment of progress in mitigating environmentalrisk to the region. We also conduct focused risk assessments on climate change-related risks such as water-related riskassessments for our manufacturing operations. These are conducted using the World Resources Institute’s (WRI) Aqueduct and site-level input and focus on physical, regulatory and reputational risks currently and into the longer term (>5 years). We also assess andmanage our packaging as a risk area related to climate change. Regulatory pressure related to packaging is being fueled byincreased nongovernmental organization (NGO) activity and media coverage, including attention to ocean plastic pollution andassociated public health concerns. In response, we have developed a sustainable packaging strategy to help mitigate these risks andalso deliver emission reduction benefits. Our strategy for sustainable packaging focuses on the following areas: 1) developingpackaging that is recyclable, compostable and biodegradable; 2) working to increase recycling of product packaging in themarketplace; 3) working to reduce greenhouse gas impacts of packaging by increasing recycled PET (rPET) content in plastic bottlesand light-weighting; and 4) exploring collaborations and technologies that reduce our dependence on plastic.
Once climate risks have been identified, the next step in our process is to prioritize each risk based on the likelihood that it will occur,the financial impact to PepsiCo should it occur (any impact over $1 million is considered substantive), and whether the activitiesneeded to mitigate the risk are aligned with our overall climate strategy and business plan. For example, we incorporateenvironmental sustainability criteria into our Capital Expenditure Filter, which is applied to all capital expenditure requests over $5million. Each request is reviewed not only against business financial metrics and value to advancing our business strategy but also forthe impact (positive or negative) that it will have on our environmental performance, including energy use and GHG emissions, and itscontribution to our efforts to achieve our climate goal.
C2.2c
CDP Page of 9411

(C2.2c) Which of the following risk types are considered in your organization's climate-related risk assessments?
Relevance&inclusion
Please explain
Currentregulation
Relevant,alwaysincluded
Current regulation, such as cap and trade schemes under the European Union Emission Trading System (EU ETS) and the Californiacap and trade mechanisms, impact certain PepsiCo facilities located in Europe and California. Our Public Policy and Government Affairs(PPGA) global and sector teams continuously monitor these regulations and we invest in energy efficiency and emission mitigationstrategies in our covered facilities. We operate our facilities at the highest environmental performance standards and continuouslymonitor our emissions performance.
Emergingregulation
Relevant,alwaysincluded
Our PPGA team monitors new regulations around the globe to better prepare PepsiCo and mitigate the inherent financial risks associatedwith fuel/energy taxes and regulations. Additionally, team members engage with lawmakers and other stakeholders in the regulatoryprocess and also submit official comments to achieve desired environmental goals while avoiding detrimental impacts on the businesscommunity.
Technology Relevant,alwaysincluded
Technological developments are closely monitored by PepsiCo’s Research & Development (R&D) teams focused on external innovation.Any emerging technological advancements on the horizon with the ability to aid PepsiCo in delivering our PWP goals are evaluated andinternally deliberated upon for appropriate action.
Legal Relevant,alwaysincluded
Our PPGA teams monitor legal and regulatory developments around the globe to advise PepsiCo on the best course of action. Inaddition, our Environmental Health and Safety (EHS) teams ensure our facilities are operated with full legal compliance with relevant localregulations.
Market Relevant,alwaysincluded
Market-specific risks are monitored and evaluated by our local PPGA teams. For example, climate-related risks arising from packagingand the specific mitigation strategy for each market and business unit are discussed at that level in order to prioritize activities.
Reputation Relevant,alwaysincluded
Any negative perception (whether valid or not) of PepsiCo’s response to climate change or water scarcity could result in adverse publicityand could adversely affect PepsiCo’s business, financial condition or results of operations. We monitor this risk through our global andlocal PPGA teams who work with governments, as well as nongovernmental organizations to understand relevant issues and adviseaccordingly. We make efforts to reduce this risk by communicating about our Performance with Purpose (PwP) goals and activitiesrelated to climate and packaging, as well as water, through various avenues such as the updated 2017 Sustainability Report anddetailed A-Z topics on our website for 2017.
Acutephysical
Relevant,alwaysincluded
Physical climate-related impacts are most relevant in the day-to-day operations of our facilities, especially related to resource use. Wehave a robust environmental, health and safety (EHS) monitoring system deployed in all of our manufacturing sites, and we collect andanalyze our EHS data on a regular basis to gain insights on management of environmental resources. We implement several energyefficiency, water efficiency and water quality measures within our facilities to mitigate this risk.
Chronicphysical
Relevant,alwaysincluded
PepsiCo has undertaken several initiatives to lessen our dependence upon climate-sensitive commodities. For example, to assess andmitigate the risk in temperature and precipitation impact, PepsiCo has implemented our Sustainable Farming Program (SFP) (formerlyour Sustainable Farming Initiative, or SFI), which enables our company-owned and contract growers to compete in a resource-constrained future.
Upstream Relevant,alwaysincluded
Our PwP climate goal encompasses our entire value chain, therefore, upstream supply chain risks are carefully evaluated in ourmitigation plans. Our SFP works with our growers to understand emissions, and risks associated with it, and provides trainings onmanagement methods to allow our growers to compete in a resource-constrained future.
Downstream Relevant,alwaysincluded
Our PwP climate goal encompasses our entire value chain, therefore, downstream supply chain risks are carefully evaluated in ourmitigation plans. For example, our vending and cooling program was launched in order to assess and mitigate the energy impacts of ourequipment downstream where our products are distributed to consumers.
C2.2d
CDP Page of 9412

(C2.2d) Describe your process(es) for managing climate-related risks and opportunities.
PepsiCo has identified climate change as a business risk through our Integrated Risk Management Framework, a process thatidentifies, assesses, prioritizes, manages, and monitors the risks affecting the Company across its operations. Our managementprocesses for climate risks and opportunities include: 1) We have integrated a greenhouse gas (GHG) reduction target into ourPerformance with Purpose (PwP) strategy, PepsiCo’s vision to deliver top-tier financial performance over the long term by integratingsustainability into our business 2) Climate strategy and actions are reviewed and managed in the context of our short and long termbusiness strategy 3) Climate change risks are included in our Annual Report on Form 10-K. Several aspects of climate change haveinfluenced our strategy, including a) the need for our business to adapt to a changing environment driven by rising temperatures andfluctuating weather patterns that affect our supply chain; and b) the opportunity to develop a product portfolio that includes fewerGHG-intensive and water-intensive products. Our long-term strategy has been influenced by Climate change through our merger andacquisition strategy. We have embedded mechanisms to quantify the impact of growth and M&A activity on our ability to deliver ourClimate goal into our investment allocation processes, as well as integrating a requirement for business units to conduct a water-related risk assessment prior to any major acquisition. We believe that our climate change strategy is industry-leading and willsupport our efforts to build PepsiCo’s reputation as a leader in environmental sustainability, potentially translating into competitiveadvantage with our customers and consumers.
PepsiCo’s Public Policy and Government Affairs (PPGA) teams spend considerable amount of time monitoring and evaluating currentand upcoming regulations related to climate change, as well as monitoring industry trends and engaging with our stakeholders. Forexample, current and emerging cap and trade regulations are flagged by our PPGA teams as a transition risk so that the Companycan take appropriate steps to mitigate impacts. As a result, our facilities measure their greenhouse gas emissions and document inour internal Environmental Health and Safety (EHS) system. This allows PepsiCo to then make informed decisions about energyefficiency, conservation efforts and investments to be made in order to manage risks from these regulations.
Our Sustainable Farming Program (SFP) (formerly our Sustainable Farming Initiative, or SFI), which reflects industry best practice,helps position us and our farmers to compete more effectively in a resource constrained future. Through the program, we are workingwith our farmers to reduce physical climate change impacts of farming practices, improve soil health, and improve water useefficiency. The acute and chronic physical risks posed by climate change in our upstream supply chain for the commodities that ourbusiness largely relies on, are managed through this program. In collaboration with our supply chain partners and growers, we arebuilding a more resilient ingredients supply chain.
C2.3
(C2.3) Have you identified any inherent climate-related risks with the potential to have a substantive financial or strategicimpact on your business?Yes
C2.3a
(C2.3a) Provide details of risks identified with the potential to have a substantive financial or strategic impact on yourbusiness.
IdentifierRisk 1
Where in the value chain does the risk driver occur?Direct operations
Risk typeTransition risk
Primary climate-related risk driverPolicy and legal: Increased pricing of GHG emissions
Type of financial impact driverPolicy and legal: Increased operating costs (e.g., higher compliance costs, increased insurance premiums)
CDP Page of 9413

Company- specific descriptionUnder Phase 3 of the European Emission Trading System (EU-ETS), which took effect January 1, 2013, individual energyconsumers with combustion capacity exceeding 20 MW must report fuel consumption and submit allowances. This requirementapplied to five PepsiCo facilities in 2017: Leicester and Peterlee in the UK, Burgos in Spain, Veurne in Belgium and Bol in theNetherlands with Grodzisk in Poland joining in 2018. The EU has committed to cut greenhouse gas emissions by at least 40% by2030 against a 1990 baseline. One of the principal mechanisms for achieving this reduction is the EU-ETS, which the individual EUmember states administer. Under the EU-ETS, a covered facility must report its annual fuel consumption to national authorities, andthen submit one allowance for each metric ton of CO2 or CO2 equivalent emitted. Additionally, enforceable compliance obligationsunder California’s cap and trade program took effect January 1, 2013. This law requires the Frito-Lay plant in Bakersfield, Californiato participate in the program.
Time horizonCurrent
LikelihoodVirtually certain
Magnitude of impactMedium
Potential financial impact630000000
Explanation of financial impactThe cost of complying with cap and trade schemes will vary based on the market price of the allowances, as well as any changesin allocation. In the event that more stringent regulation is enacted and is more aggressive than the sustainability measures that weare currently undertaking to monitor our emissions and improve our energy efficiency, we may experience increases in our costs ofoperation and delivery. For example, approximately 1% of net revenue could be at risk due to regulation and commodity inflation,which for 2017 net revenue could equate to approximately $0.63 billion.
Management methodTo reduce carbon emissions, and address the inherent financial risks of cap and trade, PepsiCo invests in energy efficiency andother clean energy technologies such as anaerobic digestion. We also ensure that our facilities have strong environmentalmanagement systems in place such as PepsiCo’s Global Environmental Health & Safety Management System (GEHMS). Weexpect these management methods to reduce the risk to our business concerning increased operating costs over the next severalyears as we become more energy and carbon efficient through our investments and resource conservation program (ReCon). Forexample, in 2017, we made key investments in high efficiency lighting, building management systems, solar photovoltaics,combined heat and power plants, and converted our last coal boiler in the U.S. to fire on natural gas.
Cost of management62000
CommentWe have integrated monitoring systems to collect and analyze data, which are then subjected to external auditing by BureauVeritas. The cost associated with administrating the annual environmental sustainability data analysis, including personnel time andthe expense of the external auditing firm, is approximately $62,000.
IdentifierRisk 2
Where in the value chain does the risk driver occur?Direct operations
Risk typeTransition risk
Primary climate-related risk driverPolicy and legal: Increased pricing of GHG emissions
Type of financial impact driverPolicy and legal: Increased operating costs (e.g., higher compliance costs, increased insurance premiums)
Company- specific descriptionBiofuel mandates, gasoline taxes and other taxes and regulations designed to lower the carbon profile of primary energy may affectour costs for energy and/or raw material inputs. For example emerging clean fuel standard regulation in Canada can impact ouroperating costs for our company-owned fleet in this country, as well as increase costs for third party logistics procurement fordistribution of our products.
CDP Page of 9414

Time horizonShort-term
LikelihoodMore likely than not
Magnitude of impactMedium
Potential financial impact630000000
Explanation of financial impactApproximately 1% of net revenue could be at risk due to regulation and commodity inflation, which for 2017 net revenue couldequate to approximately $0.63 billion.
Management methodManagement efforts of our Global Public Policy and Government Affairs (PPGA) teams are to inform regulatory process andfacilitate effective rule implementation within PepsiCo. The teams monitor new regulations around the globe to better preparePepsiCo and help mitigate the inherent financial risks associated with fuel/energy taxes and regulations. Additionally, teammembers engage with lawmakers and other stakeholders in the regulatory process and also submit official comments in an effort toachieve desired environmental goals while avoiding detrimental impacts on the business community. For example, in 2017, webecame the founding members of the Climate Leadership Council to promote a carbon dividends framework as the most cost-effective, equitable and politically-viable climate solution.
Cost of management0
CommentNo additional management costs. These costs are embedded into our global policy monitoring process.
IdentifierRisk 3
Where in the value chain does the risk driver occur?Supply chain
Risk typePhysical risk
Primary climate-related risk driverChronic: Changes in precipitation patterns and extreme variability in weather patterns
Type of financial impact driverReduced revenue from decreased production capacity (e.g., transport difficulties, supply chain interruptions)
Company- specific descriptionMean precipitation increases or decreases could lead to change in supply patterns for key crops such as potatoes, oranges andoats, potentially higher transportation costs, potentially higher commodity costs and uncertainty of crop availability. Wecontinuously monitor our operations and sourcing from high water risk areas using the Aqueduct tool from the World ResourcesInstitute (WRI), as well as internal assessments. Our Sustainable Agriculture team is working with our growers in these high waterrisk areas to improve agricultural water use efficiency as part of our Performance with Purpose (PwP) objectives in the supplychain.
Time horizonMedium-term
LikelihoodMore likely than not
Magnitude of impactHigh
Potential financial impact1000000000
Explanation of financial impactChanges in average precipitation can disrupt crop yields and locations. Such an event could significantly impact PepsiCo’srevenues with increased commodity prices and transportation costs. Using a hypothetical example, financial implications could
CDP Page of 9415

include a significant loss of agricultural raw material supply up to order of 10% which would equate to $1 billion against an annualspend of about $10 billion according to 2015 procurement data. Our hedging costs could vary drastically due to an increase inperceived risk in the commodity markets.
Management methodPepsiCo’s goal is to operate in a sustainable manner and has undertaken several initiatives to manage the risk of consumer buyinghabits while simultaneously lessening our dependence upon climate-sensitive commodities. For example, to adapt to and mitigatethe temperature and precipitation impact, PepsiCo has implemented our Sustainable Farming Program (SFP) (formerly ourSustainable Farming Initiative, or SFI) which enables our company-owned and contract growers to compete in a resourceconstrained future. We have invested in programs to improve water efficiency in water stressed regions, enhance soil health andimprove farm yields and resiliency at the same time.
Cost of management7800000
CommentPepsiCo investments in improving crop yields are proprietary. PepsiCo has a corporate Sustainable Agriculture team in placecomprising a Vice President, Director and Manager. The team is supported by agriculture experts in our business divisions inimplementing sustainable agriculture practices at our key crop suppliers.
IdentifierRisk 4
Where in the value chain does the risk driver occur?Direct operations
Risk typeTransition risk
Primary climate-related risk driverReputation: Increased stakeholder concern or negative stakeholder feedback
Type of financial impact driverReputation: Reduced revenue from decreased demand for goods/services
Company- specific descriptionAny negative perception (whether valid or not) of PepsiCo’s response to climate change or water scarcity could result in adversepublicity and could adversely affect PepsiCo’s business, financial condition or results of operations. For example, our company hasfaced accusations related to our palm oil supply chain and our efforts to address both environmental and social sustainability withinthe space.
Time horizonMedium-term
LikelihoodMore likely than not
Magnitude of impactHigh
Potential financial impact1600000000
Explanation of financial impactPepsiCo’s reputation and the behavior of consumers in choosing our products are important to the market value and revenuegeneration of the Company. Changes in consumer preference, for example, due to a negative reaction to PepsiCo’s reputationrelative to the environment could adversely affect PepsiCo’s business, for example, a one percent impact on PEP’s market value(defined as our market capitalization) would equate to ~$1.6 billion.
Management methodTo make consumers aware that PepsiCo’s goal is to operate in a sustainable manner, we undertook several initiatives to managethe risk of consumer buying habits while simultaneously reducing our dependence upon climate-sensitive commodities. Forexample, in 2016, we publicly expressed our support for the Paris climate agreement and published an aggressive, science basedgoal, to reduce absolute GHG emissions by 20% by 2030 across our entire value chain. In packaging, our Packaging AdvanceResearch (PAR) team created a Life Cycle Analysis (LCA) tool utilizing ISO 14040/44 and PAS 2050 standards. PepsiCo uses thefindings and tool capabilities to: incorporate life cycle thinking in our day-to-day Research & Development (R&D) data-baseddecision making; develop our strategy around sustainable beverage packaging; and identify pathways that help lower our carbonfootprint. PepsiCo has a supplier outreach program to help drive energy conservation with strategic suppliers and franchise
CDP Page of 9416

operations in the U.S., Mexico, Latin America, South America and Western Europe. Additionally, we are a member of the CDPSupply Chain.
Cost of management1000000
CommentPepsiCo’s Global PPGA team manages regulatory issues with governments and stakeholders around the world. A significantamount of time, equivalent to five full-time employees (FTEs), is spent on climate change-related issues. Over 1,000 people arealso involved in developing, assessing and delivering all the aspects of our company wide cross functional climate change strategy.The direct costs associated with the program are approximately $1 million per year according to 2015 data.
C2.4
(C2.4) Have you identified any climate-related opportunities with the potential to have a substantive financial or strategicimpact on your business?Yes
C2.4a
(C2.4a) Provide details of opportunities identified with the potential to have a substantive financial or strategic impact onyour business.
IdentifierOpp1
Where in the value chain does the opportunity occur?Direct operations
Opportunity typeResilience
Primary climate-related opportunity driverParticipation in renewable energy programs and adoption of energy-efficiency measures
Type of financial impact driverIncreased reliability of supply chain and ability to operate under various conditions
Company- specific descriptionVoluntary agreements on climate change mitigation, such as the Paris Climate Agreement and We Mean Business, represent anopportunity for PepsiCo to make our operations and supply chains more energy efficient through efforts to reduce emissions. UnderPepsiCo’s Performance with Purpose (PwP) strategy we are already implementing programs to reduce greenhouse gas (GHG)emissions. Through our GHG mitigation programs, such as our Resource Conservation (ReCon) program within our own facilitiesand our supplier outreach programs we are more likely than not to be able to rapidly meet the requirements of voluntary programsand our own goals.
Time horizonShort-term
LikelihoodMore likely than not
Magnitude of impactMedium-low
Potential financial impact1600000000
Explanation of financial impactFinancial benefits of positioning our business to rapidly implement voluntary agreements, such as the Paris Climate Agreement,include savings from energy efficiency projects and reputational benefits that translate into increased sales, and potential forincreased investor goodwill. For example, a one percent impact on PEP’s market value (defined as our market capitalization)would equate to approximately $1.6 billion.
CDP Page of 9417

Strategy to realize opportunityPepsiCo has positioned itself advantageously versus competitors by actively promoting our PwP program to communicate itsproactive approach to sustainability issues. Our second generation PwP goals were announced in 2016 and include industry-leading goals to reduce GHG emissions across our value chain. We believe that delivering these goals will lead to enhancedreputation, more sustainable growth and financial performance that outperform our competitors. For example, since 2007 we haveupgraded our coolers and vending machines to be 60% more energy efficient, saving our customers approximately $18 million onaverage annual energy costs.
Cost to realize opportunity1000000
CommentPepsiCo’s Global Public Policy and Government Affairs teams manage regulatory issues with governments and stakeholdersaround the world. A significant amount of time, equivalent to five full-time employees (FTE)s, is spent on climate change relatedissues. Over 1,000 people are also involved in developing, assessing and delivering the program at the corporate level and our 300sites. The direct costs associated with the program are approximately $1 million per year according to 2015 data.
IdentifierOpp2
Where in the value chain does the opportunity occur?Supply Chain
Opportunity typeProducts and services
Primary climate-related opportunity driverDevelopment of new products or services through R&D and innovation
Type of financial impact driverIncreased revenue through new solutions to adaptation needs (e.g., insurance risk transfer products and services)
Company- specific descriptionClimate change in terms of temperature extremes, change in mean precipitation, precipitation patterns, droughts and floods andchanges in natural resources all impact agriculture and present opportunities for PepsiCo as a food and beverage company thatrelies on agriculture. The unique knowledge PepsiCo has of potatoes, oranges, sugar and oats could be a strategic opportunity forPepsiCo in locations such as the UK and the U.S., as we develop new strains of our core commodities, allowing us to realize apositive impact from our sustainable agriculture activities.
Time horizonMedium-term
LikelihoodMore likely than not
Magnitude of impactMedium-high
Potential financial impact1000000000
Explanation of financial impactThe total potential exposure to our ingredients/agriculture due to changes in climate could be hypothetically in excess of $1 billionper year which is 10% of an annual spend of $10 billion according to 2015 procurement data. PepsiCo's ability to sustain andrestore its supply chain in the likelihood of disruptive events could enable the Company to hedge cost increases lower thananticipated and reduce disruptions in product availability. This could potentially result in a competitive advantage.
Strategy to realize opportunityOur management method to realize this opportunity is to continue implementation and scale-up of our Sustainable FarmingProgram (SFP) (formerly our Sustainable Farming Initiative, or SFI). Through SFP, we have invested in programs to improve waterefficiency and soil health while improving crop yields and overall farm resilience. For example, with farmers in the UK from 2010 to2015, we reduced the amount of carbon dioxide equivalent (CO2e) that arises from growing our core crops by 50% in high waterrisk sourcing areas. The aim of this work is to expand key learnings and initiatives into our European agricultural supply chain. In2017, this included incorporating the Cool Farm Tool, an on-farm carbon calculator, into grower management practices, and dripirrigation, which aims to increase yields while using significantly less water than traditional irrigation techniques.
Cost to realize opportunity
CDP Page of 9418

7800000
CommentPepsiCo investments in improved crop yield are proprietary. PepsiCo has a corporate Sustainable Agriculture team in placecomprising a Vice President, Director and Manager who are supported by agriculture experts in our business divisions inimplementing sustainable agriculture practices at our key crop suppliers.
IdentifierOpp3
Where in the value chain does the opportunity occur?Direct operations
Opportunity typeProducts and services
Primary climate-related opportunity driverShift in consumer preferences
Type of financial impact driverBetter competitive position to reflect shifting consumer preferences, resulting in increased revenues
Company- specific descriptionPepsiCo’s response to climate change could be an opportunity for increased sales and demand for product if consumers respondfavorably to our climate change initiatives. Through our annual materiality assessment we identify, prioritize and validate topics thatare material to our stakeholders and consumers. Energy and climate is a topic that was deemed material in 2017 and, therefore, isan area we will continue to monitor and manage in order to maintain a favorable position with our stakeholders.
Time horizonMedium-term
LikelihoodMore likely than not
Magnitude of impactMedium-high
Potential financial impact1600000000
Explanation of financial impactPepsiCo’s reputation and the behavior of consumers in choosing our products are important to the market cap and revenuegeneration of the Company. The 2017 net revenues for PepsiCo were more than $63 billion. PepsiCo revenues are sensitive tochanges in consumer preferences. For example, a one percent impact on PEP’s market value (defined as our marketcapitalization) would equate to ~$1.6 billion. Changes in consumer preferences, for example, due to a positive reaction toPepsiCo’s reputation, and the reputation of its products relative to the environment, could positively affect PepsiCo’s business,financial condition or results of operations although it would be difficult to precisely identify the driving factors causing a change inconsumer behavior.
Strategy to realize opportunityPepsiCo has positioned itself advantageously versus competitors by adopting and implementing our PwP program. Our secondgeneration PwP goals were announced in 2016 and include industry-leading goals to reduce GHG emissions across our valuechain. We continue to report against this goal annually in our Sustainability Report. In 2017, through various activities within ouroperations and our supply chain, we have reduced GHG emissions more than 2 million metric tons. For example, our Frito-LayNorth America Compressed Natural Gas (CNG) fleet drove 63 million miles in 2017, and has driven over 211 million miles life-to-date. Today, 42 percent of our Over-the-Road fleet in Frito-Lay North America has been converted to CNG. We believe thatcontinuing to deliver on these goals will lead to enhanced reputation, more sustainable growth and financial performance that willoutperform our competitors.
Cost to realize opportunity1000000
CommentPepsiCo has a corporate Sustainable Agriculture team in place comprising a Vice President, Director and Senior Manager which issupported by agriculture experts in our business divisions in implementing sustainable agriculture practices at our key cropsuppliers. Over 1,000 people are also involved in developing, assessing and delivering all the aspects of our company-wide cross-functional climate change strategy. The direct costs associated with the program are approximately $1 million per year according to2015 data.
CDP Page of 9419

C2.5
(C2.5) Describe where and how the identified risks and opportunities have impacted your business.
Impact Description
Productsandservices
Impactedfor somesuppliers,facilities,orproductlines
Any negative perception (whether valid or not) of PepsiCo’s response to climate change, sustainable packaging or water scarcity couldresult in adverse publicity and could adversely affect PepsiCo’s business, financial condition or results of operations. For example, a onepercent impact on PEP’s market value (defined as our market capitalization) would equate to ~$1.6 billion.. Mean precipitation increaseswould force the Company to change supply patterns for key crops such as potatoes, oranges and oats, increasing transportation costs,potentially increasing commodity costs and uncertainty of crop availability. To indicate the magnitude, financial implications could include asignificant loss of agricultural raw material supply hypothetically in the order of 10% which would equate to $1 billion against an annualspend of about $10 billion according to 2015 procurement data. Climate change in terms of temperature extremes, change in meanprecipitation, precipitation patterns, droughts and floods and changes in natural resources all impact agriculture and present opportunitiesfor PepsiCo as a food and beverage company that relies on agriculture. The unique knowledge PepsiCo has of potatoes, oranges, sugarand oats could be a strategic opportunity for PepsiCo in locations such as the UK and the U.S., as we develop new strains of our corecommodities, allowing us to realize a positive impact from our sustainable agriculture activities. PepsiCo’s response to climate change couldbe an opportunity for increased sales and demand for product if consumers respond favorably to our climate change initiatives.
Supplychainand/orvaluechain
Impactedfor somesuppliers,facilities,orproductlines
Mean precipitation increases would force the Company to change supply patterns for key crops such as potatoes, oranges and oats,increasing transportation costs, potentially increasing commodity costs and uncertainty of crop availability. To indicate the magnitude,financial implications could include a significant loss of agricultural raw material supply hypothetically in the order of 10% which wouldequate to $1 billion against an annual spend of about $10 billion according to 2015 procurement data. Climate change in terms oftemperature extremes, change in mean precipitation, precipitation patterns, droughts and floods and changes in natural resources all impactagriculture and present opportunities for PepsiCo as a food and beverage company that relies on agriculture. The unique knowledgePepsiCo has of potatoes, oranges, sugar and oats could be a strategic opportunity for PepsiCo in locations such as the UK and the U.S.,as we develop new strains of our core commodities, allowing us to realize a positive impact from our sustainable agriculture activities.
Adaptationandmitigationactivities
Impacted PepsiCo’s goal is to operate in a sustainable manner and has undertaken several initiatives to manage the risk of changing consumerbehavior due to climate-related impacts while simultaneously lessening our dependence upon climate-sensitive commodities. For example,to adapt to and mitigate the risk in temperature and precipitation impact, PepsiCo has implemented our Sustainable Farming Program (SFP)(formerly our Sustainable Farming Initiative, or SFI), which enables our company-owned and contract growers to compete in a resourceconstrained future. We have invested in programs to reduce water usage, replace synthetic fertilizer and improve farm yields at the sametime. To indicate the magnitude, the overall cost of management of this program is up to $7.8 million. In 2016, we publicly expressed oursupport for the Paris Climate Agreement and published an aggressive, science based goal, to reduce absolute GHG emissions by 20% by2030 across our entire value chain. In packaging, our Packaging Advance Research (PAR) team created a Life Cycle Analysis (LCA) toolutilizing ISO 14040/44 and PAS 2050 standards. PepsiCo uses the findings and tool capabilities to: incorporate life cycle thinking in ourday-to-day R&D data-based decision making on sustainable packaging; develop our strategy around sustainable beverage packaging; andidentify pathways that help lower our carbon footprint. PepsiCo has a supplier outreach program to help drive energy conservation withstrategic suppliers and franchise operations in the U.S., Mexico, Latin America, South America and Western Europe. Additionally, we are amember of CDP Supply Chain.
Investmentin R&D
Impacted Our packaging represents a significant portion of our company-wide emission profile. In packaging, our Packaging Research & Developmentteam created a Life Cycle Analysis (LCA) tool utilizing ISO 14040/44 and PAS 2050 standards. PepsiCo uses the findings and toolcapabilities to incorporate life cycle thinking in our day-to-day R&D data-based decision making on sustainable packaging. We continue tomaintain and update these tools for our packaging analyses and to indicate the magnitude; in 2017 we spent approximately $100,000.
Operations Impacted To reduce carbon emissions, and address the potential financial risks of cap and trade, PepsiCo invests in energy efficiency and other cleanenergy technologies. We also work to see that our facilities have environmental management systems in place and are aligned with ISO14001. We expect these efforts to reduce the risk to our business from increased operational costs over the next several years as webecome more energy and carbon efficient through our investments. We have integrated monitoring systems to collect and analyzeenvironmental data, which are then subjected to external auditing by Bureau Veritas. As an indication of the potential magnitude, thesemanagement costs could be up to $100 million every year.
Other,pleasespecify
Pleaseselect
C2.6
CDP Page of 9420

(C2.6) Describe where and how the identified risks and opportunities have factored into your financial planning process.
Relevance Description
Revenues Impacted Changes in average precipitation can disrupt crop yields and locations. Such an event could adversely impact PepsiCo revenues withincreased commodity prices and transportation costs. To indicate the magnitude, financial implications could hypothetically include asignificant loss of agricultural raw material supply in the order of 10% which would equate to $1 billion against an annual spend of about$10 billion according to 2015 procurement data. Our hedging costs could vary drastically due to an increase in perceived risk in thecommodity markets. PepsiCo’s reputation and the behavior of consumers in choosing our products are important to the market value andrevenue generation of the Company. Changes in consumer preference, for example, due to a negative reaction to PepsiCo’s reputationrelative to the environment could adversely affect PepsiCo’s business, for example, a one percent impact on PEP’s market value(defined as our market capitalization) would equate to ~$1.6 billion.Financial benefits of positioning the business to rapidly implementvoluntary agreements, such as the Paris Climate Agreement, include savings from energy efficiency projects and reputational benefitsthat translate into increased sales, and potential for increased investor goodwill.
Operatingcosts
Impacted The cost of complying with cap and trade schemes will vary based on the market price of the allowances, as well as any changes inallocation. In the event that regulation is enacted and is more aggressive than the sustainability measures that we are currentlyundertaking to monitor our emissions and improve our energy efficiency, we may experience increases in our costs of operation anddelivery. As an indication of magnitude, approximately 1% of net revenue could be at risk due to regulation and commodity inflation,which for 2017 net revenue could equate to approximately $0.63 billion.
Capitalexpenditures/ capitalallocation
Impacted We incorporate environmental sustainability criteria into our Capital Expenditure Filter, which is applied to all capital expenditure requestsover $5 million. Each request is reviewed not only against business financial metrics and value to advancing our business strategy butalso for the impact (positive or negative) that it will have on our environmental performance, including energy use and GHG emissions,and its contribution to our efforts to achieve our climate goal. As an indication of magnitude, our annual capital fund is $100 million.
Acquisitionsanddivestments
Impacted Our long-term strategy has been influenced by climate change through our merger and acquisition strategy. We have embeddedmechanisms to quantify the impact of growth and M&A activity on our ability to deliver our climate goal into our investment allocationprocesses, as well as integrating a requirement for business units to conduct a water-related risk assessment prior to any majoracquisition. The magnitude of financial impact for this is likely to be medium.
Access tocapital
Not yetimpacted
We are currently not experiencing any impact on access to capital due to the risks and opportunities identified. However, we arecognizant that this could potentially change in the future if we are unable to demonstrate responsible operations and addressing thevarious issues that are important to our stakeholders, including climate change. We expect to see these impacts either positive ornegative within 3-5 years.
Assets Impacted Mean precipitation and temperature increases or decreases would force the Company to change supply patterns for key crops such aspotatoes, oranges and oats, increasing transportation costs, potentially increasing commodity costs and uncertainty of crop availability.This could also lead to reduced level of operations at our manufacturing plants in high risk areas. To indicate the magnitude, financialimplications could hypothetically include a significant loss of agricultural raw material supply in the order of 10% which would equate to$1 billion against an annual spend of about $10 billion according to 2015 procurement data.
Liabilities Not yetimpacted
We are currently not experiencing any impact on our liabilities due to the risks and opportunities identified. However, we are cognizantthat this could potentially change in the future if we are unable to demonstrate responsible operations and addressing the various issuesthat are important to our stakeholders, including climate change. For example, a production location whose water source is threateneddue to drought could move from an asset to a liability if we are forced to close the plant. We expect to see these impacts either positiveor negative within 3-5 years.
Other Pleaseselect
C3. Business Strategy
C3.1
(C3.1) Are climate-related issues integrated into your business strategy?Yes
C3.1a
(C3.1a) Does your organization use climate-related scenario analysis to inform your business strategy?No, but we anticipate doing so in the next two years
C-AC3.1b/C-CE3.1b/C-CH3.1b/C-CO3.1b/C-EU3.1b/C-FB3.1b/C-MM3.1b/C-OG3.1b/C-PF3.1b/C-
CDP Page of 9421

ST3.1b/C-TO3.1b/C-TS3.1b)
(C-AC3.1b/C-CE3.1b/C-CH3.1b/C-CO3.1b/C-EU3.1b/C-FB3.1b/C-MM3.1b/C-OG3.1b/C-PF3.1b/C-ST3.1b/C-TO3.1b/C-TS3.1b)Indicate whether your organization has developed a low-carbon transition plan to support the long-term business strategy.Yes
C3.1c
(C3.1c) Explain how climate-related issues are integrated into your business objectives and strategy.
(i) PepsiCo has identified climate change as a business risk through our Integrated Risk Management Framework, a process thatidentifies, assesses, prioritizes, manages, and monitors the risks affecting the Company across its operations. The identification ofclimate change as a key risk has influenced our business strategy in the following ways: 1) We have integrated a greenhouse gas(GHG) reduction target into our Performance with Purpose (PwP) strategy, PepsiCo’s vision to deliver top-tier financial performanceover the long term by integrating sustainability into our business 2) Climate strategy and actions are reviewed and managed in thecontext of our short and long term business strategy 3) Climate change risks are included in our Annual Report on Form 10-K.Several aspects of climate change have influenced our strategy, including a) the need for our business to adapt to a changingenvironment driven by rising temperatures and fluctuating weather patterns that may affect our supply chain; and b) the opportunity todevelop a product portfolio that includes fewer GHG-intensive and water-intensive products. Our long-term strategy has beeninfluenced by climate change through our merger and acquisition strategy. We have embedded mechanisms to quantify the impact ofgrowth and M&A activity on our ability to deliver our Climate goal into our investment allocation processes, as well as integrating arequirement for business units to conduct a water-related risk assessment prior to any major acquisition.
(ii) We have integrated a GHG reduction target into our PwP strategy – announced in 2016, our new environmental goals reach wellbeyond our direct manufacturing operations, enabling us to focus on working to reduce environmental impacts across our value chain— beginning with a product’s sourcing and extending through its use. Our climate goal is to reduce GHG emissions by 20% by 2030across our value chain in absolute terms compared to our 2015 baseline. We established this goal because we recognize that as theworld’s population grows and the demand for water and energy increases, continuing a business as usual approach will driveincreased GHG emissions, which is predicted to further accelerate climate change and potentially put crops and other raw materialsthat PepsiCo needs at increased risk. We believe that our climate change strategy is industry-leading and will support our efforts tobuild PepsiCo’s reputation as a leader in environmental sustainability, potentially translating into competitive advantage with ourcustomers and consumers.
(iii) We continued to make progress towards our goal in 2017 by continuing to integrate our emissions reduction objectives under thegoal into our business strategies in our focus areas of agriculture, packaging, manufacturing and transportation and distribution. Forall of these areas, in 2017, we have begun incorporating the cost of implementation within our annual, as well as five-year businessplans. We are investing in a variety of actions across our operations, including energy efficiency improvements driven by ourResource Conservation (ReCon) program, a comprehensive, global platform of resources, tools and programs designed to improveenergy, water and waste efficiencies in our manufacturing processes. Our Frito-Lay North America Compressed Natural Gas (CNG)fleet drove 63 million miles in 2017, and has driven over 211 million miles life-to-date. Today, 42 percent of our Over-the-Road fleetin Frito-Lay North America has been converted to CNG. Continued implementation of our higher efficiency coolers and vendingmachines, involving the replacement of retired units with more efficient point-of-sale equipment, reduced the GHG emissions fromthese sources by over 700,000 metric tons during this reporting year when compared to estimated emissions by the now-retiredmachines during the prior year. Our Sustainable Farming Program (SFP) (formerly our Sustainable Farming Initiative, or SFI), whichwe believe reflects industry best practice, is designed to help position us and our farmers to compete more effectively in a resource-constrained future. Through the program, we are working with our farmers to reduce climate change impacts of farming practices,improve soil health, and improve water use efficiency.
C-AC3.1e/C-CE3.1e/C-CH3.1e/C-CO3.1e/C-EU3.1e/C-FB3.1e/C-MM3.1e/C-OG3.1e/C-PF3.1e/C-ST3.1e/C-TO3.1e/C-TS3.1e
CDP Page of 9422

(C-AC3.1e/C-CE3.1e/C-CH3.1e/C-CO3.1e/C-EU3.1e/C-FB3.1e/C-MM3.1e/C-OG3.1e/C-PF3.1e/C-ST3.1e/C-TO3.1e/C-TS3.1e)Disclose details of your organization’s low-carbon transition plan.
At the heart of PepsiCo is Performance with Purpose (PwP) – our goal to deliver top-tier financial performance while creatingsustainable growth and shareholder value. In practice, PwP means providing a wide range of foods and beverages from treats tonutritious eats; trying to find innovative ways to reduce our impact on the environment and lower our operating costs; working toprovide a safe and inclusive workplace for our employees globally; and respecting, supporting and investing in the local communitieswhere we operate. As part of our PwP agenda, we are working towards a goal of reducing our emissions across our value chain by20% by 2030 against a 2015 baseline. Through the efforts that are required to deliver on our goal, we are not only thinking of progressagainst our goals, but also taking the opportunity to embed a culture of evaluating our business practices and strategies through agreenhouse gas (GHG) lens. Through our first generation PwP goals and continuing with our current agenda, our teams within directmanufacturing, as well as non-manufacturing operations are continuously working towards lowering our carbon emissions throughenergy efficiency and renewable energy measures. We are also working within our supply chain through various measures in theareas of agriculture, packaging, transportation and distribution and supplier operations to lower carbon emissions and use alternativematerials with lower carbon impact. For example, we are exploring alternative packaging materials for our rigid as well as flexiblepackaging film that will be sourced from renewable materials.
In addition to this, we are working to incorporate sustainability and carbon impact as a metric during our new product developmentprocess. This initiative will help our internal teams within the R&D, Marketing and Commercialization functions to choose productingredients, packaging materials, etc. that have a lower carbon impact than existing choices. Over time, this will help not onlycontinuously improve our portfolio but transform our business towards being low carbon impact.
C3.1g
(C3.1g) Why does your organization not use climate-related scenario analysis to inform your business strategy?
Climate-related scenario analysis is not currently used to inform our business strategy since we have developed and set a ScienceBased Target (SBT) to manage our emissions and transition our business from a business-as-usual scenario to one where ourbusiness growth and emissions do not follow the same trajectory. As part of the process for setting an SBT target, we conducted acomplete assessment of our emissions for all three scopes. We then performed scenario analysis to determine the future projectionof our emission. This helped inform our strategy for our absolute emission reduction target, as well as our priority areas of work toreduce emissions. Under our Performance with Purpose (PwP) agenda for climate, we continue to conduct projections of ouremissions and emission reductions to inform our performance towards our goal, as well as to build our strategies in the various areasof our business.
In the future, we may look to incorporate climate-related scenario analysis to further inform our business strategy and goal. Scenarioanalysis could not only help us determine possible futures but also help us identify additional pathways and technologies for emissionreduction.
C4. Targets and performance
C4.1
(C4.1) Did you have an emissions target that was active in the reporting year?Absolute target
C4.1a
(C4.1a) Provide details of your absolute emissions target(s) and progress made against those targets.
CDP Page of 9423

Target reference numberAbs 1
ScopeScope 1 +2 (market-based)
% emissions in Scope100
% reduction from base year20
Base year2015
Start year2016
Base year emissions covered by target (metric tons CO2e)5568960
Target year2030
Is this a science-based target?Yes, this target has been approved as science-based by the Science-Based Targets initiative
% achieved (emissions)11
Target statusUnderway
Please explainThese early years of our reduction strategy have been focused on building capability and making early investments in technology.Any benefits of which will take effect over time, and are not expected immediately.
Target reference numberAbs 2
ScopeScope 3 (upstream & downstream)
% emissions in Scope100
% reduction from base year20
Base year2015
Start year2016
Base year emissions covered by target (metric tons CO2e)63000000
Target year2030
Is this a science-based target?Yes, this target has been approved as science-based by the Science-Based Targets initiative
% achieved (emissions)6.9
Target statusUnderway
Please explain
CDP Page of 9424

These early years of our reduction strategy have been focused on building capability and making early investments in technology,any benefits of which will take effect over time, and are not expected immediately.
C4.2
(C4.2) Provide details of other key climate-related targets not already reported in question C4.1/a/b.
TargetWaste
KPI – Metric numeratorWaste sent to landfill
KPI – Metric denominator (intensity targets only)Total waste generated
Base year2015
Start year2016
Target year2025
KPI in baseline year7.8
KPI in target year0.99
% achieved in reporting year
Target StatusUnderway
Please explainOur Performance with Purpose (PwP) 2025 goal is to strive to achieve zero waste to landfill in our direct operations by 2025. Wastereduction, in all its forms, is a strategic imperative for PepsiCo, for the benefit it provides to our business in the form of cost savingsand efficiencies gained. It is also inherent to being a good citizen of the communities where we operate, by working to reduce ourenvironmental footprint. In every community where we operate, we are working to minimize the amount of waste that we send tolandfill. It is a journey that we have been on as a company since the very beginning of PwP, and year over year, we are makingsteady progress.
Part of emissions targetABS2
Is this target part of an overarching initiative?Other, please specify (Zero waste to landfill)
TargetLand use
KPI – Metric numeratorVolume of commodity that is sustainably sourced
KPI – Metric denominator (intensity targets only)Total volume of commodity purchased
Base year2015
Start year2016
Target year
CDP Page of 9425

2020
KPI in baseline year0
KPI in target year100
% achieved in reporting year
Target StatusUnderway
Please explainPepsiCo sources dozens of agricultural ingredients from farmers around the world for our products, both directly and indirectly. OurSustainable Farming Program (SFP) (formerly our Sustainable Farming Initiative, or SFI) is a program we use to engage withgrowers on farms, of all sizes and types, around the world in order to encourage continual improvement in sustainable farmingpractices, expand respect for workers' human rights, enhance growers' capabilities, and address risks. Through the SFP, we striveto sustainably source virtually all of our direct agricultural raw materials that we purchase from PepsiCo long-term growers by 2020.In addition to our core agricultural raw materials that we directly source, there are a number of other raw materials that we procurethrough shared supply chains, such as palm oil, cane sugar, wheat and cornmeal. We intend to sustainably source our majorindirect agricultural raw materials by 2025, and cane sugar and palm oil by 2020.
Part of emissions targetABS2
Is this target part of an overarching initiative?Other, please specify (Sustainable Sourcing)
TargetOther, please specify (Sustainable Packaging)
KPI – Metric numeratorVolume of packaging material that is recyclable, compostable or biodegradable
KPI – Metric denominator (intensity targets only)Total volume of packaging materials
Base year2015
Start year2016
Target year2025
KPI in baseline year87
KPI in target year100
% achieved in reporting year
Target StatusUnderway
Please explainAs part of our PwP 2025 agenda, we have set the following goals related to packaging: • Strive to design 100% of our packaging tobe recyclable, compostable or biodegradable • Increase recycled materials in our plastic packaging • Reduce packaging's carbonimpact • In partnership with the PepsiCo Foundation, work to increase recycling rates
Part of emissions targetABS2
Is this target part of an overarching initiative?Other, please specify (Sustainable Packaging)
CDP Page of 9426

C4.3
(C4.3) Did you have emissions reduction initiatives that were active within the reporting year? Note that this can includethose in the planning and/or implementation phases.Yes
C4.3a
(C4.3a) Identify the total number of projects at each stage of development, and for those in the implementation stages, theestimated CO2e savings.
Number of projects Total estimated annual CO2e savings in metric tonnes CO2e (only for rows marked *)
Under investigation 500 0
To be implemented* 250 300000
Implementation commenced* 200 130000
Implemented* 150 84000
Not to be implemented 100 0
C4.3b
(C4.3b) Provide details on the initiatives implemented in the reporting year in the table below.
Activity typeEnergy efficiency: Building services
Description of activityBuilding controls
Estimated annual CO2e savings (metric tonnes CO2e)1100
ScopeScope 1
Voluntary/MandatoryVoluntary
Annual monetary savings (unit currency – as specified in CC0.4)187500
Investment required (unit currency – as specified in CC0.4)1500000
Payback period4 - 10 years
Estimated lifetime of the initiative21-30 years
CommentHVAC
Activity typeEnergy efficiency: Building services
Description of activityBuilding controls
CDP Page of 9427

Estimated annual CO2e savings (metric tonnes CO2e)24000
ScopeScope 2 (market-based)
Voluntary/MandatoryVoluntary
Annual monetary savings (unit currency – as specified in CC0.4)7123330
Investment required (unit currency – as specified in CC0.4)21370000
Payback period1-3 years
Estimated lifetime of the initiative21-30 years
CommentHVAC Lighting Motors and Drives
Activity typeEnergy efficiency: Processes
Description of activityHeat recovery
Estimated annual CO2e savings (metric tonnes CO2e)45870
ScopeScope 1
Voluntary/MandatoryVoluntary
Annual monetary savings (unit currency – as specified in CC0.4)6987500
Investment required (unit currency – as specified in CC0.4)55900000
Payback period4 - 10 years
Estimated lifetime of the initiative21-30 years
CommentFuel switching Combined Heat & Power Machine Replacement
Activity typeEnergy efficiency: Processes
Description of activityCompressed air
Estimated annual CO2e savings (metric tonnes CO2e)11840
ScopeScope 2 (market-based)
Voluntary/MandatoryVoluntary
Annual monetary savings (unit currency – as specified in CC0.4)
CDP Page of 9428

497500
Investment required (unit currency – as specified in CC0.4)3980000
Payback period4 - 10 years
Estimated lifetime of the initiative21-30 years
CommentCombined Heat and Power Process optimization
Activity typeLow-carbon energy installation
Description of activityBiogas
Estimated annual CO2e savings (metric tonnes CO2e)540
ScopeScope 1
Voluntary/MandatoryVoluntary
Annual monetary savings (unit currency – as specified in CC0.4)12500
Investment required (unit currency – as specified in CC0.4)100000
Payback period4 - 10 years
Estimated lifetime of the initiative<1 year
Comment
Activity typeLow-carbon energy installation
Description of activitySolar PV
Estimated annual CO2e savings (metric tonnes CO2e)880
ScopeScope 2 (market-based)
Voluntary/MandatoryVoluntary
Annual monetary savings (unit currency – as specified in CC0.4)157500
Investment required (unit currency – as specified in CC0.4)1260000
Payback period4 - 10 years
Estimated lifetime of the initiative21-30 years
CDP Page of 9429

Comment
C4.3c
(C4.3c) What methods do you use to drive investment in emissions reduction activities?
Method Comment
Compliance withregulatoryrequirements/standards
PepsiCo’s policy is to comply with relevant regulatory standards, including climate change mitigation requirements.
Employee engagement Performance with Purpose (PwP) culture drives employee engagement and is supported by our Resource Conservation (ReCon) trainingprogram, which develops the environmental sustainability skills of our front-line resources. Our internal communications teams also deliverengagement through internal channels.
Financial optimizationcalculations
Certain business units drive energy efficiency by allocating budget reductions for available energy spends.
Internalincentives/recognitionprograms
PepsiCo has many internal incentives and recognition programs such as the Chairman’s Award, Circle of Champion’s Award, and PwPAwards amongst others, all of which can be awarded to individuals and sites that make a difference to our business operations and PwPagenda.
Internal financemechanisms
PepsiCo has established a global Capital Expenditures (Capex) fund for investment in projects that advance our PwP agenda but whichmay not meet desired internal rate of return hurdles.
Lower return oninvestment (ROI)specification
PepsiCo has established a global capex fund for investment in projects that advance our PwP agenda but which may not meet desiredinternal rate of return hurdles.
Partnering withgovernments ontechnologydevelopment
State level projects and partnering with the National Renewable Energy Laboratory in the U.S. have been examples of partnering withgovernment. Our external collaboration also extends to other Non-Governmental Organizations (NGOs) and institutions such as joiningthe Business Renewable Center and signing the World Resources Institute’s (WRI) Corporate Renewable Energy Buyers' Principles.
C-AC4.4/C-FB4.4/C-PF4.4
(C-AC4.4/C-FB4.4/C-PF4.4) Do you implement management practices on your own land with a climate change mitigationand/or adaption benefit?Yes
C-AC4.4a/C-FB4.4a/C-PF4.4a
CDP Page of 9430

(C-AC4.4a/C-FB4.4a/C-PF4.4a) Specify the agricultural or forest management practice(s) implemented on your own land withclimate change mitigation and/or adaptation benefits and provide a corresponding emissions figure, if known.
Management practice reference numberMP1
Management practiceCrop rotation
Description of management practiceThrough our Sustainable Farming Program (SFP) (formerly our Sustainable Farming Initiative, or SFI), growers are encouraged toimplement crop rotation practices to improve soil fertility, as well as manage pests.
Primary climate change-related benefitEmission reductions (mitigation)
Estimated CO2e savings (metric tons CO2e)1900000
Please explainEstimated emissions savings from implementing this management practice is represented in aggregate of all on-farm managementpractices planned that are able to deliver reductions by our goal year of 2030. Also supports ● Increasing resilience to climatechange (adaptation) ● Increase carbon sink (mitigation) ● Reduced demand for fossil fuel (adaptation) ● Reduced demand forfertilizers (adaptation) ● Reduced demand for pesticides (adaptation)
Management practice reference numberMP2
Management practiceFertilizer management
Description of management practiceThrough our SFP, growers are encouraged to manage fertilizers by incorporating into the soil using split application to minimizeNitrous Oxide emissions. Growers are encouraged to use tools to determine the amount of fertilizer to apply, as well as to useorganic fertilizer and low carbon fertilizers.
Primary climate change-related benefitEmission reductions (mitigation)
Estimated CO2e savings (metric tons CO2e)1900000
Please explainEstimated emissions savings from implementing this management practice is represented in aggregate of all on-farm managementpractices planned that are able to deliver reductions by our goal year of 2030. Also supports ● Increasing resilience to climatechange (adaptation) ● Increase carbon sink (mitigation) ● Reduced demand for fossil fuel (adaptation) ● Reduced demand forfertilizers (adaptation) ● Reduced demand for pesticides (adaptation)
C4.5
(C4.5) Do you classify any of your existing goods and/or services as low-carbon products or do they enable a third party toavoid GHG emissions?Yes
C4.5a
CDP Page of 9431

(C4.5a) Provide details of your products and/or services that you classify as low-carbon products or that enable a third partyto avoid GHG emissions.
Level of aggregationCompany-wide
Description of product/Group of productsPepsiCo provides refrigeration equipment, including coolers and vending machines, at the point of sale to our retail customersaround the world. Although PepsiCo retains ownership of the equipment, the electricity use is the responsibility of the retailer.Implementation of our Higher Efficiency Coolers and Vending Machine Program is positively impacting Scope 3 emissions throughthe replacement of retired units with more efficient point of sale equipment. During this reporting year, we estimate that replacementof existing units at customer locations with more energy efficient units resulted in an energy savings of over 1.5 billion kwh and aGHG reduction of 18% across our entire portfolio of units from the baseline year of 2015.
Are these low-carbon product(s) or do they enable avoided emissions?Avoided emissions
Taxonomy, project or methodology used to classify product(s) as low-carbon or to calculate avoided emissionsOther, please specify (Climate Registry and US EPA)
% revenue from low carbon product(s) in the reporting year1
CommentCalculation of emissions using Climate Registry or U.S. EPA emissions factors for the electricity grids available in country ofdeployment applied against average estimated usage for each type and compared to models available in previous years. The %revenue figure is total revenue from the vending category of our foodservice business.
C5. Emissions methodology
C5.1
CDP Page of 9432

(C5.1) Provide your base year and base year emissions (Scopes 1 and 2).
Scope 1
Base year startJanuary 1 2015
Base year endDecember 31 2015
Base year emissions (metric tons CO2e)3713440
Comment
Scope 2 (location-based)
Base year startJanuary 1 2015
Base year endDecember 31 2015
Base year emissions (metric tons CO2e)1838110
Comment
Scope 2 (market-based)
Base year startJanuary 1 2015
Base year endDecember 31 2015
Base year emissions (metric tons CO2e)1855520
Comment
C5.2
(C5.2) Select the name of the standard, protocol, or methodology you have used to collect activity data and calculate Scope1 and Scope 2 emissions.Energy Information Administration 1605BIPCC Guidelines for National Greenhouse Gas Inventories, 2006The Climate Registry: General Reporting ProtocolThe Greenhouse Gas Protocol: A Corporate Accounting and Reporting Standard (Revised Edition)US EPA Climate Leaders: Direct HFC and PFC Emissions from Manufacturing Refrigeration and Air Conditioning EquipmentUS EPA Climate Leaders: Indirect Emissions from Purchases/ Sales of Electricity and SteamUS EPA Climate Leaders: Direct Emissions from Stationary CombustionUS EPA Climate Leaders: Direct Emissions from Mobile Combustion SourcesOther, please specify (See below in 5.2a for details)
C5.2a
CDP Page of 9433

(C5.2a) Provide details of the standard, protocol, or methodology you have used to collect activity data and calculate Scope1 and Scope 2 emissions.
UK Department for Business, Energy & Industrial Strategy Greenhouse Gas Reporting – Conversion Factors 2016
The Greenhouse Gas Protocol Scope 2 Guidance
WRI/WBCSD Greenhouse Gas Protocol Corporate Value Chain (Scope 3) Accounting and Reporting Standard (Scope 3)
C6. Emissions data
C6.1
(C6.1) What were your organization’s gross global Scope 1 emissions in metric tons CO2e?
Row 1
Gross global Scope 1 emissions (metric tons CO2e)3734520
End-year of reporting period<Not Applicable>
Comment
C6.2
(C6.2) Describe your organization’s approach to reporting Scope 2 emissions.
Row 1
Scope 2, location-basedWe are reporting a Scope 2, location-based figure
Scope 2, market-basedWe are reporting a Scope 2, market-based figure
CommentWe are reporting against both methodologies; however we are measuring progress against our goals using the market basedmethodology. We do not currently have access to electricity supplier emissions factors or residual emissions factors for all markets,however, where they have been available (for example, in Europe) we have applied them to our market-based Scope 2 reportingfigure. We have also calculated our Scope 2 emissions based on location-based methodology so that we are able to judge theimpact of our reduction efforts against both methodologies.
C6.3
CDP Page of 9434

(C6.3) What were your organization’s gross global Scope 2 emissions in metric tons CO2e?
Row 1
Scope 2, location-based1746370
Scope 2, market-based (if applicable)1713950
End-year of reporting period<Not Applicable>
Comment
C6.4
(C6.4) Are there any sources (e.g. facilities, specific GHGs, activities, geographies, etc.) of Scope 1 and Scope 2 emissionsthat are within your selected reporting boundary which are not included in your disclosure?Yes
C6.4a
CDP Page of 9435

(C6.4a) Provide details of the sources of Scope 1 and Scope 2 emissions that are within your selected reporting boundarywhich are not included in your disclosure.
SourceOperational Control Farms and Dairies
Relevance of Scope 1 emissions from this sourceEmissions are not relevant
Relevance of location-based Scope 2 emissions from this sourceEmissions are not relevant
Relevance of market-based Scope 2 emissions from this source (if applicable)Emissions are not relevant
Explain why the source is excludedOur company’s farms in China and Egypt have not been evaluated as it is estimated that their contribution to our emissionsinventory is less than 1%. While we deem these not relevant in our overall emissions inventory, we do include these farms in ourSustainable Farming Program (SFP) (formerly our Sustainable Farming Initiative, or SFI), and are working to implement practicesthat improve overall farm health, as well as reduce greenhouse gas (GHG) emissions.
SourceInternational Offices/Warehouses (partial)
Relevance of Scope 1 emissions from this sourceEmissions are not relevant
Relevance of location-based Scope 2 emissions from this sourceEmissions are not relevant
Relevance of market-based Scope 2 emissions from this source (if applicable)Emissions are not relevant
Explain why the source is excludedA number of our small offices and distribution centers around the world have not been evaluated as it is estimated that theircontribution to our emissions inventory is estimated to be less than 1%.
SourceDe Minimis sources
Relevance of Scope 1 emissions from this sourceEmissions are not relevant
Relevance of location-based Scope 2 emissions from this sourceEmissions are not relevant
Relevance of market-based Scope 2 emissions from this source (if applicable)Emissions are not relevant
Explain why the source is excludedThe sum of excluded emissions from all sources is less than 5% of our inventory. PepsiCo strives to report 100% of significantoperations within its operational boundary. A de Minimis reporting threshold of 1% is applied to all activities. Estimatedcompleteness of the 2017 inventory is >95% as a percentage of total emissions.
C6.5
(C6.5) Account for your organization’s Scope 3 emissions, disclosing and explaining any exclusions.
CDP Page of 9436

Purchased goods and services
Evaluation statusRelevant, calculated
Metric tonnes CO2e39026490
Emissions calculation methodologyProduct-related purchased goods and services emissions. PepsiCo has conducted over 60 lifecycle analysis (LCA) or productcarbon footprints covering a representative sample of its overall product portfolio, which formed the basis for calculating emissionsin this category. These studies broke down the emissions of products by lifecycle phases, which included raw materials, packaging,incoming transport, manufacturing, retail and distribution, complementary products, use phase, end of life of packaging. Sales datawas collected globally across all regions of PepsiCo’s operations across all product categories and total volumes (liters for liquids,kg for solids) for all products were determined. All products were then matched to existing LCA-studied products where an exactmatch was available. Where an exact match was not possible, the closest proxy was used based on key attributes – product type,sugar type (if applicable), packaging type and packaging size. In this way, the total lifecycle carbon footprint of all products sold byPepsiCo in 2015 was calculated. Being total lifecycle, this covered the entire value chain, including activities both upstream anddownstream of PepsiCo. Specifically for this category “purchased goods and services”, this was determined to be the raw materialsand packaging portion of the overall lifecycle product carbon footprint of all PepsiCo products. For non-product purchased goodsand services, procurement data was collected on all non-product spend across the business, which included categories such as:services, IT, media, and facilities. The total spend on non-products was multiplied by environmentally extended input output (EEIO)emission factors to estimate emissions. Total emissions in this category are the sum of product and non-product related purchasedgoods and services emissions.
Percentage of emissions calculated using data obtained from suppliers or value chain partners50
ExplanationThis reflects the contribution of product related emissions to overall purchased goods and services emissions. Product-relatedemissions were calculated by reference to lifecycle product carbon footprint studies, which obtained data directly from suppliers.Non-product related purchased goods and services emissions, were estimated based on procurement spend, rather than directlyprocuring data from suppliers and others in our value chain. All Scope 3 estimates are based on 2015 sales volumes and will beupdated every 5 years going forward.
Capital goods
Evaluation statusRelevant, calculated
Metric tonnes CO2e1698930
Emissions calculation methodologyFor capital goods, procurement data was collected on all capital spending in 2015 and the total spend was multiplied by EEIOemission factors to estimate emissions.
Percentage of emissions calculated using data obtained from suppliers or value chain partners0
ExplanationEmissions in this category were estimated based on procurement spend, rather than directly procuring data from suppliers andothers in our value chain. All Scope 3 estimates are based on 2015 sales volumes and will be updated every 5 years going forward.
CDP Page of 9437

Fuel-and-energy-related activities (not included in Scope 1 or 2)
Evaluation statusRelevant, calculated
Metric tonnes CO2e603560
Emissions calculation methodologyThe starting point in this category was the total emissions calculated for all PepsiCo products (see section Purchased goods andservices). The next step was to isolate emissions from the manufacturing phase for all PepsiCo products. Being total lifecycle,emissions from the manufacturing phase includes Scope 1, Scope 2 and fuel and energy-related activities not included in Scope 1or 2 (e.g., extraction and transportation of fuels, transmission and distribution losses of electricity, etc.). A portion of the totalmanufacturing emissions of all PepsiCo products was apportioned to the category “fuel and energy-related activities” by referenceto the UK’s Department of Environment, Food and Rural Affairs’ (DEFRA’s) guidelines on the Scope 3 emissions of fuels andelectricity.
Percentage of emissions calculated using data obtained from suppliers or value chain partners100
ExplanationEmissions in this category were calculated by reference to lifecycle product carbon footprint studies, which obtained data directlyfrom suppliers. All Scope 3 estimates are based on 2015 sales volumes and will be updated every 5 years going forward.
Upstream transportation and distribution
Evaluation statusRelevant, calculated
Metric tonnes CO2e1161810
Emissions calculation methodologyThe starting point in this category was the total emissions calculated for all PepsiCo products (see section Purchased goods andservices). For “upstream transportation and distribution,” this was determined to be the incoming transportation portion of theoverall lifecycle product carbon footprint of all PepsiCo products. This includes emissions from transporting raw and packagingmaterials to PepsiCo manufacturing facilities.
Percentage of emissions calculated using data obtained from suppliers or value chain partners50
ExplanationEmissions in this category were calculated by reference to lifecycle product carbon footprint studies, which obtained data directlyfrom suppliers. All Scope 3 estimates are based on 2015 sales volumes and will be updated every 5 years going forward.
Waste generated in operations
Evaluation statusNot relevant, calculated
Metric tonnes CO2e60360
Emissions calculation methodologyThe starting point in this category was the total emissions calculated for all PepsiCo products (see section Purchased goods andservices). The next step was to isolate emissions from the manufacturing phase for all PepsiCo products. The manufacturingphase includes emissions from waste generated during manufacturing of products. A portion of the total manufacturing emissionsof all PepsiCo products was apportioned to the category “waste generated in operations.” This includes emissions from thetreatment of waste in PepsiCo’s manufacturing facilities.
Percentage of emissions calculated using data obtained from suppliers or value chain partners50
ExplanationReporting data on waste generated in operations does not require collecting data from suppliers or others in our value chain.
CDP Page of 9438

Business travel
Evaluation statusNot relevant, calculated
Metric tonnes CO2e121070
Emissions calculation methodologyCalculated based on estimating the percentage of PepsiCo’s overall workforce that travels for business. The overall number ofemployees that engage in business travel was multiplied by an average emission factor for business travel per employee per year.The emission factor is calculated by reference to governmental data (U.S. EPA, UK Department of Transport) on the averagebreakdown of business travel by main transportation modes (e.g., car, airplanes, train), frequency of travel and average distance oftravel.
Percentage of emissions calculated using data obtained from suppliers or value chain partners0
ExplanationNo data was collected from suppliers or others in our value chain. Given the immateriality of emissions in this category, it wasdetermined that effort be concentrated on other more impactful areas of PepsiCo’s footprint. All Scope 3 estimates are based on2015 sales volumes and will be updated every 5 years going forward.
Employee commuting
Evaluation statusNot relevant, calculated
Metric tonnes CO2e506710
Emissions calculation methodologyCalculated using 2015 Full-Time Employee (FTE) total. Employee emissions calculated for each commuting travel type – FTE bycountry * average distance covered by specified mode of transport * average emission per employee per year. Developed a modelthat takes into account the emissions related to the major modes of transport in UK, Australia and the U.S. Data for the U.S. hasbeen used as an estimate for the rest of the world. Sources: government papers and U.S. Department of Transportation.
Percentage of emissions calculated using data obtained from suppliers or value chain partners0
ExplanationSee above
Upstream leased assets
Evaluation statusNot relevant, explanation provided
Metric tonnes CO2e0
Emissions calculation methodology
Percentage of emissions calculated using data obtained from suppliers or value chain partners0
ExplanationEmissions were not calculated based on an analysis that emissions associated with upstream leased assets did not contributegreater than 1% of overall Scope 3 emissions.
CDP Page of 9439

Downstream transportation and distribution
Evaluation statusRelevant, calculated
Metric tonnes CO2e9964010
Emissions calculation methodologyThe starting point in this category was the total emissions calculated for all PepsiCo products (see section Purchased goods andservices). For “downstream transportation and distribution,” this was determined to be the retail and distribution portion of theoverall lifecycle product carbon footprint of all PepsiCo products. This includes emissions from transporting (with chilling, ifapplicable) PepsiCo products to retail distribution centers (RDCs), energy and chilling at RDCs, transportation (with chilling ifapplicable) to retail outlets, and energy and chilling at retail outlets. Total emissions from PepsiCo-owned vendors and coolers wascalculated by taking the total number, type and efficiency of units in operation multiplied by the electric grid emission factor for thecountry of operation. This was done separately from the overall footprint but is considered included in the overall number for thiscategory. It accounts for 40% of the total for this category.
Percentage of emissions calculated using data obtained from suppliers or value chain partners50
ExplanationEmissions in this category were calculated by reference to lifecycle product carbon footprint studies, which obtained data directlyfrom suppliers. All Scope 3 estimates are based on 2015 sales volumes and will be updated every 5 years going forward.
Processing of sold products
Evaluation statusNot relevant, explanation provided
Metric tonnes CO2e0
Emissions calculation methodology
Percentage of emissions calculated using data obtained from suppliers or value chain partners0
ExplanationBy the definition in the WRI/WBCSD The Greenhouse Gas Protocol – Scope 3 Protocol, this item is not applicable to PepsiCo aswe do not generate products that are processed downstream of our manufacturing.
Use of sold products
Evaluation statusRelevant, calculated
Metric tonnes CO2e3046900
Emissions calculation methodologyThe starting point in this category was the total emissions calculated for all PepsiCo products (see section Purchased goods andservices). For “use of sold products,” this was determined to be the use phase portions of the overall lifecycle product carbonfootprint of all PepsiCo products. The use phase of emission of products included emissions from the refrigeration of beverages athome prior to consumption.
Percentage of emissions calculated using data obtained from suppliers or value chain partners50
ExplanationBest available information used, such as cooking times on packs, previous survey data on length of time drinks are refrigerated, AllScope 3 estimates are based on 2015 sales volumes and will be updated every 5 years going forward.
CDP Page of 9440
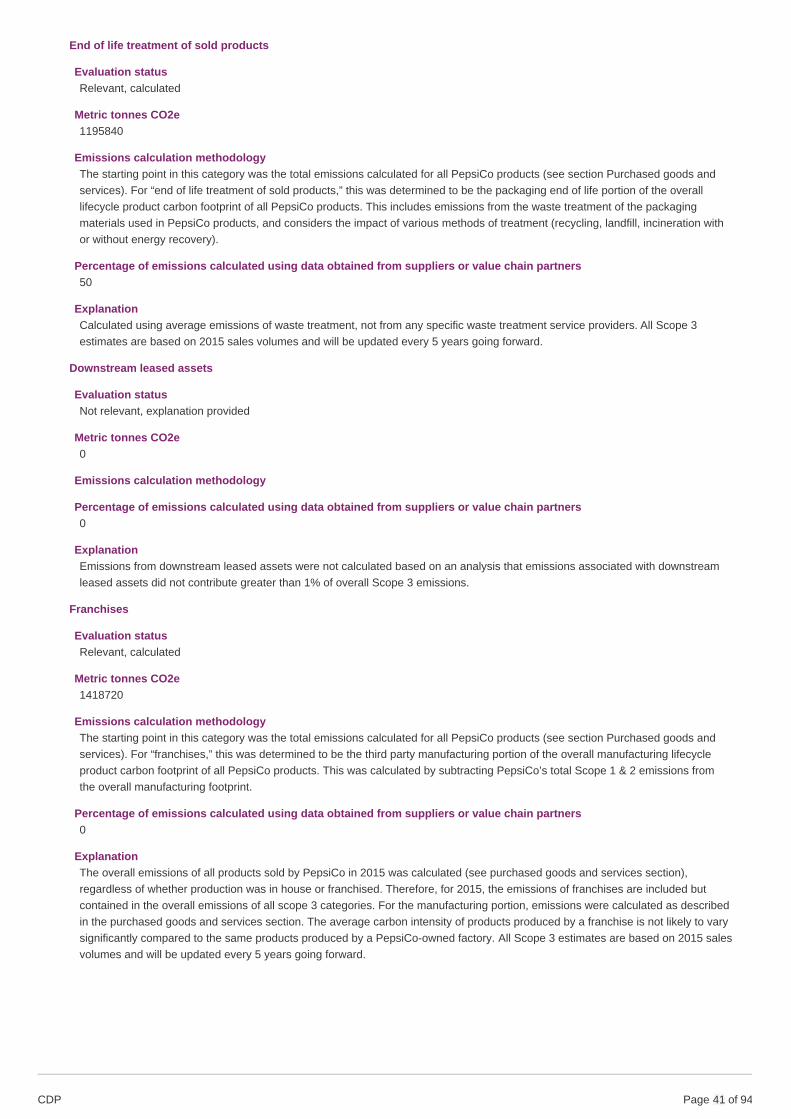
End of life treatment of sold products
Evaluation statusRelevant, calculated
Metric tonnes CO2e1195840
Emissions calculation methodologyThe starting point in this category was the total emissions calculated for all PepsiCo products (see section Purchased goods andservices). For “end of life treatment of sold products,” this was determined to be the packaging end of life portion of the overalllifecycle product carbon footprint of all PepsiCo products. This includes emissions from the waste treatment of the packagingmaterials used in PepsiCo products, and considers the impact of various methods of treatment (recycling, landfill, incineration withor without energy recovery).
Percentage of emissions calculated using data obtained from suppliers or value chain partners50
ExplanationCalculated using average emissions of waste treatment, not from any specific waste treatment service providers. All Scope 3estimates are based on 2015 sales volumes and will be updated every 5 years going forward.
Downstream leased assets
Evaluation statusNot relevant, explanation provided
Metric tonnes CO2e0
Emissions calculation methodology
Percentage of emissions calculated using data obtained from suppliers or value chain partners0
ExplanationEmissions from downstream leased assets were not calculated based on an analysis that emissions associated with downstreamleased assets did not contribute greater than 1% of overall Scope 3 emissions.
Franchises
Evaluation statusRelevant, calculated
Metric tonnes CO2e1418720
Emissions calculation methodologyThe starting point in this category was the total emissions calculated for all PepsiCo products (see section Purchased goods andservices). For “franchises,” this was determined to be the third party manufacturing portion of the overall manufacturing lifecycleproduct carbon footprint of all PepsiCo products. This was calculated by subtracting PepsiCo’s total Scope 1 & 2 emissions fromthe overall manufacturing footprint.
Percentage of emissions calculated using data obtained from suppliers or value chain partners0
ExplanationThe overall emissions of all products sold by PepsiCo in 2015 was calculated (see purchased goods and services section),regardless of whether production was in house or franchised. Therefore, for 2015, the emissions of franchises are included butcontained in the overall emissions of all scope 3 categories. For the manufacturing portion, emissions were calculated as describedin the purchased goods and services section. The average carbon intensity of products produced by a franchise is not likely to varysignificantly compared to the same products produced by a PepsiCo-owned factory. All Scope 3 estimates are based on 2015 salesvolumes and will be updated every 5 years going forward.
CDP Page of 9441

Investments
Evaluation statusRelevant, calculated
Metric tonnes CO2e2730730
Emissions calculation methodologyFor investments, procurement data was collected on investment related spending in 2014, and the total spend was multiplied byEEIO emission factors to estimate emissions.
Percentage of emissions calculated using data obtained from suppliers or value chain partners0
ExplanationEmissions in this category were estimated based on procurement spend, rather than directly procuring data from suppliers andothers in our value chain. All Scope 3 estimates are based on 2015 sales volumes and will be updated every 5 years going forward.
Other (upstream)
Evaluation status
Metric tonnes CO2e
Emissions calculation methodology
Percentage of emissions calculated using data obtained from suppliers or value chain partners
Explanation
Other (downstream)
Evaluation statusRelevant, calculated
Metric tonnes CO2e1282850
Emissions calculation methodologyTotal emissions from complementary products were calculated to account for emissions of products that are used with ourproducts. This is primarily from milk used with our oat products.
Percentage of emissions calculated using data obtained from suppliers or value chain partners50
ExplanationBest available information used, such as serving size. All Scope 3 estimates are based on 2015 sales volumes and will be updatedevery 5 years going forward.
C-AC6.6/C-FB6.6/C-PF6.6
(C-AC6.6/C-FB6.6/C-PF6.6) Can you breakdown your Scope 3 emissions by relevant business activity areas?Yes
C-AC6.6a/C-FB6.6a/C-PF6.6a
CDP Page of 9442
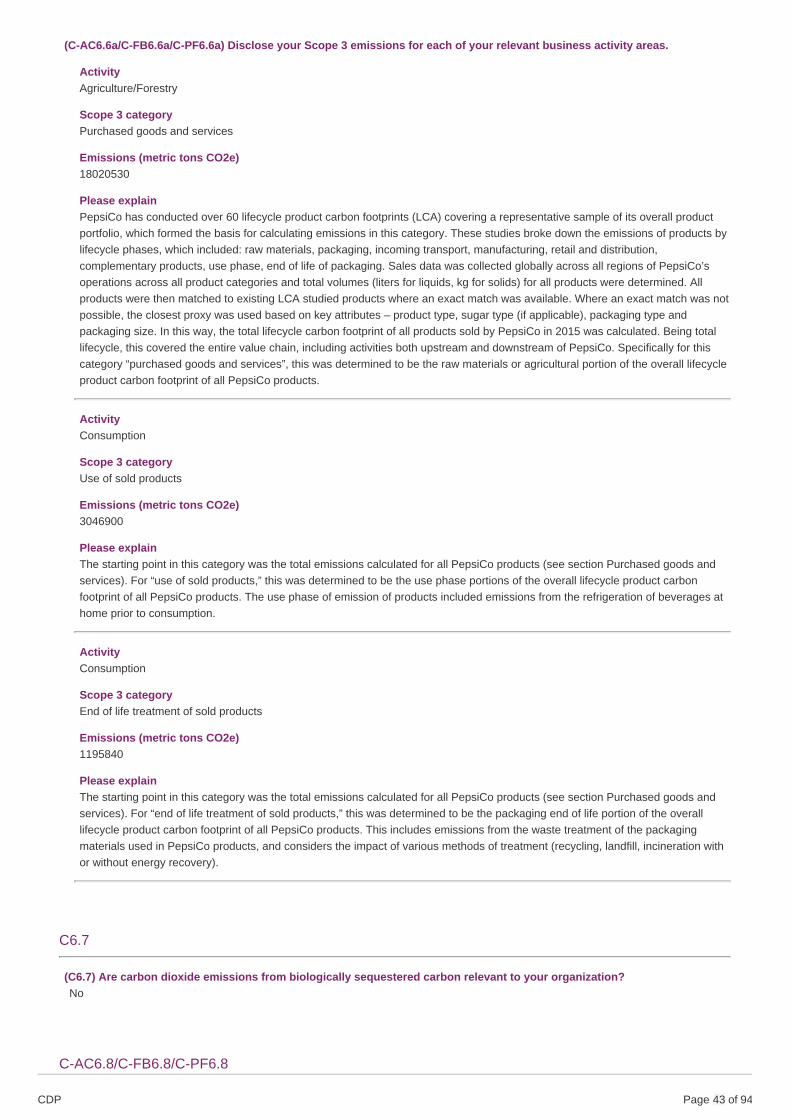
(C-AC6.6a/C-FB6.6a/C-PF6.6a) Disclose your Scope 3 emissions for each of your relevant business activity areas.
ActivityAgriculture/Forestry
Scope 3 categoryPurchased goods and services
Emissions (metric tons CO2e)18020530
Please explainPepsiCo has conducted over 60 lifecycle product carbon footprints (LCA) covering a representative sample of its overall productportfolio, which formed the basis for calculating emissions in this category. These studies broke down the emissions of products bylifecycle phases, which included: raw materials, packaging, incoming transport, manufacturing, retail and distribution,complementary products, use phase, end of life of packaging. Sales data was collected globally across all regions of PepsiCo’soperations across all product categories and total volumes (liters for liquids, kg for solids) for all products were determined. Allproducts were then matched to existing LCA studied products where an exact match was available. Where an exact match was notpossible, the closest proxy was used based on key attributes – product type, sugar type (if applicable), packaging type andpackaging size. In this way, the total lifecycle carbon footprint of all products sold by PepsiCo in 2015 was calculated. Being totallifecycle, this covered the entire value chain, including activities both upstream and downstream of PepsiCo. Specifically for thiscategory “purchased goods and services”, this was determined to be the raw materials or agricultural portion of the overall lifecycleproduct carbon footprint of all PepsiCo products.
ActivityConsumption
Scope 3 categoryUse of sold products
Emissions (metric tons CO2e)3046900
Please explainThe starting point in this category was the total emissions calculated for all PepsiCo products (see section Purchased goods andservices). For “use of sold products,” this was determined to be the use phase portions of the overall lifecycle product carbonfootprint of all PepsiCo products. The use phase of emission of products included emissions from the refrigeration of beverages athome prior to consumption.
ActivityConsumption
Scope 3 categoryEnd of life treatment of sold products
Emissions (metric tons CO2e)1195840
Please explainThe starting point in this category was the total emissions calculated for all PepsiCo products (see section Purchased goods andservices). For “end of life treatment of sold products,” this was determined to be the packaging end of life portion of the overalllifecycle product carbon footprint of all PepsiCo products. This includes emissions from the waste treatment of the packagingmaterials used in PepsiCo products, and considers the impact of various methods of treatment (recycling, landfill, incineration withor without energy recovery).
C6.7
(C6.7) Are carbon dioxide emissions from biologically sequestered carbon relevant to your organization?No
C-AC6.8/C-FB6.8/C-PF6.8
CDP Page of 9443

(C-AC6.8/C-FB6.8/C-PF6.8) Is biogenic carbon pertaining to your direct operations relevant to your current CDP climatechange disclosure?No
C-AC6.9/C-FB6.9/C-PF6.9
(C-AC6.9/C-FB6.9/C-PF6.9) Do you collect or calculate greenhouse gas emissions for each commodity reported assignificant to your business in C-AC0.7/FB0.7/PF0.7?
Agricultural commoditiesPalm Oil
Do you collect or calculate GHG emissions for this commodity?Yes
Please explainWe calculate GHG emissions from this commodity for certain geographies using secondary data and literature review.
Agricultural commoditiesSugar
Do you collect or calculate GHG emissions for this commodity?Yes
Please explainWe calculate GHG emissions from this commodity for certain geographies using secondary data and literature review.
Agricultural commoditiesWheat
Do you collect or calculate GHG emissions for this commodity?No, not currently but intend to collect or calculate this data within the next two years
Please explainWheat supply chains have very low traceability and so we have not yet ascertained the source regions for the majority of ourwheat. We are working towards this.
Agricultural commoditiesOther (Potatoes, corn)
Do you collect or calculate GHG emissions for this commodity?Yes
Please explainWe calculate GHG emissions from this commodity for certain geographies using industry accepted tools/methodologies such as theCool Farm Tool. We calculate GHG emissions from this commodity for certain geographies using industry acceptedtools/methodologies such as the Cool Farm Tool and the Fieldprint Calculator.
C-AC6.9a/C-FB6.9a/C-PF6.9a
CDP Page of 9444
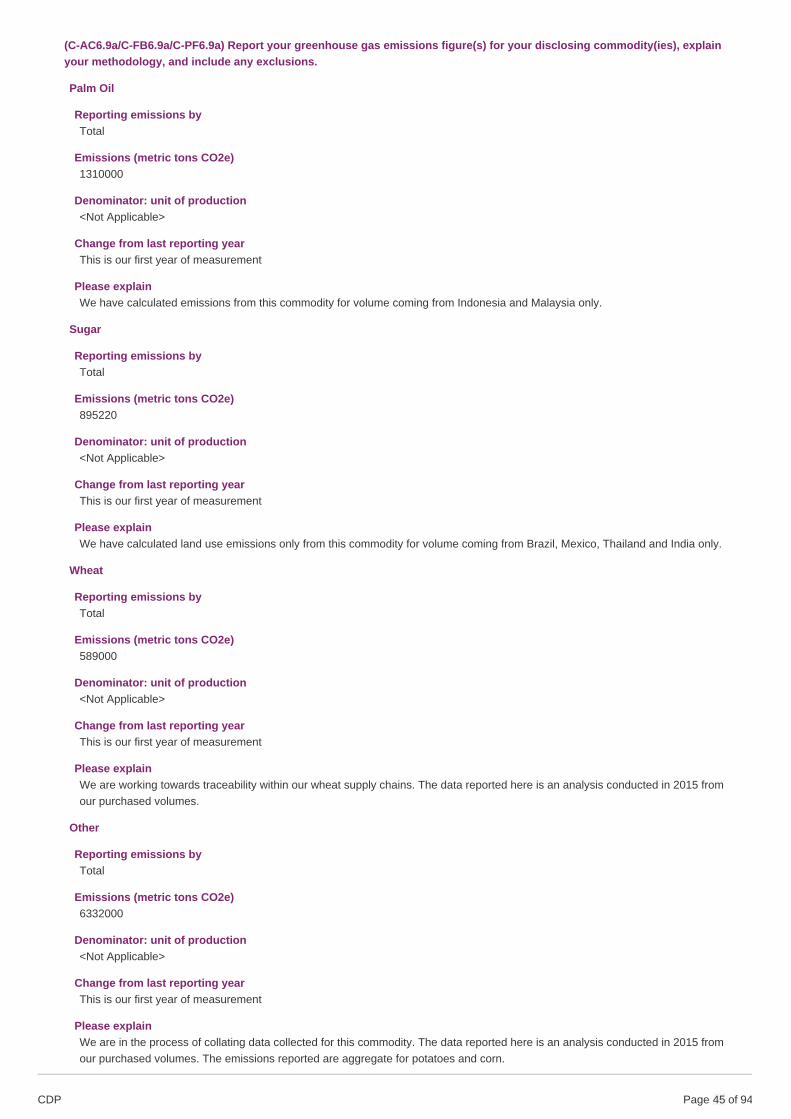
(C-AC6.9a/C-FB6.9a/C-PF6.9a) Report your greenhouse gas emissions figure(s) for your disclosing commodity(ies), explainyour methodology, and include any exclusions.
Palm Oil
Reporting emissions byTotal
Emissions (metric tons CO2e)1310000
Denominator: unit of production<Not Applicable>
Change from last reporting yearThis is our first year of measurement
Please explainWe have calculated emissions from this commodity for volume coming from Indonesia and Malaysia only.
Sugar
Reporting emissions byTotal
Emissions (metric tons CO2e)895220
Denominator: unit of production<Not Applicable>
Change from last reporting yearThis is our first year of measurement
Please explainWe have calculated land use emissions only from this commodity for volume coming from Brazil, Mexico, Thailand and India only.
Wheat
Reporting emissions byTotal
Emissions (metric tons CO2e)589000
Denominator: unit of production<Not Applicable>
Change from last reporting yearThis is our first year of measurement
Please explainWe are working towards traceability within our wheat supply chains. The data reported here is an analysis conducted in 2015 fromour purchased volumes.
Other
Reporting emissions byTotal
Emissions (metric tons CO2e)6332000
Denominator: unit of production<Not Applicable>
Change from last reporting yearThis is our first year of measurement
Please explainWe are in the process of collating data collected for this commodity. The data reported here is an analysis conducted in 2015 fromour purchased volumes. The emissions reported are aggregate for potatoes and corn.
CDP Page of 9445

C6.10
(C6.10) Describe your gross global combined Scope 1 and 2 emissions for the reporting year in metric tons CO2e per unitcurrency total revenue and provide any additional intensity metrics that are appropriate to your business operations.
Intensity figure0.000086
Metric numerator (Gross global combined Scope 1 and 2 emissions)5448470
Metric denominatorunit total revenue
Metric denominator: Unit total63525000000
Scope 2 figure usedMarket-based
% change from previous year6
Direction of changeDecreased
Reason for changeOur emissions have declined by 1% while revenue has increased by 1.15%. This can be attributed to emission reduction activitiesimplemented during the reporting year. We are investing in a variety of actions across our operations, including energy efficiencyimprovements driven by our Resource Conservation (ReCon) program, a comprehensive, global platform of resources, tools andprograms designed to improve energy, water and waste efficiencies in our manufacturing processes.
Intensity figure0.17
Metric numerator (Gross global combined Scope 1 and 2 emissions)5448470
Metric denominatormetric ton of product
Metric denominator: Unit total32642870
Scope 2 figure usedMarket-based
% change from previous year2
Direction of changeIncreased
Reason for changeChanges in product mix resulting in different energy demand profiles. Partly mitigated by the reduction initiatives that have beenimplemented and started to have an impact. We have seen a 3.8% reduction in company-manufactured beverages, and a 1%increase in company-manufactured snacks. This has shifted our production slightly to the higher energy intensity snacks products,as well as a slight loss in efficiency in beverages due to the reduced volume throughout.
C7. Emissions breakdowns
CDP Page of 9446

C7.1
(C7.1) Does your organization have greenhouse gas emissions other than carbon dioxide?Yes
C7.1a
(C7.1a) Break down your total gross global Scope 1 emissions by greenhouse gas type and provide the source of each usedgreenhouse warming potential (GWP).
Greenhouse gas Scope 1 emissions (metric tons of CO2e) GWP Reference
C7.2
CDP Page of 9447

(C7.2) Break down your total gross global Scope 1 emissions by country/region.
Country/Region Scope 1 emissions (metric tons CO2e)
Argentina 13630
Australia 30430
Belgium 29740
Bosnia and Herzegovina 2210
Brazil 96730
Canada 183930
Chile 19120
China 34000
Colombia 29280
Costa Rica 510
Cyprus 1380
Czechia 5580
Dominican Republic 7040
Ecuador 3640
Egypt 145160
El Salvador 1580
Estonia 60
France 2360
Georgia 1050
Germany 7250
Greece 6190
Guatemala 19320
Honduras 2670
Hungary 870
India 13810
Ireland 4210
Italy 580
Jordan 510
Kyrgyzstan 0
Mexico 422420
Netherlands 16390
New Zealand 6530
Pakistan 19370
Panama 620
Peru 7200
Poland 47710
Portugal 12030
Romania 14730
Russian Federation 284480
Saudi Arabia 47730
Serbia 7390
Singapore 900
Slovakia 740
South Africa 39230
Spain 36240
Taiwan (Province of China) 4620
Thailand 25570
Turkey 38250
Ukraine 16890
United Kingdom of Great Britain and Northern Ireland 93920
United States of America 1924000
Uruguay 1530
Viet Nam 3190
CDP Page of 9448

C7.3
(C7.3) Indicate which gross global Scope 1 emissions breakdowns you are able to provide.By business division
C7.3a
(C7.3a) Break down your total gross global Scope 1 emissions by business division.
Business division Scope 1 emissions (metric ton CO2e)
Frito-Lay North America 1098700
Latin America 618320
North America Beverages 1011050
Asia, Middle East and North Africa (AMENA) 330220
Europe Sub-Saharan Africa (ESSA) 665300
PepsiCo Global Concentrate 10930
C-AC7.4/C-FB7.4/C-PF7.4
(C-AC7.4/C-FB7.4/C-PF7.4) Do you include emissions pertaining to your business activity(ies) in your direct operations aspart of your global gross Scope 1 figure?No
C-AC7.4c/C-FB7.4c/C-PF7.4c
(C-AC7.4c/C-FB7.4c/C-PF7.4c) Why do you not include greenhouse gas emissions pertaining your business activity(ies) inyour direct operations as part of your global gross Scope 1 figure? Describe any plans to do so in the future.
Primaryreason
Please explain
Row1
Judged tobeunimportant
PepsiCo owns/manages some agricultural land within our direct operations. Lands are usually used to grow crops for our products. The amountof land this represents in our overall agricultural supply chain is judged to be small and, therefore, de-Minimis. Due to internal complexities incollecting this data we are not reporting emissions from company-owned agricultural land.
C7.5
(C7.5) Break down your total gross global Scope 2 emissions by country/region.
Country/Region Scope 2, location-based (metric tonsCO2e)
Scope 2, market-based (metric tonsCO2e)
Purchased and consumedelectricity, heat, steam orcooling (MWh)
Purchased and consumed low-carbon electricity, heat,steam or cooling accounted in market-based approach(MWh)
Argentina 8390 8390 21850 0
Australia 29770 29770 39420 50
Belgium 8440 7690 38710 0
Bosnia andHerzegovina
1730 1730 2010 0
Brazil 18280 18220 116900 370
CDP Page of 9449

Canada 29240 29240 177270 0
Chile 8250 8250 18820 0
China 35460 35420 56430 0
Colombia 5790 5790 28880 0
Costa Rica 0 0 460 0
Cyprus 460 500 700 170
Czechia 6610 8710 14960 0
Dominican Republic 6050 6050 10090 0
Ecuador 1410 1410 4200 0
Egypt 49300 49300 104350 0
El Salvador 210 210 780 0
Estonia 0 0 0 0
France 370 320 6810 0
Georgia 310 310 2660 0
Germany 4140 7170 9870 0
Greece 2950 2960 5070 0
Guatemala 6200 6200 14560 0
Honduras 1020 1020 2630 0
Hungary 0 0 0 0
India 83740 83740 130090 35560
Ireland 4280 7820 10270 0
Italy 200 100 640 420
Jordan 7810 7800 13270 0
Kyrgyzstan 4090 4090 21470 0
Mexico 143920 107410 312910 79800
Netherlands 8100 1360 19240 16710
New Zealand 800 800 6460 0
Pakistan 7690 7690 18720 10
Panama 520 520 1660 0
Peru 2680 2680 10960 0
Poland 30870 42480 49920 0
Portugal 2870 20 8600 9000
Romania 10570 12450 31930 0
Russian Federation 132310 132310 413850 0
Saudi Arabia 29730 29730 40940 20
Serbia 0 0 13560 0
Singapore 2940 2940 6750 0
Slovakia 0 0 0 0
South Africa 29130 29130 29420 0
Spain 13400 2060 45780 40630
Taiwan (Province ofChina)
4560 4550 7210 0
Thailand 45220 45220 88530 160
Turkey 29070 29070 68240 0
Ukraine 15920 15920 46170 0
United Kingdom ofGreat Britain andNorthern Ireland
31540 35370 86940 1430
United States ofAmerica
877360 877360 1878620 2480
Uruguay 480 480 9380 0
Viet Nam 2190 2190 4570 0
Country/Region Scope 2, location-based (metric tonsCO2e)
Scope 2, market-based (metric tonsCO2e)
Purchased and consumedelectricity, heat, steam orcooling (MWh)
Purchased and consumed low-carbon electricity, heat,steam or cooling accounted in market-based approach(MWh)
CDP Page of 9450

C7.6
(C7.6) Indicate which gross global Scope 2 emissions breakdowns you are able to provide.By business division
C7.6a
(C7.6a) Break down your total gross global Scope 2 emissions by business division.
Business division Scope 2, location-based emissions (metric tons CO2e) Scope 2, market-based emissions (metric tons CO2e)
Frito-Lay North America 370790 370790
Latin America 199260 162750
North America Beverages 533920 533920
Asia, Middle East and North Africa (AMENA) 293530 293500
Europe Sub-Saharan Africa (ESSA) 333100 333750
PepsiCo Global Concentrate 15770 19240
C7.9
(C7.9) How do your gross global emissions (Scope 1 and 2 combined) for the reporting year compare to those of theprevious reporting year?Decreased
C7.9a
CDP Page of 9451

(C7.9a) Identify the reasons for any change in your gross global emissions (Scope 1 and 2 combined) and for each of themspecify how your emissions compare to the previous year.
Change inemissions(metrictonsCO2e)
Directionof change
Emissionsvalue(percentage)
Please explain calculation
Change inrenewableenergyconsumption
1420 Decreased 0.03 A number of new renewable energy projects and sourcing were introduced in 2017. Calculated as CO2savings from RE projects. Change = sum of GHG reductions minus energy efficiency emission reductions.Percentage (0.03%) = Change in RE consumption (1,420) divided by sum of scope 1 and scope 2emissions (5,448,470) X100
Otheremissionsreductionactivities
82810 Decreased 1.52 We have undertaken many energy efficiency initiatives to drive improvements in our energy consumption.The net effect is calculated as the sum of scope 1 and 2 impacts of energy efficiency projects (82,810)emissions divided by the sum of scope 1 and scope 2 emissions (5,448,470) X100 = 1.52%
Divestment <NotApplicable>
Acquisitions <NotApplicable>
Mergers <NotApplicable>
Change inoutput
34710 Increased 0.64 While a number of our sites experienced a decrease in production, others have experienced an increase inproduction. These changes affect the equipment, as well as the energy consumption profiles of theequipment during operation and non-operation. In addition, our products have different energy consumptionprofiles and we have seen changes in product mix that had an impact on overall energy consumption andthe associated emissions. This has led to both increases and decreases in emissions across our facilities.Net effect is an increase. This is calculated as the sum of the decrease in emissions assumed from changein production (-43,890) and the increase in emissions due to product mix change (78,600) divided by the sumof scope 1 and scope 2 emissions (5,448,470) X100 = 0.64%
Change inmethodology
<NotApplicable>
Change inboundary
<NotApplicable>
Change inphysicaloperatingconditions
<NotApplicable>
Unidentified <NotApplicable>
Other <NotApplicable>
C7.9b
(C7.9b) Are your emissions performance calculations in C7.9 and C7.9a based on a location-based Scope 2 emissions figureor a market-based Scope 2 emissions figure?Market-based
C8. Energy
C8.1
(C8.1) What percentage of your total operational spend in the reporting year was on energy?More than 0% but less than or equal to 5%
CDP Page of 9452

C8.2
(C8.2) Select which energy-related activities your organization has undertaken.
Indicate whether your organization undertakes this energy-related activity
Consumption of fuel (excluding feedstocks) Yes
Consumption of purchased or acquired electricity Yes
Consumption of purchased or acquired heat No
Consumption of purchased or acquired steam Yes
Consumption of purchased or acquired cooling No
Generation of electricity, heat, steam, or cooling Yes
C8.2a
(C8.2a) Report your organization’s energy consumption totals (excluding feedstocks) in MWh.
Heating value MWh from renewablesources
MWh from non-renewablesources
Total MWh
Consumption of fuel (excluding feedstock) HHV (higher heatingvalue)
536070 18757960 19294030
Consumption of purchased or acquired electricity <Not Applicable> 146110 3790890 3937000
Consumption of purchased or acquired heat <Not Applicable> <Not Applicable> <Not Applicable> <NotApplicable>
Consumption of purchased or acquired steam <Not Applicable> 28910 87590 116500
Consumption of purchased or acquired cooling <Not Applicable> <Not Applicable> <Not Applicable> <NotApplicable>
Consumption of self-generated non-fuel renewableenergy
<Not Applicable> 11790 <Not Applicable> 11790
Total energy consumption <Not Applicable> 722880 22636440 23359320
C8.2b
(C8.2b) Select the applications of your organization’s consumption of fuel.
Indicate whether your organization undertakes this fuel application
Consumption of fuel for the generation of electricity Yes
Consumption of fuel for the generation of steam Yes
Consumption of fuel for the generation of cooling No
Consumption of fuel for co-generation or tri-generation Yes
C8.2c
(C8.2c) State how much fuel in MWh your organization has consumed (excluding feedstocks) by fuel type.
Fuels (excluding feedstocks)Biodiesel
Heating valueHHV (higher heating value)
Total fuel MWh consumed by the organization260
CDP Page of 9453

MWh fuel consumed for the self-generation of electricity0
MWh fuel consumed for self-generation of heat0
MWh fuel consumed for self-generation of steam0
MWh fuel consumed for self-generation of cooling<Not Applicable>
MWh fuel consumed for self- cogeneration or self-trigeneration0
Fuels (excluding feedstocks)Biogas
Heating valueHHV (higher heating value)
Total fuel MWh consumed by the organization110190
MWh fuel consumed for the self-generation of electricity0
MWh fuel consumed for self-generation of heat0
MWh fuel consumed for self-generation of steam0
MWh fuel consumed for self-generation of cooling<Not Applicable>
MWh fuel consumed for self- cogeneration or self-trigeneration0
Fuels (excluding feedstocks)Coal
Heating valueHHV (higher heating value)
Total fuel MWh consumed by the organization152880
MWh fuel consumed for the self-generation of electricity0
MWh fuel consumed for self-generation of heat0
MWh fuel consumed for self-generation of steam0
MWh fuel consumed for self-generation of cooling<Not Applicable>
MWh fuel consumed for self- cogeneration or self-trigeneration0
Fuels (excluding feedstocks)Fuel Oil Number 2
Heating valueHHV (higher heating value)
CDP Page of 9454

Total fuel MWh consumed by the organization6306360
MWh fuel consumed for the self-generation of electricity0
MWh fuel consumed for self-generation of heat0
MWh fuel consumed for self-generation of steam0
MWh fuel consumed for self-generation of cooling<Not Applicable>
MWh fuel consumed for self- cogeneration or self-trigeneration0
Fuels (excluding feedstocks)Fuel Oil Number 4
Heating valueHHV (higher heating value)
Total fuel MWh consumed by the organization69750
MWh fuel consumed for the self-generation of electricity0
MWh fuel consumed for self-generation of heat0
MWh fuel consumed for self-generation of steam0
MWh fuel consumed for self-generation of cooling<Not Applicable>
MWh fuel consumed for self- cogeneration or self-trigeneration0
Fuels (excluding feedstocks)Fuel Oil Number 6
Heating valueHHV (higher heating value)
Total fuel MWh consumed by the organization230
MWh fuel consumed for the self-generation of electricity0
MWh fuel consumed for self-generation of heat0
MWh fuel consumed for self-generation of steam0
MWh fuel consumed for self-generation of cooling<Not Applicable>
MWh fuel consumed for self- cogeneration or self-trigeneration0
Fuels (excluding feedstocks)Gas Oil
CDP Page of 9455

Heating valueHHV (higher heating value)
Total fuel MWh consumed by the organization895900
MWh fuel consumed for the self-generation of electricity0
MWh fuel consumed for self-generation of heat0
MWh fuel consumed for self-generation of steam0
MWh fuel consumed for self-generation of cooling<Not Applicable>
MWh fuel consumed for self- cogeneration or self-trigeneration0
Fuels (excluding feedstocks)Kerosene
Heating valueHHV (higher heating value)
Total fuel MWh consumed by the organization360
MWh fuel consumed for the self-generation of electricity0
MWh fuel consumed for self-generation of heat0
MWh fuel consumed for self-generation of steam0
MWh fuel consumed for self-generation of cooling<Not Applicable>
MWh fuel consumed for self- cogeneration or self-trigeneration
Fuels (excluding feedstocks)Liquefied Petroleum Gas (LPG)
Heating valueHHV (higher heating value)
Total fuel MWh consumed by the organization766340
MWh fuel consumed for the self-generation of electricity0
MWh fuel consumed for self-generation of heat0
MWh fuel consumed for self-generation of steam0
MWh fuel consumed for self-generation of cooling<Not Applicable>
MWh fuel consumed for self- cogeneration or self-trigeneration0
Fuels (excluding feedstocks)
CDP Page of 9456

Natural Gasoline
Heating valueHHV (higher heating value)
Total fuel MWh consumed by the organization10567000
MWh fuel consumed for the self-generation of electricity0
MWh fuel consumed for self-generation of heat0
MWh fuel consumed for self-generation of steam0
MWh fuel consumed for self-generation of cooling<Not Applicable>
MWh fuel consumed for self- cogeneration or self-trigeneration0
Fuels (excluding feedstocks)Solid Biomass Waste
Heating valueHHV (higher heating value)
Total fuel MWh consumed by the organization424760
MWh fuel consumed for the self-generation of electricity0
MWh fuel consumed for self-generation of heat0
MWh fuel consumed for self-generation of steam0
MWh fuel consumed for self-generation of cooling<Not Applicable>
MWh fuel consumed for self- cogeneration or self-trigeneration0
C8.2d
(C8.2d) List the average emission factors of the fuels reported in C8.2c.
Biodiesel
Emission factor0.25
Unitmetric tons CO2e per MWh
Emission factor sourceUK Department for Business, Energy and Industrial Strategy: Greenhouse gas reporting: conversion factors 2018
Comment
CDP Page of 9457

Biogas
Emission factor0.2
Unitmetric tons CO2e per metric ton
Emission factor sourceUK Department for Business, Energy and Industrial Strategy: Greenhouse gas reporting: conversion factors 2018
Comment
Coal
Emission factor0.32
Unitmetric tons CO2e per MWh
Emission factor sourceUK Department for Business, Energy and Industrial Strategy: Greenhouse gas reporting: conversion factors 2018
Comment
Fuel Oil Number 2
Emission factor0.25
Unitmetric tons CO2e per MWh
Emission factor sourceUK Department for Business, Energy and Industrial Strategy: Greenhouse gas reporting: conversion factors 2018
Comment
Fuel Oil Number 4
Emission factor0.28
Unitmetric tons CO2e per MWh
Emission factor sourceUK Department for Business, Energy and Industrial Strategy: Greenhouse gas reporting: conversion factors 2018
Comment
Fuel Oil Number 6
Emission factor0.27
Unitmetric tons CO2e per MWh
Emission factor sourceUK Department for Business, Energy and Industrial Strategy: Greenhouse gas reporting: conversion factors 2018
Comment
CDP Page of 9458

Gas Oil
Emission factor0.24
Unitmetric tons CO2e per MWh
Emission factor sourceUK Department for Business, Energy and Industrial Strategy: Greenhouse gas reporting: conversion factors 2018
Comment
Kerosene
Emission factor0.25
Unitmetric tons CO2e per MWh
Emission factor sourceUK Department for Business, Energy and Industrial Strategy: Greenhouse gas reporting: conversion factors 2018
Comment
Liquefied Petroleum Gas (LPG)
Emission factor0.21
Unitmetric tons CO2e per MWh
Emission factor sourceUK Department for Business, Energy and Industrial Strategy: Greenhouse gas reporting: conversion factors 2018
Comment
Natural Gasoline
Emission factor0.18
Unitmetric tons CO2e per MWh
Emission factor sourceUK Department for Business, Energy and Industrial Strategy: Greenhouse gas reporting: conversion factors 2018
Comment
Solid Biomass Waste
Emission factor0.35
Unitmetric tons CO2e per MWh
Emission factor sourceUK Department for Business, Energy and Industrial Strategy: Greenhouse gas reporting: conversion factors 2018
Comment
C8.2e
CDP Page of 9459

(C8.2e) Provide details on the electricity, heat, steam, and cooling your organization has generated and consumed in thereporting year.
Total Grossgeneration (MWh)
Generation that is consumed by theorganization (MWh)
Gross generation fromrenewable sources (MWh)
Generation from renewable sources that isconsumed by the organization (MWh)
Electricity 309040 298430 55890 55890
Heat 0 0 0 0
Steam 572950 572950 362040 362040
Cooling 0 0 0 0
C8.2f
(C8.2f) Provide details on the electricity, heat, steam and/or cooling amounts that were accounted for at a low-carbonemission factor in the market-based Scope 2 figure reported in C6.3.
Basis for applying a low-carbon emission factorOff-grid energy consumption from an on-site installation or through a direct line to an off-site generator owned by another company
Low-carbon technology typeSolar PV
MWh consumed associated with low-carbon electricity, heat, steam or cooling3340
Emission factor (in units of metric tons CO2e per MWh)0
Comment
Basis for applying a low-carbon emission factorOff-grid energy consumption from an on-site installation or through a direct line to an off-site generator owned by another company
Low-carbon technology typeWind
MWh consumed associated with low-carbon electricity, heat, steam or cooling8450
Emission factor (in units of metric tons CO2e per MWh)0
Comment
Basis for applying a low-carbon emission factorContract with suppliers or utilities (e.g. green tariff), not supported by energy attribute certificates
Low-carbon technology typeSolar PVWind
MWh consumed associated with low-carbon electricity, heat, steam or cooling175020
Emission factor (in units of metric tons CO2e per MWh)0
CommentThis is a direct procurement contract with a grid-connected generator or Power Purchase Agreement (PPA), where electricityattribute certificates do not exist or are not required for a usage claim
CDP Page of 9460

C9. Additional metrics
C9.1
(C9.1) Provide any additional climate-related metrics relevant to your business.
C10. Verification
C10.1
(C10.1) Indicate the verification/assurance status that applies to your reported emissions.
Verification/assurance status
Scope 1 Third-party verification or assurance process in place
Scope 2 (location-based or market-based) Third-party verification or assurance process in place
Scope 3 Third-party verification or assurance process in place
C10.1a
(C10.1a) Provide further details of the verification/assurance undertaken for your Scope 1 and/or Scope 2 emissions andattach the relevant statements.
ScopeScope 1
Verification or assurance cycle in placeAnnual process
Status in the current reporting yearComplete
Type of verification or assuranceLimited assurance
Attach the statementPepsiCo_BVNA - CDP Verification Statement Limited 2017 RY-5_14_2018 (1).pdf
Page/ section referencePages 1-2
Relevant standardISO14064-3
Proportion of reported emissions verified (%)100
ScopeScope 2 location-based
Verification or assurance cycle in placeAnnual process
Status in the current reporting year
CDP Page of 9461

Complete
Type of verification or assuranceLimited assurance
Attach the statementPepsiCo_BVNA - CDP Verification Statement Limited 2017 RY-5_14_2018 (1).pdf
Page/ section referencePages 1-2
Relevant standardISO14064-3
Proportion of reported emissions verified (%)100
ScopeScope 2 market-based
Verification or assurance cycle in placeAnnual process
Status in the current reporting yearComplete
Type of verification or assuranceLimited assurance
Attach the statementPepsiCo_BVNA - CDP Verification Statement Limited 2017 RY-5_14_2018 (1).pdf
Page/ section referencePages 1-2
Relevant standardISO14064-3
Proportion of reported emissions verified (%)100
C10.1b
(C10.1b) Provide further details of the verification/assurance undertaken for your Scope 3 emissions and attach the relevantstatements.
ScopeScope 3- at least one applicable category
Verification or assurance cycle in placeAnnual process
Status in the current reporting yearComplete
Attach the statementPepsiCo_BVNA - CDP Verification Statement Limited 2017 RY-5_14_2018 (1).pdf
Page/section referencePages 1-2
Relevant standardISAE3000
CDP Page of 9462

C10.2
(C10.2) Do you verify any climate-related information reported in your CDP disclosure other than the emissions figuresreported in C6.1, C6.3, and C6.5?Yes
C10.2a
(C10.2a) Which data points within your CDP disclosure have been verified, and which verification standards were used?
Disclosure moduleverification relates to
Data verified Verificationstandard
Please explain
C8. Energy Other, please specify(Energy consumption)
ISO14064-3 Energy consumption associated with manufacturing and warehouse operations, fleetoperations, offices and distribution centers.
C11. Carbon pricing
C11.1
(C11.1) Are any of your operations or activities regulated by a carbon pricing system (i.e. ETS, Cap & Trade or Carbon Tax)?Yes
C11.1a
(C11.1a) Select the carbon pricing regulation(s) which impacts your operations.California CaTEU ETSOntario CaT
C11.1b
(C11.1b) Complete the following table for each of the emissions trading systems in which you participate.
CDP Page of 9463

California CaT
% of Scope 1 emissions covered by the ETS1.51
Period start dateJanuary 1 2017
Period end dateDecember 31 2017
Allowances allocated52170
Allowances purchased0
Verified emissions in metric tons CO2e56340
Details of ownershipFacilities we own and operate
CommentPurchase of allowances not required yet at the time of filing but purchased by end of year.
EU ETS
% of Scope 1 emissions covered by the ETS2.6
Period start dateJanuary 1 2017
Period end dateDecember 31 2017
Allowances allocated46301
Allowances purchased44000
Verified emissions in metric tons CO2e97210
Details of ownershipFacilities we own and operate
Comment
CDP Page of 9464

Ontario CaT
% of Scope 1 emissions covered by the ETS0.52
Period start dateJanuary 1 2017
Period end dateDecember 31 2017
Allowances allocated19750
Allowances purchased0
Verified emissions in metric tons CO2e19500
Details of ownershipFacilities we own and operate
CommentVerification has not yet been performed as of date of filing but will be purchased by end of year.
C11.1d
(C11.1d) What is your strategy for complying with the systems in which you participate or anticipate participating?
Our first priority is to leverage our Resource Conservation (ReCon) Program to drive improvements in our energy efficiency to reduceemissions from facilities covered by Emission Trading Schemes (ETS). Examples of how we have applied this program as part of ourcompliance strategy include behavioral-based initiatives, as well as capital investments to reduce fuel consumption and switching torenewable fuels, such as anaerobic digesters.
In addition to our own reduction efforts, each of our ETS sites also currently receives an allocation of free allowances towards theircompliance. Beyond the free allowances, we purchase allowances to meet final verified emissions, as appropriate. We do notcurrently source project based carbon allowances for ETS compliance. Over the longer term, we are continuing to investigate andplan to invest in further energy efficiency opportunities, as well as heat recovery and reuse and renewable fuels.
C11.2
(C11.2) Has your organization originated or purchased any project-based carbon credits within the reporting period?No
C11.3
(C11.3) Does your organization use an internal price on carbon?No, and we do not currently anticipate doing so in the next two years
C12. Engagement
CDP Page of 9465

C12.1
(C12.1) Do you engage with your value chain on climate-related issues?Yes, our suppliersYes, our customersYes, other partners in the value chain
C12.1a
(C12.1a) Provide details of your climate-related supplier engagement strategy.
Type of engagementCompliance & onboarding
Details of engagementCode of conduct featuring climate change KPIs
% of suppliers by number100
% total procurement spend (direct and indirect)100
% Scope 3 emissions as reported in C6.5100
Rationale for the coverage of your engagementWe hold our suppliers to the same standards of integrity to which we hold ourselves. An unethical or illegal act by a supplier mayhurt PepsiCo's reputation as a world-class company and cause a loss of goodwill in the communities we serve. Therefore, allsuppliers are expected to follow our Supplier Code of Conduct, and relevant policies and commitments as a condition of doingbusiness with us. Suppliers, vendors, contractors, consultants, agents and other providers of goods and services who do businesswith PepsiCo entities worldwide are expected to follow this Guideline, where the standards apply.
Impact of engagement, including measures of successWe have recently amended the environmental language / expectation in our Supplier Code (SCoC) and the changes took effectstarting in 2018. As part of the amendment, suppliers are required to carry out operations with care for the environment andspecifically comply with all applicable environmental laws and regulations. Suppliers are also encouraged to identify, set targetsand implement action plans for reducing environmental impacts in the areas of water, wastewater, energy, greenhouse gasemissions, waste and packaging. We track the number of suppliers who take our online supplier code of conduct training. In 2017,100% of our key suppliers took the training. Our Sustainable Sourcing Program (SSP) assesses risk and monitors suppliercompliance with our SCoC through third-party auditing of our most business-critical direct suppliers and contract manufacturing andco-packing locations across 68 countries.
Comment
Type of engagementInformation collection (understanding supplier behavior)
Details of engagementCollect climate change and carbon information at least annually from suppliers
% of suppliers by number
% total procurement spend (direct and indirect)80
% Scope 3 emissions as reported in C6.557
Rationale for the coverage of your engagementWe collect climate change and carbon information from our suppliers through the annual CDP Supply Chain process. Included inthis process are suppliers in our key emissions categories like agriculture, packaging and third party logistics. Suppliers selectedrepresent our top suppliers within the category that cover ~80% of procurement spend.
Impact of engagement, including measures of success
CDP Page of 9466

Our measures of success are our supplier participation rate and average supplier score. As an indicator of the impact of ourengagement in 2017 our response rate was 90% well above average among CDP Supply Chain members with an averagesupplier score of a C. 71% of our suppliers indicated having a target for emissions reduction. We will continue collecting climateinformation from our suppliers through this process and use the results as a way of encouraging and incentivizing our suppliers tofurther act on managing and mitigating climate-related issues.
Comment
Type of engagementInformation collection (understanding supplier behavior)
Details of engagementCollect climate change and carbon information at least annually from suppliers
% of suppliers by number
% total procurement spend (direct and indirect)79
% Scope 3 emissions as reported in C6.54
Rationale for the coverage of your engagementOur Sustainable Farming Program (SFP) (formerly our Sustainable Farming Initiative, or SFI), is a program we use to engage withgrowers on farms of all sizes and types around the world in order to encourage continual improvement in sustainable farmingpractices, expand respect for workers' human rights, enhance growers' capabilities, and address risks. We have initiated SFP withfarmers from which we source directly, given our existing relationships with those farmers and the importance of directly sourcedagricultural raw materials to the continuity of our business. By 2025, our goal is to expand the SFP and other programs recognizedby PepsiCo’s benchmarking protocol to our indirect crops as well. To date, we have focused on engaging growers and bringingthem into the SFP through Farm Management Groups (FMGs).
Impact of engagement, including measures of successTo date, we have focused on engaging growers and bringing them into the SFP through Farm Management Groups (FMGs). As anindicator of the impact of our engagement, as of year-end 2017, 79% of the volume of the agricultural raw materials that we directlysource has been supplied by FMGs engaged in our SFP. The percentage of FMGs engaged is one metric by which we aremeasuring progress. The second metric – representing our ultimate objective – is the percentage of directly sourced agriculturalraw materials that we have verified as sustainably sourced.
Comment
Type of engagementEngagement & incentivization (changing supplier behavior)
Details of engagementRun an engagement campaign to educate suppliers about climate change
% of suppliers by number
% total procurement spend (direct and indirect)79
% Scope 3 emissions as reported in C6.54
Rationale for the coverage of your engagementThe SFP was created as the primary vehicle for delivering against PepsiCo’s aspirations for sustainability at the farm level withinour agricultural supply chain. The program is comprised of two components: • The SFP Code, which lists PepsiCo’s farm-levelsustainable agriculture principles and practices, and • The SFP Continuous Improvement Process, whereby farmers are continuallyassessed against the SFP Code and efforts taken to address missing sustainable agriculture principles. The SFP ContinuousImprovement Process is a cyclical process geared towards assessing and then addressing sustainability opportunities at the farmlevel within PepsiCo’s agricultural supply chain.
Impact of engagement, including measures of successTo date, we have focused on engaging growers and bringing them into the SFP through Farm Management Groups (FMGs). As anindicator of the impact of our engagement, as of year-end 2017, 79% of the volume of the agricultural raw materials that we directlysource has been supplied by FMGs engaged in our SFP. The percentage of FMGs engaged is one metric by which we aremeasuring progress. The second metric – representing our ultimate objective – is the percentage of directly sourced agriculturalraw materials that we have verified as sustainably sourced.
CDP Page of 9467

Comment
Type of engagementInnovation & collaboration (changing markets)
Details of engagementOther, please specify (Research & Development on new technology)
% of suppliers by number
% total procurement spend (direct and indirect)5
% Scope 3 emissions as reported in C6.55
Rationale for the coverage of your engagementBy working with key material suppliers, PepsiCo has been able to develop, test market and then commercialize new bio-basedcompounds for flexible packaging for several of its businesses, including Frito-Lay. PepsiCo worked with a key resin manufacturer,and a leading bio-polymer compounder, to produce the new bio-based compounds. Our supplier adapted its film extrusion lines tohandle the compounded resin and produce high-quality films. Then a converter optimized its process to print and laminate the newfilms.
Impact of engagement, including measures of successBy working with key material suppliers, PepsiCo has been able to develop, test market and then commercialize new bio-basedcompounds for flexible packaging for several of its businesses, including Frito-Lay. PepsiCo worked with a key resin manufacturer,and a leading bio-polymer compounder, to produce the new bio-based compounds. Our supplier adapted its film extrusion lines tohandle the compounded resin and produce high-quality films. Then a converter optimized its process to print and laminate the newfilms. GHG emission reduction through the implementation of this technology will be a key metric tracked for this initiative. Inaddition, this also contributes towards our sustainable packaging goal.
Comment
C12.1b
(C12.1b) Give details of your climate-related engagement strategy with your customers.
Type of engagementEducation/information sharing
Details of engagementRun an engagement campaign to educate customers about the climate change impacts of (using) your products, goods, and/orservices
Size of engagement
% Scope 3 emissions as reported in C6.518
Please explain the rationale for selecting this group of customers and scope of engagementWe introduced the PepsiCo Recycling initiative in 2010 and have continued to scale it up ever since. PepsiCo Recycling programsbring recycling solutions to colleges and universities, K-12 schools, high-traffic retail locations, professional sports facilities, events,and other organizations across the U.S. with the goal of increasing beverage container recycling rates. These customers andvenues are chosen as they represent areas where high volumes of our products are consumed. We educate and inspire consumersthrough the belief that simple acts lead to a big impact. We believe that every bottle and can recycled helps make communities andthe world a cleaner, more sustainable place.
Impact of engagement, including measures of successOur measures of success include the number of containers collected and year over year trends in collection numbers. In 2017, thePepsiCo Recycling Program collected 72 million post-consumer containers for recycling in the U.S. an approximately 160 percentincrease in container collections as compared to 2016.
Type of engagementCollaboration & innovation
CDP Page of 9468

Details of engagementRun a campaign to encourage innovation to reduce climate change impacts
Size of engagement100
% Scope 3 emissions as reported in C6.557
Please explain the rationale for selecting this group of customers and scope of engagementPepsiCo has strong relationships with our customers like our largest retail customer worldwide. We regularly work with thiscustomer on programs with climate-related benefits, such as the Mid-West Row Crop Collaborative, which is a group of companiesand conservation organizations working to expand agricultural solutions that protect air and water quality and enhance soil healthacross the entire U.S. corn and soy system in the Midwest. PepsiCo also worked with this customer to help create the Closed LoopFund in 2014 and continues to increasingly support and invest in the fund to improve recycling both in the U.S., and internationally.
Impact of engagement, including measures of successMeasures of success for The Midwest Row Crop Collaborative are: By 2025 • 75% of row crop acres in Illinois, Iowa and Nebraskaare engaged in sustainability measures • Reduce nutrient loading in these states by 20 percent • 50 percent of all irrigation unitsused in Nebraska will maximize water conservation By 2035 • Illinois, Iowa and Nebraska have met the 45 percent nitrogen lossreduction goal and partnerships established to expand across the Upper Mississippi River Basin. The Closed Loop Fund hascontinued to make progress since its launch. The fund estimates that it will eliminate more than 16 million tons of greenhouse gasemissions, divert more than 8 million cumulative tons of waste from landfills, improve recycling for more than 18 million householdsand save nearly $60 million for American cities.
Type of engagementCollaboration & innovation
Details of engagementRun a campaign to encourage innovation to reduce climate change impacts
Size of engagement
% Scope 3 emissions as reported in C6.52
Please explain the rationale for selecting this group of customers and scope of engagementPepsiCo has a Partner Outreach Program to drive energy conservation with strategic franchise operations in the U.S., Mexico,Latin America, South America, Western Europe and Asia. We have made efforts to expand our Resource Conservation program toour franchise operations by providing trainings and access to tools that help measure and track performance, identify andimplement improvement opportunities. This is a natural extension of our work within our owned operations to our franchiseoperations.
Impact of engagement, including measures of successWe track GHG emissions reduction within franchise operations as a measure of success. As a result of our engagements, we haveseen ~98,000 MT of GHG emission reductions within our franchise operations through energy efficiency and renewable energymeasures.
C12.1c
CDP Page of 9469

(C12.1c) Give details of your climate-related engagement strategy with other partners in the value chain.
We value our collaborations with other stakeholders, and are actively involved in creating and fostering pre-competitive collaborationsto reduce greenhouse gas emissions. Stakeholders include peer companies, as well as non-profit organizations and industry groups.These engagements help us learn about emerging sustainability topics, better inform our efforts, and help us work to create value forsociety. We use a variety of mechanisms to solicit feedback from our stakeholders, including bilateral meetings and participation instakeholder networks, outreach programs, webinars and working together on a wide variety of topics, including climate. Someexamples of our climate-related value chain engagements are provided here. PepsiCo is one of the founding members — along withinstitutions like The Nature Conservancy and individuals like Michael Bloomberg — of the Climate Leadership Council, advocating aconsensus climate solution — including a gradually rising and revenue-neutral carbon tax — that bridges partisan divides,strengthens our economy, and protects our environment. To support our company’s transition to renewable energy sources, PepsiCohas also joined the Business Renewables Center at the Rocky Mountain Institute and signed on to the Renewable Energy Buyers’Principles, developed by leading nongovernmental organizations to help increase access to more renewable energy in the UnitedStates. PepsiCo is a supporter of sustainable forestry and a member of The Consumer Goods Forum (TCGF). As a member ofTCGF, we are proud signatories of the forum's resolutions on deforestation and sustainable refrigeration released in November 2010,goals which will have a significant positive impact on climate change. Within our sustainable agriculture space, we are strongbelievers that collaboration can be a powerful driver of change. That is why we actively work with several organizations that fosterinsights and best practice sharing on agricultural practices within the global food and beverage and related industries. These includethe Sustainable Agriculture Initiative (SAI) Platform, Cool Farm Alliance, and Field to Market Initiative. We are also a member andcontributor to the World Food Life Cycle Database.
C-AC12.2/C-FB12.2/C-PF12.2
(C-AC12.2/C-FB12.2/C-PF12.2) Do you encourage your suppliers to undertake any agricultural or forest managementpractices with climate change mitigation and/or adaptation benefits?Yes
C-AC12.2a/C-FB12.2a/C-PF12.2a
(C-AC12.2a/C-FB12.2a/C-PF12.2a) Specify which agricultural or forest management practices with climate change mitigationand/or adaptation benefits you encourage your suppliers to undertake and describe your role in the implementation of eachpractice.
Management practice reference numberMP1
Management practiceCrop rotation
Description of management practiceThrough our Sustainable Farming Program (SFP) (formerly our Sustainable Farming Initiative, or SFI), growers are encouraged toimplement crop rotation practices to improve soil fertility, as well as manage pests
Your role in the implementationFinancialKnowledge sharingOperationalProcurement
Explanation of how you encourage implementationFor PepsiCo, sustainable agriculture is critical to the continued growth of our business, ensuring food safety and crop resilience forcontinued and localized supply. As a corporation that has a global reach but operates locally in the communities where we dobusiness, we provide relevant expertise to help advance the ways in which farming is carried out around the world. This benefitsindividual farmers and the communities that rely on them, while helping protect our license to operate. Our SFP is a program weuse to engage with growers on farms of all sizes and types around the world in order to encourage continual improvement insustainable farming practices, expand respect for workers' human rights, enhance growers' capabilities, and address risks. TheSFP is comprised of two components: • The SFP Code, which lists PepsiCo’s farm-level sustainable agriculture principles andpractices. The Code draws from principles of externally recognized agricultural codes, such as those published by the Rainforest
CDP Page of 9470

Alliance, GlobalG.A.P, Bonsucro, and the Roundtable on Sustainable Palm Oil (RSPO). • The SFP Continuous ImprovementProcess, through which farmers are continually assessed and efforts are taken to drive improvement in sustainable agriculture. Todate, we have focused on engaging growers and bringing them into the SFP through Farm Management Groups (FMGs), which aregroups of farmers that show consistency across geography, crop, farm size, and a variety of other factors. PepsiCo considers anFMG engaged when: • An initial assessment against our SFP Principles and Practices has been completed; • Sustainabilityopportunities have been identified and improvement programs developed; and • Grower engagement in these improvementprograms has been initiated. The percentage of FMGs engaged is one metric by which we are measuring progress. The secondmetric – representing our ultimate objective – is the percentage of directly-sourced agricultural raw materials that we have verifiedas sustainably sourced.
Climate change related benefitEmissions reductions (mitigation)Increasing resilience to climate change (adaptation)Increase carbon sink (mitigation)Reduced demand for fossil fuel (adaptation)Reduced demand for fertilizers (adaptation)Reduced demand for pesticides (adaptation)
Comment
Management practice reference numberMP2
Management practiceFertilizer management
Description of management practiceThrough our SFP, growers are encouraged to manage fertilizers by incorporating into the soil, using split application to minimizenitrous oxide emissions. Growers are encouraged to use tools to determine the amount of fertilizer to apply as well as to useorganic fertilizer and low carbon fertilizers.
Your role in the implementationFinancialKnowledge sharingOperationalProcurement
Explanation of how you encourage implementationFor PepsiCo, sustainable agriculture is critical to the continued growth of our business, ensuring food safety and crop resilience forcontinued and localized supply. As a corporation that has a global reach but operates locally in the communities where we dobusiness, we provide relevant expertise to help advance the ways in which farming is carried out around the world. This benefitsindividual farmers and the communities that rely on them, while helping protect our license to operate. Our SFP is a program weuse to engage with growers on farms of all sizes and types around the world in order to encourage continual improvement insustainable farming practices, expand respect for workers' human rights, enhance growers' capabilities, and address risks. TheSFP is comprised of two components: • The SFP Code, which lists PepsiCo’s farm-level sustainable agriculture principles andpractices. The Code draws from principles of externally recognized agricultural codes, such as those published by the RainforestAlliance, GlobalG.A.P, Bonsucro, and the RSPO. • The SFP Continuous Improvement Process, through which farmers arecontinually assessed and efforts are taken to drive improvement in sustainable agriculture. To date, we have focused on engaginggrowers and bringing them into the SFP through FMGs, which are groups of farmers that show consistency across geography, crop,farm size, and a variety of other factors. PepsiCo considers an FMG engaged when: • An initial assessment against our SFPPrinciples and Practices has been completed; • Sustainability opportunities have been identified and improvement programsdeveloped; and • Grower engagement in these improvement programs has been initiated. The percentage of FMGs engaged is onemetric by which we are measuring progress. The second metric – representing our ultimate objective – is the percentage of directly-sourced agricultural raw materials that we have verified as sustainably sourced.
Climate change related benefitEmissions reductions (mitigation)Increasing resilience to climate change (adaptation)Increase carbon sink (mitigation)Reduced demand for fossil fuel (adaptation)Reduced demand for fertilizers (adaptation)Reduced demand for pesticides (adaptation)
Comment
CDP Page of 9471

C-AC12.2b/C-FB12.2b/C-PF12.2b
(C-AC12.2b/C-FB12.2b/C-PF12.2b) Do you collect information from your suppliers about the outcomes of any implementedagricultural/forest management practices you have encouraged?Yes
C12.3
(C12.3) Do you engage in activities that could either directly or indirectly influence public policy on climate-related issuesthrough any of the following?Direct engagement with policy makersTrade associationsFunding research organizationsOther
C12.3a
(C12.3a) On what issues have you been engaging directly with policy makers?
Focus oflegislation
Corporateposition
Details of engagement Proposed legislative solution
Carbon tax Support In 2017, we became a founding member of the U.S. Climate Leadership Council(CLC). The CLC is an international policy institute founded in collaboration with awho’s who of business, opinion and environmental leaders to promote a carbondividend framework as the most cost-effective, equitable and politically-viableclimate solution. The Council is currently active in the United States and UnitedKingdom, and intends to expand to Germany, China and India next.
CLC proposes a carbon tax and dividend program tobe implemented at the federal level in the UnitedStates. The program is based on four interdependentpillars: 1. A gradually rising and revenue-neutralcarbon tax; 2. Carbon dividend payments to allAmericans, funded by 100% of the revenue; 3. Therollback of carbon regulations that are no longernecessary; and 4. Broader carbon adjustments to levelthe playing field and promote Americancompetitiveness.
Energyefficiency
Support In 2017, we joined vehicle fleet operators, vehicle manufacturers, fuel producers,and industry groups, in expressing our strong support for the California LowCarbon fuel Standard (LCFS). The letter sent to Governor Jerry Brown and othersexpressed how the LCFS gives us the incentive to invest in vehicle, as well as fueltechnologies today in order to bring down costs in the future. The LCFS is neededto ensure that California fulfills its statutorily-mandated greenhouse gas emissionreduction targets. The LCFS promotes competition by rewarding all technologiesthat deliver low-carbon energy for transportation, and the policy is creatinginnovation for California across a range of industries.
The Low Carbon Fuel Standard (LCFS) isadministered by the California Air Resources Board.Established In 2007 through a Governor’s ExecutiveOrder, the LCFS requires producers of petroleum-based fuels to reduce the carbon intensity of theirproducts, beginning with a quarter of a percent in 2011culminating in a 10 percent total reduction in 2020.
C12.3b
(C12.3b) Are you on the board of any trade associations or do you provide funding beyond membership?Yes
C12.3c
(C12.3c) Enter the details of those trade associations that are likely to take a position on climate change legislation.
Trade associationAmerican Beverage Association (ABA)
Is your position on climate change consistent with theirs?
CDP Page of 9472

Consistent
Please explain the trade association’s positionWe understand that ABA may support various types of legislation related to climate change, such as legislation on energyefficiency, consistent with PepsiCo’s views.
How have you, or are you attempting to, influence the position?PepsiCo is an active member of ABA. We regularly share information on our Performance with Purpose vision relating to climatechange and related issues.
Trade associationGrocery Manufacturers' Association (GMA)
Is your position on climate change consistent with theirs?Consistent
Please explain the trade association’s positionWe understand that GMA may support various types of legislation related to climate change, such as legislation on energyefficiency, consistent with PepsiCo’s views.
How have you, or are you attempting to, influence the position?PepsiCo is a member of the GMA Board. We regularly share information on our Performance with Purpose vision relating to climatechange and related issues.
Trade associationUnion of European Soft Drinks Associations (UNESDA)
Is your position on climate change consistent with theirs?Consistent
Please explain the trade association’s positionWe understand that UNESDA welcomes the European Commission’s proposal for establishing a Circular Economy in Europe andthe recently concluded review of the Waste Framework Directive (WFD) and the Packaging and Packaging Waste Directive(PPWD). UNESDA’s members are conscious of their responsibility for the end-of-life phase of packaging and advocate for a strongEuropean framework on Extended Producer Responsibility (EPR) for packaging to increase efficiency and transparency of EPR inEurope. UNESDA supports the objective of increasing resource efficiency, sustainability and progress towards a circular economythrough the recycling of materials.
How have you, or are you attempting to, influence the position?PepsiCo is an active member of UNESDA with a seat at the Board. PepsiCo participates in UNESDA’s two main committees, aswell as in the Task Force on Packaging that deals specifically with the Circular Economy Package.
Trade associationFoodDrinkEurope
Is your position on climate change consistent with theirs?Consistent
Please explain the trade association’s positionThe long-term supply of safe, high-quality and affordable raw materials may be at stake as experts warn that all aspects of foodsecurity will potentially be affected by climate change, including food production and price stability. This global challenge will havefar-reaching implications for the competitiveness and sustainability of all food and drink manufacturers. It is our understanding thatthis is why European food and drink manufacturers are actively working to try to mitigate climate change and proactively engagingwith other providers along the supply chain, governments, civil society, researchers and other stakeholders.
How have you, or are you attempting to, influence the position?PepsiCo is a member of the FoodDrinkEurope Board and participates in a variety of committees and working groups.
Trade associationEuropean Organization for Packaging and Environment (EUROPEN)
Is your position on climate change consistent with theirs?Consistent
Please explain the trade association’s positionEUROPEN supports the objectives of the EU Circular Economy package. EUROPEN advocates for a packaging waste policy
CDP Page of 9473

framework that clearly defines the roles and responsibilities of all actors involved in waste management. The new Circular EconomyPackage should safeguard the EU internal market and be based on the principle of life cycle assessment.
How have you, or are you attempting to, influence the position?PepsiCo is part of the EUROPEN Executive Committee and of the technical Task Force on Circular Economy that is responsible foranalyzing policy developments and building an advocacy plan for the association.
Trade associationEuropean Snacks Association (ESA)
Is your position on climate change consistent with theirs?Consistent
Please explain the trade association’s positionWe understand that ESA supports sustainable practices to protect natural resources.
How have you, or are you attempting to, influence the position?PepsiCo is an ESA Board member and holds the Chairmanship of the Communication Committee.
C12.3d
(C12.3d) Do you publicly disclose a list of all research organizations that you fund?No
C12.3e
(C12.3e) Provide details of the other engagement activities that you undertake.
Climate change is an important issue for our company, customers, consumers and our world. We believe governments and industryshould move quickly and commit to ambitious, science-based action, in an effort to reduce greenhouse gas (GHG) emissions andimprove our resilience to climate-related impacts.
PepsiCo has policies and programs in place to address climate change, and we engage regularly with industry, Non-GovernmentalOrganizations (NGOs) and other stakeholders to promote actions that protect the climate. For example, in 2017 we became afounding member of the U.S. Climate Leadership Council. We have a record of supporting climate policy through membership in theU.S. Climate Action Partnership, signing the American Business Act on Climate Pledge, and supporting the Paris Climate Agreement.
Our efforts on climate action include working to (i) expand the use of sustainable farming practices, (ii) deploy HFC-free coolingequipment, (iii) reduce emissions from our truck fleet, (iv) strive for zero deforestation in our supply chain, (v) increase recycledcontent in our packaging, and (vi) implement energy efficiency and renewable energy investments at our facilities.
PepsiCo is a member of many trade associations and other business and civil society associations, and we do not always agree withall of the positions these associations may take on specific policy matters. As such, there may be times when PepsiCo chooses not tofund certain initiatives sponsored by such organizations. PepsiCo representatives on the boards and committees of such groupsensure that PepsiCo’s position about policy or related activities is voiced.
C12.3f
CDP Page of 9474

(C12.3f) What processes do you have in place to ensure that all of your direct and indirect activities that influence policy areconsistent with your overall climate change strategy?
PepsiCo has specific teams and individuals that are assigned responsibilities for developing corporate policy and regulatory positions,as well as engaging on regulatory policy with external stakeholders, including public policymakers, trade associations and non-government actors. The Public Policy and Government Affairs (PPGA) teams manage relationships with government actors andcoordinates activities that may influence regulatory policy globally. Internally, the PPGA teams also work closely with the Office ofSustainability to ensure that our external engagements are aligned with our overall climate strategy. PPGA teams embedded withinour business divisions and markets also work with their counterpart sustainability teams within those divisions, as well as the Office ofSustainability to align on activities.
C12.4
(C12.4) Have you published information about your organization’s response to climate change and GHG emissionsperformance for this reporting year in places other than in your CDP response? If so, please attach the publication(s).
PublicationIn mainstream reports
StatusComplete
Attach the documentpepsico-inc-2017-annual-report.pdf
Content elementsGovernanceStrategyRisks & opportunities
PublicationIn voluntary sustainability report
StatusComplete
Attach the documentpepsico_2017_csr.pdf
Content elementsStrategyEmissions figuresEmission targetsOther metrics
PublicationIn voluntary communications
StatusComplete
Attach the documentA-Z Topics on Corporate Sustainability Topics - PepsiCo.pdf
Content elementsStrategyEmissions figuresEmission targetsOther metrics
CDP Page of 9475

C13. Other land management impacts
C-AC13.1/C-FB13.1/C-PF13.1
(C-AC13.1/C-FB13.1/C-PF13.1) Do you know if any of the management practices implemented on your own land disclosed inC-AC4.4a/C-FB4.4a/C-PF4.4a have other impacts besides climate change mitigation/adaptation?Yes
C-AC13.1a/C-FB13.1a/C-PF13.1a
(C-AC13.1a/C-FB13.1a/C-PF13.1a) Provide details on those management practices that have other impacts besides climatechange mitigation/adaptation and on your management response.
Management practice reference numberMP1
Overall effectPositive
Which of the following has been impacted?BiodiversitySoilWaterYieldOther, please specify (Waste, Ag Chemicals)
Description of impactOur Sustainable Farming Program (SFP) (formerly our Sustainable Farming Initiative, or SFI), is a program we use to engage withgrowers on farms of all sizes and types around the world in order to encourage continual improvement in sustainable farmingpractices, expand respect for workers' human rights, enhance growers' capabilities, and address risks. The SFP program iscomprised of two components: • The SFP Code, which lists PepsiCo’s farm-level sustainable agriculture principles and practices.The Code draws from principles of externally recognized agricultural codes, such as those published by the Rainforest Alliance,GlobalG.A.P., Bonsucro, and the Roundtable on Sustainable Palm Oil (RSPO). • The SFP Continuous Improvement Process,through which farmers are continually assessed and efforts are taken to drive improvement in sustainable agriculture. The SFPCode outlines the specific farm-level principles and practices that embody PepsiCo’s Sustainable Agriculture Policy. Theseprinciples span a comprehensive array of topics across the three widely recognized pillars of sustainability: Environmental, Socialand Economic. Under the Environmental pillar topics included are Ag Chemicals, Air, Biodiversity, Nutrients, Soil, Water and Wastein addition to climate related topics such as GHGs and Energy. Farmers are encouraged to adhere to the fundamental principlesand practices within each of these topics. As of year-end 2017, 79% of the volume of the agricultural raw materials that we directlysource has been supplied by FMGs engaged in the SFP.
Have you implemented any response(s) to these impacts?Yes
Description of the response(s)The percentage of Farm Management Groups engaged is one metric by which we are measuring progress. The second metric –representing our ultimate objective – is the percentage of directly sourced agricultural raw materials that we have verified assustainably sourced. PepsiCo considers an FMG verified sustainable when: • A representative sample of self-assessmentsdemonstrate that the farmers have implemented the Fundamental Principles of the SFP; and • A certain proportion of randomsamples from the self-assessment results are verified by a third party. The details of this process are being piloted. Once finalized,the requirements will be listed in an appendix in the SFP Scheme Rules. We made significant progress on SFP engagement in2017, and with that, progress towards our sustainable sourcing goal with target completion date of 2020.
Management practice reference numberMP2
Overall effectPositive
CDP Page of 9476

Which of the following has been impacted?BiodiversitySoilWaterYieldOther, please specify (Waste, Ag Chemicals)
Description of impactOur Sustainable Farming Program (SFP) (formerly our Sustainable Farming Initiative, or SFI), is a program we use to engage withgrowers on farms of all sizes and types around the world in order to encourage continual improvement in sustainable farmingpractices, expand respect for workers' human rights, enhance growers' capabilities, and address risks. The SFP program iscomprised of two components: • The SFP Code, which lists PepsiCo’s farm-level sustainable agriculture principles and practices.The Code draws from principles of externally recognized agricultural codes, such as those published by the Rainforest Alliance,GlobalG.A.P., Bonsucro, and the Roundtable on Sustainable Palm Oil (RSPO). • The SFP Continuous Improvement Process,through which farmers are continually assessed and efforts are taken to drive improvement in sustainable agriculture. The SFPCode outlines the specific farm-level principles and practices that embody PepsiCo’s Sustainable Agriculture Policy. Theseprinciples span a comprehensive array of topics across the three widely recognized pillars of sustainability: Environmental, Socialand Economic. Under the Environmental pillar topics included are Ag Chemicals, Air, Biodiversity, Nutrients, Soil, Water and Wastein addition to climate related topics such as GHGs and Energy. Farmers are encouraged to adhere to the fundamental principlesand practices within each of these topics. As of year-end 2017, 79% of the volume of the agricultural raw materials that we directlysource has been supplied by FMGs engaged in the SFP.
Have you implemented any response(s) to these impacts?Yes
Description of the response(s)The percentage of Farm Management Groups engaged is one metric by which we are measuring progress. The second metric –representing our ultimate objective – is the percentage of directly sourced agricultural raw materials that we have verified assustainably sourced. PepsiCo considers an FMG verified sustainable when: • A representative sample of self-assessmentsdemonstrate that the farmers have implemented the Fundamental Principles of the SFP; and • A certain proportion of randomsamples from the self-assessment results are verified by a third party. The details of this process are being piloted. Once finalized,the requirements will be listed in an appendix in the SFP Scheme Rules. We made significant progress on SFP engagement in2017, and with that, progress towards our sustainable sourcing goal with target completion date of 2020.
C-AC13.2/C-FB13.2/C-PF13.2
(C-AC13.2/C-FB13.2/C-PF13.2) Do you know if any of the management practices mentioned in C-AC12.2a/C-FB12.2a/C-PF12.2a that were implemented by your suppliers have other impacts besides climate change mitigation/adaptation?Yes
C-AC13.2a/C-FB13.2a/C-PF13.2a
(C-AC13.2a/C-FB13.2a/C-PF13.2a) Provide details of those management practices implemented by your suppliers that haveother impacts besides climate change mitigation/adaptation.
Management practice reference numberMP1
Overall effectPositive
Which of the following has been impacted?BiodiversitySoilWaterYieldOther, please specify (Waste, Ag Chemicals)
Description of impactsOur Sustainable Farming Program (SFP) (formerly our Sustainable Farming Initiative, or SFI), is a program we use to engage with
CDP Page of 9477

growers on farms of all sizes and types around the world in order to encourage continual improvement in sustainable farmingpractices, expand respect for workers' human rights, enhance growers' capabilities, and address risks. The SFP program iscomprised of two components: • The SFP Code, which lists PepsiCo’s farm-level sustainable agriculture principles and practices.The Code draws from principles of externally recognized agricultural codes, such as those published by the Rainforest Alliance,GlobalG.A.P., Bonsucro, and the Roundtable on Sustainable Palm Oil (RSPO). • The SFP Continuous Improvement Process,through which farmers are continually assessed and efforts are taken to drive improvement in sustainable agriculture. The SFPCode outlines the specific farm-level principles and practices that embody PepsiCo’s Sustainable Agriculture Policy. Theseprinciples span a comprehensive array of topics across the three widely recognized pillars of sustainability: Environmental, Socialand Economic. Under the Environmental pillar topics included are Ag Chemicals, Air, Biodiversity, Nutrients, Soil, Water and Wastein addition to climate related topics such as GHGs and Energy. Farmers are encouraged to adhere to the fundamental principlesand practices within each of these topics. As of year-end 2017, 79% of the volume of the agricultural raw materials that we directlysource has been supplied by FMGs engaged in the SFP.
Have any response to these impacts been implemented?Yes
Description of the response(s)The percentage of Farm Management Groups engaged is one metric by which we are measuring progress. The second metric –representing our ultimate objective – is the percentage of directly sourced agricultural raw materials that we have verified assustainably sourced. PepsiCo considers an FMG verified sustainable when: • A representative sample of self-assessmentsdemonstrate that the farmers have implemented the Fundamental Principles of the SFP; and • A certain proportion of randomsamples from the self-assessment results are verified by a third party. The details of this process are being piloted. Once finalized,the requirements will be listed in an appendix in the SFP Scheme Rules. We made significant progress on SFP engagement in2017, and with that, progress towards our sustainable sourcing goal with target completion date of 2020.
Management practice reference numberMP2
Overall effectPositive
Which of the following has been impacted?BiodiversitySoilWaterYieldOther, please specify (Waste, Ag Chemicals)
Description of impactsOur Sustainable Farming Program (SFP) (formerly our Sustainable Farming Initiative, or SFI), is a program we use to engage withgrowers on farms of all sizes and types around the world in order to encourage continual improvement in sustainable farmingpractices, expand respect for workers' human rights, enhance growers' capabilities, and address risks. The SFP program iscomprised of two components: • The SFP Code, which lists PepsiCo’s farm-level sustainable agriculture principles and practices.The Code draws from principles of externally recognized agricultural codes, such as those published by the Rainforest Alliance,GlobalG.A.P., Bonsucro, and the Roundtable on Sustainable Palm Oil (RSPO). • The SFP Continuous Improvement Process,through which farmers are continually assessed and efforts are taken to drive improvement in sustainable agriculture. The SFPCode outlines the specific farm-level principles and practices that embody PepsiCo’s Sustainable Agriculture Policy. Theseprinciples span a comprehensive array of topics across the three widely recognized pillars of sustainability: Environmental, Socialand Economic. Under the Environmental pillar topics included are Ag Chemicals, Air, Biodiversity, Nutrients, Soil, Water and Wastein addition to climate related topics such as GHGs and Energy. Farmers are encouraged to adhere to the fundamental principlesand practices within each of these topics. As of year-end 2017, 79% of the volume of the agricultural raw materials that we directlysource has been supplied by FMGs engaged in the SFP.
Have any response to these impacts been implemented?Yes
Description of the response(s)The percentage of Farm Management Groups engaged is one metric by which we are measuring progress. The second metric –representing our ultimate objective – is the percentage of directly sourced agricultural raw materials that we have verified assustainably sourced. PepsiCo considers an FMG verified sustainable when: • A representative sample of self-assessmentsdemonstrate that the farmers have implemented the Fundamental Principles of the SFP; and • A certain proportion of randomsamples from the self-assessment results are verified by a third party. The details of this process are being piloted. Once finalized,the requirements will be listed in an appendix in the SFP Scheme Rules. We made significant progress on SFP engagement in2017, and with that, progress towards our sustainable sourcing goal with target completion date of 2020.
CDP Page of 9478

C14. Signoff
C-FI
(C-FI) Use this field to provide any additional information or context that you feel is relevant to your organization's response.Please note that this field is optional and is not scored.
C14.1
(C14.1) Provide details for the person that has signed off (approved) your CDP climate change response.
Job title Corresponding job category
Row 1 Vice Chairman and Chief Scientific Officer Other C-Suite Officer
SC. Supply chain module
SC0.0
CDP Page of 9479

(SC0.0) If you would like to do so, please provide a separate introduction to this module.
PepsiCo products are enjoyed by consumers more than one billion times a day in more than 200 countries and territories around theworld. PepsiCo generated more than $63 billion in net revenue in 2017, driven by a complementary food and beverage portfolio thatincludes 22 brands that generate more than $1 billion each in estimated annual retail sales (e.g. Frito-Lay, Gatorade, Pepsi-Cola,Quaker and Tropicana). At the heart of PepsiCo is Performance with Purpose (PwP) – our goal to deliver top-tier financialperformance while creating sustainable growth and shareholder value. In practice, PwP means providing a wide range of foods andbeverages from treats to nutritious eats; trying to find innovative ways to reduce our impact on the environment and lower ouroperating costs; working to provide a safe and inclusive workplace for our employees globally; and respecting, supporting andinvesting in the local communities where we operate.
Cautionary Statement - Statements in this submission that are “forward-looking statements” are based on currently availableinformation, operating plans and projections about future events and trends. Terminology such as “aim,” “anticipate,” “believe,” “drive,”“estimate,” “expect,” “expressed confidence,” “forecast,” “future,” “goal,” “guidance,” “intend,” “may,” “objective,” “outlook,” “plan,”“position,” “potential,” “project,” “seek,” “should,” “strategy,” “target,” “will” or similar statements or variations of such terms areintended to identify forward-looking statements, although not all forward-looking statements contain such terms. Forward-lookingstatements inherently involve risks and uncertainties that could cause actual results to differ materially from those predicted in suchforward-looking statements. Such risks and uncertainties include, but are not limited to: changes in demand for PepsiCo’s products;changes in, or failure to comply with, applicable laws and regulations; imposition or proposed imposition of new or increased taxesaimed at PepsiCo’s products; imposition of labeling or warning requirements on PepsiCo’s products; changes in laws related topackaging and disposal of PepsiCo’s products; PepsiCo’s ability to compete effectively; political conditions, civil unrest or otherdevelopments and risks in the markets where PepsiCo’s products are made, manufactured, distributed or sold; PepsiCo’s ability togrow its business in developing and emerging markets; uncertain economic conditions in the countries in which PepsiCo operates;the ability to protect information systems against, or effectively respond to, a cybersecurity incident or other disruption; increasedcosts, disruption of supply or shortages of raw materials and other supplies; business disruptions; product contamination or tamperingor issues or concerns with respect to product quality, safety and integrity; damage to PepsiCo’s reputation or brand image; failure tosuccessfully complete or integrate acquisitions and joint ventures into PepsiCo’s existing operations or to complete or managedivestitures or refranchisings; changes in estimates and underlying assumptions regarding future performance that could result in animpairment charge; increase in income tax rates, changes in income tax laws or disagreements with tax authorities; failure to realizeanticipated benefits from PepsiCo’s productivity initiatives or global operating model; PepsiCo’s ability to recruit, hire or retain keyemployees or a highly skilled and diverse workforce; loss of any key customer or disruption to the retail landscape; any downgrade orpotential downgrade of PepsiCo’s credit ratings; PepsiCo’s ability to implement shared services or utilize information technologysystems and networks effectively; fluctuations or other changes in exchange rates; climate change or water scarcity, or legal,regulatory or market measures to address climate change or water scarcity; failure to successfully negotiate collective bargainingagreements, or strikes or work stoppages; infringement of intellectual property rights; potential liabilities and costs from litigation,claims, regulatory, or legal proceedings, inquiries or investigations; and other factors discussed in the risk factors section ofPepsiCo’s filings with the Securities and Exchange Commission. Investors are cautioned not to place undue reliance on any suchforward-looking statements, which speak only as of the date they are made. PepsiCo undertakes no obligation to update any forward-looking statements.
SC0.1
(SC0.1) What is your company’s annual revenue for the stated reporting period?
Annual Revenue
Row 1 63525484000
SC0.2
(SC0.2) Do you have an ISIN for your company that you would be willing to share with CDP?No
CDP Page of 9480

SC1.1
(SC1.1) Allocate your emissions to your customers listed below according to the goods or services you have sold them inthis reporting period.
Requesting memberCaesars Entertainment
Scope of emissionsScope 1
Emissions in metric tonnes of CO2e882
Uncertainty (±%)15
Major sources of emissionsThese emissions include those from PepsiCo's company-owned operations that have been allocated to Caesars Entertainment.Major sources include fuel use in PepsiCo's wholly-owned or operated manufacturing facilities globally that produce products thatmay or may not be sold to Caesars Entertainment. Also included is fuel use in transportation vehicles that are wholly-owned oroperated by PepsiCo.
VerifiedNo
Allocation methodAllocation based on the market value of products purchased
Please explain how you have identified the GHG source, including major limitations to this process and assumptionsmadeOur method for allocating emissions is to take the percentage of PepsiCo’s net revenue attributable to the customer in the reportingyear and apply this percentage to our global Scope 1, Scope 2 or Scope 3 emissions. Thus, our method does not distinguishbetween emissions from facilities that produce product sold to the customer versus emissions from all PepsiCo's productionfacilities world-wide.
Requesting memberCaesars Entertainment
Scope of emissionsScope 2
Emissions in metric tonnes of CO2e405
Uncertainty (±%)15
Major sources of emissionsThese emissions include those from indirect fuel use in the generation of electricity that is consumed by PepsiCo's directoperations - our wholly-owned or operated manufacturing facilities globally that produce products that may or may not be sold toCaesar’s Entertainment. These global emissions have then been allocated to Caesars Entertainment.
VerifiedNo
Allocation methodAllocation based on the market value of products purchased
Please explain how you have identified the GHG source, including major limitations to this process and assumptionsmadeOur method for allocating emissions is to take the percentage of PepsiCo’s net revenue attributable to the customer in the reportingyear and apply this percentage to our global Scope 1, Scope 2 or Scope 3 emissions. Thus, our method does not distinguishbetween emissions from facilities that produce product sold to the customer versus emissions from all PepsiCo's productionfacilities world-wide.
CDP Page of 9481

Requesting memberCaesars Entertainment
Scope of emissionsScope 3
Emissions in metric tonnes of CO2e14833
Uncertainty (±%)15
Major sources of emissionsThese emissions include all other indirect emissions from PepsiCo’s value chain, such as the extraction and production ofpurchased materials and fuels, transport-related activities in vehicles not owned or controlled by PepsiCo, electricity-relatedactivities (e.g. Transmission & Distribution (T&D) losses) not covered in Scope 2, outsourced activities, consumer use, wastedisposal, etc. All Scope 3 estimates are based on 2015 data and is planned to be updated every 5 years going forward. Theseglobal emissions have then been allocated to Caesars Entertainment.
VerifiedNo
Allocation methodAllocation based on the market value of products purchased
Please explain how you have identified the GHG source, including major limitations to this process and assumptionsmadeOur method for allocating emissions is to take the percentage of PepsiCo’s net revenue attributable to the customer in the reportingyear and apply this percentage to our global Scope 1, Scope 2 or Scope 3 emissions. Thus, our method does not distinguishbetween emissions from facilities that produce product sold to the customer versus emissions from all PepsiCo's productionfacilities world-wide.
Requesting memberRestaurant Brands International
Scope of emissionsScope 1
Emissions in metric tonnes of CO2e2912
Uncertainty (±%)15
Major sources of emissionsThese emissions include those from PepsiCo's company-owned operations that have been allocated to Restaurant BrandsInternational. Major sources include fuel use in PepsiCo's wholly-owned or operated manufacturing facilities globally that produceproducts that may or may not be sold to Restaurant Brands International. Also included is fuel use in transportation vehicles thatare wholly-owned or operated by PepsiCo.
VerifiedNo
Allocation methodAllocation based on the market value of products purchased
Please explain how you have identified the GHG source, including major limitations to this process and assumptionsmadeOur method for allocating emissions is to take the percentage of PepsiCo’s net revenue attributable to the customer in the reportingyear and apply this percentage to our global Scope 1, Scope 2 or Scope 3 emissions. Thus, our method does not distinguishbetween emissions from facilities that produce product sold to the customer versus emissions from all PepsiCo's productionfacilities world-wide.
Requesting memberRestaurant Brands International
Scope of emissionsScope 2
CDP Page of 9482

Emissions in metric tonnes of CO2e1336
Uncertainty (±%)15
Major sources of emissionsThese emissions include those from indirect fuel use in the generation of electricity that is consumed by PepsiCo's directoperations - our wholly-owned or operated manufacturing facilities globally that produce products that may or may not be sold toRestaurant Brands International. These global emissions have then been allocated to Restaurant Brands International.
VerifiedNo
Allocation methodAllocation based on the market value of products purchased
Please explain how you have identified the GHG source, including major limitations to this process and assumptionsmadeOur method for allocating emissions is to take the percentage of PepsiCo’s net revenue attributable to the customer in the reportingyear and apply this percentage to our global Scope 1, Scope 2 or Scope 3 emissions. Thus, our method does not distinguishbetween emissions from facilities that produce product sold to the customer versus emissions from all PepsiCo's productionfacilities world-wide.
Requesting memberRestaurant Brands International
Scope of emissionsScope 3
Emissions in metric tonnes of CO2e48980
Uncertainty (±%)15
Major sources of emissionsThese emissions include all other indirect emissions from PepsiCo’s value chain, such as the extraction and production ofpurchased materials and fuels, transport-related activities in vehicles not owned or controlled by PepsiCo, electricity-relatedactivities (e.g. T&D losses) not covered in Scope 2, outsourced activities, consumer use, waste disposal, etc. All Scope 3 estimatesare based on 2015 data and is planned to be updated every 5 years going forward. These global emissions have then beenallocated to Restaurant Brands International.
VerifiedNo
Allocation methodAllocation based on the market value of products purchased
Please explain how you have identified the GHG source, including major limitations to this process and assumptionsmadeOur method for allocating emissions is to take the percentage of PepsiCo’s net revenue attributable to the customer in the reportingyear and apply this percentage to our global Scope 1, Scope 2 or Scope 3 emissions. Thus, our method does not distinguishbetween emissions from facilities that produce product sold to the customer versus emissions from all PepsiCo's productionfacilities world-wide.
Requesting memberTarget Corporation
Scope of emissionsScope 1
Emissions in metric tonnes of CO2e40681
Uncertainty (±%)15
CDP Page of 9483
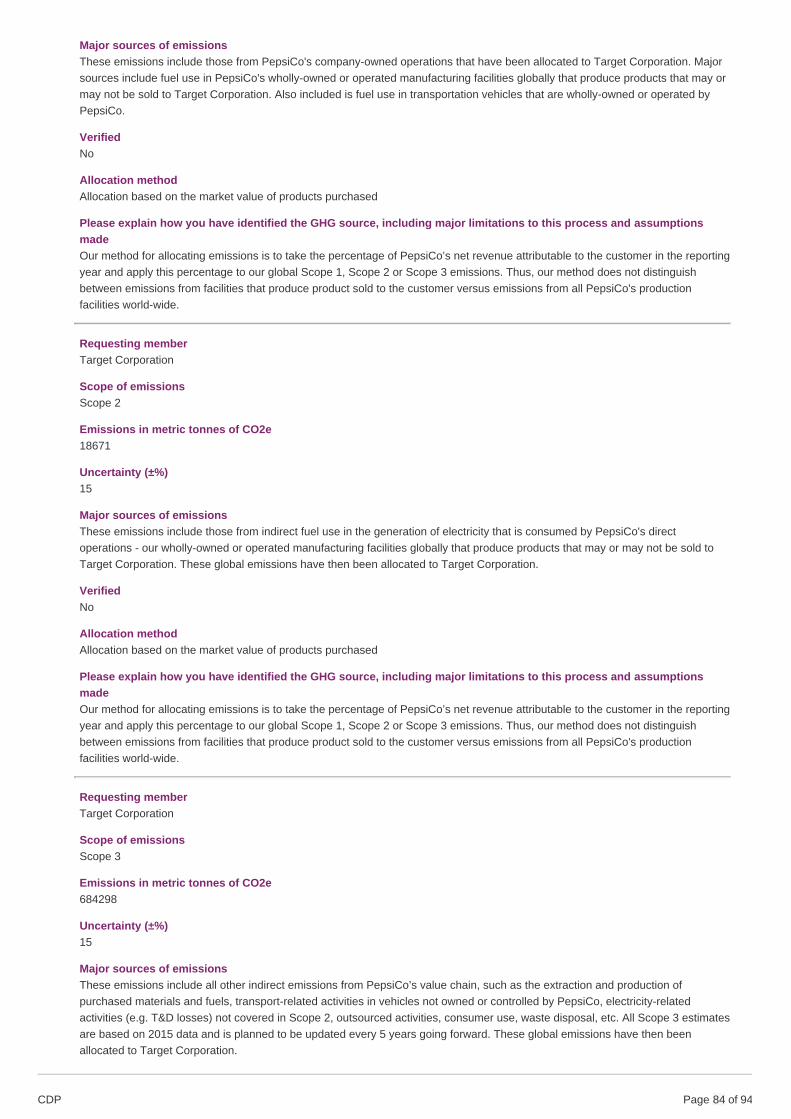
Major sources of emissionsThese emissions include those from PepsiCo's company-owned operations that have been allocated to Target Corporation. Majorsources include fuel use in PepsiCo's wholly-owned or operated manufacturing facilities globally that produce products that may ormay not be sold to Target Corporation. Also included is fuel use in transportation vehicles that are wholly-owned or operated byPepsiCo.
VerifiedNo
Allocation methodAllocation based on the market value of products purchased
Please explain how you have identified the GHG source, including major limitations to this process and assumptionsmadeOur method for allocating emissions is to take the percentage of PepsiCo’s net revenue attributable to the customer in the reportingyear and apply this percentage to our global Scope 1, Scope 2 or Scope 3 emissions. Thus, our method does not distinguishbetween emissions from facilities that produce product sold to the customer versus emissions from all PepsiCo's productionfacilities world-wide.
Requesting memberTarget Corporation
Scope of emissionsScope 2
Emissions in metric tonnes of CO2e18671
Uncertainty (±%)15
Major sources of emissionsThese emissions include those from indirect fuel use in the generation of electricity that is consumed by PepsiCo's directoperations - our wholly-owned or operated manufacturing facilities globally that produce products that may or may not be sold toTarget Corporation. These global emissions have then been allocated to Target Corporation.
VerifiedNo
Allocation methodAllocation based on the market value of products purchased
Please explain how you have identified the GHG source, including major limitations to this process and assumptionsmadeOur method for allocating emissions is to take the percentage of PepsiCo’s net revenue attributable to the customer in the reportingyear and apply this percentage to our global Scope 1, Scope 2 or Scope 3 emissions. Thus, our method does not distinguishbetween emissions from facilities that produce product sold to the customer versus emissions from all PepsiCo's productionfacilities world-wide.
Requesting memberTarget Corporation
Scope of emissionsScope 3
Emissions in metric tonnes of CO2e684298
Uncertainty (±%)15
Major sources of emissionsThese emissions include all other indirect emissions from PepsiCo’s value chain, such as the extraction and production ofpurchased materials and fuels, transport-related activities in vehicles not owned or controlled by PepsiCo, electricity-relatedactivities (e.g. T&D losses) not covered in Scope 2, outsourced activities, consumer use, waste disposal, etc. All Scope 3 estimatesare based on 2015 data and is planned to be updated every 5 years going forward. These global emissions have then beenallocated to Target Corporation.
CDP Page of 9484

VerifiedNo
Allocation methodAllocation based on the market value of products purchased
Please explain how you have identified the GHG source, including major limitations to this process and assumptionsmadeOur method for allocating emissions is to take the percentage of PepsiCo’s net revenue attributable to the customer in the reportingyear and apply this percentage to our global Scope 1, Scope 2 or Scope 3 emissions. Thus, our method does not distinguishbetween emissions from facilities that produce product sold to the customer versus emissions from all PepsiCo's productionfacilities world-wide.
Requesting memberTesco
Scope of emissionsScope 1
Emissions in metric tonnes of CO2e27983
Uncertainty (±%)15
Major sources of emissionsThese emissions include those from PepsiCo's company-owned operations that have been allocated to Tesco. Major sourcesinclude fuel use in PepsiCo's wholly-owned or operated manufacturing facilities globally that produce products that may or may notbe sold to Tesco. Also included is fuel use in transportation vehicles that are wholly-owned or operated by PepsiCo.
VerifiedNo
Allocation methodAllocation based on the market value of products purchased
Please explain how you have identified the GHG source, including major limitations to this process and assumptionsmadeOur method for allocating emissions is to take the percentage of PepsiCo’s net revenue attributable to the customer in the reportingyear and apply this percentage to our global Scope 1, Scope 2 or Scope 3 emissions. Thus, our method does not distinguishbetween emissions from facilities that produce product sold to the customer versus emissions from all PepsiCo's productionfacilities world-wide.
Requesting memberTesco
Scope of emissionsScope 2
Emissions in metric tonnes of CO2e12843
Uncertainty (±%)15
Major sources of emissionsThese emissions include those from indirect fuel use in the generation of electricity that is consumed by PepsiCo's directoperations - our wholly-owned or operated manufacturing facilities globally that produce products that may or may not be sold toTesco. These global emissions have then been allocated to Tesco.
VerifiedNo
Allocation methodAllocation based on the market value of products purchased
Please explain how you have identified the GHG source, including major limitations to this process and assumptionsmade
CDP Page of 9485

Our method for allocating emissions is to take the percentage of PepsiCo’s net revenue attributable to the customer in the reportingyear and apply this percentage to our global Scope 1, Scope 2 or Scope 3 emissions. Thus, our method does not distinguishbetween emissions from facilities that produce product sold to the customer versus emissions from all PepsiCo's productionfacilities world-wide.
Requesting memberTesco
Scope of emissionsScope 3
Emissions in metric tonnes of CO2e470702
Uncertainty (±%)15
Major sources of emissionsThese emissions include all other indirect emissions from PepsiCo’s value chain, such as the extraction and production ofpurchased materials and fuels, transport-related activities in vehicles not owned or controlled by PepsiCo, electricity-relatedactivities (e.g. T&D losses) not covered in Scope 2, outsourced activities, consumer use, waste disposal, etc. All Scope 3 estimatesare based on 2015 data and is planned to be updated every 5 years going forward. These global emissions have then beenallocated to Tesco.
VerifiedNo
Allocation methodAllocation based on the market value of products purchased
Please explain how you have identified the GHG source, including major limitations to this process and assumptionsmadeOur method for allocating emissions is to take the percentage of PepsiCo’s net revenue attributable to the customer in the reportingyear and apply this percentage to our global Scope 1, Scope 2 or Scope 3 emissions. Thus, our method does not distinguishbetween emissions from facilities that produce product sold to the customer versus emissions from all PepsiCo's productionfacilities world-wide.
Requesting memberWal Mart de Mexico
Scope of emissionsScope 1
Emissions in metric tonnes of CO2e22210
Uncertainty (±%)15
Major sources of emissionsThese emissions include those from PepsiCo's company-owned operations that have been allocated to Wal Mart de Mexico. Majorsources include fuel use in PepsiCo's wholly-owned or operated manufacturing facilities globally that produce products that may ormay not be sold to Wal Mart de Mexico. Also included is fuel use in transportation vehicles that are wholly-owned or operated byPepsiCo.
VerifiedNo
Allocation methodAllocation based on the market value of products purchased
Please explain how you have identified the GHG source, including major limitations to this process and assumptionsmadeOur method for allocating emissions is to take the percentage of PepsiCo’s net revenue attributable to the customer in the reportingyear and apply this percentage to our global Scope 1, Scope 2 or Scope 3 emissions. Thus, our method does not distinguishbetween emissions from facilities that produce product sold to the customer versus emissions from all PepsiCo's productionfacilities world-wide.
CDP Page of 9486

Requesting memberWal Mart de Mexico
Scope of emissionsScope 2
Emissions in metric tonnes of CO2e10193
Uncertainty (±%)15
Major sources of emissionsThese emissions include those from indirect fuel use in the generation of electricity that is consumed by PepsiCo's directoperations - our wholly-owned or operated manufacturing facilities globally that produce products that may or may not be sold toWal Mart de Mexico. These global emissions have then been allocated to Wal Mart de Mexico.
VerifiedNo
Allocation methodAllocation based on the market value of products purchased
Please explain how you have identified the GHG source, including major limitations to this process and assumptionsmadeOur method for allocating emissions is to take the percentage of PepsiCo’s net revenue attributable to the customer in the reportingyear and apply this percentage to our global Scope 1, Scope 2 or Scope 3 emissions. Thus, our method does not distinguishbetween emissions from facilities that produce product sold to the customer versus emissions from all PepsiCo's productionfacilities world-wide.
Requesting memberWal Mart de Mexico
Scope of emissionsScope 3
Emissions in metric tonnes of CO2e373595
Uncertainty (±%)15
Major sources of emissionsThese emissions include all other indirect emissions from PepsiCo’s value chain, such as the extraction and production ofpurchased materials and fuels, transport-related activities in vehicles not owned or controlled by PepsiCo, electricity-relatedactivities (e.g. T&D losses) not covered in Scope 2, outsourced activities, consumer use, waste disposal, etc. All Scope 3 estimatesare based on 2015 data and is planned to be updated every 5 years going forward. These global emissions have then beenallocated to Wal Mart de Mexico.
VerifiedNo
Allocation methodAllocation based on the market value of products purchased
Please explain how you have identified the GHG source, including major limitations to this process and assumptionsmadeOur method for allocating emissions is to take the percentage of PepsiCo’s net revenue attributable to the customer in the reportingyear and apply this percentage to our global Scope 1, Scope 2 or Scope 3 emissions. Thus, our method does not distinguishbetween emissions from facilities that produce product sold to the customer versus emissions from all PepsiCo's productionfacilities world-wide.
Requesting memberWal-Mart Stores, Inc.
Scope of emissionsScope 1
CDP Page of 9487

Emissions in metric tonnes of CO2e420100
Uncertainty (±%)15
Major sources of emissionsThese emissions include those from PepsiCo's company-owned operations that have been allocated to Wal-Mart Stores, Inc. Majorsources include fuel use in PepsiCo's wholly-owned or operated manufacturing facilities globally that produce products that may ormay not be sold to Wal-Mart Stores, Inc. Also included is fuel use in transportation vehicles that are wholly-owned or operated byPepsiCo.
VerifiedNo
Allocation methodAllocation based on the market value of products purchased
Please explain how you have identified the GHG source, including major limitations to this process and assumptionsmadeOur method for allocating emissions is to take the percentage of PepsiCo’s net revenue attributable to the customer in the reportingyear and apply this percentage to our global Scope 1, Scope 2 or Scope 3 emissions. Thus, our method does not distinguishbetween emissions from facilities that produce product sold to the customer versus emissions from all PepsiCo's productionfacilities world-wide.
Requesting memberWal-Mart Stores, Inc.
Scope of emissionsScope 2
Emissions in metric tonnes of CO2e192804
Uncertainty (±%)15
Major sources of emissionsThese emissions include those from indirect fuel use in the generation of electricity that is consumed by PepsiCo's directoperations - our wholly-owned or operated manufacturing facilities globally that produce products that may or may not be sold toWal-Mart Stores, Inc.. These global emissions have then been allocated to Wal-Mart Stores, Inc.
VerifiedNo
Allocation methodAllocation based on the market value of products purchased
Please explain how you have identified the GHG source, including major limitations to this process and assumptionsmadeOur method for allocating emissions is to take the percentage of PepsiCo’s net revenue attributable to the customer in the reportingyear and apply this percentage to our global Scope 1, Scope 2 or Scope 3 emissions. Thus, our method does not distinguishbetween emissions from facilities that produce product sold to the customer versus emissions from all PepsiCo's productionfacilities world-wide.
Requesting memberWal-Mart Stores, Inc.
Scope of emissionsScope 3
Emissions in metric tonnes of CO2e7066466
Uncertainty (±%)15
Major sources of emissions
CDP Page of 9488

These emissions include all other indirect emissions from PepsiCo’s value chain, such as the extraction and production ofpurchased materials and fuels, transport-related activities in vehicles not owned or controlled by PepsiCo, electricity-relatedactivities (e.g. T&D losses) not covered in Scope 2, outsourced activities, consumer use, waste disposal, etc. All Scope 3 estimatesare based on 2015 data and is planned to be updated every 5 years going forward. These global emissions have then beenallocated to Wal-Mart Stores, Inc.
VerifiedNo
Allocation methodAllocation based on the market value of products purchased
Please explain how you have identified the GHG source, including major limitations to this process and assumptionsmadeOur method for allocating emissions is to take the percentage of PepsiCo’s net revenue attributable to the customer in the reportingyear and apply this percentage to our global Scope 1, Scope 2 or Scope 3 emissions. Thus, our method does not distinguishbetween emissions from facilities that produce product sold to the customer versus emissions from all PepsiCo's productionfacilities world-wide.
Requesting memberPlease select
Scope of emissionsPlease select
Emissions in metric tonnes of CO2e
Uncertainty (±%)
Major sources of emissions
VerifiedPlease select
Allocation methodPlease select
Please explain how you have identified the GHG source, including major limitations to this process and assumptionsmade
SC1.2
(SC1.2) Where published information has been used in completing SC1.1, please provide a reference(s).
SC1.3
(SC1.3) What are the challenges in allocating emissions to different customers, and what would help you to overcome thesechallenges?
Allocationchallenges
Please explain what would help you overcome these challenges
Customer base istoo large anddiverse toaccurately trackemissions to thecustomer level
Currently PepsiCo follows the Greenhouse Gas (GHG) Protocol guidelines in developing an annual emissions inventory. Data is collected fromour facilities world-wide following an operational control approach. Our facilities manufacture a diverse range of products and we do not havededicated facilities by customer. Therefore, developing an emissions inventory or allocating emissions by customer accurately will not bepossible in the foreseeable future. PepsiCo would benefit from an industry level solution or methodology for allocation that takes into accountcurrent challenges in data systems and inventory processes for companies like PepsiCo.
CDP Page of 9489

SC1.4
(SC1.4) Do you plan to develop your capabilities to allocate emissions to your customers in the future?No
SC1.4b
(SC1.4b) Explain why you do not plan to develop capabilities to allocate emissions to your customers.
PepsiCo does not currently have the capability to allocate emissions for the many thousands of product types currently sold to ourcustomers, or to allocate those emissions to the many individual customers we have.
To address this, PepsiCo supports industry-wide solutions that allocate emissions in a consistent and credible way. PepsiCo is amember of the Beverage Industry Environmental Roundtable, which has developed and published sector specific guidelines onenvironmental footprint of products. PepsiCo is also interacting with expert stakeholders including the Carbon Trust, WorldResources Institute, World Business Council on Sustainable Development, and the Sustainability Consortium, as well as otherstakeholders such as Non-Governmental Organizations, other companies, academic institutions and governments to support theintroduction of common approaches to measure environmental footprint worldwide and to develop new global standards forquantifying enterprise and product-level greenhouse gas emissions.
SC2.1
(SC2.1) Please propose any mutually beneficial climate-related projects you could collaborate on with specific CDP SupplyChain members.
SC2.2
(SC2.2) Have requests or initiatives by CDP Supply Chain members prompted your organization to take organizational-levelemissions reduction initiatives?Yes
SC2.2a
(SC2.2a) Specify the requesting member(s) that have driven organizational-level emissions reduction initiatives, and provideinformation on the initiatives.
Requesting memberCaesars Entertainment
Initiative ID2017-ID1
Group type of projectChange to supplier operations
Type of projectImplementation of energy reduction projects
Description of the reduction initiative
CDP Page of 9490

As part of our Performance with Purpose (PwP) agenda, PepsiCo has a goal to reduce our entire value chain (Scope 1, 2 and 3)emissions by at least 20% by 2030 against a 2015 baseline. These reductions relate to our operational emissions and are due to anumber of measures undertaken within our facilities and fleet. Main programs contributing are our Resource Conservation (ReCon)program and fleet efficiency program.
Emissions reduction for the reporting year in metric tons of CO2e12
Did you identify this opportunity as part of the CDP supply chain Action Exchange?No
Would you be happy for CDP supply chain members to highlight this work in their external communication?Yes
Requesting memberCaesars Entertainment
Initiative ID2017-ID2
Group type of projectRelationship sustainability assessment
Type of projectAssessing products or services life-cycle foot print to identify efficiencies
Description of the reduction initiativeAs part of our Performance with Purpose (PwP) agenda, PepsiCo has a goal to reduce our entire value chain (Scope 1, 2 and 3)emissions by at least 20% by 2030 against a 2015 baseline. These reductions relate to our Scope 3 emissions and are due to anumber of initiatives including packaging sustainability, certified commodities and the deployment of our Higher Efficiency Coolersand Vending program.
Emissions reduction for the reporting year in metric tons of CO2e534
Did you identify this opportunity as part of the CDP supply chain Action Exchange?No
Would you be happy for CDP supply chain members to highlight this work in their external communication?Yes
Requesting memberRestaurant Brands International
Initiative ID2017-ID3
Group type of projectChange to supplier operations
Type of projectImplementation of energy reduction projects
Description of the reduction initiativeAs part of our Performance with Purpose (PwP) agenda, PepsiCo has a goal to reduce our entire value chain (Scope 1, 2 and 3)emissions by at least 20% by 2030 against a 2015 baseline. These reductions relate to our operational emissions and are due to anumber of measures undertaken within our facilities and fleet. Main programs contributing are our Resource Conservation (ReCon)program and fleet efficiency program.
Emissions reduction for the reporting year in metric tons of CO2e39
Did you identify this opportunity as part of the CDP supply chain Action Exchange?No
Would you be happy for CDP supply chain members to highlight this work in their external communication?Yes
Requesting member
CDP Page of 9491

Requesting memberRestaurant Brands International
Initiative ID2017-ID4
Group type of projectRelationship sustainability assessment
Type of projectAssessing products or services life-cycle foot print to identify efficiencies
Description of the reduction initiativeAs part of our Performance with Purpose (PwP) agenda, PepsiCo has a goal to reduce our entire value chain (Scope 1, 2 and 3)emissions by at least 20% by 2030 against a 2015 baseline. These reductions relate to our Scope 3 emissions and are due to anumber of initiatives including packaging sustainability, certified commodities and the deployment of our Higher Efficiency Coolersand Vending program.
Emissions reduction for the reporting year in metric tons of CO2e1765
Did you identify this opportunity as part of the CDP supply chain Action Exchange?No
Would you be happy for CDP supply chain members to highlight this work in their external communication?Yes
Requesting memberTarget Corporation
Initiative ID2017-ID5
Group type of projectChange to supplier operations
Type of projectImplementation of energy reduction projects
Description of the reduction initiativeAs part of our Performance with Purpose (PwP) agenda, PepsiCo has a goal to reduce our entire value chain (Scope 1, 2 and 3)emissions by at least 20% by 2030 against a 2015 baseline. These reductions relate to our operational emissions and are due to anumber of measures undertaken within our facilities and fleet. Main programs contributing are our Resource Conservation (ReCon)program and fleet efficiency program.
Emissions reduction for the reporting year in metric tons of CO2e539
Did you identify this opportunity as part of the CDP supply chain Action Exchange?No
Would you be happy for CDP supply chain members to highlight this work in their external communication?Yes
Requesting memberTarget Corporation
Initiative ID2017-ID6
Group type of projectRelationship sustainability assessment
Type of projectAssessing products or services life-cycle foot print to identify efficiencies
Description of the reduction initiativeAs part of our Performance with Purpose (PwP) agenda, PepsiCo has a goal to reduce our entire value chain (Scope 1, 2 and 3)emissions by at least 20% by 2030 against a 2015 baseline. These reductions relate to our Scope 3 emissions and are due to anumber of initiatives including packaging sustainability, certified commodities and the deployment of our Higher Efficiency Coolers
CDP Page of 9492

and Vending program.
Emissions reduction for the reporting year in metric tons of CO2e24655
Did you identify this opportunity as part of the CDP supply chain Action Exchange?No
Would you be happy for CDP supply chain members to highlight this work in their external communication?Yes
Requesting memberTesco
Initiative ID2017-ID7
Group type of projectChange to supplier operations
Type of projectImplementation of energy reduction projects
Description of the reduction initiativeAs part of our Performance with Purpose (PwP) agenda, PepsiCo has a goal to reduce our entire value chain (Scope 1, 2 and 3)emissions by at least 20% by 2030 against a 2015 baseline. These reductions relate to our operational emissions and are due to anumber of measures undertaken within our facilities and fleet. Main programs contributing are our Resource Conservation (ReCon)program and fleet efficiency program.
Emissions reduction for the reporting year in metric tons of CO2e371
Did you identify this opportunity as part of the CDP supply chain Action Exchange?No
Would you be happy for CDP supply chain members to highlight this work in their external communication?Yes
Requesting memberTesco
Initiative ID2017-ID8
Group type of projectRelationship sustainability assessment
Type of projectAssessing products or services life-cycle foot print to identify efficiencies
Description of the reduction initiativeAs part of our Performance with Purpose (PwP) agenda, PepsiCo has a goal to reduce our entire value chain (Scope 1, 2 and 3)emissions by at least 20% by 2030 against a 2015 baseline. These reductions relate to our Scope 3 emissions and are due to anumber of initiatives including packaging sustainability, certified commodities and the deployment of our Higher Efficiency Coolersand Vending program.
Emissions reduction for the reporting year in metric tons of CO2e16959
Did you identify this opportunity as part of the CDP supply chain Action Exchange?No
Would you be happy for CDP supply chain members to highlight this work in their external communication?Yes
Requesting memberWal Mart de Mexico
Initiative ID
CDP Page of 9493

2017-ID9
Group type of projectChange to supplier operations
Type of projectImplementation of energy reduction projects
Description of the reduction initiativeAs part of our Performance with Purpose (PwP) agenda, PepsiCo has a goal to reduce our entire value chain (Scope 1, 2 and 3)emissions by at least 20% by 2030 against a 2015 baseline. These reductions relate to our operational emissions and are due to anumber of measures undertaken within our facilities and fleet. Main programs contributing are our Resource Conservation (ReCon)program and fleet efficiency program.
Emissions reduction for the reporting year in metric tons of CO2e294
Did you identify this opportunity as part of the CDP supply chain Action Exchange?No
Would you be happy for CDP supply chain members to highlight this work in their external communication?Yes
Requesting memberWal Mart de Mexico
Initiative ID2017-ID10
Group type of projectRelationship sustainability assessment
Type of projectAssessing products or services life-cycle foot print to identify efficiencies
Description of the reduction initiativeAs part of our Performance with Purpose (PwP) agenda, PepsiCo has a goal to reduce our entire value chain (Scope 1, 2 and 3)emissions by at least 20% by 2030 against a 2015 baseline. These reductions relate to our Scope 3 emissions and are due to anumber of initiatives including packaging sustainability, certified commodities and the deployment of our Higher Efficiency Coolersand Vending program.
Emissions reduction for the reporting year in metric tons of CO2e13461
Did you identify this opportunity as part of the CDP supply chain Action Exchange?No
Would you be happy for CDP supply chain members to highlight this work in their external communication?Yes
Requesting memberWal-Mart Stores, Inc.
Initiative ID2017-ID11
Group type of projectChange to supplier operations
Type of projectImplementation of energy reduction projects
Description of the reduction initiativeAs part of our Performance with Purpose (PwP) agenda, PepsiCo has a goal to reduce our entire value chain (Scope 1, 2 and 3)emissions by at least 20% by 2030 against a 2015 baseline. These reductions relate to our operational emissions and are due to anumber of measures undertaken within our facilities and fleet. Main programs contributing are our Resource Conservation (ReCon)program and fleet efficiency program.
Emissions reduction for the reporting year in metric tons of CO2e
CDP Page of 9494

5570
Did you identify this opportunity as part of the CDP supply chain Action Exchange?No
Would you be happy for CDP supply chain members to highlight this work in their external communication?Yes
Requesting memberWal-Mart Stores, Inc.
Initiative ID2017-ID12
Group type of projectRelationship sustainability assessment
Type of projectAssessing products or services life-cycle foot print to identify efficiencies
Description of the reduction initiativeAs part of our Performance with Purpose (PwP) agenda, PepsiCo has a goal to reduce our entire value chain (Scope 1, 2 and 3)emissions by at least 20% by 2030 against a 2015 baseline. These reductions relate to our Scope 3 emissions and are due to anumber of initiatives including packaging sustainability, certified commodities and the deployment of our Higher Efficiency Coolersand Vending program.
Emissions reduction for the reporting year in metric tons of CO2e254604
Did you identify this opportunity as part of the CDP supply chain Action Exchange?No
Would you be happy for CDP supply chain members to highlight this work in their external communication?Yes
SC3.1
(SC3.1) Do you want to enroll in the 2018-2019 CDP Action Exchange initiative?No
SC3.2
(SC3.2) Is your company a participating supplier in CDP’s 2017-2018 Action Exchange initiative?No
SC4.1
(SC4.1) Are you providing product level data for your organization’s goods or services, if so, what functionality will you beusing?No, I am not providing data
SC4.2d
(SC4.2d) Have any of the initiatives described in SC4.2c been driven by requesting CDP Supply Chain members?Please select

Submit your response
In which language are you submitting your response?English
Please confirm how your response should be handled by CDP
Public or Non-Public Submission I am submitting to Are you ready to submit the additional Supply Chain Questions?
I am submitting my response Public InvestorsCustomers
Yes, submit Supply Chain Questions now
Please confirm belowI have read and accept the applicable Terms