penwithick modelling tools comparison v2 - home … and full sap were compared across the range of...
TRANSCRIPT

Penwithick Green Deal Pilot project: Comparison of various energy modelling tools Prepared for: The BRE Trust November 2012
Report number: 283 724

1 Penwithick Green Deal Pilot: Comparison of various energy modelling tools
BRE report number 283 724 Commercial in confidence
© Building Research Establishment Ltd 2012
Prepared by
Name Caroline Weeks
Position Senior Consultant
Signature
Reviewed by
Name Colin King
Position Associate Director, Wales
Date 30th November 2012
Signature
BRE Wales & SW Ethos Kings Road Swansea Waterfront SA1 8AS T + 44 (0) 1792 630100 F + 44 (0) 1792 630101 E [email protected] www.bre.co.uk
This report is made on behalf of BRE. By receiving the report and acting on it, the client - or any third party relying on it - accepts that no individual is personally liable in contract, tort or breach of statutory duty (including negligence).

2 Penwithick Green Deal Pilot: Comparison of various energy modelling tools
BRE report number 283 724 Commercial in confidence
© Building Research Establishment Ltd 2012
Executive Summary
Cornwall Council, with their delivery partner Ocean Services, are undertaking a Green Deal retrofit pilot project in the village of Penwithick, near St Austell. BRE are acting as Technical Advisors to the project team to help achieve their objectives. During the first phase of the pilot, initial modelling was carried out by BRE using full SAP (the Government’s Standard Assessment Procedure for dwellings) on all potential measures for the dwelling types in Penwithick to prioritise which were most cost effective. The most common measures, such as loft insulation and cavity wall insulation, were demonstrated to have acceptable payback periods and would therefore inevitably be viable under the Green Deal regardless of regional and occupancy influences. This study investigates more costly measures such as External Wall Insulation (EWI) and Air Source Heat Pumps (ASHPs) in more detail to see whether different modelling tools and/ or assumptions would suggest such measures to be more or less viable under the Green Deal.
A range of modelling tools have therefore been assessed during this study, including Reduced Data SAP (RdSAP), full SAP, PVSol for the assessment of photovoltaic (PV) systems and Design Builder, which allows tailoring of occupancy patterns and behavioural impacts.
RdSAP and full SAP were compared across the range of dwellings receiving refurbishment measures to assess the impact of more accurately specifying wall U values and window areas in full SAP for equivalent properties. Overall it was determined that full SAP will generally give a more accurate representation of the dwelling and typically forecasts higher savings than RdSAP. However, overall the differences between the two tools are not likely to be great enough to influence the viability of key refurbishment measures such as EWI and ASHPs under the Green Deal.
Since both RdSAP and full SAP make the same assumptions for PV, the electricity generation forecasts for dwellings receiving PV systems were compared with estimates using PVSol software. PVSol utilises regional solar irradiation data (in this case for a location near Newquay, Cornwall) and allows specific PV panel and inverter combinations to be modelled. On average, PVSol predicted a 16% improvement in energy generation compared to SAP, which could influence the payback periods of PV under funding mechanisms such as the Green Deal and the Feed in Tariff (FIT). SAP will provide pessimistic estimates for the south of the UK but optimistic estimates for the north. Therefore, models such as PVSol that allow localised solar conditions to be considered will provide a more accurate assessment of the likely generation of a given PV system.
Design Builder modelling software was used to assess a refined selection of dwellings so that occupancy impacts could be analysed and compared with standard RdSAP results. The objective was to determine whether specifying key variables in the Design Builder models (rather than using calculated assumptions in SAP) would provide more accurate forecasts of energy usage and whether different household types would find measures such as EWI or ASHPs more viable under the Green Deal as a result.
Ultimately, the accuracy of each model will be verified against real in-use monitoring data from the Penwithick pilot study in due course. In the short term, the modelling suggests that different sized households would be likely to experience variations in fuel costs and subsequent savings, with smaller occupancy households often saving relatively more than larger households as there are assumed to be less benefit from internal gains with fewer occupants. Additionally (and perhaps unsurprisingly), significant variation can be introduced when regional climate data is utilised in Design Builder, which would certainly affect the viability of measures under the Green Deal.

3 Penwithick Green Deal Pilot: Comparison of various energy modelling tools
BRE report number 283 724 Commercial in confidence
© Building Research Establishment Ltd 2012
Overall, despite variations that emerge across the various modelling tools assessed, it still appears that in the majority of cases the capital cost of EWI and ASHPs would need to reduce or be subsidised by additional funding/ grants in order to encourage the mainstream uptake of these measures. Further financial analysis will follow in due course to see what additional economic factors may also contribute (beneficially or detrimentally) to the occupancy impacts seen here.
BRE acknowledge the ongoing support of Cornwall Council during this research and give thanks for allowing use of the Penwithick pilot project as the basis and data source for this study. The longer term monitoring programme for the dwellings that the Council has instigated will also be an asset to this ongoing research. Also, BRE wish to thank Ocean Services, who have carried out the refurbishment measures on the dwellings and provided key information on the installed measures and their costs.
4 Penwithick Green Deal Pilot: Comparison of various energy modelling tools
BRE report number 283 724 Commercial in confidence
© Building Research Establishment Ltd 2012
Contents
1 Introduction 5 1.1 Background 5 1.2 Approach to the study 5
2 Comparison of RdSAP with full SAP 2009 8 2.1 Section summary: RdSAP vs full SAP 16
3 Comparison of SAP assumptions for PV with PVSol modelling 20
4 Comparison of RdSAP with Design Builder 22 4.1 Consideration of occupancy impacts 22 4.2 Derivation of occupancy and heating patterns for modelling 22 4.3 Standardised dwelling models 25 4.4 Results of occupancy modelling 27 4.5 Section summary: RdSAP vs Design Builder occupancy assessment 35 4.6 Consideration of regional climate data 36
5 Additional influencing factors 38 5.1 Under-heated homes 38 5.2 Comfort taking 38
6 Conclusions 40 6.1 RdSAP vs full SAP 40 6.2 SAP vs PVSol 40 6.3 RdSAP vs Design Builder 40 6.4 General 42
Annexe A: Fuel cost & CO2 emissions from RdSAP and Design Builder 43

5 Penwithick Green Deal Pilot: Comparison of various energy modelling tools
BRE report number 283 724 Commercial in confidence
© Building Research Establishment Ltd 2012
1 Introduction
Cornwall Council, with their delivery partner Ocean Services, are undertaking a Green Deal retrofit pilot project in the village of Penwithick, near St Austell. BRE are acting as Technical Advisors to the project team to help achieve their objectives. The purpose of the pilot is to determine which refurbishment measures are suitable for the various property types in the village (considered representative of Cornwall as a whole) and to investigate which offer the most benefits in terms of payback, cost savings to households and CO2 emissions reductions. A financial analysis will be completed to see how measures are likely to stack up against the Green Deal ‘golden rule’ based on energy modelling predictions. Properties receiving measures will be monitored to assess the resulting savings in fuel bills in order to provide a sensitivity analysis for the energy modelling and financial assessment.
1.1 Background
During the first phase of the pilot, initial modelling was carried out by BRE using full SAP (the Government’s Standard Assessment Procedure for dwellings) on all potential measures for dwellings in Penwithick to prioritise which were most cost effective. The findings were reported to the project team and the BRE Trust in May 2012 in the report ‘Penwithick Green Deal Pilot Project: Selection of properties for refurbishment measures’. The most common measures, such as loft insulation and cavity wall insulation, were demonstrated to have acceptable payback periods (<20 years) and would therefore inevitably be viable for the Green Deal regardless of occupancy influences.
It is likely that some households will wish to consider less conventional measures, particularly for hard to treat homes, such as solid wall and system built dwellings and/ or off-gas locations, including solid wall insulation (assumed to be externally applied in this study) and Air Source Heat Pumps. However, these are generally (currently at least) significantly more expensive measures and hence their viability under the Green Deal is less certain (or unviable within an acceptable period, as indicated from the above report). This study therefore investigates these more costly measures in more detail to see whether occupancy and behavioural factors would be likely to make such measures more or less viable.
Once completed, this data will be fed into the upcoming financial analysis in the next phase of the project to assess the impact on the potential Green Deal payback rates in more detail.
1.2 Approach to the study
1. Having established from the initial ‘Property Selection’ report the dwellings that would benefit most from receiving refurbishment measures, detailed surveys were carried out on the shortlisted properties, capturing the physical building parameters, the condition of various elements of the property and the occupancy patterns of the household.
2. Working alongside Ocean Services, the final properties and measures were selected based on their technical and practical suitability.
6 Penwithick Green Deal Pilot: Comparison of various energy modelling tools
BRE report number 283 724 Commercial in confidence
© Building Research Establishment Ltd 2012
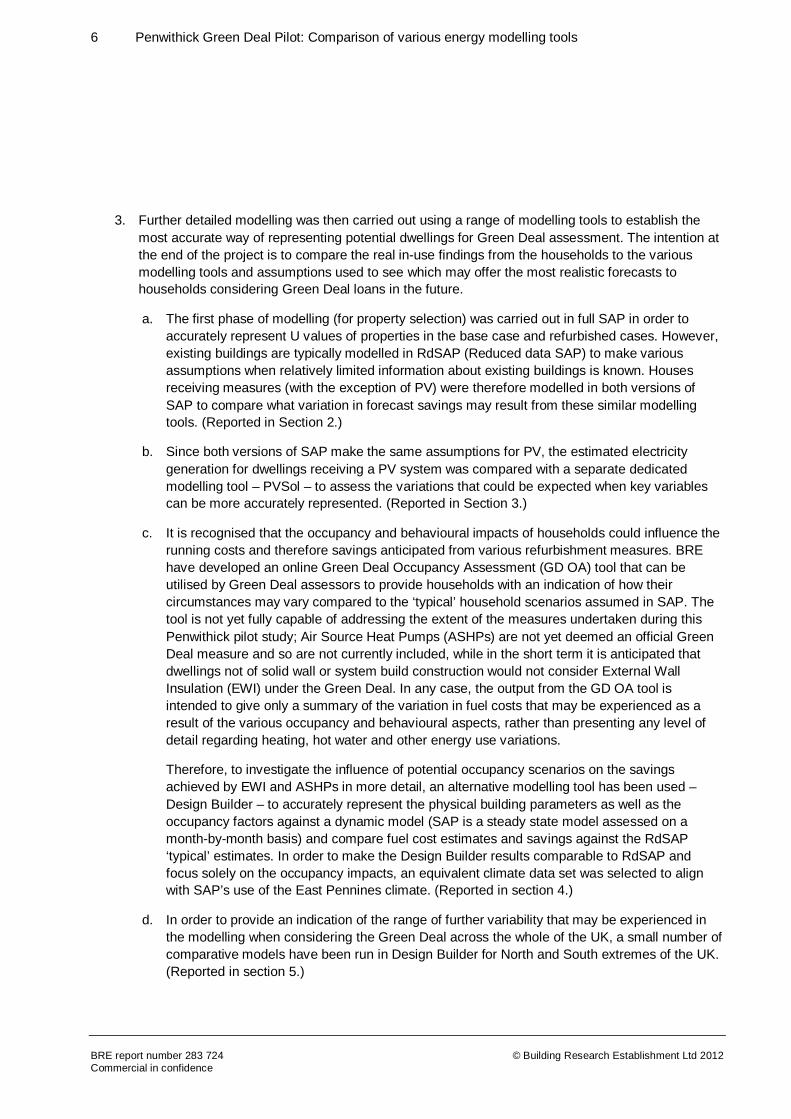
3. Further detailed modelling was then carried out using a range of modelling tools to establish the most accurate way of representing potential dwellings for Green Deal assessment. The intention at the end of the project is to compare the real in-use findings from the households to the various modelling tools and assumptions used to see which may offer the most realistic forecasts to households considering Green Deal loans in the future.
a. The first phase of modelling (for property selection) was carried out in full SAP in order to accurately represent U values of properties in the base case and refurbished cases. However, existing buildings are typically modelled in RdSAP (Reduced data SAP) to make various assumptions when relatively limited information about existing buildings is known. Houses receiving measures (with the exception of PV) were therefore modelled in both versions of SAP to compare what variation in forecast savings may result from these similar modelling tools. (Reported in Section 2.)
b. Since both versions of SAP make the same assumptions for PV, the estimated electricity generation for dwellings receiving a PV system was compared with a separate dedicated modelling tool – PVSol – to assess the variations that could be expected when key variables can be more accurately represented. (Reported in Section 3.)
c. It is recognised that the occupancy and behavioural impacts of households could influence the running costs and therefore savings anticipated from various refurbishment measures. BRE have developed an online Green Deal Occupancy Assessment (GD OA) tool that can be utilised by Green Deal assessors to provide households with an indication of how their circumstances may vary compared to the ‘typical’ household scenarios assumed in SAP. The tool is not yet fully capable of addressing the extent of the measures undertaken during this Penwithick pilot study; Air Source Heat Pumps (ASHPs) are not yet deemed an official Green Deal measure and so are not currently included, while in the short term it is anticipated that dwellings not of solid wall or system build construction would not consider External Wall Insulation (EWI) under the Green Deal. In any case, the output from the GD OA tool is intended to give only a summary of the variation in fuel costs that may be experienced as a result of the various occupancy and behavioural aspects, rather than presenting any level of detail regarding heating, hot water and other energy use variations.
Therefore, to investigate the influence of potential occupancy scenarios on the savings achieved by EWI and ASHPs in more detail, an alternative modelling tool has been used – Design Builder – to accurately represent the physical building parameters as well as the occupancy factors against a dynamic model (SAP is a steady state model assessed on a month-by-month basis) and compare fuel cost estimates and savings against the RdSAP ‘typical’ estimates. In order to make the Design Builder results comparable to RdSAP and focus solely on the occupancy impacts, an equivalent climate data set was selected to align with SAP’s use of the East Pennines climate. (Reported in section 4.)
d. In order to provide an indication of the range of further variability that may be experienced in the modelling when considering the Green Deal across the whole of the UK, a small number of comparative models have been run in Design Builder for North and South extremes of the UK. (Reported in section 5.)
7 Penwithick Green Deal Pilot: Comparison of various energy modelling tools
BRE report number 283 724 Commercial in confidence
© Building Research Establishment Ltd 2012
e. It is anticipated that the GD OA tool will be capable of assessing the Penwithick scenarios that it currently cannot prior to the publication of the later in-use reporting stages of this pilot project, hence it will be revisited at that time.
4. The data derived in the Design Builder occupancy assessment will undergo a detailed financial analysis to assess the likely viability of the more costly measures of EWI and ASHPs under the Green Deal in light of the occupancy impacts. This will be reported in the next phase of the study.
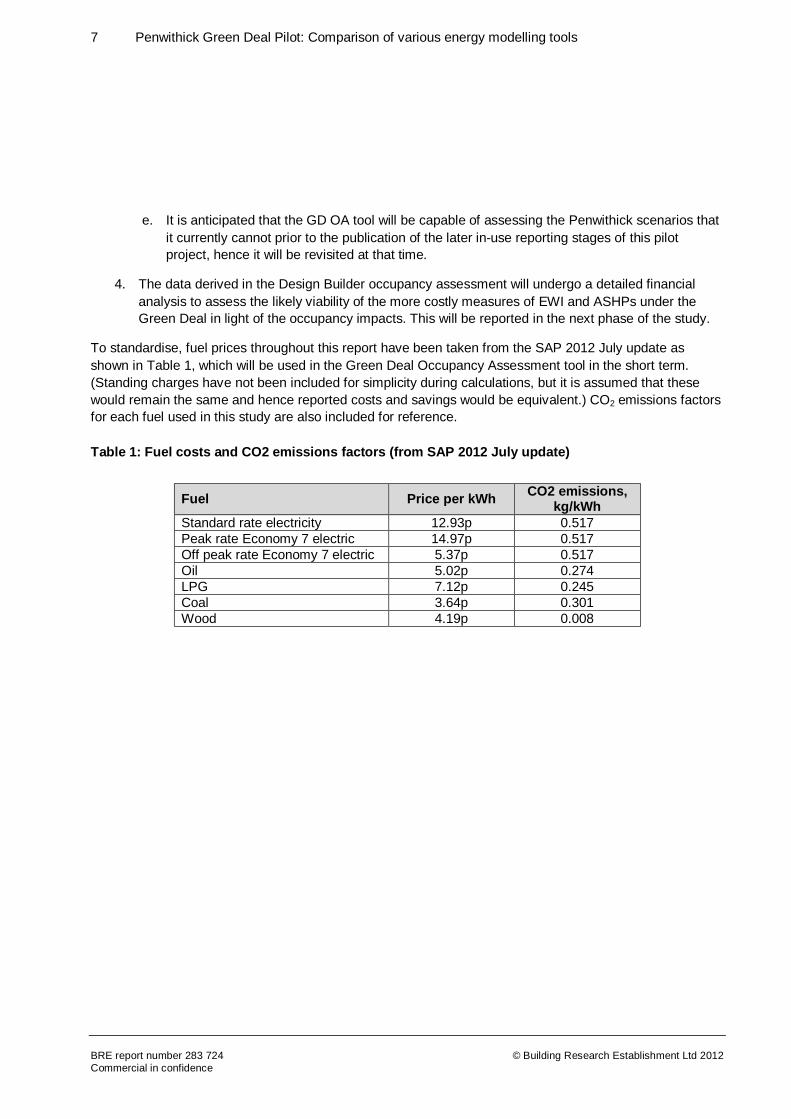
To standardise, fuel prices throughout this report have been taken from the SAP 2012 July update as shown in Table 1, which will be used in the Green Deal Occupancy Assessment tool in the short term. (Standing charges have not been included for simplicity during calculations, but it is assumed that these would remain the same and hence reported costs and savings would be equivalent.) CO2 emissions factors for each fuel used in this study are also included for reference.
Table 1: Fuel costs and CO2 emissions factors (from SAP 2012 July update)
Fuel Price per kWh CO2 emissions, kg/kWh
Standard rate electricity 12.93p 0.517 Peak rate Economy 7 electric 14.97p 0.517 Off peak rate Economy 7 electric 5.37p 0.517 Oil 5.02p 0.274 LPG 7.12p 0.245 Coal 3.64p 0.301 Wood 4.19p 0.008
8 Penwithick Green Deal Pilot: Comparison of various energy modelling tools
BRE report number 283 724 Commercial in confidence
© Building Research Establishment Ltd 2012
2 Comparison of RdSAP with full SAP 2009
The majority of dwellings receiving measures have been individually modelled in RdSAP and full SAP to assess the variations predicted by each tool. In cases where properties are just receiving ventilation measures or PV, these have not been included as the influence of ventilation fans will be negligible on overall building performance and energy generation by PV is independent of the energy performance of the dwelling. (The potential FIT income will be influenced by household behaviour through the ratio of offset usage while generating and export back to the grid, but since specific export meters have not been installed with the PV, the offset usage/ export ratio will be assumed at 50%.) Data for each dwelling was gathered from detailed site surveys, covering typical information required by SAP, plus more detailed information about occupancy patterns, condition and practical building features that may influence the installation of certain measures.
The purpose of this comparison is to assess the impact of some of the more ‘rigid’ assumptions that are made in RdSAP, particularly with regard to improvement measures. For instance, the U values assumed for Cornish-type properties are classed as ‘system build’ in RdSAP, giving a wall U value of 2.0 W/m2K. However, in full SAP it is possible to input bespoke U values for the ground level walls and the mansard of 2.42 W/m2K and 2.24 W/m2K respectively.
For the timber hybrid properties, RdSAP assumes a U value of 0.8 W/m2K for all of the walls. However, more detailed knowledge of the construction allows bespoke values to be entered into full SAP of 0.89 W/m2K for the front and rear walls and 0.74 W/m2K for the gable wall. RdSAP then assumes an improvement to 0.4 W/m2K when insulating these walls, whereas in reality the U value will be improved to 0.3 W/m2K.
The most recent version of RdSAP (v9.91) actually allows improved flexibility with data entry regarding U values, as it is possible to input a specific U value for an element. However, it is likely that Green Deal assessors will not have such specific knowledge of the dwellings they will be assessing, so more generalised assumptions with regard to construction methods are likely to be made, in line with the assumptions used in this RdSAP modelling.
The sample of properties across the following tables represent the variations typical of a random cross section of dwellings, including different fuel types, the use of secondary heating systems, floor area, building extensions and the extent of measures already carried out in the pre-refurbished houses. Hence this comparison looks to identify whether any general patterns emerge across the two SAP tools, despite this range of variety. (Absolute savings per measure are relatively incomparable due to these variations, so specific savings are not a focus of this comparison exercise.)
It should be noted that although SAP scores have been quoted in the tables below, the fuel prices used to calculate the annual running costs have been updated compared to those assumed in SAP 2009, to those given in Table 1.
9 Penwithick Green Deal Pilot: Comparison of various energy modelling tools
BRE report number 283 724 Commercial in confidence
© Building Research Establishment Ltd 2012
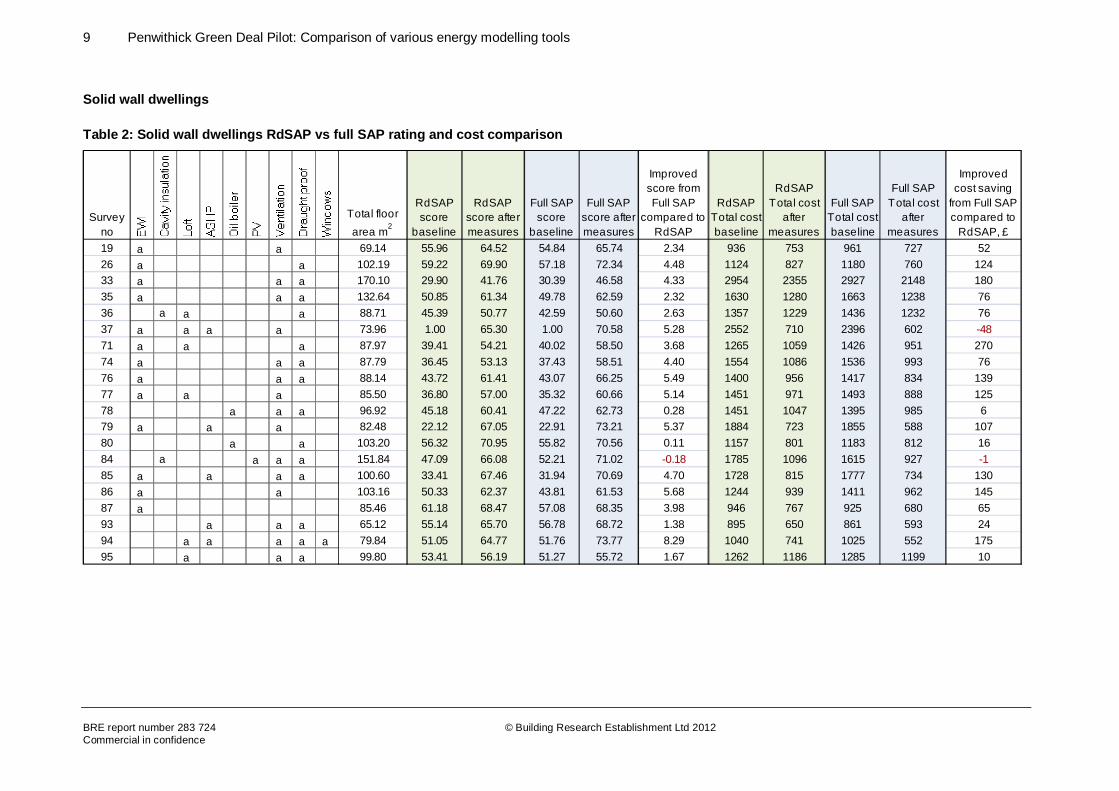
Solid wall dwellings
Table 2: Solid wall dwellings RdSAP vs full SAP rating and cost comparison
Survey no
Total floor area m2
RdSAP score
baseline
RdSAP score after measures
Full SAP score
baseline
Full SAP score after measures
Improved score from Full SAP
compared to RdSAP
RdSAP Total cost baseline
RdSAP Total cost
after measures
Full SAP Total cost baseline
Full SAP Total cost
after measures
Improved cost saving
from Full SAP compared to
RdSAP, £19 a a 69.14 55.96 64.52 54.84 65.74 2.34 936 753 961 727 5226 a a 102.19 59.22 69.90 57.18 72.34 4.48 1124 827 1180 760 12433 a a a 170.10 29.90 41.76 30.39 46.58 4.33 2954 2355 2927 2148 18035 a a a 132.64 50.85 61.34 49.78 62.59 2.32 1630 1280 1663 1238 7636 a a a 88.71 45.39 50.77 42.59 50.60 2.63 1357 1229 1436 1232 7637 a a a a 73.96 1.00 65.30 1.00 70.58 5.28 2552 710 2396 602 -4871 a a a 87.97 39.41 54.21 40.02 58.50 3.68 1265 1059 1426 951 27074 a a a 87.79 36.45 53.13 37.43 58.51 4.40 1554 1086 1536 993 7676 a a a 88.14 43.72 61.41 43.07 66.25 5.49 1400 956 1417 834 13977 a a a 85.50 36.80 57.00 35.32 60.66 5.14 1451 971 1493 888 12578 a a a 96.92 45.18 60.41 47.22 62.73 0.28 1451 1047 1395 985 679 a a a 82.48 22.12 67.05 22.91 73.21 5.37 1884 723 1855 588 10780 a a 103.20 56.32 70.95 55.82 70.56 0.11 1157 801 1183 812 1684 a a a a 151.84 47.09 66.08 52.21 71.02 -0.18 1785 1096 1615 927 -185 a a a a 100.60 33.41 67.46 31.94 70.69 4.70 1728 815 1777 734 13086 a a 103.16 50.33 62.37 43.81 61.53 5.68 1244 939 1411 962 14587 a 85.46 61.18 68.47 57.08 68.35 3.98 946 767 925 680 6593 a a a 65.12 55.14 65.70 56.78 68.72 1.38 895 650 861 593 2494 a a a a a 79.84 51.05 64.77 51.76 73.77 8.29 1040 741 1025 552 17595 a a a 99.80 53.41 56.19 51.27 55.72 1.67 1262 1186 1285 1199 10

10 Penwithick Green Deal Pilot: Comparison of various energy modelling tools
BRE report number 283 724 Commercial in confidence
© Building Research Establishment Ltd 2012
Figure 1: Forecast annual fuel savings for solid wall dwellings using RdSAP and full SAP

11 Penwithick Green Deal Pilot: Comparison of various energy modelling tools
BRE report number 283 724 Commercial in confidence
© Building Research Establishment Ltd 2012
It is interesting to note that for some dwellings in Table 2 the baseline RdSAP score is lower than the full SAP score, whereas for other dwellings it is higher. However, regardless of the starting SAP rating, the SAP score increase is greater in full SAP in all but one case (with that case being of negligible difference).
With the exception of two dwellings assessed, full SAP forecasts higher cost savings compared to RdSAP (by £87 on average), which for the dwellings receiving EWI will be largely due to the different uplift assumptions made to the wall U values (i.e. RdSAP assuming 0.6 W/m2K by default, full SAP using 0.3 W/m2K). For dwelling number 37, RdSAP actually estimates a greater saving as a result of different efficiency assumptions made for the ASHP (despite the same heat pump being used), which itself is likely to have been a result of different overall heat loss assumptions due to window area and U value differences between RdSAP and full SAP. Dwelling number 84 received cavity insulation in an extension rather than solid wall insulation and overall the outputs from RdSAP and full SAP are virtually identical.
An additional saving of ~£87 per year over a loan period of 20 years would help fund an additional £1740 worth of measures (not taking into account interest rates or fuel cost increases), equating to approximately 15% of the average savings forecast across the solid wall properties by full SAP. In some circumstances, this could improve the viability of EWI as a Green Deal measure (depending on the actual cost, the interest rates and other factors that would need to be taken into consideration).
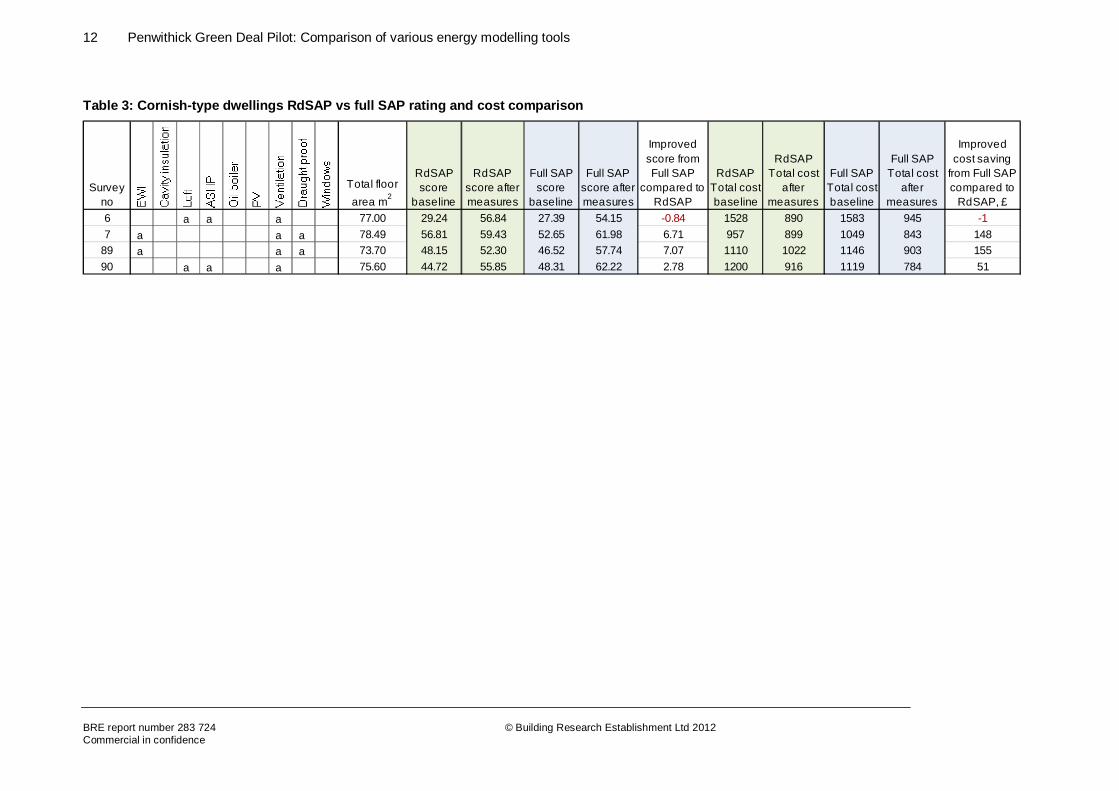
Cornish-type dwellings
The Cornish dwellings within the study are split into two key types – those that are essentially ‘as built’ (numbers 7 and 89) and those that have previously been refurbished by entirely replacing the concrete panelised walls at ground floor level with a cavity wall (numbers 6 and 90). The latter were therefore not suggested for external wall insulation but were instead offered ASHPs as they previously had no fixed heating system (relied on portable electric heaters or coal respectively).
Despite each pair of dwellings receiving comparable measures, the SAP scores in Table 3 demonstrate how other factors contribute to the potential savings, such as adjoined extensions and efficiencies in the fuel system used, which are both contributory across these four example dwellings. Overall however, full SAP forecasts higher cost savings compared to RdSAP (by ~£88 on average). This additional saving per year over a loan period of 20 years would help fund a further £1780 worth of measures (not taking into account interest rates and fuel cost increases), equating to approximately 25% of the average savings forecast across the Cornish properties by full SAP. However, this is not likely to be enough to improve the viability of more expensive measures such as ASHPs or EWI under the Green Deal for Cornish properties.
12 Penwithick Green Deal Pilot: Comparison of various energy modelling tools
BRE report number 283 724 Commercial in confidence
© Building Research Establishment Ltd 2012
Table 3: Cornish-type dwellings RdSAP vs full SAP rating and cost comparison
Survey no
Total floor area m2
RdSAP score
baseline
RdSAP score after measures
Full SAP score
baseline
Full SAP score after measures
Improved score from Full SAP
compared to RdSAP
RdSAP Total cost baseline
RdSAP Total cost
after measures
Full SAP Total cost baseline
Full SAP Total cost
after measures
Improved cost saving
from Full SAP compared to
RdSAP, £6 a a a 77.00 29.24 56.84 27.39 54.15 -0.84 1528 890 1583 945 -17 a a a 78.49 56.81 59.43 52.65 61.98 6.71 957 899 1049 843 148
89 a a a 73.70 48.15 52.30 46.52 57.74 7.07 1110 1022 1146 903 15590 a a a 75.60 44.72 55.85 48.31 62.22 2.78 1200 916 1119 784 51

13 Penwithick Green Deal Pilot: Comparison of various energy modelling tools
BRE report number 283 724 Commercial in confidence
© Building Research Establishment Ltd 2012
Figure 2: Forecast annual fuel savings for Cornish dwellings using RdSAP and full SAP
14 Penwithick Green Deal Pilot: Comparison of various energy modelling tools
BRE report number 283 724 Commercial in confidence
© Building Research Establishment Ltd 2012
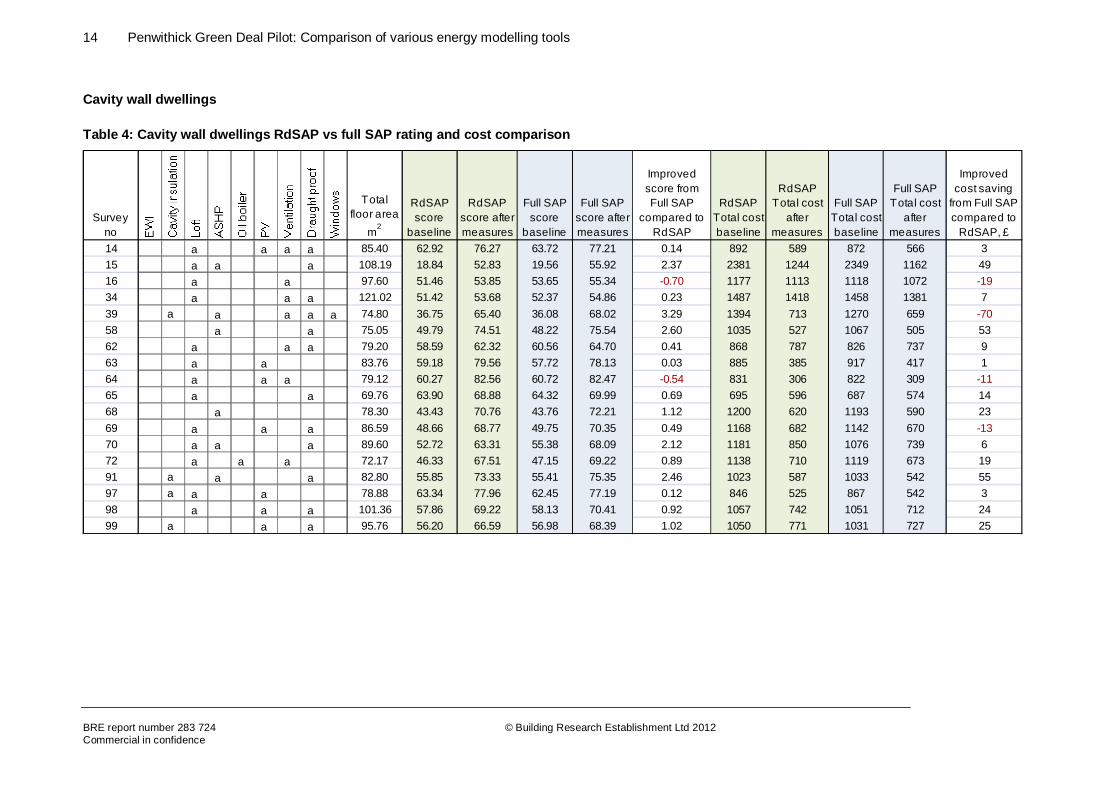
Cavity wall dwellings
Table 4: Cavity wall dwellings RdSAP vs full SAP rating and cost comparison
Survey no
Total floor area
m2
RdSAP score
baseline
RdSAP score after measures
Full SAP score
baseline
Full SAP score after measures
Improved score from Full SAP
compared to RdSAP
RdSAP Total cost baseline
RdSAP Total cost
after measures
Full SAP Total cost baseline
Full SAP Total cost
after measures
Improved cost saving
from Full SAP compared to
RdSAP, £14 a a a a 85.40 62.92 76.27 63.72 77.21 0.14 892 589 872 566 315 a a a 108.19 18.84 52.83 19.56 55.92 2.37 2381 1244 2349 1162 4916 a a 97.60 51.46 53.85 53.65 55.34 -0.70 1177 1113 1118 1072 -1934 a a a 121.02 51.42 53.68 52.37 54.86 0.23 1487 1418 1458 1381 739 a a a a a 74.80 36.75 65.40 36.08 68.02 3.29 1394 713 1270 659 -7058 a a 75.05 49.79 74.51 48.22 75.54 2.60 1035 527 1067 505 5362 a a a 79.20 58.59 62.32 60.56 64.70 0.41 868 787 826 737 963 a a 83.76 59.18 79.56 57.72 78.13 0.03 885 385 917 417 164 a a a 79.12 60.27 82.56 60.72 82.47 -0.54 831 306 822 309 -1165 a a 69.76 63.90 68.88 64.32 69.99 0.69 695 596 687 574 1468 a 78.30 43.43 70.76 43.76 72.21 1.12 1200 620 1193 590 2369 a a a 86.59 48.66 68.77 49.75 70.35 0.49 1168 682 1142 670 -1370 a a a 89.60 52.72 63.31 55.38 68.09 2.12 1181 850 1076 739 672 a a a 72.17 46.33 67.51 47.15 69.22 0.89 1138 710 1119 673 1991 a a a 82.80 55.85 73.33 55.41 75.35 2.46 1023 587 1033 542 5597 a a a 78.88 63.34 77.96 62.45 77.19 0.12 846 525 867 542 398 a a a 101.36 57.86 69.22 58.13 70.41 0.92 1057 742 1051 712 2499 a a a 95.76 56.20 66.59 56.98 68.39 1.02 1050 771 1031 727 25
15 Penwithick Green Deal Pilot: Comparison of various energy modelling tools
BRE report number 283 724 Commercial in confidence
© Building Research Establishment Ltd 2012
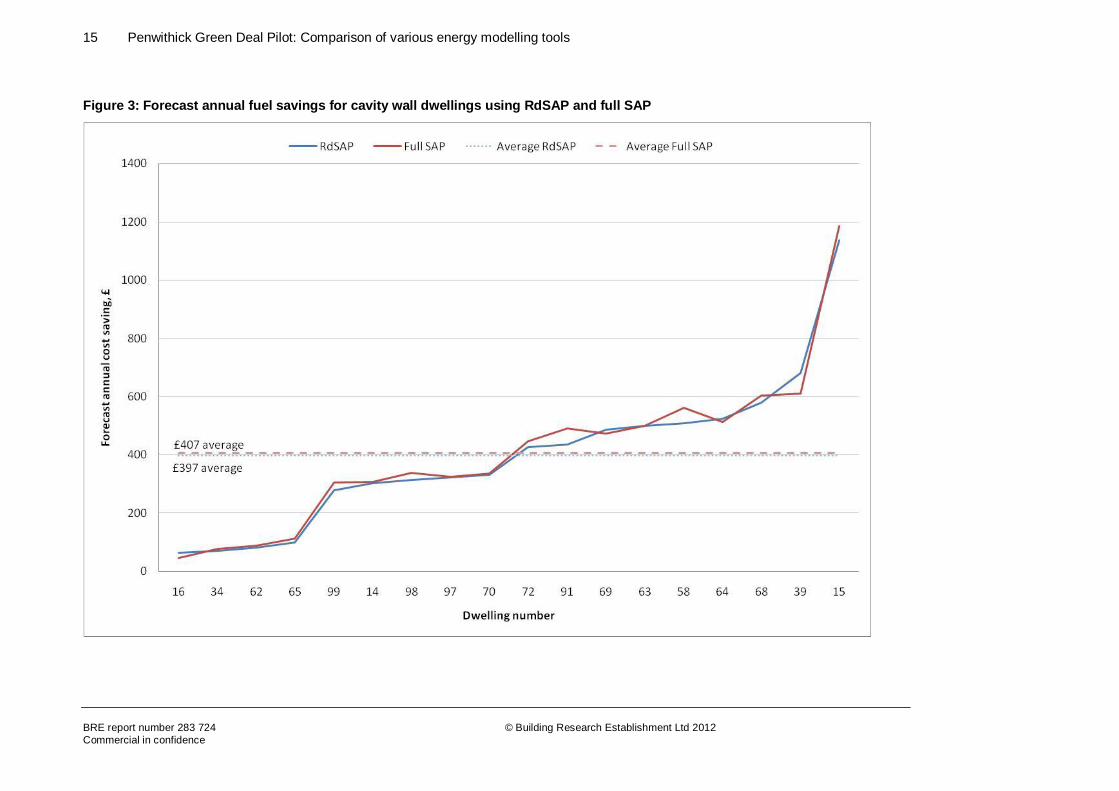
Figure 3: Forecast annual fuel savings for cavity wall dwellings using RdSAP and full SAP
16 Penwithick Green Deal Pilot: Comparison of various energy modelling tools
BRE report number 283 724 Commercial in confidence
© Building Research Establishment Ltd 2012
As with the solid wall dwellings, in some cases the baseline RdSAP score for the cavity dwellings from Table 4 is lower than the full SAP score, whereas for other dwellings it is higher. The largest SAP improvements from full SAP compared to RdSAP arise when an ASHP is modelled, suggesting that full SAP attributes more benefit to the ASHPs than the equivalent RdSAP model does. If this is a ‘real’ effect (i.e. is realised in real life installations) it will be a useful benefit for households considering a relatively expensive measure such as an ASHP under the Green Deal. However, the savings indicated by full SAP are not very large, so it is not likely to make a significant influence on the viability of such a measure under the Green Deal. (NB: For dwelling number 39, the difference in SAP score and cost savings between RdSAP and full SAP is likely to be more influenced by the different U value assumptions for the windows between each model rather than the impact of the ASHP.)
Cavity dwellings receiving other measures (i.e. not ASHPs) do not generally bring about such differences between the RdSAP and full SAP models.
Timber hybrid dwellings
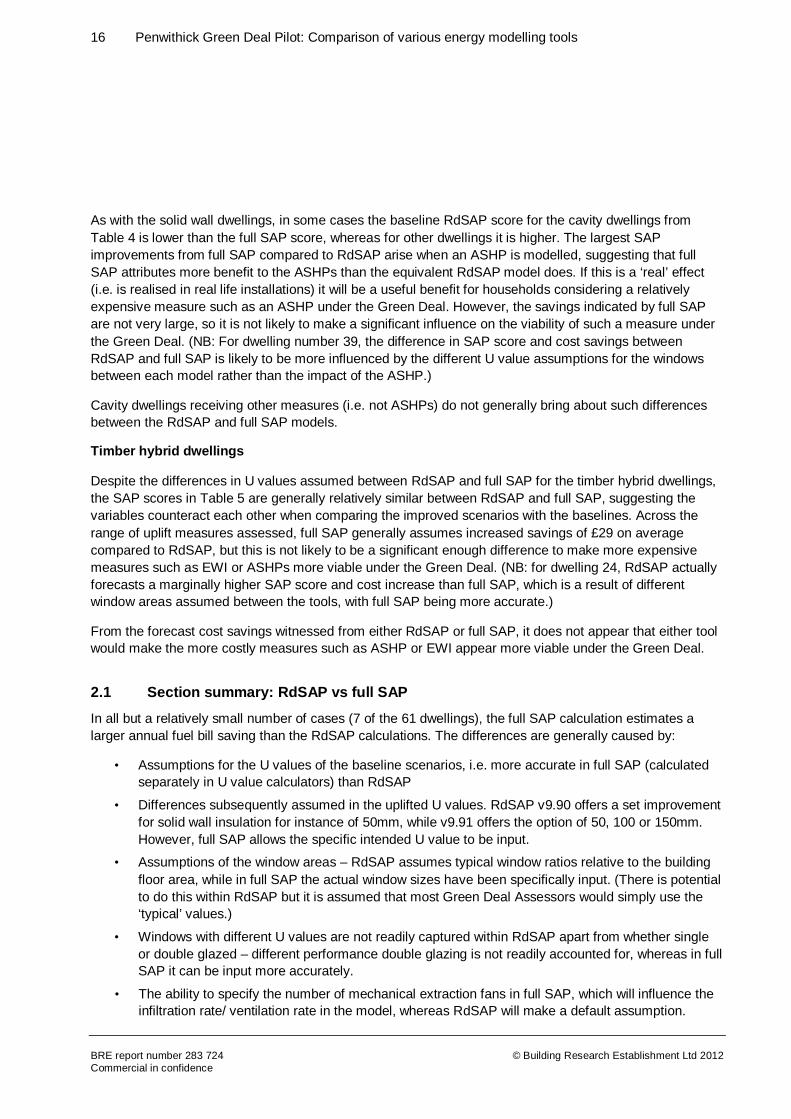
Despite the differences in U values assumed between RdSAP and full SAP for the timber hybrid dwellings, the SAP scores in Table 5 are generally relatively similar between RdSAP and full SAP, suggesting the variables counteract each other when comparing the improved scenarios with the baselines. Across the range of uplift measures assessed, full SAP generally assumes increased savings of £29 on average compared to RdSAP, but this is not likely to be a significant enough difference to make more expensive measures such as EWI or ASHPs more viable under the Green Deal. (NB: for dwelling 24, RdSAP actually forecasts a marginally higher SAP score and cost increase than full SAP, which is a result of different window areas assumed between the tools, with full SAP being more accurate.)
From the forecast cost savings witnessed from either RdSAP or full SAP, it does not appear that either tool would make the more costly measures such as ASHP or EWI appear more viable under the Green Deal.
2.1 Section summary: RdSAP vs full SAP
In all but a relatively small number of cases (7 of the 61 dwellings), the full SAP calculation estimates a larger annual fuel bill saving than the RdSAP calculations. The differences are generally caused by:
• Assumptions for the U values of the baseline scenarios, i.e. more accurate in full SAP (calculated separately in U value calculators) than RdSAP
• Differences subsequently assumed in the uplifted U values. RdSAP v9.90 offers a set improvement for solid wall insulation for instance of 50mm, while v9.91 offers the option of 50, 100 or 150mm. However, full SAP allows the specific intended U value to be input.
• Assumptions of the window areas – RdSAP assumes typical window ratios relative to the building floor area, while in full SAP the actual window sizes have been specifically input. (There is potential to do this within RdSAP but it is assumed that most Green Deal Assessors would simply use the ‘typical’ values.)
• Windows with different U values are not readily captured within RdSAP apart from whether single or double glazed – different performance double glazing is not readily accounted for, whereas in full SAP it can be input more accurately.
• The ability to specify the number of mechanical extraction fans in full SAP, which will influence the infiltration rate/ ventilation rate in the model, whereas RdSAP will make a default assumption.

17 Penwithick Green Deal Pilot: Comparison of various energy modelling tools
BRE report number 283 724 Commercial in confidence
© Building Research Establishment Ltd 2012
Table 5: Timber hybrid dwellings RdSAP vs full SAP rating and cost comparison
Survey no
Total floor area
m2
RdSAP score
baseline
RdSAP score after measures
Full SAP score
baseline
Full SAP score after measures
Improved score from Full SAP
compared to RdSAP
RdSAP Total cost baseline
RdSAP Total cost
after measures
Full SAP Total cost baseline
Full SAP Total cost
after measures
Improved cost saving
from Full SAP compared to
RdSAP, £2 a a 79.20 52.07 64.92 51.73 67.50 2.92 1015 750 1022 695 634 a a 90.42 53.27 56.55 54.84 58.21 0.09 1075 1013 1038 974 25 a a a a 80.30 51.12 62.30 52.99 65.55 1.38 1042 813 1002 743 3020 a a a a 78.10 67.69 72.07 67.15 72.02 0.49 742 640 755 642 1124 a a a 80.30 57.62 72.16 57.41 71.74 -0.21 981 650 986 660 -540 a a a a 78.84 52.07 64.37 53.13 67.11 1.68 1010 759 987 701 3641 a a a 80.30 57.66 66.55 56.40 66.65 1.36 900 721 927 719 3042 a a a a 79.20 40.54 66.77 40.38 67.11 0.50 1277 710 1281 703 1143 a a a 77.76 39.11 42.01 40.49 44.88 1.49 1298 1228 1264 1163 3244 a 96.16 58.79 60.91 58.25 61.89 1.52 987 935 1001 912 3745 a a 72.00 54.48 58.21 55.09 60.05 1.23 902 826 890 789 2546 a a 77.76 56.76 58.96 57.75 60.40 0.45 893 846 872 815 947 a a a 80.30 57.43 62.25 57.29 63.15 1.04 905 823 908 781 4548 a a a a 72.00 52.67 56.62 56.57 61.52 1.00 940 860 860 759 2049 a a 100.70 57.37 58.48 53.13 56.83 2.59 1063 1035 1170 1077 6652 a a a a 90.50 46.16 49.84 47.22 52.02 1.12 1240 1148 1213 1095 2653 a a a a 80.30 52.36 57.26 50.74 56.83 1.19 1016 910 1051 919 2555 a a a a 80.30 64.75 69.58 62.33 68.27 1.11 814 701 870 732 2657 a a a 76.32 38.93 65.61 36.25 68.23 5.30 1287 718 1354 719 66
18 Penwithick Green Deal Pilot: Comparison of various energy modelling tools
BRE report number 283 724 Commercial in confidence
© Building Research Establishment Ltd 2012
Figure 4: Forecast annual fuel savings for timber hybrid dwellings using RdSAP and full SAP
19 Penwithick Green Deal Pilot: Comparison of various energy modelling tools
BRE report number 283 724 Commercial in confidence
© Building Research Establishment Ltd 2012
Since there are such a mix of improvement measures and different baseline starting points across each of the dwellings, it is very difficult to identify trends in cost savings per measure across the properties selected. For this reason, it has been necessary to standardise the modelling in the section X in order to allow comparisons between tools and to identify the relative benefits of key improvement measures such as ASHPs and EWI.
In general, the results from the full SAP assessment of the dwellings is likely to be more accurate than those from RdSAP because the baseline U values and improved values are better represented, while RdSAP makes assumptions based on the year and construction given for the property. Some additional factors influence a small number of models, such as the window area assumed in RdSAP compared to the measured values input into full SAP, which could have a positive or negative effect on the heat loss calculation depending on whether the ratio is smaller or greater than in reality.
Typically, full SAP forecasts slightly improved cost savings compared to RdSAP, which would offer improved paybacks under the Green Deal. However, the RdSAP results are generally more conservative in their savings estimates, which may be more reassuring to householders, but may limit the uptake of some measures.
The difference between RdSAP and full SAP ultimately hinges on the knowledge that the assessor would have about a particular house while doing an assessment. RdSAP makes more generalised assumptions than full SAP, but full SAP relies on knowledge from other sources, e.g. U value calculators to input more accurate U values for the thermal elements, which a Green Deal assessor may not have to hand. Overall however, it seems there would be limited scenarios where the differences in assumptions made between RdSAP and full SAP could bring about enough variation to influence the viability of measures such as EWI and ASHPs under the Green Deal.

20 Penwithick Green Deal Pilot: Comparison of various energy modelling tools
BRE report number 283 724 Commercial in confidence
© Building Research Establishment Ltd 2012
3 Comparison of SAP assumptions for PV with PVSol modelling
SAP models make assumptions for the electricity generation from typical performance PV panels. However, there are alternative modelling tools available dedicated to the forecast of PV electrical generation that are generally accepted to offer more accurate forecasting. For comparison, the results from SAP have been compared with models using PVSol software to assess these differences.
Within PVSol, the specific PV panel and inverter combinations being installed on the dwellings were modelled, taking into account the precise roof pitch and orientation measured on site (SAP modelling assumed approximate roof pitch and orientation from visual surveys). The software also contains a large database of solar irradiation data for various locations, allowing a location close to the installation site to be selected (St Mawgan, near Newquay, on a similar latitude to Penwithick), rather than relying on generalised assumptions for the UK as in SAP. The PV systems were designed and specified on a house-by-house basis by Ocean Services and utilised Aleo PV panels and SMA Sunnyboy inverters.
Table 6 shows the dwellings receiving PV panels under the pilot programme and the relevant panel size and general orientation. It also shows the kWh electricity generation assumed in both SAP (RdSAP and full SAP use the same estimates) and PVSol.
Table 6: PV panel sizes and forecast output from SAP and PVSol
Dwelling no
General roof
orientation
Installed kWp
SAP forecast
electricity generation,
kWh/y
PVSol forecast
electricity generation,
kWh/y
% increase
in PVSol
estimate 88 S 1.92 1648 1889 15% 96 SE 1.92 1577 1889 20% 97 SE 1.92 1577 1889 20% 98 SE 1.92 1577 1889 20%
100 SE 1.92 1577 1889 20% 27 SW 1.92 1577 1889 20% 99 SW 1.92 1577 1889 20% 3 SE 2.4 1972 2316 17%
38 SE 2.4 1972 2262 15% 14 SW 2.4 1972 2262 15% 81 SW 2.4 1972 2342 19% 25 S 2.88 2472 2876 16% 28 S 2.88 2472 2828 14% 60 SE 2.88 2366 2730 15% 69 S 3.36 2884 3310 15% 84 S 3.36 2884 3310 15% 59 SW 3.36 2761 3172 15% 63 SW 3.36 2761 3128 13% 64 SW 3.36 2761 3128 13% 22 SW 3.60 2958 3236 9%
21 Penwithick Green Deal Pilot: Comparison of various energy modelling tools
BRE report number 283 724 Commercial in confidence
© Building Research Establishment Ltd 2012
Within the PVSol modelling, some minor variation between what appear to be similar panel sizes are due to more accurate representation of roof pitch and angle of orientation from South that can be entered more specifically in PVSol (by degree, measured on site in a separate survey) compared to SAP. In general, PVSol forecasts an increase in electricity generation compared to SAP (average 16% increase) as a result of the more accurate climate data and methodology used in its calculations, which will obviously provide households with increased offset electrical usage or revenue from the Feed in Tariff.
At the current rate of Feed in Tariff (16p/kWh generation, 3.2p/kWh export to grid) and assuming that 50% of the electricity is offset at 12.93p/kWh (Table 1) and 50% exported to grid, the average increased benefit from the additional forecast electricity would be £82 per year, equivalent to £1640 over 20 years (not considering likely cost increases in electricity or index linking of the FIT rates).
Since the forecast electricity generation from SAP is more conservative than PVSol in this Southerly location, it may reassure householders that they should at least be able to achieve the paybacks forecast in the Green Deal assessment, which will be based on SAP. This may also help to account (mostly or partially) for decreases in PV panel performance over their intended lifespan typically of up to 20% as quoted by manufacturers. (Figures quoted in Table 6 assume performance for the first year of installation, i.e. panel at their most efficient.)
It should be noted however, that since SAP assumes solar irradiation on a latitude central to the UK (across the Pennines at 53.4°), locations South of this may experience greater savings as indicated above for Cornwall, but locations North of this may experience reduced savings, as solar irradiation tends to reduce further North from the equator. Hence, households in Northern parts of the UK should regard estimates from SAP as optimistic and consider seeking more accurate modelling in a tool able to utilise local solar irradiation data before considering the payback that may be achieved under a mechanism such as the Green Deal and/ or the Feed in tariff.
22 Penwithick Green Deal Pilot: Comparison of various energy modelling tools
BRE report number 283 724 Commercial in confidence
© Building Research Establishment Ltd 2012
4 Comparison of RdSAP with Design Builder
4.1 Consideration of occupancy impacts
SAP makes standardised assumptions for occupancy patterns within dwellings. However, actual household patterns are likely to differ from these assumptions and will therefore introduce potential variations in the savings that may be achieved by households. In some instances this may make improvement measures pay back more quickly, while in others it may actually extend the potential payback periods.
For more costly measures such as solid wall insulation and air source heat pumps, the standard occupancy scenarios of SAP suggest that the savings achieved would not allow the Green Deal to be viable (see earlier report on Property Selection). An analysis has been done on a range of occupancy scenarios using the Design Builder modelling tool that allows behavioural patterns to be considered, to see if any households are likely to experience greater viability of such measures under the Green Deal. (The financial analysis that will follow will elaborate on these results further.)
Unlike SAP, Design Builder is a graphical user interface-based building energy simulation tool that uses EnergyPlus as its simulation engine. It allows more control of variables such as weather data, occupancy, heating system, etc. Each heating system can be controlled using a profile through which seasonal variations in performance can be emulated. For this study, it has been used to assess the impact of variations in occupancy profiles on the likely savings achieved by EWI and ASHPs.
4.2 Derivation of occupancy and heating patterns for modelling
During the initial surveys carried out to establish the building parameters and building condition etc, information was also collected about household occupancy and behavioural patterns, including:
• Number of people (adults and children) in household
• Hours in the day when someone is typically at home (Monday to Friday, Saturday to Sunday)
• Hours in the day when the heating is typically switched on (Monday to Friday, Saturday to Sunday)
• Typical temperature preferred by the household (if known)
The data gathered across the participating households was then analysed and ultimately categorised into 5 occupancy groups that were then used to derive average profiles. These are shown in Table 7.
23 Penwithick Green Deal Pilot: Comparison of various energy modelling tools
BRE report number 283 724 Commercial in confidence
© Building Research Establishment Ltd 2012
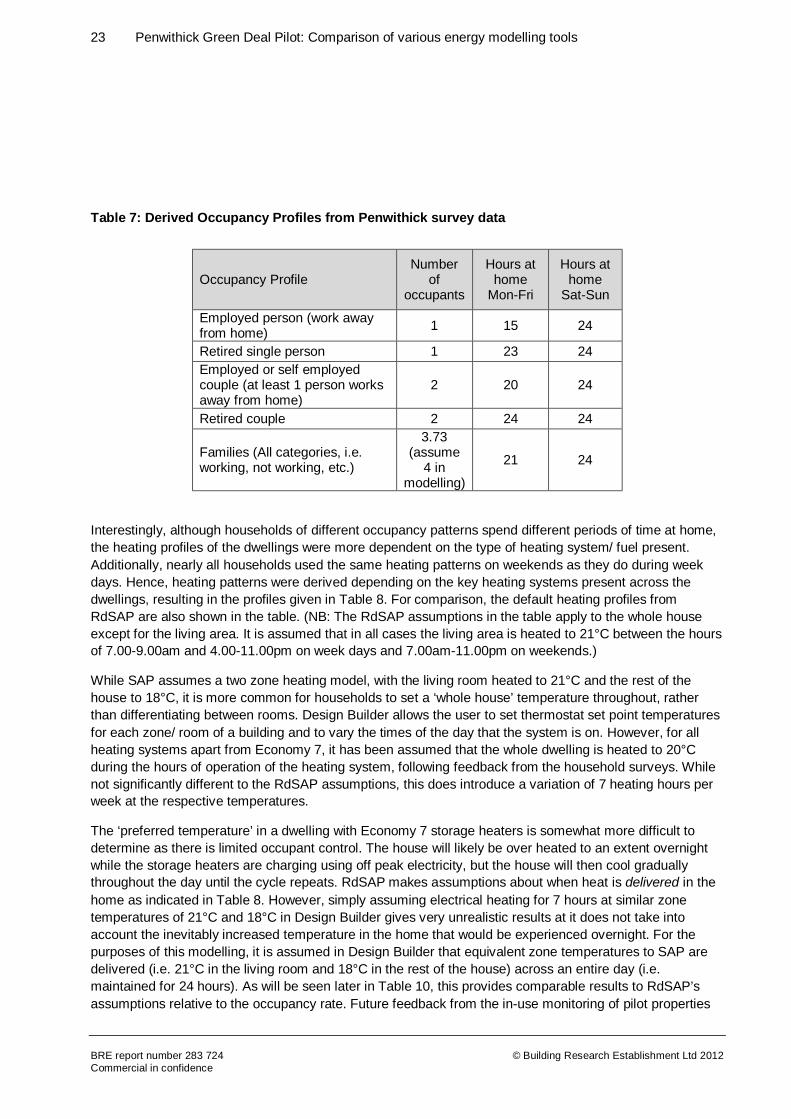
Table 7: Derived Occupancy Profiles from Penwithick survey data
Occupancy Profile Number
of occupants
Hours at home
Mon-Fri
Hours at home
Sat-Sun
Employed person (work away from home) 1 15 24
Retired single person 1 23 24 Employed or self employed couple (at least 1 person works away from home)
2 20 24
Retired couple 2 24 24
Families (All categories, i.e. working, not working, etc.)
3.73 (assume
4 in modelling)
21 24
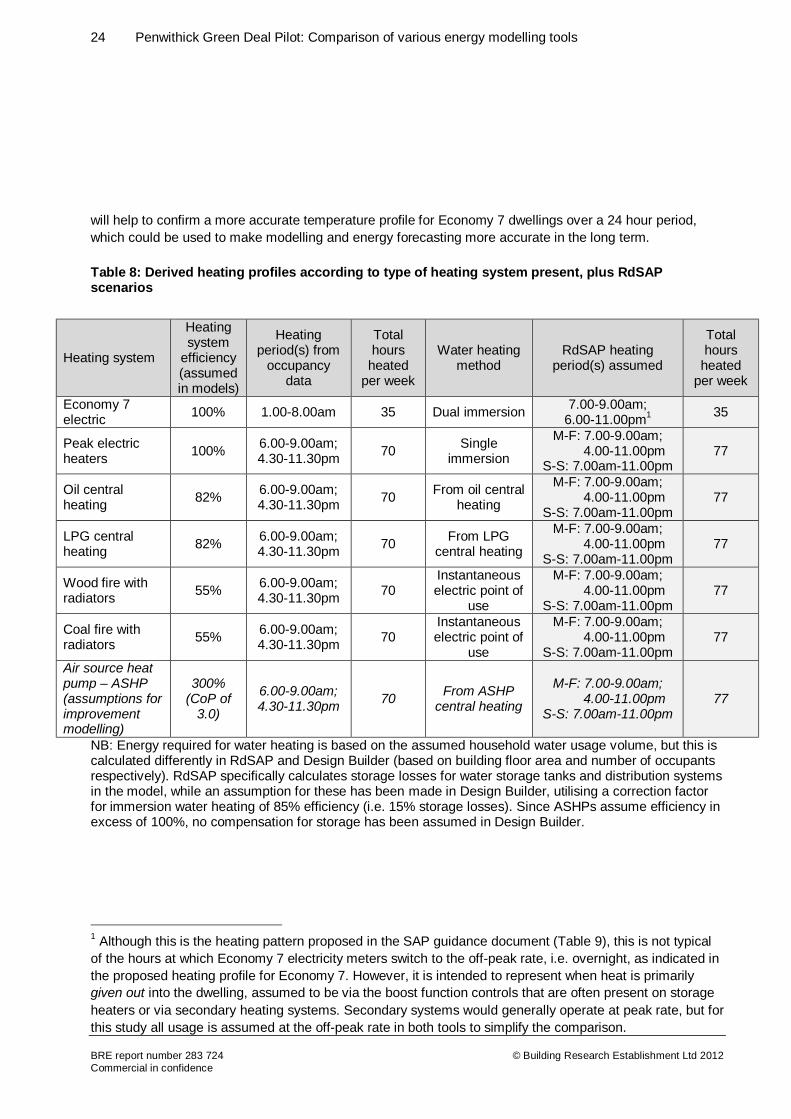
Interestingly, although households of different occupancy patterns spend different periods of time at home, the heating profiles of the dwellings were more dependent on the type of heating system/ fuel present. Additionally, nearly all households used the same heating patterns on weekends as they do during week days. Hence, heating patterns were derived depending on the key heating systems present across the dwellings, resulting in the profiles given in Table 8. For comparison, the default heating profiles from RdSAP are also shown in the table. (NB: The RdSAP assumptions in the table apply to the whole house except for the living area. It is assumed that in all cases the living area is heated to 21°C between the hours of 7.00-9.00am and 4.00-11.00pm on week days and 7.00am-11.00pm on weekends.)
While SAP assumes a two zone heating model, with the living room heated to 21°C and the rest of the house to 18°C, it is more common for households to set a ‘whole house’ temperature throughout, rather than differentiating between rooms. Design Builder allows the user to set thermostat set point temperatures for each zone/ room of a building and to vary the times of the day that the system is on. However, for all heating systems apart from Economy 7, it has been assumed that the whole dwelling is heated to 20°C during the hours of operation of the heating system, following feedback from the household surveys. While not significantly different to the RdSAP assumptions, this does introduce a variation of 7 heating hours per week at the respective temperatures.
The ‘preferred temperature’ in a dwelling with Economy 7 storage heaters is somewhat more difficult to determine as there is limited occupant control. The house will likely be over heated to an extent overnight while the storage heaters are charging using off peak electricity, but the house will then cool gradually throughout the day until the cycle repeats. RdSAP makes assumptions about when heat is delivered in the home as indicated in Table 8. However, simply assuming electrical heating for 7 hours at similar zone temperatures of 21°C and 18°C in Design Builder gives very unrealistic results at it does not take into account the inevitably increased temperature in the home that would be experienced overnight. For the purposes of this modelling, it is assumed in Design Builder that equivalent zone temperatures to SAP are delivered (i.e. 21°C in the living room and 18°C in the rest of the house) across an entire day (i.e. maintained for 24 hours). As will be seen later in Table 10, this provides comparable results to RdSAP’s assumptions relative to the occupancy rate. Future feedback from the in-use monitoring of pilot properties
24 Penwithick Green Deal Pilot: Comparison of various energy modelling tools
BRE report number 283 724 Commercial in confidence
© Building Research Establishment Ltd 2012
will help to confirm a more accurate temperature profile for Economy 7 dwellings over a 24 hour period, which could be used to make modelling and energy forecasting more accurate in the long term.
Table 8: Derived heating profiles according to type of heating system present, plus RdSAP scenarios
Heating system
Heating system
efficiency (assumed in models)
Heating period(s) from
occupancy data
Total hours
heated per week
Water heating method
RdSAP heating period(s) assumed
Total hours
heated per week
Economy 7 electric 100% 1.00-8.00am 35 Dual immersion 7.00-9.00am;
6.00-11.00pm1 35
Peak electric heaters 100% 6.00-9.00am;
4.30-11.30pm 70 Single immersion
M-F: 7.00-9.00am; 4.00-11.00pm
S-S: 7.00am-11.00pm 77
Oil central heating 82% 6.00-9.00am;
4.30-11.30pm 70 From oil central heating
M-F: 7.00-9.00am; 4.00-11.00pm
S-S: 7.00am-11.00pm 77
LPG central heating 82% 6.00-9.00am;
4.30-11.30pm 70 From LPG central heating
M-F: 7.00-9.00am; 4.00-11.00pm
S-S: 7.00am-11.00pm 77
Wood fire with radiators 55% 6.00-9.00am;
4.30-11.30pm 70 Instantaneous electric point of
use
M-F: 7.00-9.00am; 4.00-11.00pm
S-S: 7.00am-11.00pm 77
Coal fire with radiators 55% 6.00-9.00am;
4.30-11.30pm 70 Instantaneous electric point of
use
M-F: 7.00-9.00am; 4.00-11.00pm
S-S: 7.00am-11.00pm 77
Air source heat pump – ASHP (assumptions for improvement modelling)
300% (CoP of
3.0)
6.00-9.00am; 4.30-11.30pm 70 From ASHP
central heating
M-F: 7.00-9.00am; 4.00-11.00pm
S-S: 7.00am-11.00pm 77
NB: Energy required for water heating is based on the assumed household water usage volume, but this is calculated differently in RdSAP and Design Builder (based on building floor area and number of occupants respectively). RdSAP specifically calculates storage losses for water storage tanks and distribution systems in the model, while an assumption for these has been made in Design Builder, utilising a correction factor for immersion water heating of 85% efficiency (i.e. 15% storage losses). Since ASHPs assume efficiency in excess of 100%, no compensation for storage has been assumed in Design Builder.
1 Although this is the heating pattern proposed in the SAP guidance document (Table 9), this is not typical of the hours at which Economy 7 electricity meters switch to the off-peak rate, i.e. overnight, as indicated in the proposed heating profile for Economy 7. However, it is intended to represent when heat is primarily given out into the dwelling, assumed to be via the boost function controls that are often present on storage heaters or via secondary heating systems. Secondary systems would generally operate at peak rate, but for this study all usage is assumed at the off-peak rate in both tools to simplify the comparison.
25 Penwithick Green Deal Pilot: Comparison of various energy modelling tools
BRE report number 283 724 Commercial in confidence
© Building Research Establishment Ltd 2012
4.3 Standardised dwelling models
For each of the key dwelling construction types, an example house was selected from those within the pilot scheme to use as a generic base model. Although key parameters such as the heating system will be varied in order to run comparable scenarios, by selecting a real dwelling it will be possible to compare at least one of the scenarios per house with the real in-use monitoring data obtained later in the project. Dwellings were selected with a mid-range floor area compared to others of the same construction type that were due to receive major measures, i.e. EWI or ASHPs.
From the initial Property Selection report, it was concluded that EWI should be prioritised for solid wall properties and for Cornish properties at ground floor level. For cavity wall and timber hybrid dwellings, a fuel switch to an ASHP was deemed appropriate for properties currently served by a relatively inefficient (<80%) LPG boiler, those with wood or coal fires as the main heating system or dwellings using only portable electric heaters. A switch from Economy 7 storage heaters or oil central heating to an ASHP was not considered economical, so these have not been considered in this study. This section therefore looks at the occupancy impacts of these scenarios:
• Solid wall/ Cornish dwellings (Ground floor) à EWI
• Cavity/ Timber hybrid dwellings à ASHP
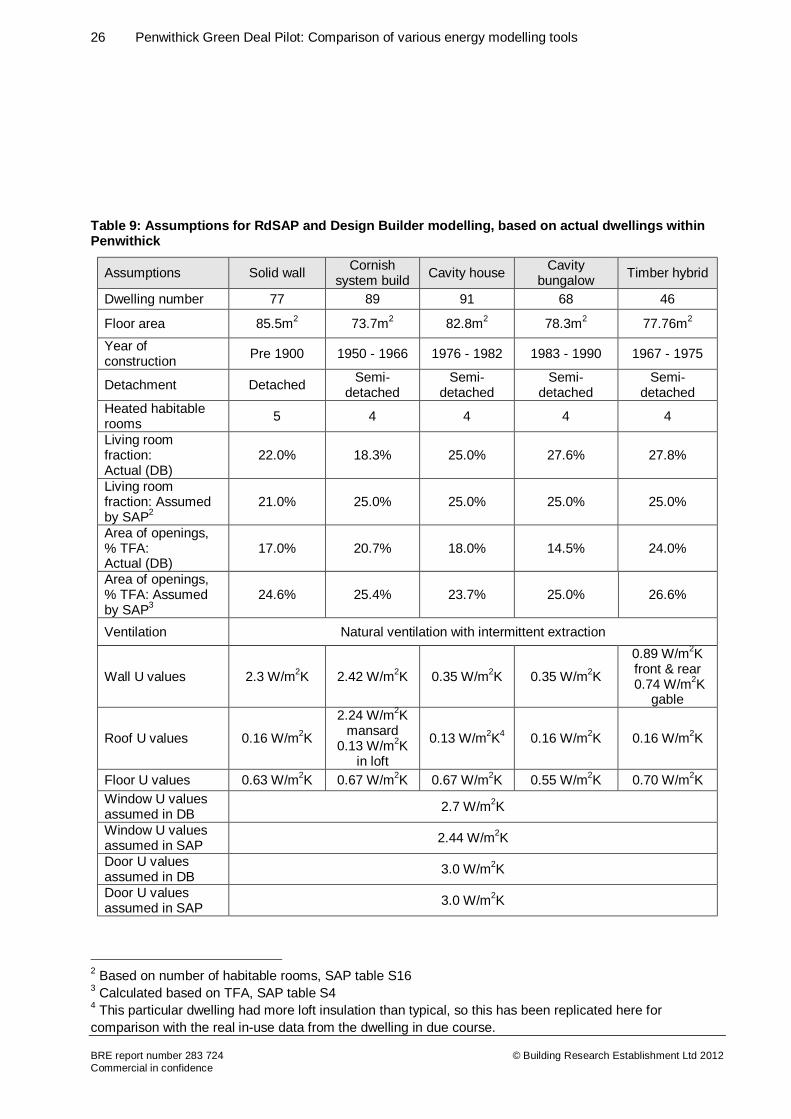
A comparison was again carried out in RdSAP, but this time fixing elemental U values to ensure they matched up with the modelling carried out in the Design Builder software, as shown in Table 9. It should be noted that despite standardising the U values across the two tools, RdSAP still makes assumptions for other aspects, such as the living room fraction and the window areas. Additionally, to allow comparison of the Design Builder results with RdSAP, climate data for the East Pennines was selected for this modelling to correspond with the default assumptions used in RdSAP. Section 4.6 discusses the implications of different climate data sets on the modelling.
It should be noted that each of these scenarios assumes that the house is fully heated during the heating periods, whereas in reality householders may not heat all rooms or at least not to the same extent, which would affect the overall heating cost assumptions and therefore the savings assumed.
26 Penwithick Green Deal Pilot: Comparison of various energy modelling tools
BRE report number 283 724 Commercial in confidence
© Building Research Establishment Ltd 2012
Table 9: Assumptions for RdSAP and Design Builder modelling, based on actual dwellings within Penwithick
Assumptions Solid wall Cornish system build Cavity house Cavity
bungalow Timber hybrid
Dwelling number 77 89 91 68 46
Floor area 85.5m2 73.7m2 82.8m2 78.3m2 77.76m2
Year of construction Pre 1900 1950 - 1966 1976 - 1982 1983 - 1990 1967 - 1975
Detachment Detached Semi-detached
Semi-detached
Semi-detached
Semi-detached
Heated habitable rooms 5 4 4 4 4
Living room fraction: Actual (DB)
22.0% 18.3% 25.0% 27.6% 27.8%
Living room fraction: Assumed by SAP2
21.0% 25.0% 25.0% 25.0% 25.0%
Area of openings, % TFA: Actual (DB)
17.0% 20.7% 18.0% 14.5% 24.0%
Area of openings, % TFA: Assumed by SAP3
24.6% 25.4% 23.7% 25.0% 26.6%
Ventilation Natural ventilation with intermittent extraction
Wall U values 2.3 W/m2K 2.42 W/m2K 0.35 W/m2K 0.35 W/m2K
0.89 W/m2K front & rear
0.74 W/m2K gable
Roof U values 0.16 W/m2K
2.24 W/m2K mansard
0.13 W/m2K in loft
0.13 W/m2K4 0.16 W/m2K 0.16 W/m2K
Floor U values 0.63 W/m2K 0.67 W/m2K 0.67 W/m2K 0.55 W/m2K 0.70 W/m2K Window U values assumed in DB 2.7 W/m2K
Window U values assumed in SAP 2.44 W/m2K
Door U values assumed in DB 3.0 W/m2K
Door U values assumed in SAP 3.0 W/m2K
2 Based on number of habitable rooms, SAP table S16 3 Calculated based on TFA, SAP table S4 4 This particular dwelling had more loft insulation than typical, so this has been replicated here for comparison with the real in-use data from the dwelling in due course.

27 Penwithick Green Deal Pilot: Comparison of various energy modelling tools
BRE report number 283 724 Commercial in confidence
© Building Research Establishment Ltd 2012
4.4 Results of occupancy modelling
NB: Tables including CO2 emissions are included in Annexe A so as not to overwhelm the reader with data. The trends seen here with overall cost savings at different occupancy profiles are mirrored by the CO2 savings as they are calculated from the same kWh energy usage assumptions.
4.4.1 Solid wall dwellings The overall fuel costs for heating and hot water in solid wall properties with various assumed heating system are shown in Table 10 and displayed graphically in Figure 1.
Across all fuel types, the cost estimates from RdSAP are most closely aligned with the higher occupancy profiles in the Design Builder models. SAP calculates an assumption for the occupancy based on the floor area of the building, which in this case would be 2.7 people. It may therefore be expected that the overall energy usage for RdSAP would sit somewhere between that of the 2 person and 4 person (Family) occupancy scenarios. This is true for the Economy 7 scenario and to a less obvious extent the scenario with portable electric heaters. However, in all other cases the overall energy use in RdSAP is greater than all the Design Builder scenarios. This is likely to be mostly a result of RdSAP assuming slightly longer heating periods per week and because the proportion of windows assumed is somewhat larger in RdSAP than in the actual building. (This effect is evidently being masked due to the 24 hour heating scenario assumed in Design Builder for Economy 7. The factors influencing portable electric heaters are discussed below.)
The hot water forecasts in RdSAP form a smaller proportion of the overall energy demand compared to the Family profile scenarios in Design Builder. This is because RdSAP calculates the water usage based on the floor area of the dwelling, while Design Builder calculates the water usage based on the specified number of occupants.
The overall fuel cost forecast by Design Builder for heating and hot water generally increases as the number of occupants within the dwelling rises, even though the dwellings are assumed to be heated to the same extent. This is because the ventilation rate in the Design Builder models is determined ‘per person’ (at a rate of 10 litres/second per person) so increases with the number of occupants, which in turn increases the heating energy demand to compensate for the heat lost via ventilation. (Within SAP, the ventilation rate is calculated according to the number of chimneys, vents and fans present and so is effectively independent of the occupancy level.) Additionally, the energy required for hot water also increases per person as discussed above.
It is of note that while overall fuel costs generally increase with higher occupancy, the fuel cost savings actually decrease, since it is assumed that there are more internal gains in a larger household that will offset the need for heating to some extent, thus consequently reducing the savings that can be realised by improvement measures (assuming ventilation rates and hot water demand remain constant).
Beyond these occupant-related factors (ventilation rate, hot water usage), it should be remembered that each of the occupancy profiles, in addition to having different numbers of occupants, also assume different hours of occupancy within the dwelling. Hence, the overall fuel costs and savings also reflect the influence of internal gains per person depending on the average time spent in the dwelling.

28 Penwithick Green Deal Pilot: Comparison of various energy modelling tools
BRE report number 283 724 Commercial in confidence
© Building Research Establishment Ltd 2012
Table 10: Solid wall dwellings (Dwelling number 77)
Fuel type Scenario
Annual fuel cost for each occupancy scenario, £
1 1 Retired 2 2
Retired Family RdSAP
Economy 7
Baseline Space heating 850 841 940 933 1082 950
Hot water 100 100 133 133 218 166
TOTAL 949 941 1073 1066 1300 1115
Improvement EWI
Space heating 342 335 425 419 548 480
Hot water 100 100 133 133 218 166
TOTAL 441 435 558 552 766 646 Saving 508 506 515 515 534 469
Oil
Baseline Space heating 603 599 658 653 724 928
Hot water 96 96 135 135 211 201
TOTAL 699 695 793 788 935 1129
Improvement EWI
Space heating 295 290 358 352 441 512
Hot water 96 96 135 135 211 203
TOTAL 392 387 493 487 652 715 Saving 308 309 300 301 282 414
LPG
Baseline Space heating 855 849 933 927 1026 1334
Hot water 137 137 191 191 299 290
TOTAL 992 986 1124 1118 1326 1624
Improvement EWI
Space heating 419 412 508 500 626 725
Hot water 137 137 191 191 299 292
TOTAL 555 548 699 690 925 1018 Saving 437 438 426 427 401 606
Wood
Baseline Space heating 750 745 819 813 866 1524
Hot water 240 240 284 284 411 173
TOTAL 990 985 1103 1097 1277 1698
Improvement EWI
Space heating 367 361 445 438 508 847
Hot water 240 240 284 284 411 173
TOTAL 607 601 730 723 918 1021 Saving 383 384 373 375 358 677
Coal
Baseline Space heating 652 647 711 706 752 1324
Hot water 240 240 284 284 411 173
TOTAL 891 887 996 991 1163 1498
Improvement EWI
Space heating 319 314 387 381 441 736
Hot water 240 240 284 284 411 173
TOTAL 559 553 671 665 851 909 Saving 333 334 324 326 311 588
Portable electric heaters
Baseline Space heating 1274 1265 1386 1377 1523 1713
Hot water 240 240 321 321 525 331
TOTAL 1513 1504 1707 1697 2047 2044
Improvement EWI
Space heating 623 613 753 741 924 963
Hot water 240 240 321 321 525 331
TOTAL 863 852 1073 1061 1449 1294 Saving 650 652 634 636 598 751
29 Penwithick Green Deal Pilot: Comparison of various energy modelling tools
BRE report number 283 724 Commercial in confidence
© Building Research Establishment Ltd 2012
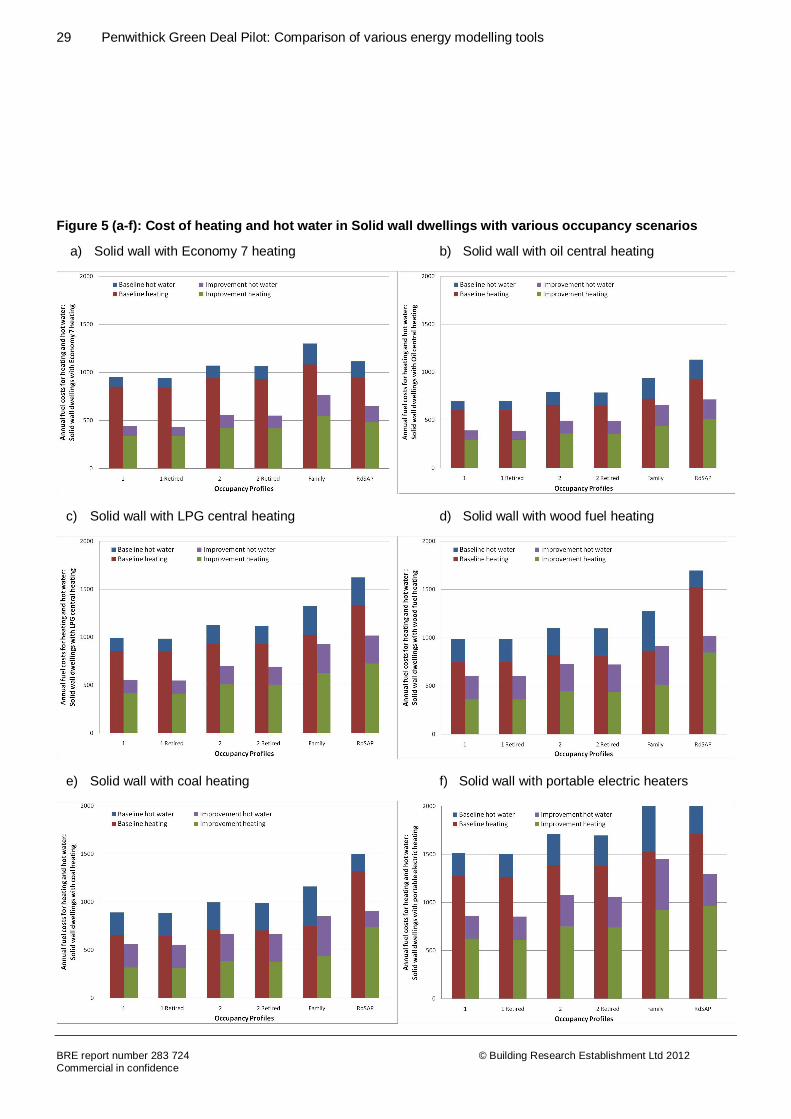
Figure 5 (a-f): Cost of heating and hot water in Solid wall dwellings with various occupancy scenarios
a) Solid wall with Economy 7 heating b) Solid wall with oil central heating
c) Solid wall with LPG central heating d) Solid wall with wood fuel heating
e) Solid wall with coal heating f) Solid wall with portable electric heaters

30 Penwithick Green Deal Pilot: Comparison of various energy modelling tools
BRE report number 283 724 Commercial in confidence
© Building Research Establishment Ltd 2012
Economy 7 heating
The solid wall dwelling model with Economy 7 heating is the only scenario for which Design Builder forecasts a higher cost saving across all occupancy profiles than RdSAP. In all other cases, RdSAP suggests a higher saving. Ocean Services’ price for EWI for this particular dwelling was £11,585, so in each case the savings with Economy 7 are likely to be just insufficient to cover the cost of External Wall Insulation within 20 years (at current prices, not taking into account interest rates on loans). However if prices for an equivalent dwelling were to drop to ~£10,000, the EWI would become more financially viable with Economy 7 heating.
Portable electric heaters
Despite the fact that portable electric heaters have been assumed to use the same heating profile as the other fuel types (with the exception of Economy 7 heating), the overall fuel cost from RdSAP falls just below that of the family Design Builder profile scenario while for other fuels RdSAP experienced a higher relative cost. Although it is accepted that RdSAP aims to heat the living area to 21°C and the rest of the dwelling to 18°C, Table 9 within the SAP guidance actually dictates that the latter temperature is calculated based on the Heat Loss Parameter (HLP) of the building with assumptions for the controllability and response time of the heating system in question. SAP Table 9 is copied here for reference.
Following through the guidance in the SAP document, portable electric heaters are assumed to have Control Type 2, while the other heating fuels (with the exception of Economy 7 heating) are assumed to have Control Type 1. The HLP in the base case RdSAP model for the solid wall properties is 4.5, hence the target temperature with Control Type 1 = 18.75°C, while the target temperature with Control Type 2 = 16.88°C. Since the dwelling with portable electric heaters is assumed to be heated to this lower

31 Penwithick Green Deal Pilot: Comparison of various energy modelling tools
BRE report number 283 724 Commercial in confidence
© Building Research Establishment Ltd 2012
temperature, this would account for why in this case the RdSAP scenario falls lower than the family Design Builder scenario.
RdSAP estimates higher savings from the installation of EWI with portable electric heaters than all the Design Builder profile models. This may therefore mean that householders would not achieve the savings indicated by RdSAP. However, even the occupancy scenario with the lowest savings forecast by Design Builder (Family) should be sufficiently high for it to be possible to cover the cost of installing EWI within the anticipated 20 year period (in excess of £11,960 at current prices, not taking into account interest rates on loans), assuming the dwelling is fully heated to the extent assumed in this modelling.
Other fuel types
As mentioned above, in the other non-electric scenarios the baseline cost is higher than each of the Design Builder baseline occupancy scenarios. The cost savings from RdSAP are also somewhat higher than the Design Builder occupancy profile models, since theoretically there is more heating energy to be saved by the installation of new insulation measures. However, the modelled savings drop to as little as £5640 over 20 years for a family with oil central heating compared to the RdSAP scenario of £8280 over 20 years (although this would also actually be an insufficient saving to make EWI viable at current installation prices). This could be problematic for many households, since it would be likely that they would not achieve the forecast savings from RdSAP in their energy bills, which could influence the ability to pay back the cost of EWI within an acceptable time period (~20 years) without additional funds/ grants.
4.4.2 Cornish-type dwellings The overall fuel costs and CO2 emissions for heating and hot water in Cornish-type properties with various assumed heating system are presented in Annexe A.
The trends seen with the Cornish property examples are generally the same as with the solid wall dwellings, as the same factors will have affected each model. However, the savings are proportionally lower, as only the ground floor is assumed to receive EWI improving the U value to 0.3 W/m2K as was the case with the solid wall dwellings, while the first floor is assumed to be improved from a U value of 2.24 W/m2K to 1.6 W/m2K by applying insulation within the mansard structure. The capital cost of the EWI is therefore proportionally reduced to £4,367 for this particular dwelling example, suggesting the Green Deal may be viable over 20 years for Economy 7 and Portable electric heaters.
However, similar over-estimates by RdSAP are witnessed for the other fuel types considered, again most likely to be due to the different assumptions in heating periods and differences in window areas assumed between the models, so households may not achieve the forecast savings from RdSAP in their energy bills, which could influence the ability to pay back the cost of EWI within an acceptable time period (~20 years) without additional funds/ grants.
4.4.3 Cavity wall houses The overall fuel costs for heating and hot water in cavity wall properties with various assumed heating system are shown in Table 11 and displayed graphically in Figure 2.
In all cases, the RdSAP scenario is of a similar overall cost to the highest Design Builder occupancy profile (family), although in the majority of cases it assumes a higher cost, with portable electric heaters it actually drops lower than the Design Builder family scenario due to the reasons mentioned in Section 4.4.1. Also, the hot water makes a far higher contribution to the overall fuel cost than seen with the solid wall and

32 Penwithick Green Deal Pilot: Comparison of various energy modelling tools
BRE report number 283 724 Commercial in confidence
© Building Research Establishment Ltd 2012
Cornish-type properties, as the water heating requirement will be similar across both construction types but the baseline energy bills are now somewhat lower due to the improved baseline U values of the (insulated) cavity wall dwelling.
Table 11: Cavity wall houses (Dwelling number 91)
Fuel type Scenario
Annual fuel cost for each occupancy scenario, £
1 1 Retired 2 2
Retired Family RdSAP
LPG
Baseline Space heating 354 347 449 441 508 596
Hot water 124 124 172 172 270 292
TOTAL 478 471 621 614 778 888
Improvement EWI
Space heating 173 169 217 213 243 294
Hot water 61 61 86 86 134 256
TOTAL 234 231 302 298 378 549 Saving 244 240 319 315 400 338
Wood
Baseline Space heating 384 378 358 352 466 767
Hot water 174 174 243 243 381 168
TOTAL 558 552 601 595 847 934
Improvement EWI
Space heating 215 212 201 197 257 352
Hot water 58 58 81 81 127 253
TOTAL 273 270 282 278 384 604 Saving 285 282 319 316 464 330
Coal
Baseline Space heating 265 260 338 332 385 622
Hot water 184 184 257 257 403 171
TOTAL 449 444 595 589 788 793
Improvement EWI
Space heating 173 169 217 213 243 294
Hot water 61 61 86 86 134 256
TOTAL 234 231 302 298 378 549 Saving 215 213 293 291 410 244
Portable electric heaters
Baseline Space heating 518 508 657 646 746 812
Hot water 216 216 302 302 474 329
TOTAL 734 724 959 948 1220 1140
Improvement EWI
Space heating 173 169 217 213 243 294
Hot water 61 61 86 86 134 256
TOTAL 234 231 302 298 378 549 Saving 500 494 657 650 842 591

33 Penwithick Green Deal Pilot: Comparison of various energy modelling tools
BRE report number 283 724 Commercial in confidence
© Building Research Establishment Ltd 2012
Figure 6 (a-d): Cost of heating and hot water in Cavity wall houses with various occupancy scenarios
a) Cavity wall with LPG central heating b) Cavity wall with wood fuel heating
c) Cavity wall with coal heating d) Cavity wall with portable electric heaters
For wood and coal heating systems it is assumed that the hot water is met by instantaneous electric point of use systems. Due to the relative cost per kWh of standard rate electricity compared to coal and wood, the resulting cost for this hot water heating makes a significant contribution to the overall fuel cost in the baseline cases modelled in Design Builder, as shown in Figure 6b and c. Unlike the EWI improvements, the switch to an ASHP also affects the hot water provision, hence larger savings are now seen in the family scenario than the other profiles as the energy required for hot water heating is proportionately reduced relative to the occupancy assumed in Design Builder. However, RdSAP does not share this trend in hot water cost savings, instead actually causing an increase in water heating costs for the wood and coal heating/ instant point of use electric hot water scenarios. Evidently RdSAP deems it more efficient to utilise instant point of use hot water than to maintain a storage tank of hot water with the ASHP as a result of its method of calculating the hot water consumption as a function of the building’s floor area.

34 Penwithick Green Deal Pilot: Comparison of various energy modelling tools
BRE report number 283 724 Commercial in confidence
© Building Research Establishment Ltd 2012
The combination of these factors could make a significant impact on the potential viability of ASHPs under the Green Deal. Ocean Services’ price for the installation of an ASHP central heating system for this particular dwelling was £9,853. None of the occupancy profiles using LPG suggest that this cost could be recovered within 20 years (at current prices, not taking into account interest rates on loans), with the lowest savings only being capable of recovering approximately half of the necessary amount. Conversely, all occupancy profiles using peak electric heating could recover the up-front cost within the same period, assuming the dwelling is fully heated by this method.
Due to the relatively cheap price of coal and wood fuel, the data suggests that none of the occupancy profiles with these fuels would be likely to find an ASHP viable under the Green Deal. However, it should be emphasised that the improved user control and comfort likely to be derived from an ASHP central heating system compared to the labour intensive management of open fires is likely to carry a ‘value’ to households in itself.
Considering additional factors are likely to eat into the savings forecast here (i.e. interest rates on Green Deal loans, comfort taking, etc.), the data suggest that the capital cost of ASHPs would have to be considerably cheaper before they became a viable option under the Green Deal for the majority of modelled cavity wall dwelling scenarios.
4.4.4 Cavity bungalows The overall fuel costs and CO2 emissions for heating and hot water in cavity bungalows with various assumed heating system are presented in Annexe A.
The cavity wall bungalow forecasts higher running costs across the majority of the modelled scenarios than the cavity walled house, with the exception of the 2 person occupancy profiles. In the bungalow model, the ventilation losses are only marginally higher for 2 people than they are for 1 for the given building volume, hence due to the higher occupancy gains for 2 people the overall heating demand is actually lower. This trend is not seen in any of the other house construction types assessed as the higher occupancy gains are overshadowed by the higher ventilation losses for the larger volume buildings.
Aside from this anomaly, the reason for the otherwise common increase in energy demand in the bungalow is most likely due to its more inefficient ‘form factor’. The form factor of a building is represented by the ratio of its heat loss surfaces to the floor area. The floor area of the bungalow is only slightly smaller than the overall floor area of the house, while the ratio of heat loss surfaces to floor area is higher (2.10 in the house, 2.82 in the bungalow). This means that proportionally more heat will be lost relative to the size of the building.
The general trends seen with the cavity wall house are also experienced with the bungalow, including the largest cost savings from switching to an ASHP being experienced by the family occupancy profile, largely as a result of the saving assumed in hot water provision. None of the occupancy profiles using LPG, wood or coal suggest that the capital cost of the ASHP could be recovered within 20 years (at current prices, not taking into account interest rates on loans). However, all occupancy profiles using peak electric heating could recover these costs within that period, assuming the dwelling is fully heated by this method. Overall, the data suggest that the capital cost of ASHPs would have to be considerably cheaper before they became a viable option under the Green Deal for the majority of modelled cavity wall bungalow scenarios.
35 Penwithick Green Deal Pilot: Comparison of various energy modelling tools
BRE report number 283 724 Commercial in confidence
© Building Research Establishment Ltd 2012
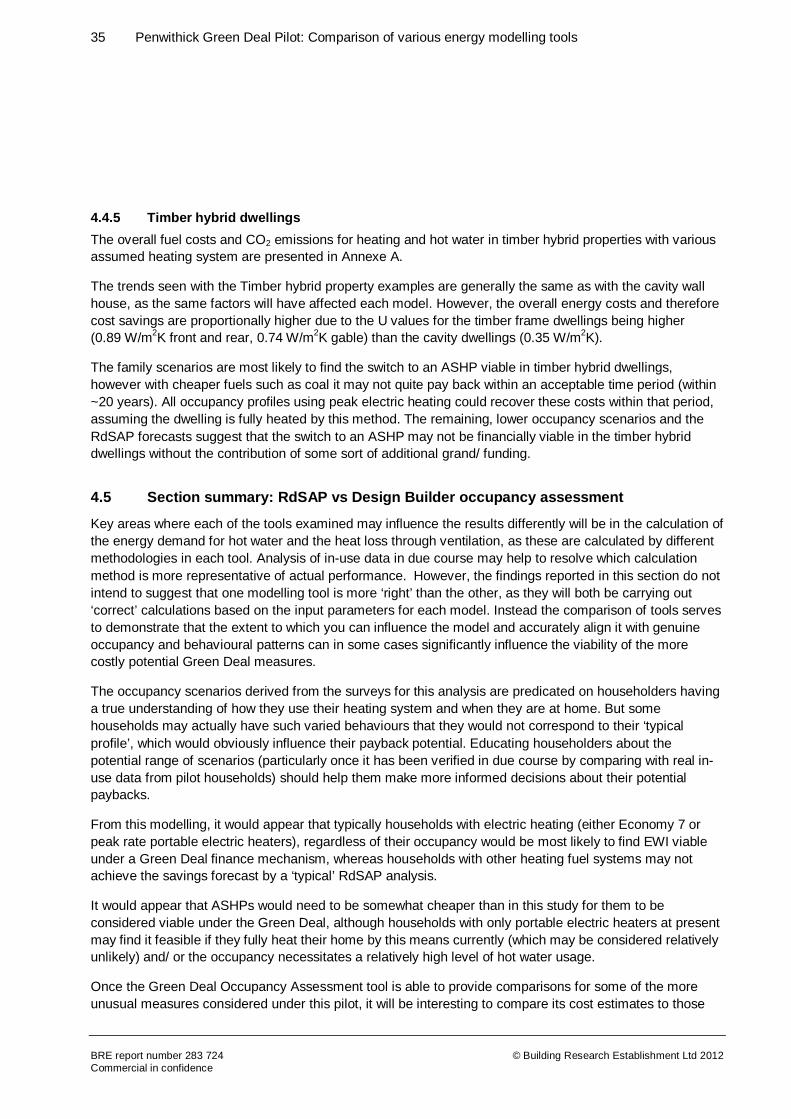
4.4.5 Timber hybrid dwellings The overall fuel costs and CO2 emissions for heating and hot water in timber hybrid properties with various assumed heating system are presented in Annexe A.
The trends seen with the Timber hybrid property examples are generally the same as with the cavity wall house, as the same factors will have affected each model. However, the overall energy costs and therefore cost savings are proportionally higher due to the U values for the timber frame dwellings being higher (0.89 W/m2K front and rear, 0.74 W/m2K gable) than the cavity dwellings (0.35 W/m2K).
The family scenarios are most likely to find the switch to an ASHP viable in timber hybrid dwellings, however with cheaper fuels such as coal it may not quite pay back within an acceptable time period (within ~20 years). All occupancy profiles using peak electric heating could recover these costs within that period, assuming the dwelling is fully heated by this method. The remaining, lower occupancy scenarios and the RdSAP forecasts suggest that the switch to an ASHP may not be financially viable in the timber hybrid dwellings without the contribution of some sort of additional grand/ funding.
4.5 Section summary: RdSAP vs Design Builder occupancy assessment
Key areas where each of the tools examined may influence the results differently will be in the calculation of the energy demand for hot water and the heat loss through ventilation, as these are calculated by different methodologies in each tool. Analysis of in-use data in due course may help to resolve which calculation method is more representative of actual performance. However, the findings reported in this section do not intend to suggest that one modelling tool is more ‘right’ than the other, as they will both be carrying out ‘correct’ calculations based on the input parameters for each model. Instead the comparison of tools serves to demonstrate that the extent to which you can influence the model and accurately align it with genuine occupancy and behavioural patterns can in some cases significantly influence the viability of the more costly potential Green Deal measures.
The occupancy scenarios derived from the surveys for this analysis are predicated on householders having a true understanding of how they use their heating system and when they are at home. But some households may actually have such varied behaviours that they would not correspond to their ‘typical profile’, which would obviously influence their payback potential. Educating householders about the potential range of scenarios (particularly once it has been verified in due course by comparing with real in-use data from pilot households) should help them make more informed decisions about their potential paybacks.
From this modelling, it would appear that typically households with electric heating (either Economy 7 or peak rate portable electric heaters), regardless of their occupancy would be most likely to find EWI viable under a Green Deal finance mechanism, whereas households with other heating fuel systems may not achieve the savings forecast by a ‘typical’ RdSAP analysis.
It would appear that ASHPs would need to be somewhat cheaper than in this study for them to be considered viable under the Green Deal, although households with only portable electric heaters at present may find it feasible if they fully heat their home by this means currently (which may be considered relatively unlikely) and/ or the occupancy necessitates a relatively high level of hot water usage.
Once the Green Deal Occupancy Assessment tool is able to provide comparisons for some of the more unusual measures considered under this pilot, it will be interesting to compare its cost estimates to those
36 Penwithick Green Deal Pilot: Comparison of various energy modelling tools
BRE report number 283 724 Commercial in confidence
© Building Research Establishment Ltd 2012
from Design Builder and then subsequently with real in-use data to see whether significant differences arise from using a steady state (SAP) versus a dynamic simulation model (Design Builder).
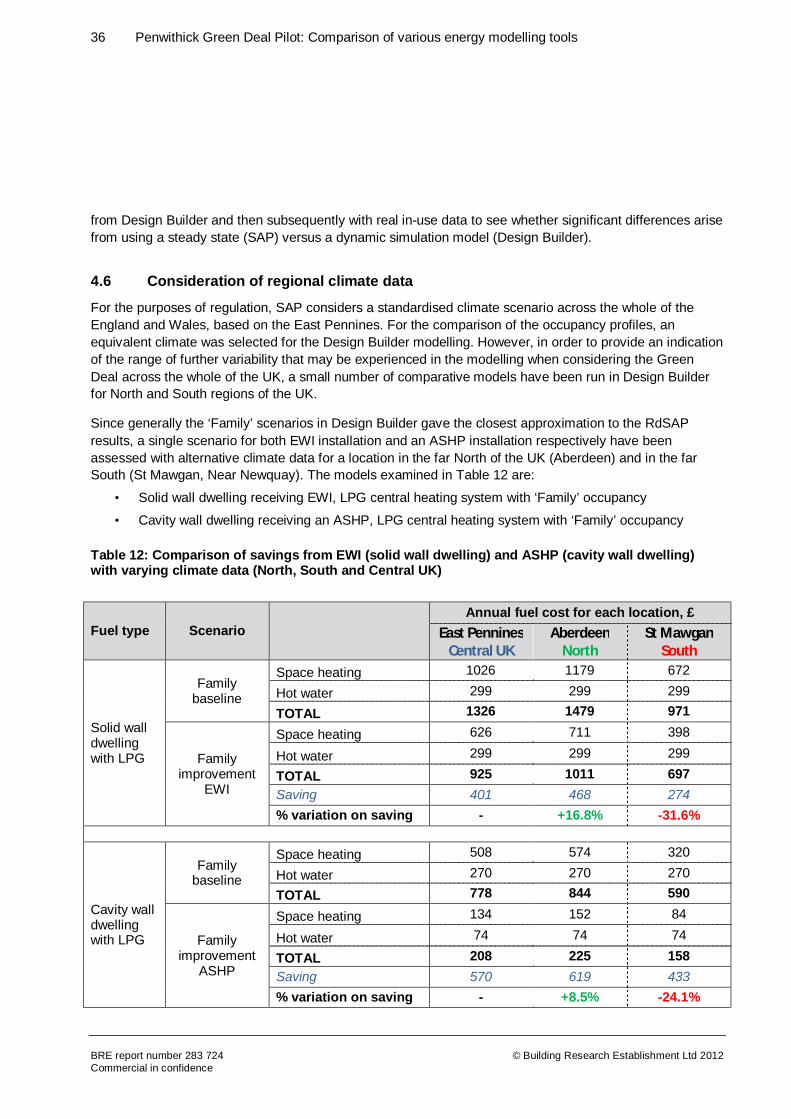
4.6 Consideration of regional climate data
For the purposes of regulation, SAP considers a standardised climate scenario across the whole of the England and Wales, based on the East Pennines. For the comparison of the occupancy profiles, an equivalent climate was selected for the Design Builder modelling. However, in order to provide an indication of the range of further variability that may be experienced in the modelling when considering the Green Deal across the whole of the UK, a small number of comparative models have been run in Design Builder for North and South regions of the UK.
Since generally the ‘Family’ scenarios in Design Builder gave the closest approximation to the RdSAP results, a single scenario for both EWI installation and an ASHP installation respectively have been assessed with alternative climate data for a location in the far North of the UK (Aberdeen) and in the far South (St Mawgan, Near Newquay). The models examined in Table 12 are:
• Solid wall dwelling receiving EWI, LPG central heating system with ‘Family’ occupancy
• Cavity wall dwelling receiving an ASHP, LPG central heating system with ‘Family’ occupancy
Table 12: Comparison of savings from EWI (solid wall dwelling) and ASHP (cavity wall dwelling) with varying climate data (North, South and Central UK)
Fuel type Scenario
Annual fuel cost for each location, £ East Pennines
Central UK Aberdeen
North St Mawgan
South
Solid wall dwelling with LPG
Family baseline
Space heating 1026 1179 672
Hot water 299 299 299
TOTAL 1326 1479 971
Family improvement
EWI
Space heating 626 711 398
Hot water 299 299 299
TOTAL 925 1011 697 Saving 401 468 274 % variation on saving - +16.8% -31.6%
Cavity wall dwelling with LPG
Family baseline
Space heating 508 574 320
Hot water 270 270 270
TOTAL 778 844 590
Family improvement
ASHP
Space heating 134 152 84
Hot water 74 74 74
TOTAL 208 225 158 Saving 570 619 433 % variation on saving - +8.5% -24.1%

37 Penwithick Green Deal Pilot: Comparison of various energy modelling tools
BRE report number 283 724 Commercial in confidence
© Building Research Establishment Ltd 2012
The results show that potential fuel costs will be higher for dwellings in the North of the UK and lower in the South, as is to be expected. However, the savings from the installation of EWI or ASHPs will vary proportionally, being higher in the North of the UK but lower in the South, which would influence the viability of such measures under the Green Deal.
With reference to the previous occupancy profile study, some scenarios that may have appeared viable under the Green Deal may require a subsidy/ grant in southerly areas of the UK or would rely on the capital cost of the measures to be somewhat reduced. However scenarios that were generally comfortably viable, such as those using portable electric heaters, will probably still offer reasonable payback terms, despite the reduced savings forecast in southerly locations.
This again emphases the importance of being able to accurately simulate the household situation when considering a Green Deal loan, as in addition to the occupancy and behavioural profile of a household, the localised climate conditions will clearly also have an influence on the savings that may be achieved from various refurbishment measures.

38 Penwithick Green Deal Pilot: Comparison of various energy modelling tools
BRE report number 283 724 Commercial in confidence
© Building Research Establishment Ltd 2012
5 Additional influencing factors
In addition to the range of variables that have been identified across the modelling tools used in this study as influencing the potential savings that could be made under the Green Deal, there are further factors that can play a role. Educating households about these potential issues will be an important part of managing their expectations if they undertake Green Deal funded measures and could influence the perception of the success of the Green Deal programme in the longer term. Follow up surveys and analysis of the real in-use data that is being gathered for a selection of the pilot properties in Penwithick should help to confirm whether any of these factors were contributory, so as to better understand the true impact of the installed measures.
5.1 Under-heated homes
All of the modelling scenarios and tools in this report have assumed that the dwelling in question will be fully heated both before and after the refurbishment measures that take place. However, it is quite possible (in fact likely in some circumstances) that houses may not be heated to the extent assumed in the models. At present, BRE are carrying out a scoping study into the treatment of under heated homes5 to better understand the extent of this phenomenon, with the aim to quantify how it may impact on Green Deal predictions in practice. In some cases it may be a result of the heating demand being so high in a thermally inefficient dwelling that the heating system simply cannot achieve the level of warmth assumed in the modelling. In other cases households may be unable to afford to heat the whole house fully and so choose to heat the house for a shorter duration or to only heat occupied rooms. The surveys carried out across the households in Penwithick identified many dwellings where not all ‘habitable rooms’ were heated in order to save money on fuel bills.
While in Design Builder it would be possible to model the effect of unheated rooms on the overall heating demand of a dwelling, it is unlikely that this extent of modelling would be done in mainstream practice. Also, the Green Deal Occupancy Assessment tool will be able to take this into account, but this has been deemed beyond the scope of this report, since the extent of the variables would be far too numerous to model across the pilot dwellings. However, it is inevitable that the actual savings achieved in practice would be proportionally lower when fewer rooms in the home are heated, as less is being spent on fuel compared to the models assumed to be fully heated. In these circumstances, the viability of any insulation or heating system measures under the Green Deal is likely to be threatened when compared with modelled scenarios.
5.2 Comfort taking
The occurrence of ‘comfort taking’ will also inevitably have an impact on the savings made by households. This concept is sometimes referred to by other names, but essentially is the household taking a higher level of comfort from the improvement measures they have received rather than living in a like-for-like manner and achieving the forecast energy savings. For example, whereas previously a household may have only
5 BRE Trust project reference no. 127-12-RM, ‘Treatment of under heated dwellings; a scoping study’, due for completion in April 2013.

39 Penwithick Green Deal Pilot: Comparison of various energy modelling tools
BRE report number 283 724 Commercial in confidence
© Building Research Establishment Ltd 2012
heated their home to 19°C because it was expensive to achieve this level of heating, after the installation of insulation, the improved ‘ease’ with which it is possible to heat the dwelling may encourage the household to subsequently heat their home to 21°C. Hence, a degree of the forecast cost saving will be offset by the cost of heating the home to a higher temperature.
Some households may prefer living at what they perceive to be a more comfortable temperature than making cost savings, though in reality households will likely expect to benefit from both factors, i.e. warmer home and lower bills. The in-use monitoring of households that is taking place as part of the Penwithick pilot study and will be reported on in due course will provide an insight into the extent of comfort taking that may be expected to occur in similar situations. Though it should be remembered that since the occupants within the pilot programme will not be expected to pay back the cost of the measures they have had installed, their tendency to comfort take may be greater than in households with a genuine Green Deal loan arrangement.
40 Penwithick Green Deal Pilot: Comparison of various energy modelling tools
BRE report number 283 724 Commercial in confidence
© Building Research Establishment Ltd 2012
6 Conclusions
6.1 RdSAP vs full SAP
- Full SAP typically forecasts higher savings than RdSAP and is likely to more accurately represent a dwelling in respect of U values and window areas. However, overall the differences between the two tools are not likely to be great enough to influence the viability of key refurbishment measures (e.g. EWI, ASHPs) under the Green Deal.
- In the most recent version of RdSAP, it is possible to input specific U values and to enter individual windows, but it is relatively unlikely that this would be done in practice as it would rely on Green Deal Assessors having specific knowledge of the construction U values.
6.2 SAP vs PVSol
- PVSol utilises regional solar irradiation data and allows specific PV panel and inverter combinations to be modelled. On average, it predicted a 16% higher electricity generation for the example properties in Penwithick.
- More northerly parts of the UK (i.e. north of the Pennines/ Midlands) would expect a reduced yield compared to SAP.
- SAP is likely to provide pessimistic estimates for the south of the UK and optimistic estimates for the north. Therefore, models such as PVSol that allow localised solar conditions to be considered will provide a more accurate assessment of the likely generation of a given PV system.
6.3 RdSAP vs Design Builder
- Design Builder allows tailoring of a wide range of modelling parameters, including specific window areas, the floor area of different ‘zones’ (i.e. the living room fraction), the number of occupants assumed in the dwelling, the hours of occupancy, the hours and temperature of the heating in each room/ zone. RdSAP makes assumptions and/ or calculations to derive these parameters. It would therefore be expected that Design Builder would provide a more accurate representation of a given household when these variables are known and specified.
- There are key differences in the calculation assumptions for the hot water energy demand and the building ventilation; Design Builder calculates these based on the specified occupancy of the dwelling, while RdSAP calculates based on the floor area of the building. As a result, Design Builder has generally made higher assumptions for these aspects than SAP and they make a larger contribution in bigger households.
- Economy 7 scenarios are difficult to represent in energy models and it has been necessary to use different heating profile assumptions in each tool to obtain sensible, comparable results. The availability of real in-use data in due course from monitoring the Penwithick households will be very useful to refine future modelling.

41 Penwithick Green Deal Pilot: Comparison of various energy modelling tools
BRE report number 283 724 Commercial in confidence
© Building Research Establishment Ltd 2012
External wall insulation
- When assessing EWI installed to solid wall properties with Economy 7 heating, the RdSAP forecast falls in between the 2 person and family (4 person) Design Builder occupancy profiles, with the highest cost savings likely to be achieved by families.
- Across all other fuel types, RdSAP appears to overestimate the overall fuel bills and cost savings from EWI for solid wall properties compared to Design Builder. In these cases the lowest cost savings result from families. In these cases, the family scenarios provide the highest internal gains that offset the heating demand, hence there is less energy to be saved by the insulation measures.
- The Green Deal may be viable towards EWI for properties with portable electric heaters with all occupancy scenarios (including RdSAP forecasts), assuming the home is fully heated to the extent assumed in the modelling.
- When Cornish-type properties are considered for EWI, the overall fuel costs and savings are proportionally lower as only the ground floor is assumed to receive the EWI. In these cases, occupancy profiles using Economy 7 storage heating or portable electric heaters may find EWI viable under the Green Deal.
- In all other fuel type and occupancy scenarios, it is likely that the capital cost of EWI would need to reduce or be subsidised for it to be considered a viable option under the Green Deal.
- The CO2 reductions given in Appendix A generally follow the trends seen across the cost modelling for EWI as both are based on the same kWh usage assumptions. Relatively low CO2 savings are made when EWI is installed on properties with wood fuel heating, as the insulation only improves the heating and not the hot water (which is assumed to be electrically heated) and the CO2 emission factor per kWh is low for wood.
- The largest CO2 emissions savings from solid wall properties receiving EWI are from those with electrical heating and coal, as these have high CO2 emission factors per kWh and coal is a very inefficient heating form.
Air Source Heat Pumps
- In the cavity wall and timber hybrid construction modelling in Design Builder, the energy demand for hot water makes a far higher contribution to the overall fuel cost that it does in the solid wall properties. Therefore, when considering a switch to an ASHP, the largest savings tend to be realised in occupancy profiles that benefit from the savings achieved in water heating (i.e. family scenario). This trend is not shared in RdSAP, as instead the hot water demand is based on the floor area and does not show such significant savings.
- The Green Deal may be viable towards ASHPs for all non-solid wall properties with portable electric heaters across all occupancy scenarios (including RdSAP forecasts), assuming the home is fully heated to the extent assumed in the modelling.
- The capital cost of ASHPs would likely need to reduce or be subsidised for it to be considered a viable option under the Green Deal for the other fuel type and occupancy scenarios assessed, though since the timber hybrid fuel costs are higher than those for cavity walls (due to their relative U value assumptions) it would inevitably become viable at a slightly higher base cost.
- The CO2 reductions given in Appendix A generally follow the trends seen across the cost modelling for ASHPs as both are based on the same kWh usage assumptions. However, a switch from wood fuel to an ASHP actually brings about an increase in CO2 emissions compared to the baseline

42 Penwithick Green Deal Pilot: Comparison of various energy modelling tools
BRE report number 283 724 Commercial in confidence
© Building Research Establishment Ltd 2012
scenario, as the emissions factor per kWh is worse for electricity than wood, which more than compensates for the overall energy units (kWh) saved with the ASHP.
- The largest CO2 emissions savings from properties switching to an ASHP are from those with electrical heating and coal, as these have high CO2 emission factors per kWh and coal is a very inefficient heating form.
Regional climate data variations
- Design Builder allows regional climate data to be used in the modelling. Sample analyses using data sets for Aberdeen and near Newquay as a comparison with a Midlands (Pennines) data set confirm that fuel bills and consequent cost savings would be higher in the north of the UK and lower in the south. This will detrimentally affect the viability of measures in the south relative to SAP’s forecasts, as that uses a midlands climate for the whole of the UK.
6.4 General - Additional factors may influence the viability of refurbishment measures under the Green Deal,
including under-heating of homes and comfort taking by occupants, but such analysis is beyond the scope of this study.

43 Penwithick Green Deal Pilot: Comparison of various energy modelling tools
BRE report number 283 724 Commercial in confidence
© Building Research Establishment Ltd 2012
Annexe A: Fuel cost & CO2 emissions from RdSAP and Design Builder
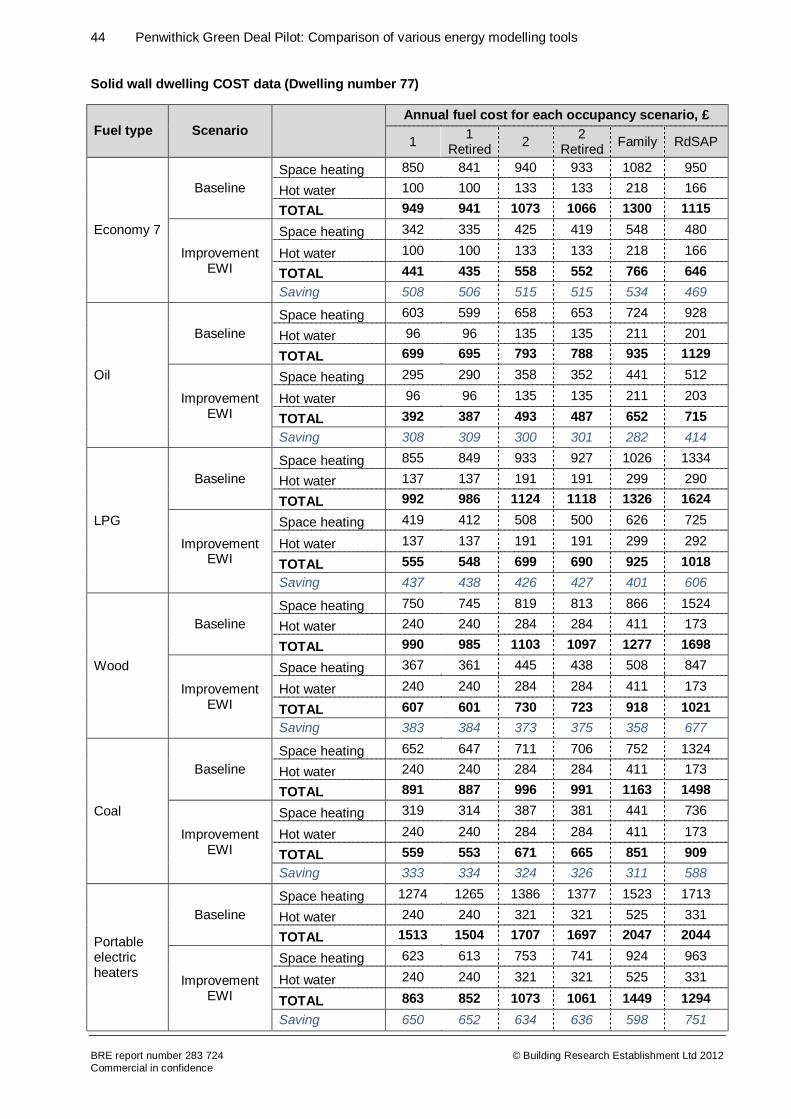
44 Penwithick Green Deal Pilot: Comparison of various energy modelling tools
BRE report number 283 724 Commercial in confidence
© Building Research Establishment Ltd 2012
Solid wall dwelling COST data (Dwelling number 77)
Fuel type Scenario
Annual fuel cost for each occupancy scenario, £
1 1 Retired 2 2
Retired Family RdSAP
Economy 7
Baseline Space heating 850 841 940 933 1082 950
Hot water 100 100 133 133 218 166
TOTAL 949 941 1073 1066 1300 1115
Improvement EWI
Space heating 342 335 425 419 548 480
Hot water 100 100 133 133 218 166
TOTAL 441 435 558 552 766 646 Saving 508 506 515 515 534 469
Oil
Baseline Space heating 603 599 658 653 724 928
Hot water 96 96 135 135 211 201
TOTAL 699 695 793 788 935 1129
Improvement EWI
Space heating 295 290 358 352 441 512
Hot water 96 96 135 135 211 203
TOTAL 392 387 493 487 652 715 Saving 308 309 300 301 282 414
LPG
Baseline Space heating 855 849 933 927 1026 1334
Hot water 137 137 191 191 299 290
TOTAL 992 986 1124 1118 1326 1624
Improvement EWI
Space heating 419 412 508 500 626 725
Hot water 137 137 191 191 299 292
TOTAL 555 548 699 690 925 1018 Saving 437 438 426 427 401 606
Wood
Baseline Space heating 750 745 819 813 866 1524
Hot water 240 240 284 284 411 173
TOTAL 990 985 1103 1097 1277 1698
Improvement EWI
Space heating 367 361 445 438 508 847
Hot water 240 240 284 284 411 173
TOTAL 607 601 730 723 918 1021 Saving 383 384 373 375 358 677
Coal
Baseline Space heating 652 647 711 706 752 1324
Hot water 240 240 284 284 411 173
TOTAL 891 887 996 991 1163 1498
Improvement EWI
Space heating 319 314 387 381 441 736
Hot water 240 240 284 284 411 173
TOTAL 559 553 671 665 851 909 Saving 333 334 324 326 311 588
Portable electric heaters
Baseline Space heating 1274 1265 1386 1377 1523 1713
Hot water 240 240 321 321 525 331
TOTAL 1513 1504 1707 1697 2047 2044
Improvement EWI
Space heating 623 613 753 741 924 963
Hot water 240 240 321 321 525 331
TOTAL 863 852 1073 1061 1449 1294 Saving 650 652 634 636 598 751
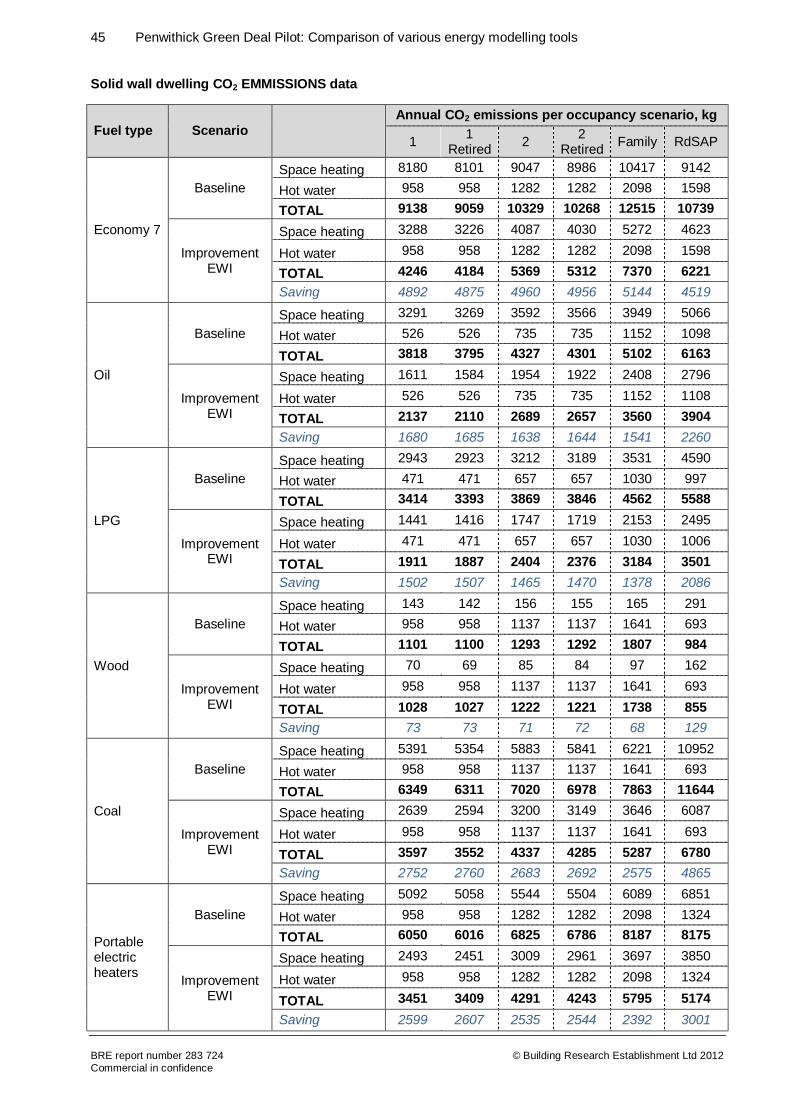
45 Penwithick Green Deal Pilot: Comparison of various energy modelling tools
BRE report number 283 724 Commercial in confidence
© Building Research Establishment Ltd 2012
Solid wall dwelling CO2 EMMISSIONS data
Fuel type Scenario
Annual CO2 emissions per occupancy scenario, kg
1 1 Retired 2 2
Retired Family RdSAP
Economy 7
Baseline Space heating 8180 8101 9047 8986 10417 9142
Hot water 958 958 1282 1282 2098 1598
TOTAL 9138 9059 10329 10268 12515 10739
Improvement EWI
Space heating 3288 3226 4087 4030 5272 4623
Hot water 958 958 1282 1282 2098 1598
TOTAL 4246 4184 5369 5312 7370 6221 Saving 4892 4875 4960 4956 5144 4519
Oil
Baseline Space heating 3291 3269 3592 3566 3949 5066
Hot water 526 526 735 735 1152 1098
TOTAL 3818 3795 4327 4301 5102 6163
Improvement EWI
Space heating 1611 1584 1954 1922 2408 2796
Hot water 526 526 735 735 1152 1108
TOTAL 2137 2110 2689 2657 3560 3904 Saving 1680 1685 1638 1644 1541 2260
LPG
Baseline Space heating 2943 2923 3212 3189 3531 4590
Hot water 471 471 657 657 1030 997
TOTAL 3414 3393 3869 3846 4562 5588
Improvement EWI
Space heating 1441 1416 1747 1719 2153 2495
Hot water 471 471 657 657 1030 1006
TOTAL 1911 1887 2404 2376 3184 3501 Saving 1502 1507 1465 1470 1378 2086
Wood
Baseline Space heating 143 142 156 155 165 291
Hot water 958 958 1137 1137 1641 693
TOTAL 1101 1100 1293 1292 1807 984
Improvement EWI
Space heating 70 69 85 84 97 162
Hot water 958 958 1137 1137 1641 693
TOTAL 1028 1027 1222 1221 1738 855 Saving 73 73 71 72 68 129
Coal
Baseline Space heating 5391 5354 5883 5841 6221 10952
Hot water 958 958 1137 1137 1641 693
TOTAL 6349 6311 7020 6978 7863 11644
Improvement EWI
Space heating 2639 2594 3200 3149 3646 6087
Hot water 958 958 1137 1137 1641 693
TOTAL 3597 3552 4337 4285 5287 6780 Saving 2752 2760 2683 2692 2575 4865
Portable electric heaters
Baseline Space heating 5092 5058 5544 5504 6089 6851
Hot water 958 958 1282 1282 2098 1324
TOTAL 6050 6016 6825 6786 8187 8175
Improvement EWI
Space heating 2493 2451 3009 2961 3697 3850
Hot water 958 958 1282 1282 2098 1324
TOTAL 3451 3409 4291 4243 5795 5174 Saving 2599 2607 2535 2544 2392 3001
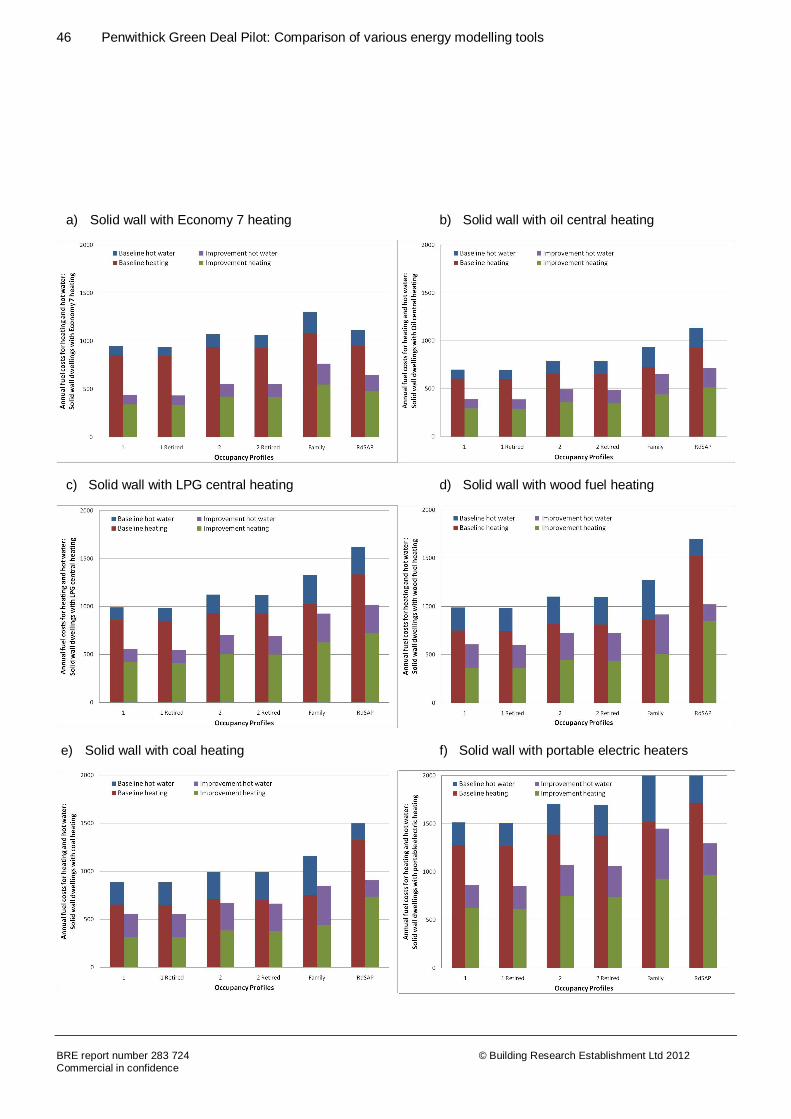
46 Penwithick Green Deal Pilot: Comparison of various energy modelling tools
BRE report number 283 724 Commercial in confidence
© Building Research Establishment Ltd 2012
a) Solid wall with Economy 7 heating b) Solid wall with oil central heating
c) Solid wall with LPG central heating d) Solid wall with wood fuel heating
e) Solid wall with coal heating f) Solid wall with portable electric heaters

47 Penwithick Green Deal Pilot: Comparison of various energy modelling tools
BRE report number 283 724 Commercial in confidence
© Building Research Establishment Ltd 2012
Cornish-type property COST data (Dwelling number 89)
Fuel type Scenario
Annual fuel cost for each occupancy scenario, £
1 1 Retired 2 2
Retired Family RdSAP
Economy 7
Baseline Space heating 714 709 814 807 904 758
Hot water 80 80 112 112 175 161
TOTAL 794 789 926 919 1079 919
Improvement EWI
Space heating 456 450 548 542 636 494
Hot water 80 80 112 112 175 161
TOTAL 536 530 660 654 811 655 Saving 258 259 266 265 268 264
Oil
Baseline Space heating 504 500 598 594 645 737
Hot water 78 78 108 108 170 161
TOTAL 581 578 706 703 814 899
Improvement EWI
Space heating 347 343 447 443 492 500
Hot water 78 78 108 108 170 162
TOTAL 425 421 556 551 662 662 Saving 157 157 151 151 153 236
LPG
Baseline Space heating 715 710 848 843 914 1040
Hot water 110 110 154 154 241 282
TOTAL 825 820 1002 997 1155 1322
Improvement EWI
Space heating 492 487 634 628 698 692
Hot water 110 110 154 154 241 284
TOTAL 602 597 788 782 938 976 Saving 222 223 214 215 216 347
Wood
Baseline Space heating 674 669 744 740 798 1201
Hot water 164 164 229 229 359 163
TOTAL 838 833 973 968 1156 1365
Improvement EWI
Space heating 477 472 557 551 613 817
Hot water 164 164 229 229 359 163
TOTAL 641 636 785 780 972 980 Saving 197 197 188 188 185 385
Coal
Baseline Space heating 585 582 647 643 693 1044
Hot water 164 164 229 229 359 163
TOTAL 749 745 875 871 1052 1207
Improvement EWI
Space heating 414 410 484 479 533 709
Hot water 164 164 229 229 359 163
TOTAL 578 574 712 707 891 873 Saving 171 172 163 164 160 334
Portable electric heaters
Baseline Space heating 1144 1136 1261 1253 1354 1397
Hot water 193 193 269 269 422 218
TOTAL 1337 1329 1530 1522 1776 1615
Improvement EWI
Space heating 810 801 941 931 1041 973
Hot water 193 193 269 269 422 320
TOTAL 1002 994 1209 1200 1463 1292 Saving 334 335 320 321 313 322
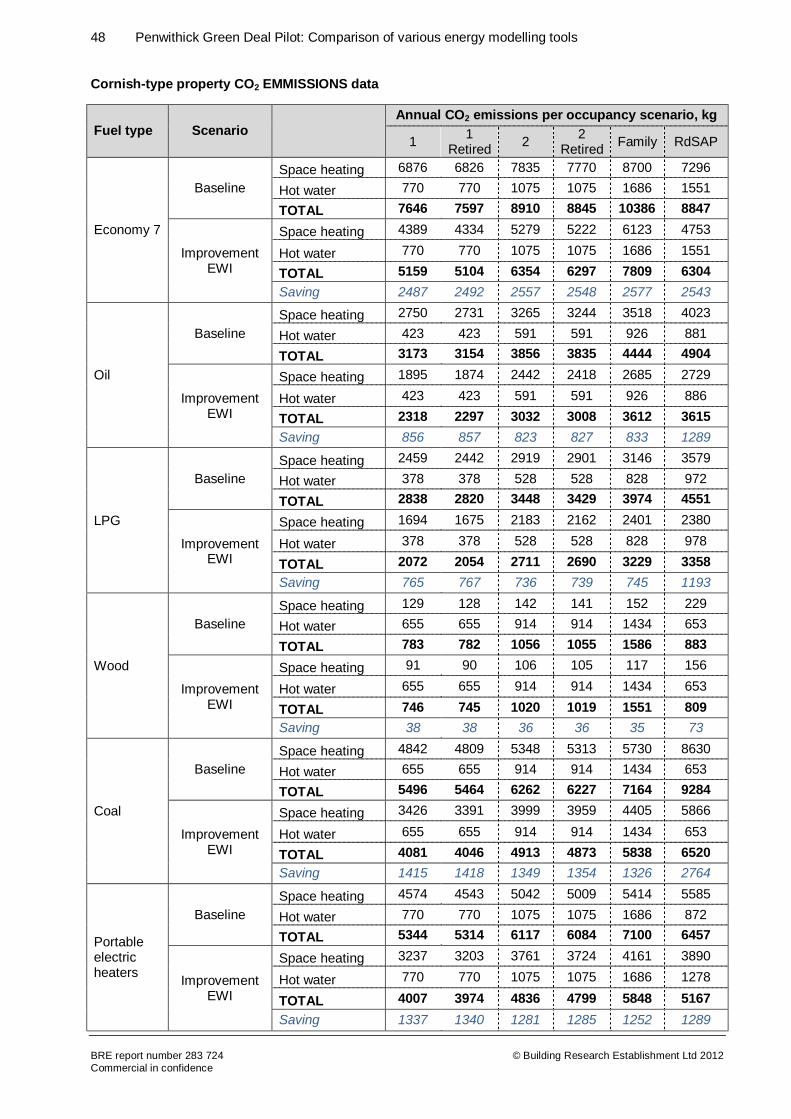
48 Penwithick Green Deal Pilot: Comparison of various energy modelling tools
BRE report number 283 724 Commercial in confidence
© Building Research Establishment Ltd 2012
Cornish-type property CO2 EMMISSIONS data
Fuel type Scenario
Annual CO2 emissions per occupancy scenario, kg
1 1 Retired 2 2
Retired Family RdSAP
Economy 7
Baseline Space heating 6876 6826 7835 7770 8700 7296
Hot water 770 770 1075 1075 1686 1551
TOTAL 7646 7597 8910 8845 10386 8847
Improvement EWI
Space heating 4389 4334 5279 5222 6123 4753
Hot water 770 770 1075 1075 1686 1551
TOTAL 5159 5104 6354 6297 7809 6304 Saving 2487 2492 2557 2548 2577 2543
Oil
Baseline Space heating 2750 2731 3265 3244 3518 4023
Hot water 423 423 591 591 926 881
TOTAL 3173 3154 3856 3835 4444 4904
Improvement EWI
Space heating 1895 1874 2442 2418 2685 2729
Hot water 423 423 591 591 926 886
TOTAL 2318 2297 3032 3008 3612 3615 Saving 856 857 823 827 833 1289
LPG
Baseline Space heating 2459 2442 2919 2901 3146 3579
Hot water 378 378 528 528 828 972
TOTAL 2838 2820 3448 3429 3974 4551
Improvement EWI
Space heating 1694 1675 2183 2162 2401 2380
Hot water 378 378 528 528 828 978
TOTAL 2072 2054 2711 2690 3229 3358 Saving 765 767 736 739 745 1193
Wood
Baseline Space heating 129 128 142 141 152 229
Hot water 655 655 914 914 1434 653
TOTAL 783 782 1056 1055 1586 883
Improvement EWI
Space heating 91 90 106 105 117 156
Hot water 655 655 914 914 1434 653
TOTAL 746 745 1020 1019 1551 809 Saving 38 38 36 36 35 73
Coal
Baseline Space heating 4842 4809 5348 5313 5730 8630
Hot water 655 655 914 914 1434 653
TOTAL 5496 5464 6262 6227 7164 9284
Improvement EWI
Space heating 3426 3391 3999 3959 4405 5866
Hot water 655 655 914 914 1434 653
TOTAL 4081 4046 4913 4873 5838 6520 Saving 1415 1418 1349 1354 1326 2764
Portable electric heaters
Baseline Space heating 4574 4543 5042 5009 5414 5585
Hot water 770 770 1075 1075 1686 872
TOTAL 5344 5314 6117 6084 7100 6457
Improvement EWI
Space heating 3237 3203 3761 3724 4161 3890
Hot water 770 770 1075 1075 1686 1278
TOTAL 4007 3974 4836 4799 5848 5167 Saving 1337 1340 1281 1285 1252 1289
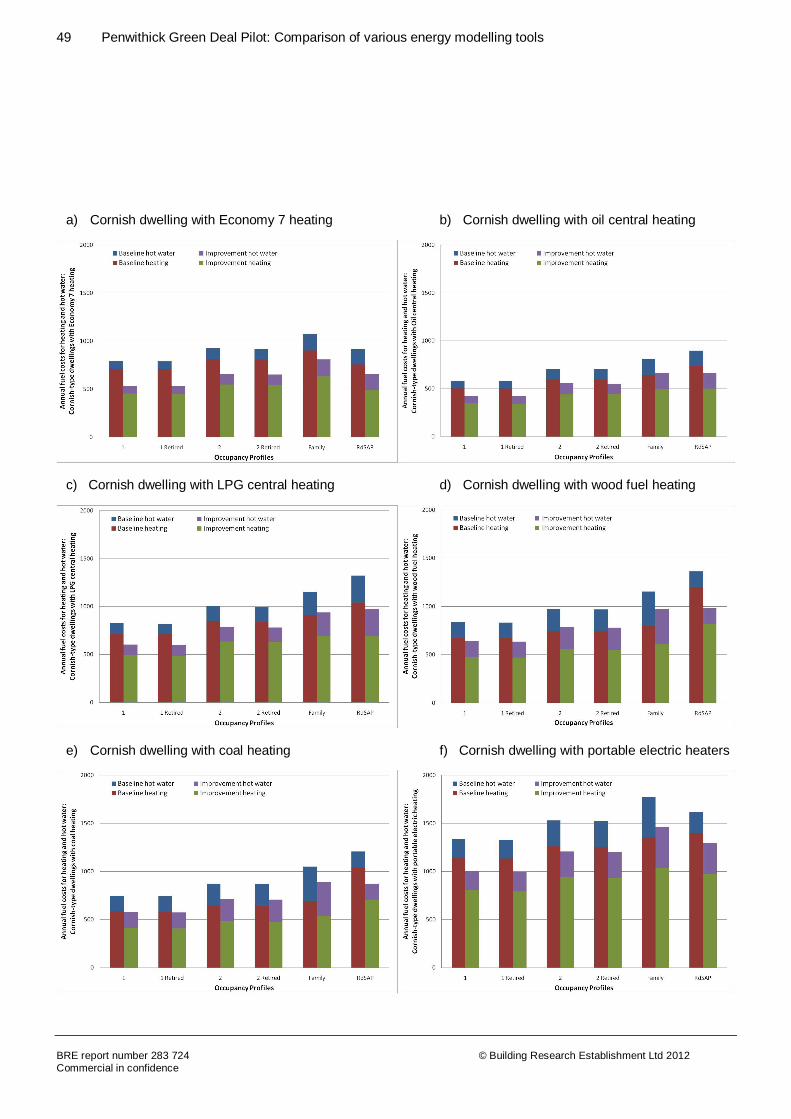
49 Penwithick Green Deal Pilot: Comparison of various energy modelling tools
BRE report number 283 724 Commercial in confidence
© Building Research Establishment Ltd 2012
a) Cornish dwelling with Economy 7 heating b) Cornish dwelling with oil central heating
c) Cornish dwelling with LPG central heating d) Cornish dwelling with wood fuel heating
e) Cornish dwelling with coal heating f) Cornish dwelling with portable electric heaters

50 Penwithick Green Deal Pilot: Comparison of various energy modelling tools
BRE report number 283 724 Commercial in confidence
© Building Research Establishment Ltd 2012
Cavity wall house COST data (Dwelling number 91)
Fuel type Scenario
Annual fuel cost for each occupancy scenario, £
1 1 Retired 2 2
Retired Family RdSAP
LPG
Baseline Space heating 354 347 449 441 508 596
Hot water 124 124 172 172 270 292
TOTAL 478 471 621 614 778 888
Improvement EWI
Space heating 173 169 217 213 243 294
Hot water 61 61 86 86 134 256
TOTAL 234 231 302 298 378 549 Saving 244 240 319 315 400 338
Wood
Baseline Space heating 384 378 358 352 466 767
Hot water 174 174 243 243 381 168
TOTAL 558 552 601 595 847 934
Improvement EWI
Space heating 215 212 201 197 257 352
Hot water 58 58 81 81 127 253
TOTAL 273 270 282 278 384 604 Saving 285 282 319 316 464 330
Coal
Baseline Space heating 265 260 338 332 385 622
Hot water 184 184 257 257 403 171
TOTAL 449 444 595 589 788 793
Improvement EWI
Space heating 173 169 217 213 243 294
Hot water 61 61 86 86 134 256
TOTAL 234 231 302 298 378 549 Saving 215 213 293 291 410 244
Portable electric heaters
Baseline Space heating 518 508 657 646 746 812
Hot water 216 216 302 302 474 329
TOTAL 734 724 959 948 1220 1140
Improvement EWI
Space heating 173 169 217 213 243 294
Hot water 61 61 86 86 134 256
TOTAL 234 231 302 298 378 549 Saving 500 494 657 650 842 591

51 Penwithick Green Deal Pilot: Comparison of various energy modelling tools
BRE report number 283 724 Commercial in confidence
© Building Research Establishment Ltd 2012
Cavity wall house CO2 EMMISSIONS data
Fuel type Scenario
Annual CO2 emissions per occupancy scenario, kg
1 1 Retired 2 2
Retired Family RdSAP
LPG
Baseline Space heating 1219 1195 1544 1518 1746 2051
Hot water 425 425 593 593 931 1004
TOTAL 1644 1620 2137 2111 2677 3054
Improvement EWI
Space heating 691 677 866 851 973 1174
Hot water 246 246 342 342 537 1022
TOTAL 936 923 1208 1193 1510 2196 Saving 707 698 929 918 1167 858
Wood
Baseline Space heating 58 57 74 73 85 137
Hot water 735 735 1027 1027 1610 685
TOTAL 793 792 1101 1100 1695 822
Improvement EWI
Space heating 691 677 866 851 973 1174
Hot water 246 246 342 342 537 1022
TOTAL 936 923 1208 1193 1510 2196 Saving -143 -131 -107 -93 185 -1374
Coal
Baseline Space heating 2193 2151 2797 2749 3182 5143
Hot water 735 735 1027 1027 1610 685
TOTAL 2928 2886 3824 3776 4792 5829
Improvement EWI
Space heating 691 677 866 851 973 1174
Hot water 246 246 342 342 537 1022
TOTAL 936 923 1208 1193 1510 2196 Saving 1992 1963 2616 2583 3283 3632
Portable electric heaters
Baseline Space heating 2071 2032 2626 2582 2984 3246
Hot water 865 865 1208 1208 1895 1314
TOTAL 2936 2897 3835 3791 4878 4560
Improvement EWI
Space heating 691 677 866 851 973 1174
Hot water 246 246 342 342 537 1022
TOTAL 936 923 1208 1193 1510 2196 Saving 2000 1974 2626 2597 3369 2364
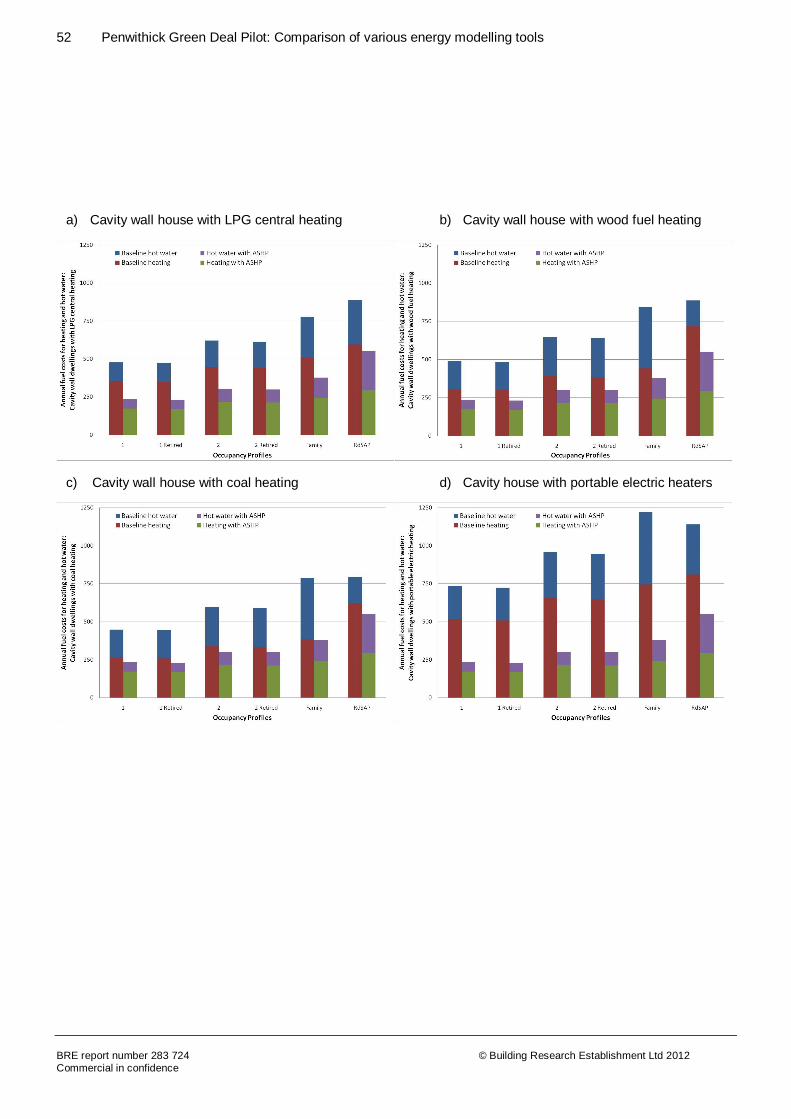
52 Penwithick Green Deal Pilot: Comparison of various energy modelling tools
BRE report number 283 724 Commercial in confidence
© Building Research Establishment Ltd 2012
a) Cavity wall house with LPG central heating b) Cavity wall house with wood fuel heating
c) Cavity wall house with coal heating d) Cavity house with portable electric heaters

53 Penwithick Green Deal Pilot: Comparison of various energy modelling tools
BRE report number 283 724 Commercial in confidence
© Building Research Establishment Ltd 2012
Cavity wall bungalow COST data (Dwelling number 68)
Fuel type Scenario
Annual fuel cost for each occupancy scenario, £
1 1 Retired 2 2
Retired Family RdSAP
LPG
Baseline Space heating 438 431 408 401 532 649
Hot water 117 117 163 163 256 288
TOTAL 554 548 571 564 787 937
Improvement EWI
Space heating 215 212 201 197 257 352
Hot water 58 58 81 81 127 253
TOTAL 273 270 282 278 384 604 Saving 281 278 289 286 404 333
Wood
Baseline Space heating 384 378 358 352 466 767
Hot water 174 174 243 243 381 168
TOTAL 558 552 601 595 847 934
Improvement EWI
Space heating 215 212 201 197 257 352
Hot water 58 58 81 81 127 253
TOTAL 273 270 282 278 384 604 Saving 285 282 319 316 464 330
Coal
Baseline Space heating 333 329 311 306 405 666
Hot water 174 174 243 243 381 168
TOTAL 507 502 554 548 786 834
Improvement EWI
Space heating 215 212 201 197 257 352
Hot water 58 58 81 81 127 253
TOTAL 273 270 282 278 384 604 Saving 234 233 272 270 403 229
Portable electric heaters
Baseline Space heating 648 639 606 596 786 874
Hot water 205 205 286 286 448 324
TOTAL 853 844 891 881 1234 1198
Improvement EWI
Space heating 215 212 201 197 257 352
Hot water 58 58 81 81 127 253
TOTAL 273 270 282 278 384 604 Saving 580 574 610 603 851 594
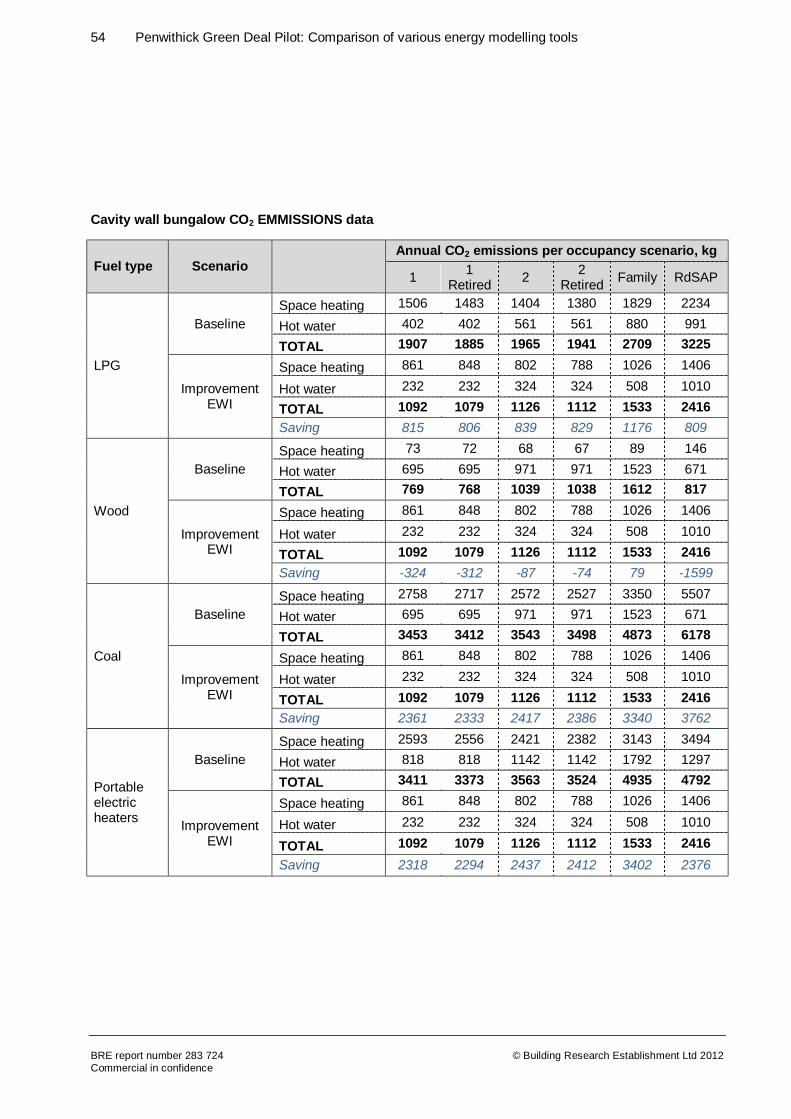
54 Penwithick Green Deal Pilot: Comparison of various energy modelling tools
BRE report number 283 724 Commercial in confidence
© Building Research Establishment Ltd 2012
Cavity wall bungalow CO2 EMMISSIONS data
Fuel type Scenario
Annual CO2 emissions per occupancy scenario, kg
1 1 Retired 2 2
Retired Family RdSAP
LPG
Baseline Space heating 1506 1483 1404 1380 1829 2234
Hot water 402 402 561 561 880 991
TOTAL 1907 1885 1965 1941 2709 3225
Improvement EWI
Space heating 861 848 802 788 1026 1406
Hot water 232 232 324 324 508 1010
TOTAL 1092 1079 1126 1112 1533 2416 Saving 815 806 839 829 1176 809
Wood
Baseline Space heating 73 72 68 67 89 146
Hot water 695 695 971 971 1523 671
TOTAL 769 768 1039 1038 1612 817
Improvement EWI
Space heating 861 848 802 788 1026 1406
Hot water 232 232 324 324 508 1010
TOTAL 1092 1079 1126 1112 1533 2416 Saving -324 -312 -87 -74 79 -1599
Coal
Baseline Space heating 2758 2717 2572 2527 3350 5507
Hot water 695 695 971 971 1523 671
TOTAL 3453 3412 3543 3498 4873 6178
Improvement EWI
Space heating 861 848 802 788 1026 1406
Hot water 232 232 324 324 508 1010
TOTAL 1092 1079 1126 1112 1533 2416 Saving 2361 2333 2417 2386 3340 3762
Portable electric heaters
Baseline Space heating 2593 2556 2421 2382 3143 3494
Hot water 818 818 1142 1142 1792 1297
TOTAL 3411 3373 3563 3524 4935 4792
Improvement EWI
Space heating 861 848 802 788 1026 1406
Hot water 232 232 324 324 508 1010
TOTAL 1092 1079 1126 1112 1533 2416 Saving 2318 2294 2437 2412 3402 2376
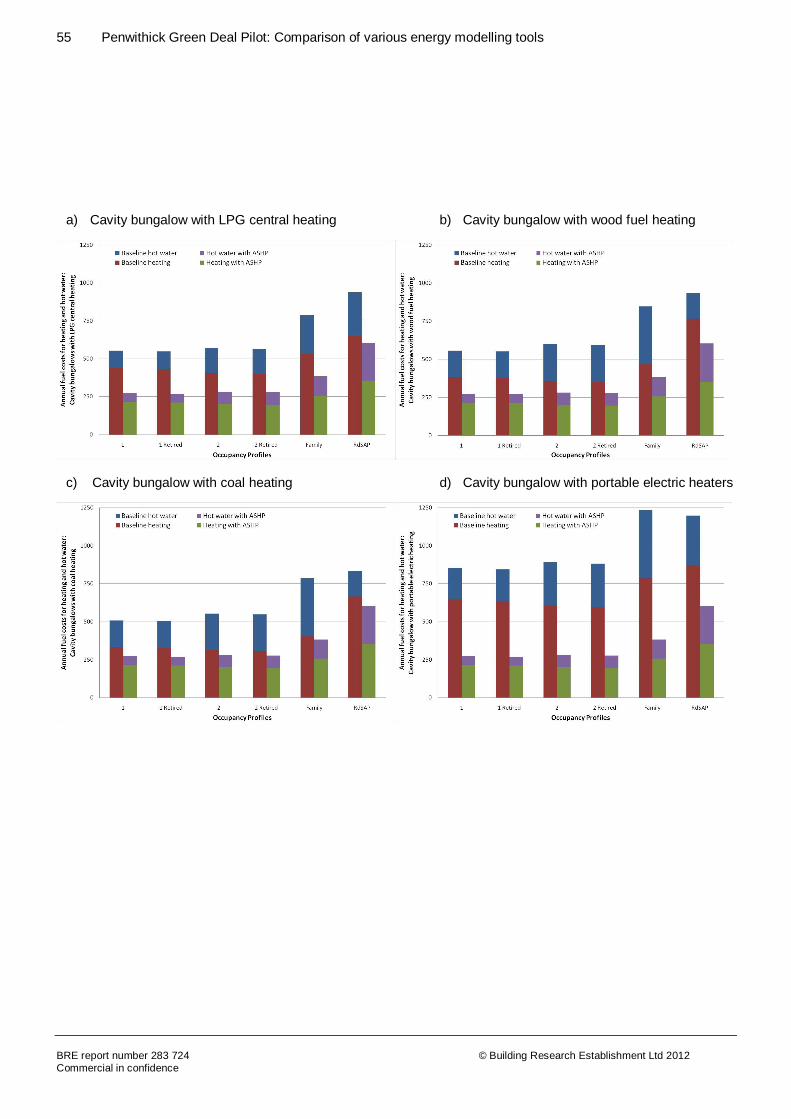
55 Penwithick Green Deal Pilot: Comparison of various energy modelling tools
BRE report number 283 724 Commercial in confidence
© Building Research Establishment Ltd 2012
a) Cavity bungalow with LPG central heating b) Cavity bungalow with wood fuel heating
c) Cavity bungalow with coal heating d) Cavity bungalow with portable electric heaters

56 Penwithick Green Deal Pilot: Comparison of various energy modelling tools
BRE report number 283 724 Commercial in confidence
© Building Research Establishment Ltd 2012
Timber hybrid dwelling COST data (Dwelling number 46)
Fuel type Scenario
Annual fuel cost for each occupancy scenario, £
1 1 Retired 2 2
Retired Family RdSAP
LPG
Baseline Space heating 481 480 588 562 684 716
Hot water 116 116 162 162 254 287
TOTAL 597 596 750 724 938 1004
Improvement EWI
Space heating 239 238 288 276 332 416
Hot water 58 58 80 80 126 252
TOTAL 296 296 369 356 458 668 Saving 301 300 381 368 480 335
Wood
Baseline Space heating 422 421 516 493 600 847
Hot water 173 173 241 241 378 167
TOTAL 595 594 757 735 979 1015
Improvement EWI
Space heating 239 238 288 276 332 416
Hot water 58 58 80 80 126 252
TOTAL 296 296 369 356 458 668 Saving 298 298 389 379 520 346
Coal
Baseline Space heating 367 366 448 429 522 736
Hot water 173 173 241 241 378 167
TOTAL 539 539 690 670 900 903
Improvement EWI
Space heating 239 238 288 276 332 416
Hot water 58 58 80 80 126 252
TOTAL 296 296 369 356 458 668 Saving 243 243 321 314 442 235
Portable electric heaters
Baseline Space heating 716 715 872 833 1012 1080
Hot water 203 203 284 284 445 324
TOTAL 919 919 1155 1117 1457 1404
Improvement EWI
Space heating 239 238 288 276 332 416
Hot water 58 58 80 80 126 252
TOTAL 296 296 369 356 458 668 Saving 623 623 787 761 999 735
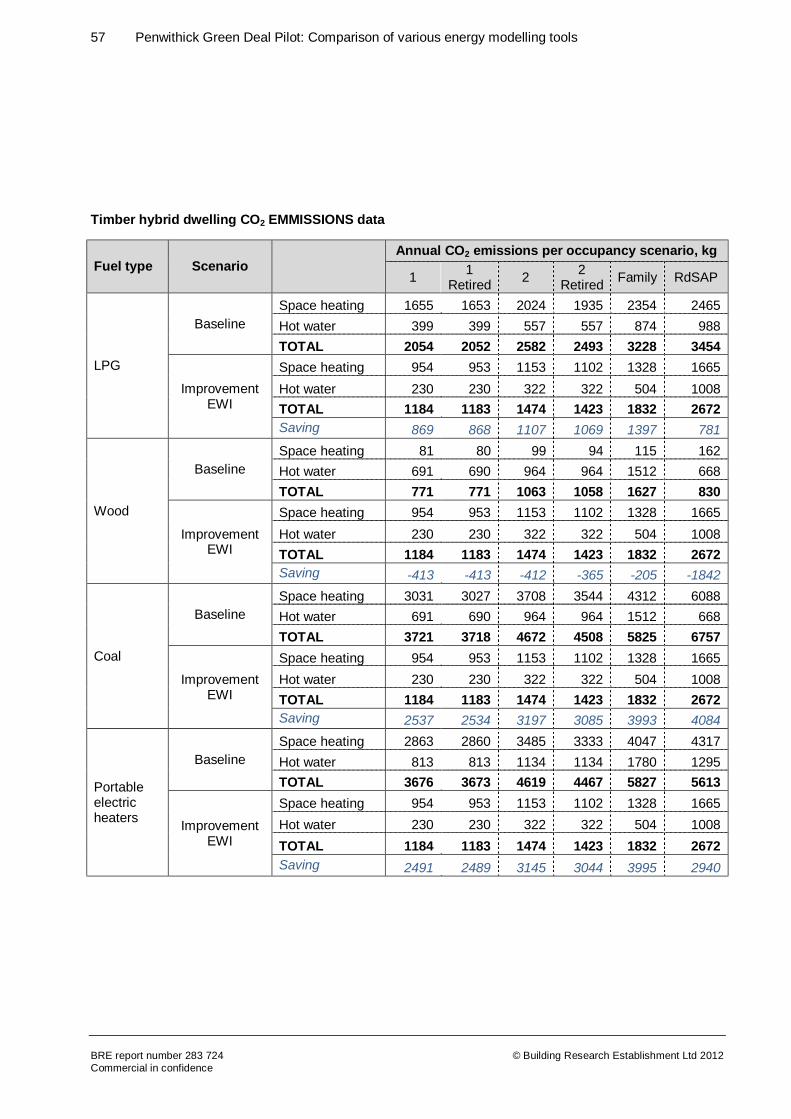
57 Penwithick Green Deal Pilot: Comparison of various energy modelling tools
BRE report number 283 724 Commercial in confidence
© Building Research Establishment Ltd 2012
Timber hybrid dwelling CO2 EMMISSIONS data
Fuel type Scenario
Annual CO2 emissions per occupancy scenario, kg
1 1 Retired 2 2
Retired Family RdSAP
LPG
Baseline Space heating 1655 1653 2024 1935 2354 2465 Hot water 399 399 557 557 874 988 TOTAL 2054 2052 2582 2493 3228 3454
Improvement EWI
Space heating 954 953 1153 1102 1328 1665 Hot water 230 230 322 322 504 1008 TOTAL 1184 1183 1474 1423 1832 2672 Saving 869 868 1107 1069 1397 781
Wood
Baseline Space heating 81 80 99 94 115 162 Hot water 691 690 964 964 1512 668 TOTAL 771 771 1063 1058 1627 830
Improvement EWI
Space heating 954 953 1153 1102 1328 1665 Hot water 230 230 322 322 504 1008 TOTAL 1184 1183 1474 1423 1832 2672 Saving -413 -413 -412 -365 -205 -1842
Coal
Baseline Space heating 3031 3027 3708 3544 4312 6088 Hot water 691 690 964 964 1512 668 TOTAL 3721 3718 4672 4508 5825 6757
Improvement EWI
Space heating 954 953 1153 1102 1328 1665 Hot water 230 230 322 322 504 1008 TOTAL 1184 1183 1474 1423 1832 2672 Saving 2537 2534 3197 3085 3993 4084
Portable electric heaters
Baseline Space heating 2863 2860 3485 3333 4047 4317 Hot water 813 813 1134 1134 1780 1295 TOTAL 3676 3673 4619 4467 5827 5613
Improvement EWI
Space heating 954 953 1153 1102 1328 1665 Hot water 230 230 322 322 504 1008 TOTAL 1184 1183 1474 1423 1832 2672 Saving 2491 2489 3145 3044 3995 2940

58 Penwithick Green Deal Pilot: Comparison of various energy modelling tools
BRE report number 283 724 Commercial in confidence
© Building Research Establishment Ltd 2012
a) Timber hybrid with LPG central heating b) Timber hybrid with wood fuel heating
c) Timber hybrid with coal heating d) Timber hybrid with portable electric heaters