pennsylvania's vehicle safety inspection program ... safety inspectio… ·...
TRANSCRIPT

Pennsylvania’s Vehicle Safety Inspection Program Effectiveness Study (070609) Summary of Findings
Final Report March 2009
By Cambridge Systematics, Inc.
COMMONWEALTH OF PENNSYLVANIA DEPARTMENT OF TRANSPORTATION
CONTRACT # 355I01 PROJECT # 7821.011

Technical Report Documentation Page 1. Report No. PA-2009-004-070609
2. Government Accession No.
3. Recipient’s Catalog No.
5. Report Date March 26, 2009
4. Title and Subtitle Pennsylvania’s Vehicle Safety Inspection Program Effectiveness Study (070609) Summary of Findings
6. Performing Organization Code
7. Author(s) Vlahos, Nicholas J., Samuel T. Lawton, Anurag K. Komanduri, Yasasvi D. Popuri, and Danena L. Gaines
8. Performing Organization Report No.
10. Work Unit No. (TRAIS)
9. Performing Organization Name and Address Cambridge Systematics, Inc. 115 South La Salle Street, Suite 2200 Chicago, IL 60603
11. Contract or Grant No. 355I01 13. Type of Report and Period Covered Final Report
12. Sponsoring Agency Name and Address The Pennsylvania Department of Transportation Bureau of Planning and Research Commonwealth Keystone Building 400 North Street, 6th Floor Harrisburg, PA 17120-0064
14. Sponsoring Agency Code
15. Supplementary Notes 16. Abstract This report presents research regarding Pennsylvania’s Vehicle Safety Inspection program. The research considered the effectiveness of vehicle safety inspections on the number of fatal crashes, and the benefits of the program compared to the cost of inspections to the owners of Pennsylvania-registered vehicles. After a review of the most relevant literature over the previous 40 years, and telephone interviews with representatives from four agencies with responsibility for similar programs in other states, a statistical analysis was developed and implemented. The statistical analysis focused on crash data from the Fatality Analysis Reporting System (FARS), control data from a variety of national sources, and characteristics of existing programs nationwide. The results of the statistical analysis are clear and consistent. Using three different classes of model formulations, states with vehicle safety inspection programs have significantly less fatal crashes than states without programs. The benefits of the program as derived from all three models exceed the user costs of the program. The results of the research clearly demonstrate that the Vehicle Safety Inspection program in Pennsylvania is effective and saves lives. 17. Key Words Pennsylvania, transportation safety, program evaluation, vehicle safety inspection, fatal crash, regression analysis, Fatality Analysis Reporting System
18. Distribution Statement No restrictions. This document is available from the National Technical Information Service, Springfield, VA 22161
19. Security Classif. (of this report) Unclassified
20. Security Classif. (of this page) Unclassified
21. No. of Pages 78
22. Price
Form DOT F 1700.7 (8-72) Reproduction of completed page authorized


final report
Pennsylvania’s Vehicle Safety Inspection Program Effectiveness Study (070609)
Summary of Findings
prepared for
Pennsylvania Department of Transportation
prepared by
Cambridge Systematics, Inc. 115 South LaSalle, Suite 2200 Chicago, Illinois 60603
date
March 2009

Pennsylvania's Vehicle Safety Inspection Program Effectiveness Study (070609)
Cambridge Systematics, Inc. i 7827.011
Table of Contents
Executive Summary ..................................................................................................ES-1
1.0 Introduction .........................................................................................................1-1 1.1 Overview......................................................................................................1-1 1.2 Organization of This Report......................................................................1-2
2.0 Literature Review and Agency Interviews.....................................................2-1 2.1 Background..................................................................................................2-1 2.2 Findings Drawn from the Available Literature......................................2-3 2.3 Agency Interviews......................................................................................2-9
3.0 Data Acquisition .................................................................................................3-1 3.1 Data Collection Objectives ........................................................................3-1 3.2 Data Sources and Compilation .................................................................3-2 3.3 Survey Design and Execution ...................................................................3-2 3.4 National Data Sources................................................................................3-3
4.0 Quantitative Analysis ........................................................................................4-1 4.1 Analysis Methodology...............................................................................4-1 4.2 Analysis Results ..........................................................................................4-5
5.0 Findings and Program Options........................................................................5-1 5.1 Project Findings ..........................................................................................5-1 5.2 Potential Program Options........................................................................5-1
A. Bibliography .......................................................................................................A-1
B. Review of Assembled Literature .................................................................... B-1
C. Data Dictionary for Quantitative Analysis...................................................C-1
D. Survey Instrument .............................................................................................D-1
E. Description of the Weather Aggregation Process........................................ E-1
F. Selected Model Results .....................................................................................F-1 F.1 Statewide Models Based on Exposure .....................................................F-1 F.2 Statewide Volume-Based Models.............................................................F-1 F.3 County-Level Models.................................................................................F-2

Pennsylvania's Vehicle Safety Inspection Program Effectiveness Study (070609)
Cambridge Systematics, Inc. iii
List of Tables
Table ES.1 Analysis of Safety Benefits versus User Cost in Pennsylvania for the Vehicle Safety Inspection Program ............................................... ES-3
Table 2.1 Passenger Safety Inspection Programs in U.S. ......................................2-2
Table 2.2 Summary of Literature Topics.................................................................2-6
Table 4.1 Fatal Crashes per Billion VMT.................................................................4-6
Table 4.2 Modeling Fatal Crash Rates at the State Level ......................................4-8
Table 4.3 Modeling Fatal Crashes at the State Level .............................................4-9
Table 4.4 Statewide versus County-Level Models ..............................................4-10
Table 4.5 Modeling Fatal Crashes at the County Level ......................................4-11
Table 4.6 Analysis of Safety Benefits versus User Cost in Pennsylvania for the Vehicle Safety Inspection Program ................................................4-14
Table C.1 Data Items Acquired at the County or Narrower Level ..................... C-1
Table C.2 Data Items Acquired at the State Level ................................................. C-2
Table D.1 Survey Questions: Identification and Contact Information ..............D-1
Table D.2 Survey Questions: Vehicle Safety Defects and Related Crashes.......D-1
Table D.3 Survey Questions: Vehicle Safety Inspection Program Characteristics...........................................................................................D-2
Table E.1 Cities for Pennsylvania County Weather Assignment ....................... E-1
Table F.1 Statewide VMT-Based Model with Population Density......................F-3
Table F.2 Statewide VMT-Based Model with Relative Income............................F-3
Table F.3 Statewide Volume-Based Model with Relative Income.......................F-4
Table F.4 Statewide Volume-Based Model with Statewide Precipitation..........F-4
Table F.5 County-Level Model with Proxy for State DUI/DWI Laws ...............F-5
Table F.6 County-Level Model with Only Population..........................................F-5

Pennsylvania's Vehicle Safety Inspection Program Effectiveness Study (070609)
Cambridge Systematics, Inc. v
List of Figures
Figure 4.1 Research Methodology for Quantitative Analysis ...............................4-2
Figure 4.2 Comparison of Fatal Crashes with Reported Vehicle Failures .........4-12
Figure E.1 Assignment of Pennsylvania Counties to NOAA Cities for Weather Characteristics........................................................................... E-2

Pennsylvania's Vehicle Safety Inspection Program Effectiveness Study (070609)
Cambridge Systematics, Inc. ES-1
Executive Summary
This report describes the activities and results for the Vehicle Safety Inspection Program (VSIP) Effectiveness Study (070609), performed by Cambridge Systematics, Inc. (CS) on behalf of the Pennsylvania Department of Transportation (PennDOT). The research considered the effectiveness of vehicle safety inspections on the number of fatal crashes, and the cost-effectiveness of the program compared to the cost of inspections to the owners of Pennsylvania-registered vehicles. The results of the research clearly demonstrate that the Vehicle Safety Inspection program in Pennsylvania is effective and saves lives.
The research contained both preparatory and analysis tasks. The preparatory tasks included:
• A review of the relevant literature over the last 40 years in the field of passen-ger vehicle safety inspections;
• Interviews with officials of four agencies which currently conduct vehicle safety inspections; and
• Collection of information about VSIP characteristics in those states with programs.
The literature reviewed was inconsistent in its conclusions. Based on our quan-titative analysis, we assert that some of this inconsistency may be due to differ-ences in model formulation across studies, as well as differences in the characteristics of the data sets used in the analyses. The inconsistencies were used to inform the approach for our quantitative analysis.
The quantitative analysis tasks were geared towards uncovering systematic dif-ferences in crash rates between states with vehicle safety inspection programs and those without. While studying the effectiveness of such programs, the analysis controlled for the effects of other variables that also could impact crash rates. A critical step in the analysis, therefore, was to identify these control vari-ables and to obtain corresponding data from the appropriate sources. The research team obtained control data for the subsequent analysis using available information from national (and in most cases official Federal) data sources.
Crash data for each state was obtained from the Fatality Analysis Reporting System (FARS), a Federal data set that provides information for every fatal crash that occurs in the United States. Crash data are provided by every state as a compilation of at-scene crash reports prepared by law enforcement agents. Data are summarized yearly and available for download from the National Highway Transportation Safety Administration (NHTSA) web site. Data from 2004 through 2007 was utilized for the quantitative analysis.

Pennsylvania's Vehicle Safety Inspection Program Effectiveness Study (070609)
ES-2 Cambridge Systematics, Inc.
Three sets of statistical models were developed, with each set addressing a variation of model formulation for the dependent variable:
1. Fatal crashes within a state, controlled per billion vehicle miles traveled;
2. Fatal crashes within a state, with potential exposure variables as independent variables; and
3. Fatal crashes within a county, with potential exposure variables as independ-ent variables.
The results of the statistical analysis are clear and consistent, and are summarized in Table ES.1. Using all three model formulations, states with vehi-cle safety inspection programs have significantly less fatal crashes than states without programs.
The analysis considered vehicle failure as reported at the fatal crash site as a potential explanatory variable. Reporting of this variable across states appears to be inconsistent, and the volumes available are not suitable to a full model for-mulation. There are, however, trends regarding the correspondence between vehicle age, the presence of a vehicle safety inspection program, and reported vehicle failure at a fatal crash site.
Pennsylvania’s Vehicle Safety Inspection Program is an effective program that reduces fatal crashes and saves lives in Pennsylvania. Specifically:
• Nationally, vehicle safety inspection programs appear to be a significant fac-tor in lowering fatal crashes;
• Based on the model results, Pennsylvania can be expected to have between 115 and 169 fewer fatal crashes each year, corresponding to between 127 and 187 fewer fatalities each year, than it would if it did not have a vehicle safety inspection program;
• The largest difference in reported vehicle failures at the scene of fatal crashes between states with programs and states without programs is for vehicles of three years of age or more; and
• The combination of state-level and county-level analysis of fatality data pro-vide consistent and complementary results.

Pennsylvania's Vehicle Safety Inspection Program Effectiveness Study (070609)
Cambridge Systematics, Inc. ES-3
Table ES.1 Analysis of Safety Benefits versus User Cost in Pennsylvania for the Vehicle Safety Inspection Program
Benefits of the Vehicle Safety Inspection Program as Calculated
by Various Models User Costs of the Vehicle Safety Inspection Program
Three Scenarios
Attribute State Model of Total Crashes (Table 4.3)
State Model of Crashes per Billion
VMT (Table 4.4)
County Model of Total Crashes
(Table 4.6) High Medium Low
Number of Fewer Crashes 114.30 168.91 141.37
Number of Fewer Deaths 127 187 157
Value of a Statistical Life $5.8 Million $5.8 Million $5.8 Million
Number of Vehicle Inspections 10.9 Million 10.9 Million 10.9 Million
Direct Cost of Inspection to Vehicle Owner
$23.00 $19.50 $16.00
Value of Vehicle Owner’s Time for the Inspection
$34.00 $17.00 $8.50
Value of Action $736.6 Million $1,084.6 Million $910.6 Million $621.3 Million $397.9 Million $267.0 Million
Source: Items in italics provided by the Pennsylvania Department of Transportation, 2007 figures. Number of Fewer Crashes and Number of Fewer Deaths are derived from the models presented in Section 4.0 Value of Statistical Life obtained from the U.S. Department of Transportation, http://ostpxweb.dot.gov/policy/reports/080205.htm. Medium value for time of inspection based on one hour of the value of the statistical life, based on an assumption of an average of 39 years of remaining life.


Pennsylvania's Vehicle Safety Inspection Program Effectiveness Study (070609)
Cambridge Systematics, Inc. 1-1
1.0 Introduction
1.1 OVERVIEW This report describes the activities and results for the Vehicle Safety Inspection Program Effectiveness Study (070609), performed by Cambridge Systematics, Inc. (CS) on behalf of the Pennsylvania Department of Transportation (PennDOT). PennDOT administers a Vehicle Safety Inspection Program. The safety inspec-tion procedure includes inspection and, in some cases, testing of a variety of vehicle components, including suspension, steering, brakes, tires, lighting and electrical system, windows, mirrors, windshield defrosters, washers and wipers, fuel system, speedometer, odometer, horn and warning devices, body and chas-sis, and exhaust system, as well as inspection of trailers. These inspections are conducted by approximately 16,000 independent inspection stations appointed by PennDOT.
Nearly 11 million inspections are performed each year in Pennsylvania. An inspection typically costs the owner between 16 and 23 dollars, of which a nominal fee for the inspection sticker is returned to the commonwealth. A new e-SAFETY initiative provides voluntary electronic data collection and storage program for participating inspection facilities. This program enables inspection facilities to enter information about each vehicle inspection, and have that information transmitted electronically to PennDOT. Those that do not participate in the e-SAFETY program are required to maintain paper copies of inspection record sheets.
The stated purpose of periodic vehicle inspections is to identify and remove unsafe vehicles from the road. In doing so, vehicle failure on the highways and crashes that may result in injuries or death can be prevented. Sixteen states or jurisdictions currently require periodic vehicle inspections. Four other states conduct random vehicle safety inspections or only inspect vehicles upon resale of a used vehicle. Safety inspections typically require certain mechanical and safety features of a vehicle to be in working order. The exact requirements vary from state to state.
Through this study of Vehicle Safety Inspection Program Effectiveness, PennDOT wishes to objectively determine the effectiveness of its inspection pro-gram and to conduct a comparison of crash data for states with and without vehicle safety inspection programs. The emphasis of the research was on fatal crashes.
Pennsylvania's Vehicle Safety Inspection Program Effectiveness Study (070609)
1-2 Cambridge Systematics, Inc.
The research project encompassed four sets of activities:
1. An assessment of the historical and current view of periodic vehicle safety inspection programs, through both a review of available literature and tele-phone interviews with officials in four states with existing programs;
2. Acquisition of data regarding both fatal crashes as well as potential controlling variables, all from national sources;
3. Analysis of structured hypotheses derived from the literature and interviews, supported by the acquired data; and
4. Development of findings and potential program options for future consideration.
1.2 ORGANIZATION OF THIS REPORT This document contains an Executive Summary and five sections:
• Section 1.0: Introduction. Provides an overview of this report.
• Section 2.0: Literature Review and Agency Interviews. Describes the findings of the review of relevant literature on the topic of vehicle safety inspection programs and their effectiveness. The literature was augmented through telephone interviews conducted with officials of agencies in four states with current periodic vehicle safety inspections.
• Section 3.0: Data Acquisition. Describes the various sources of data acquired by the research team to support the hypotheses of the program analysis.
• Section 4.0: Quantitative Analysis. Describes the methodology used to per-form a scholarly quantitative assessment of the national effects of periodic vehicle inspection programs on volumes and rates of fatal crashes, presents the most relevant models and their implications for Pennsylvania, and identi-fies a range of safety benefits and user costs for the program in Pennsylvania.
• Section 5.0: Findings and Program Options. Summarizes our findings regarding the Vehicle Safety Inspection Program, and presents potential directions for future program initiatives.
Pennsylvania's Vehicle Safety Inspection Program Effectiveness Study (070609)
Cambridge Systematics, Inc. 2-1
2.0 Literature Review and Agency Interviews
A number of studies and reports have presented data related to the benefits, costs, and effectiveness of Periodic Vehicle Safety Inspections. The purpose of this section is to review relevant literature on the topic of vehicle safety programs and their effectiveness, and to describe the findings of telephone interviews with officials of four agencies from states with vehicle safety inspection programs.
2.1 BACKGROUND Legislative History Vehicle safety inspections designed to improve highway safety began in 1926. Massachusetts implemented a voluntary inspection program in which compli-ance was actively encouraged. New York and Maryland followed suit in 1927 launching the “Save a Life” campaign. The campaign appealed to drivers to obtain vehicle checkups at officially designated service stations. Pennsylvania, New Jersey, and Delaware later joined the program. By 1929 Pennsylvania, Maryland, Delaware, and New Jersey enacted laws requiring periodic vehicle inspection in designated inspection garages or service stations. For the next 20 years the adoption of laws to require vehicle inspection was at the discretion of individual states and local governments. By 1966, 21 states enacted vehicle inspection laws.
The Highway Safety Act of 1966 mandated that uniform safety standards be issued by the U.S. DOT Secretary to include provisions for vehicle registration, operation, and inspection. The mandate required that vehicle inspection be part of each state’s Highway Safety Program. The National Highway Traffic Safety Administration (NHTSA) adopted the concept of “periodic motor vehicle inspections” for implementing the state Highway Safety Program standards proposed. States were provided with Federal funds to assist in implementing the programs. The states had until December 31, 1969 to implement or show reason-able progress toward implementing a highway safety program meeting Federal standards for vehicle inspection.
Under the authority of the National Traffic and Motor Vehicle Safety Act of 1966, NHTSA established vehicle-in-use standards in 1973. Most states were unwilling to implement the new standards, and many refused to establish a periodic vehi-cle safety inspections program. In 1976 Congress weakened NHTSA’s sanctioning in regard to enforcement of state program policies. A number of states discontinued their mandatory vehicle inspection programs.
Pennsylvania's Vehicle Safety Inspection Program Effectiveness Study (070609)
2-2 Cambridge Systematics, Inc.
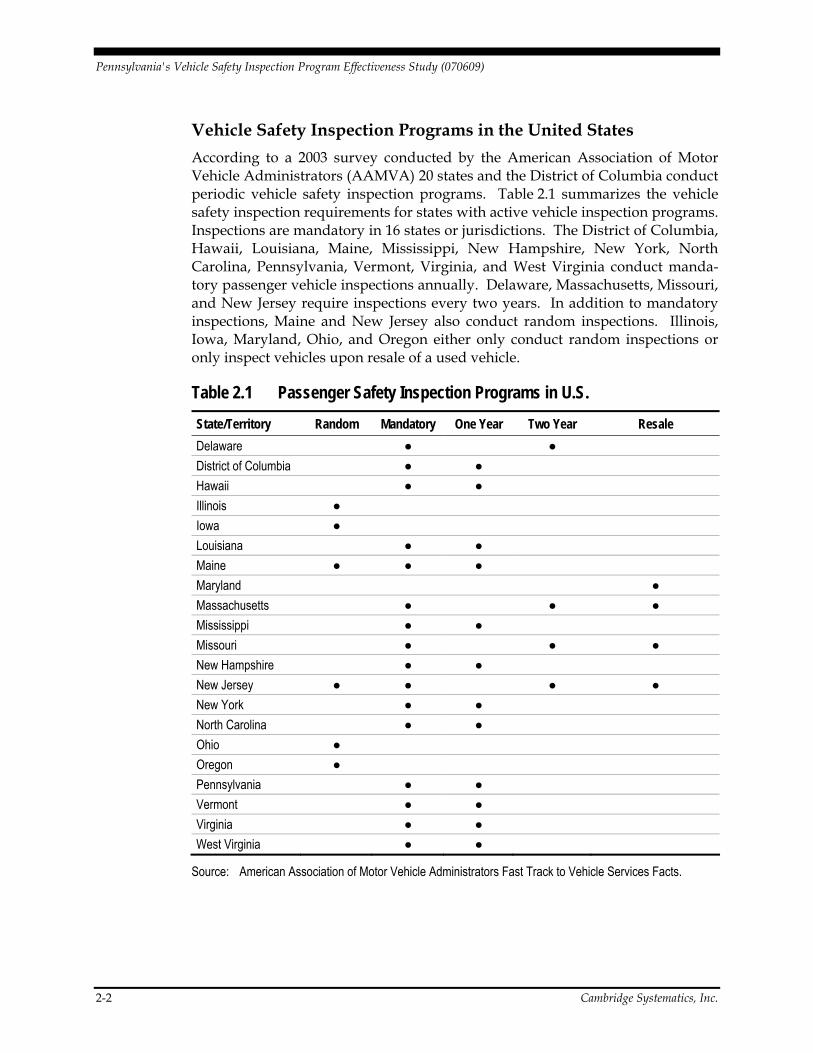
Vehicle Safety Inspection Programs in the United States According to a 2003 survey conducted by the American Association of Motor Vehicle Administrators (AAMVA) 20 states and the District of Columbia conduct periodic vehicle safety inspection programs. Table 2.1 summarizes the vehicle safety inspection requirements for states with active vehicle inspection programs. Inspections are mandatory in 16 states or jurisdictions. The District of Columbia, Hawaii, Louisiana, Maine, Mississippi, New Hampshire, New York, North Carolina, Pennsylvania, Vermont, Virginia, and West Virginia conduct manda-tory passenger vehicle inspections annually. Delaware, Massachusetts, Missouri, and New Jersey require inspections every two years. In addition to mandatory inspections, Maine and New Jersey also conduct random inspections. Illinois, Iowa, Maryland, Ohio, and Oregon either only conduct random inspections or only inspect vehicles upon resale of a used vehicle.
Table 2.1 Passenger Safety Inspection Programs in U.S. State/Territory Random Mandatory One Year Two Year Resale Delaware ● ● District of Columbia ● ● Hawaii ● ● Illinois ● Iowa ● Louisiana ● ● Maine ● ● ● Maryland ● Massachusetts ● ● ● Mississippi ● ● Missouri ● ● ● New Hampshire ● ● New Jersey ● ● ● ● New York ● ● North Carolina ● ● Ohio ● Oregon ● Pennsylvania ● ● Vermont ● ● Virginia ● ● West Virginia ● ●
Source: American Association of Motor Vehicle Administrators Fast Track to Vehicle Services Facts.
Pennsylvania's Vehicle Safety Inspection Program Effectiveness Study (070609)
Cambridge Systematics, Inc. 2-3
The items included in a vehicle safety inspection varied slightly from state to state. In general, brakes, tires and wheels, suspension and steering, torsion bars/springs/shock absorbers/struts, ball joint wear, lighting/signal devices, vehicle glazing, visibility/interior body, occupant restraint systems, exterior body parts, fuel and exhaust system, and the presence of emissions control components are examined for safety defects. The fees collected for inspections varied by state and by type of vehicle. Most states identified a set fee for inspections.
Research Themes and Methods A number of studies have investigated the effectiveness of vehicle safety inspec-tion programs. The literature revolves around four common themes – the influ-ence of programs on crash rates, influence of programs on mechanical condition, reliability, and effectiveness in detecting vehicle defects, and cost-effectiveness of programs.
Several studies investigated the effect programs have on general vehicle-related accident trends. Questions often considered include:
• Do inspections reduce the number of fatality or injury accidents?
• Does the inspection period influence the level of accident reduction?
• Do inspections influence the mechanical condition of cars?
• Are vehicle fleets in states with mandatory inspections in better mechanical condition?
Researchers have questioned the reliability and effectiveness of vehicle inspec-tions to detect vehicle defects. What is the probability that vehicle defects go undetected? Do the costs of inspection outweigh the benefits? Previous studies of vehicle inspection can be divided into three categories: cross-sectional studies, experimental studies, and time series studies. Cross-sectional studies made comparisons between states. The variables and statistical methods used in the studies varied. A limited number of experimental studies observed the accident rate of vehicles over a specified period of time. The time series studies are a descriptive comparison of accident rates before and after the introduction of inspection programs. A few more recent studies provided a systematic analysis using time series data and a statistical approach which attempt to identify patterns in the data.
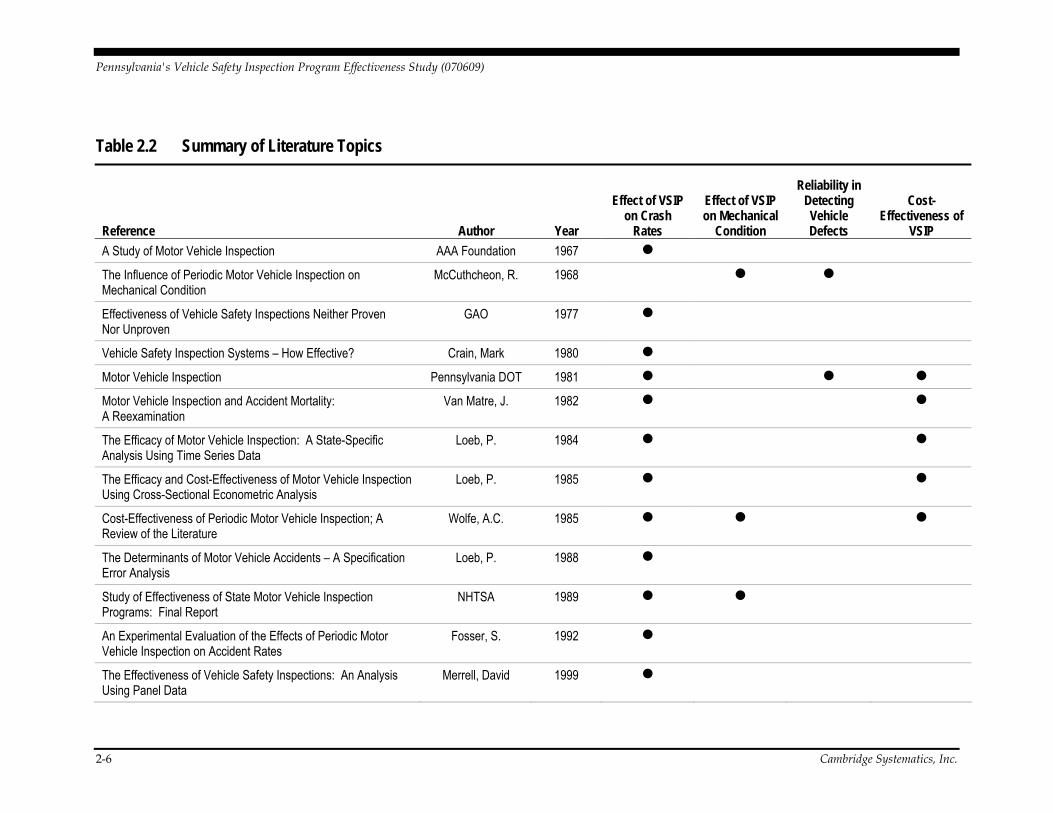
2.2 FINDINGS DRAWN FROM THE AVAILABLE LITERATURE Seventeen research studies provided relevant data bearing on the benefits, costs, and effectiveness of vehicle safety inspection programs. The studies were published from 1967 to 2008. The majority of the studies were published from 1981 to 2003. These studies were the focus of the literature because several of the
Pennsylvania's Vehicle Safety Inspection Program Effectiveness Study (070609)
2-4 Cambridge Systematics, Inc.
more recent studies conducted thorough reviews of the literature written in the 1960s. A bibliography for the studies is found as Appendix A of this report, and a summary of each study is found as Appendix B of this report. One of the reports is from the Commonwealth of Pennsylvania from 1981; subsequent to the publication of that study, the Commonwealth adjusted its inspection frequency from a semiannual inspection to an annual inspection.
Periodic vehicle safety inspection programs are strongly based on the premise that inspection improves highway safety. The safety benefits of inspection are assumed to include reduced fatalities, improved mechanical condition of vehi-cles, and a reduced number of crashes caused by the mechanical failure of a vehicle. This report examines the most relevant studies related to program effectiveness, explores the effect of such programs on crash rates, and evaluates the cost-effectiveness of such programs. Table 2.2 summarizes the research themes identified in each reference.
In Sections 3.0 and 4.0 of this report, we will summarize our analytical effort to analyze the effect of programs on crash rates and to consider the cost-effectiveness of the Pennsylvania program. We have added this report to Table 2.2 to identify the scope of the research in comparison to previous studies.
It is important to note that some of the studies have statistical or methodological problems. Inadequate sample size, sample bias, and variable bias are common problems. A variety of factors cause driving conditions to vary. These effects are often difficult to quantify. Many studies did not provide for state-specific effects and are vulnerable to omitted variables bias. AAA (1980), NHTSA (1989), and McCuthcheon (1968) required the voluntary participation of vehicles in an inspection. Therefore the sample is not truly random. The time series studies discussed in the Wolfe and O’Day (1985) literature review examined accident rates before and after the introduction of inspection programs. The analyses did not include factors other than inspection, and the sample size considered was very small. The North Carolina (2008) program study analyzed one year of inspection and crash data. The study did not account for other factors that affect crash rates. Using a single year of crash and inspection data also does not pro-vide an adequate look at crash and inspection trends over a period of time. The majority of the study results were based on previous research results.
The results of the studies reviewed varied widely. Though very few definitive conclusions can be made, the research efforts highlight several issues related to the relationship between programs and accident rates and mechanical condition. The studies also provide some information on the challenges with estimating the cost-benefit of programs.
Periodic Vehicle Safety Inspection Programs and Accident Rates The majority of the studies reviewed attempted to evaluate vehicle safety inspection program effectiveness in reducing fatal and/or injury accidents. These studies produced mixed results.
Pennsylvania's Vehicle Safety Inspection Program Effectiveness Study (070609)
Cambridge Systematics, Inc. 2-5
A number of studies concluded that inspection programs do not result in a sig-nificant reduction in crash rates. Crain (1980) used regression analysis on 1965 and 1974 state accident data. The study found no statistically significant rela-tionships between types of inspection programs and accident rates. The study did conclude that state program presence is significantly related positively to death rates compared to states without programs. AAA Foundation (1967) study concluded there was no factual proof that vehicle inspection is effective in reducing accident or death rates. NHTSA (1989) used FARS and state crash data to examine the effect of inspection on crash rates. No conclusive evidence was found that such programs are, or are not effective in reducing crashes. The 1981 VSIP study conducted by Pennsylvania’s Office of Budget and Administration concluded that accident rates in states with annual, semiannual, and no safety inspection programs were essentially equal. The Fosser (1992) study of vehicle inspection programs in Norway also concluded that there were no statistically significant differences in accident rates between the three groups in any of the study periods.
Several research efforts support the theory that inspections reduce accident rates. Loeb and Gilad (1984) conducted a time series analysis of New Jersey accidents from 1929 to 1979 which found an average annual reduction of 304 fatalities associated with the introduction of state programs in 1938. Van Matre’s (1982) multiple regression models concluded that inspections significantly reduce the fatality rate over states with no inspection program. The Missouri study also concluded that vehicle defects as a causation factor increased in relation to the age of the vehicle. Vehicles registered in states having inspection programs had proportionately fewer defects as a causative factor than vehicles in states not having such programs.
Given the variation in results and the wide range of fatality and accident reduc-tions estimated by the studies supporting inspections, no definitive conclusion can be made from the previous literature regarding the effectiveness of state vehicle safety inspection programs in reducing fatal and injury accidents.
Pennsylvania's Vehicle Safety Inspection Program Effectiveness Study (070609)
2-6 Cambridge Systematics, Inc.
Table 2.2 Summary of Literature Topics
Reference Author Year
Effect of VSIP on Crash
Rates
Effect of VSIP on Mechanical
Condition
Reliability in Detecting Vehicle Defects
Cost-Effectiveness of
VSIP A Study of Motor Vehicle Inspection AAA Foundation 1967
The Influence of Periodic Motor Vehicle Inspection on Mechanical Condition
McCuthcheon, R. 1968
Effectiveness of Vehicle Safety Inspections Neither Proven Nor Unproven
GAO 1977
Vehicle Safety Inspection Systems – How Effective? Crain, Mark 1980
Motor Vehicle Inspection Pennsylvania DOT 1981
Motor Vehicle Inspection and Accident Mortality: A Reexamination
Van Matre, J. 1982
The Efficacy of Motor Vehicle Inspection: A State-Specific Analysis Using Time Series Data
Loeb, P. 1984
The Efficacy and Cost-Effectiveness of Motor Vehicle Inspection Using Cross-Sectional Econometric Analysis
Loeb, P. 1985
Cost-Effectiveness of Periodic Motor Vehicle Inspection; A Review of the Literature
Wolfe, A.C. 1985
The Determinants of Motor Vehicle Accidents – A Specification Error Analysis
Loeb, P. 1988
Study of Effectiveness of State Motor Vehicle Inspection Programs: Final Report
NHTSA 1989
An Experimental Evaluation of the Effects of Periodic Motor Vehicle Inspection on Accident Rates
Fosser, S. 1992
The Effectiveness of Vehicle Safety Inspections: An Analysis Using Panel Data
Merrell, David 1999
Pennsylvania's Vehicle Safety Inspection Program Effectiveness Study (070609)
Cambridge Systematics, Inc. 2-7
Table 2.2 Summary of Literature Topics (continued)
Reference Author Year
Effect of VSIP on Crash
Rates
Effect of VSIP on Mechanical
Condition
Reliability in Detecting Vehicle Defects
Cost-Effectiveness of
VSIP Policy Ineffectiveness or Offsetting Behavior? An Analysis of Vehicle Safety Inspections
Poitras, M. 2002
Nationwide and Missouri Motor Vehicle Safety Inspection Program Fatal Crash Analysis
Motor Vehicle Inspection Div.
2003
Periodic Motor Vehicle Safety Inspections Fazzalaro, James 2007
Doubtful Return on the Public’s $141 Million Investment in Poorly Managed Vehicle Inspection Program
NC Program Evaluation Division
2008
Pennsylvania’s Vehicle Safety Inspection Program Pennsylvania DOT, Cambridge Systematics, Inc.
2009

Pennsylvania's Vehicle Safety Inspection Program Effectiveness Study (070609)
2-8 Cambridge Systematics, Inc.
Effects on Mechanical Defects Four studies examined the effect of periodic vehicle safety inspection programs on the mechanical defects of motor vehicles. McCutcheon provided the most in-depth look at the topic. The study concluded that mechanical condition improved as the frequency of inspections increase and vehicle populations sub-ject to inspection programs are in measurably better mechanical condition than vehicle populations not subject to inspection programs. Wolf and O’Day also concluded in their literature review that the presence of an inspection program leads to better-maintained vehicles than no inspection. However, it is important to note that some studies did not find better vehicle condition in some jurisdic-tions with a state program. Poitras and Sutter concluded that inspection had no significant impact on either old cars or the repair industry revenue.
The majority of studies examining the effect of inspection programs on the mechanical defects of vehicles concluded that inspection programs have a posi-tive effect on mechanical condition. Studies of inspected and uninspected vehicles found a positive correlation between vehicle condition and the presence of an inspection program.
Cost-Effectiveness Determining the cost-effectiveness of state vehicle safety inspection programs requires an accurate estimation of the reduction in vehicle-defect-related acci-dents. Another important point to consider is the variation of inspection cost from state to state. Four studies thoroughly investigated the cost-effectiveness of programs by using accident reduction percentages calculated in previous stud-ies. If the methodology used to estimate the reduction in vehicle-defect-related accidents was flawed, any cost-effectiveness study that uses the estimations is not reliable. Wolfe and O’Day reviewed literature prior to 1985 and found somewhat mixed results. A 1975 NHTSA study reported a 1:1 benefit/cost ratio assuming a 14 to 39 percent reduction in vehicle-defect-related accidents if the annual inspection costs were about $6.
Van Matre and Overstreet estimated cost per vehicle for both random inspection and annual inspection programs. The study concluded that preliminary esti-mates of cost-effectiveness suggest that random inspection is the preferable inspection system. Loeb studied the efficacy and cost-effectiveness of state programs using cross-sectional data. The study uses New Jersey data from 1981. The statistical results of the model used to estimate the efficacy of state programs was used to calculate a benefit/cost ratio. The results indicate that periodic inspection is cost-effective.
Overall, the research suggests that state programs are cost-effective. These results of course, rely heavily on the assumption of benefits and costs associated with inspection programs.
Pennsylvania's Vehicle Safety Inspection Program Effectiveness Study (070609)
Cambridge Systematics, Inc. 2-9
2.3 AGENCY INTERVIEWS The research methodology included a process to augment the literature findings through a set of interviews with representatives of agencies in states outside of Pennsylvania with current vehicle safety inspection programs. Four agencies were selected for interviews. The agencies were selected based on their responses to the survey collection instrument described in Section 3.0. The agencies were selected to provide of mix of geography, size, and program characteristics.
Before conducting the interviews, an interview guide was developed for internal use during the interview process. The goal of the interview guide was two-fold:
1. To ensure that topics of interest either from the literature review or from discussions with PennDOT staff were asked; and
2. To ensure that there was consistency in the interview process.
The interview guide was used as a starting point for each interview, but addi-tional topics were discussed as each interview progressed.
New York Department of Motor Vehicles The New York Passenger Vehicle Inspection Program dates back to 1957. The program’s stated purpose is to ensure that every vehicle registered in the State meets the minimum standards for safe operation on public streets and highways.
The decentralized program is run by privately operated inspection facilities. The funds collected for inspection go to several state agencies’ budgets. The safety inspection costs $10 ($2 goes to the State). In 2006, there were slightly less then 10 million inspections performed.
The interviewee stated that the agency uses the vehicle failure rate to evaluate program effectiveness. Typically two to three percent of vehicles do not pass the initial inspection. The failure rate is obtained from the output statements provided to the motorist at the time of the inspection. The statement provides the reasons the vehicle failed the inspection and the components of the vehicle that failed.
The interviewee stated that the agency conducts inspection station audits and covert inspections to ensure that inspection stations perform proper inspections. Audits are conducted at least once per year and in some parts of the State twice each year. Covert inspections are conducted at least once each year at each station.
Vermont Department of Motor Vehicles The Vermont Passenger Vehicle Inspection Program was initiated in the 1930s. Highway safety is the stated purpose of the program. The inspections are designed to ensure that vehicles are operating in safe condition.

Pennsylvania's Vehicle Safety Inspection Program Effectiveness Study (070609)
2-10 Cambridge Systematics, Inc.
Approximately 650,000 inspections are performed each year by private garages and gas stations. The typical cost for an inspection ranges from $25 to $45, with $3 of the inspection cost going to the agency.
The department performs routine overt site visits as well as covert inspections with undercover vehicles to ensure that inspection stations are operating prop-erly. Law enforcement agencies also host roadside checkpoints where safety inspections are performed. If a vehicle defect is found on a vehicle with a recent inspection sticker, the garage is notified.
Missouri State Highway Patrol The Missouri Passenger Motor Vehicle Inspection Program, in existence since 1968, requires vehicle owners to have their vehicles inspected every two years. The program is reviewed each year in a public annual report, an example of which is reviewed in Appendix B.
Approximately three million inspections are performed annually. Inspections cost $12, of which $1.50 is returned to the State. Most inspections are performed by private garages, while government-operated facilities inspect government vehicles.
Fees from the inspection program fully supports the program’s administrative and operational expenses. The average cost of repairs was $72.29 in 2007. The department estimates the average cost of repairs by information recorded on a random sample of the electronically stored inspection reports.
The department has set up several mechanisms to evaluate the inspection pro-gram. The annual report shows inspection rejection rates, total number of vehi-cles inspected, number of school bus inspections, and number of salvage vehicle examinations used to evaluate the condition of previously salvaged vehicles that have been rebuilt. If the inspection is passed, the vehicle receives the prior salvage title. Rejection rates are estimated based on a random sampling of electronic inspection reports. No significant changes have been made to the program as a result of the performance evaluations.
Ohio Department of Public Safety The Ohio inspection program administers vehicle inspections at random pull-in inspection stations or during law enforcement stops. The State has 23 vehicle inspection teams. The agency inspected more than 100,000 vehicles in 2007. When a vehicle inspection operation is set up, officers use a standard inspection list to guide the inspection process.
Vehicles passing inspection are given a rear window decal that exempts the vehi-cle from inspection for one year. If vehicle defects are found during inspection, the inspecting officer decides if the vehicle must be reinspected. The department also sets up locations for voluntary passenger vehicle inspections.
Pennsylvania's Vehicle Safety Inspection Program Effectiveness Study (070609)
Cambridge Systematics, Inc. 2-11
Motorists are not charged a fee for their vehicle inspection. The State assumes the costs of inspections. The agency does not use performance measures to evaluate the inspection program.
Findings The case studies provide an intriguing look into the operations of four states with inspection programs. Some of the trends include:
• Officials in all four states asserted that they believed that the program is beneficial, but none of the states appear to directly track how the program affects crashes, injuries, and fatalities.
• When measured, customer satisfaction is high, and the number of failed inspections is low. Measurement methodologies, however, differ among states.
• The states with mandatory inspections have programs lasting at least 40 years.
• Anecdotal evidence suggests that motorists save money in the long run, due to improved mechanical condition and lower insurance costs; but there does not appear to be rigorous publicly available data to support these claims.
• The states with independent inspectors have programs for training and for testing the quality of the inspections.
The findings are consistent with the general themes encountered to date in the literature and in the history of how states add or remove periodic vehicle safety inspection programs. The measurements are either qualitative or based on proxies for vehicle safety such as consumer attitudes and inspection rejection rates. In the absence of conclusively negative analysis, the programs remain largely unchanged over time, with incremental refinements.


Pennsylvania's Vehicle Safety Inspection Program Effectiveness Study (070609)
Cambridge Systematics, Inc. 3-1
3.0 Data Acquisition
In this section we will summarize the process used to collect information suitable for a quantitative analysis of Pennsylvania’s periodic vehicle safety inspection program.
3.1 DATA COLLECTION OBJECTIVES The goal of the data collection process was to gather the necessary information to support a range of descriptive and hypothesis-based analyses to be conducted during the project. The objective of the project team was to collect the following information for all states and the District of Columbia:
• Crash volume information, such as reported crashes by year, with subtotals when available for crashes with an associated factor typically covered by a periodic motor vehicle safety inspection.
• Safety Inspection Program Information, including but not limited to:
– Each jurisdiction’s program over time regarding safety inspections (i.e., does jurisdiction require safety inspection; scope of inspection, if required);
– Year(s) when the program was implemented/changed; and
– Attributes of the program (e.g., were inspections performed by state offi-cials or by private contractors).
• Demographic and Network Information for control purposes, such as:
– Number of licensed drivers;
– Number of registered vehicles;
– Classification of geography and congestion (highly urban, highly rural, etc.); and
– An estimate of vehicle-miles driven by registered passenger vehicles each year.
• Additional detail about enforcement and compliance actions surrounding vehicle safety inspections, including:
– The number of inspections performed;
– The estimated cost of the inspections; and
– The number of citations and/or infractions identified both through the inspections and in routine roadside enforcement activities.
Pennsylvania's Vehicle Safety Inspection Program Effectiveness Study (070609)
3-2 Cambridge Systematics, Inc.
3.2 DATA SOURCES AND COMPILATION The research team obtained data for the subsequent analysis using three approaches:
1. Collection of available information from national (and preferably official Federal) data sources;
2. A survey instrument distributed to 66 states, jurisdictions, and Canadian provinces, with questions both about state-level vehicle safety defects as well as about characteristics of existing vehicle safety inspection programs; and
3. Additional research about characteristics of existing vehicle safety inspection programs through a mix of on-line research and telephone calls to state agencies.
The results of the data collection were compiled into a single set of data for each state, and when appropriate, for each county. Appendix C describes the final data dictionary used for the research analysis.
3.3 SURVEY DESIGN AND EXECUTION Survey Design The overall data collection effort began by building a draft data dictionary of required, conditional, and optional information based on the experimental design required for the analysis, and augmented by insights gained during the literature review process. The draft data dictionary included attributes of dependent variables such as crashes, as well as independent variables such as potential differentiating program characteristics and normalizing factors such as exposure variables.
The draft dictionary was then compared to on-line data sources. A number of items were identified from Federal sources as previously described. The major-ity of these items were removed from the survey design, as they could be obtained easily on-line, while a small number of items were included to determine the precision and accuracy of the survey results.
The remaining draft data dictionary was then repackaged as a draft survey design. The survey design had three parts:
1. State identification and contact information;
2. Information regarding vehicle safety defects and related crashes; and
3. Vehicle safety inspection program characteristics.
Representatives from states with current or recently ended vehicle safety inspec-tion programs would fill out the entire survey, while representatives from states with no vehicle safety inspection program would only fill out the first two sec-tions. The draft survey then entered a review cycle with the PennDOT technical staff. During the review cycle, a number of draft questions were removed as being difficult to either capture or interpret.
Pennsylvania's Vehicle Safety Inspection Program Effectiveness Study (070609)
Cambridge Systematics, Inc. 3-3
The final set of survey questions are found as Appendix D.
Survey Distribution The survey was created as a Microsoft Excel spreadsheet. PennDOT technical staff and CS’ project manager obtained relevant contact information and e-mail addresses. E-mail addresses were identified for 42 states, Puerto Rico, American Samoa, and all Canadian provinces and territories. E-mail was distributed by the PennDOT technical lead, with an introductory message and instructions. For the remaining seven states and the District of Columbia, a paper version of the sur-vey was generated and distributed via postal mail.
Survey Response The response rate was 20 surveys out of 66 distributed, or 30 percent. The response rate did not differ substantially between the e-mail and paper surveys. The response rate was slightly higher for states with safety inspection programs, but still under 50 percent.
Response quality was variable, as in many states the information requested in the survey was tracked by different groups within the state. While the questions were designed to cover a reasonable set of scenarios within the states, not all states had answers that exactly fit the survey instrument. In most cases, the respondents provided sufficient free-form information that representations of their answer can be included in the data set to illustrate their intent.
Additional On-Line and Telephone Research To supplement survey responses, additional research was conducted for states with known periodic motor vehicle safety inspection programs where a survey was not returned. This research was primarily conducted using the Internet (with a limited amount of telephone calls) and specifically covered only the 11 most critical questions about inspection program characteristics. This allowed sufficient additional data to be collected to enable the project team to add to the pool of information about independent program variables.
3.4 NATIONAL DATA SOURCES The primary analysis question deals with identifying the effectiveness of a vehi-cle safety inspection program in mitigating fatal crashes. A more detailed description of the analysis problem follows in Section 4.0. In order to single out the effects of a vehicle safety inspection program, a variety of factors that may explain the occurrence of vehicle crashes were included as controlling factors in the study.
Pennsylvania's Vehicle Safety Inspection Program Effectiveness Study (070609)
3-4 Cambridge Systematics, Inc.
The Fatality Analysis Reporting System (FARS) is the primary data source for the research. The crash data collected from this source serve as main analysis vari-ables. Controlling factors are obtained from a variety of sources. Various data sources and key variables used for the analysis are described in the following subsections. Key variables used in the analysis also are described.
Fatality Analysis Reporting System FARS is a Federal data set that provides information for every fatal crash that occurs in the United States. Crash data are provided by every state as a compi-lation of at-scene crash reports prepared by law enforcement agents.
Data are summarized yearly and available for download from the National Highway Transportation Safety Administration (NHTSA) web site. Fatal crash data for every year since 1975 have been compiled and are ready for use.
The yearly FARS data is made available in the form of three relational databases. A description of these databases and the key variables used in the study is presented below.
• Accident File. This file provides a detailed description of the crash. Vari-ables such as date and time of crash, crash location and roadway characteris-tics, existing weather conditions, primary cause of crash, and total fatalities in the crash are all available in this file.
• Person File. This database provides information regarding all individuals involved in the crash. Demographic descriptions of all drivers (age, sex, height, prior crash records, licensed state) involved in the crash also are provided.
• Vehicle File. Information regarding vehicles involved in the crash are provided in this file. Distinguishing characteristics of vehicles such age, type, make, and model are provided. Further, the role of the vehicle in the crash- cause of crash (striking) versus struck, also is described. Crashes caused due to a vehicle-failure also may be obtained using variables from this database.
For this study, FARS data for the four years between 2004 and 2007 was analyzed. An extended timeframe was used to reduce the likelihood of outlier data for a particular year/state combination affecting the subsequent analysis. Extending this timeframe to include previous years was not possible owing to the following reasons:
• There were some data definition changes to key variables in 2004 which reduced data compatibility across years; and
• Changes in supporting land use conditions such as population and employ-ment are likely to differ significantly for a longer duration of analysis.
FARS data was summarized at the county as well as state levels to correspond with the analysis methodology.
Pennsylvania's Vehicle Safety Inspection Program Effectiveness Study (070609)
Cambridge Systematics, Inc. 3-5
Methodological Assignment of Crashes to State and County In Section 4.0, we will review the results of both state-level and county-level models for assessing the effectiveness of a vehicle safety inspection program. It was necessary to identify to which state and county a particular crash should be assigned. Given that drivers in some crashes traveled away from their home areas, the issue became how to properly assign crashes to model the hypothesized program benefits if an in-state and out-of-state vehicle were involved in a fatal crash.
Crashes were assigned to a state based on the registration plates of the striking vehicle in the crash, as opposed to the location of the crash. Our rationale for this assignment is that vehicles may or may not undergo vehicle inspection based on their registration state, and not on the location of the crash. Therefore, to evalu-ate the effectiveness of the program, it was necessary to assign crashes to a state based on the vehicle registration state.
For example, if a vehicle registered in the State of Pennsylvania was involved in a fatal crash in Florida, the crash was assigned to Pennsylvania and not Florida. It was found that fewer than 15 percent of crashes involved out-of-state vehicles. We selected the striking vehicle to minimize the potential differences between one-vehicle and multiple-vehicle crashes, since every crash had a striking vehicle.
Crashes were assigned to a county based on the location of the crash due to the following reasons:
• County-level vehicle registration does not exist in the FARS database. As a result, maintaining the same classification scheme as the state level is not possible.
• Most of the crashes involve vehicles from the state to which the county belongs (over 85 percent). Hence, the county location may be used as a sur-rogate for purposes of vehicle inspection.
• Crashes at a county level are indicative of the network activity in the region. Assigning crashes based on county location provides an accurate means to represent the data.
Methodological Assignment of Crashes as Vehicle-Failure-Related In the FARS dataset, there exist a pair of variables that indicate that the reviewer identified a vehicle failure in one or more vehicles involved in the fatal crash. Vehicle failure is defined as the failure of any one or more of the following parts:
• Tires;
• Brake or steering system;
• Suspension, power train, or exhaust system;
• Headlights, signal lights, or other lights;

Pennsylvania's Vehicle Safety Inspection Program Effectiveness Study (070609)
3-6 Cambridge Systematics, Inc.
• Horn, mirrors, or wipers;
• Driver seating, safety belts, or air bags;
• Body, doors, hood, trailer hitch, or wheels; and
• Any other vehicle defects.
If the data indicated the failure of one or more parts in the striking vehicle, such a crash was classified as a vehicle-failure-related crash.
Control Variables Other data that served as control variables for the analysis were obtained from a variety of sources and served as supplementary data for the analysis. A more detailed description of the items used from each data source is found in Appendix C, while Section 4.0 describes how each of these data sources is used in the analysis.
Federal Highway Administration The Federal Highway Administration (FHWA) keeps track of various activity measures such as vehicle-miles traveled, number of registered vehicles and driv-ers, and level of service variables such as pavement quality. These variables were analyzed for the state-level analysis models.
U.S. Census The Census data was used for developing sociodemographic data at county and state levels. Data such as population, employment, average household income, and highest education level were compiled for use in analysis.
National Oceanic and Atmospheric Administration The National Oceanic and Atmospheric Administration (NOAA) publishes cli-mate data for various locations across the United States. Using NOAA data, average temperature and precipitation was obtained for 283 cities.
Applying various Geographical Information Systems (GIS) tools, this data was expanded to incorporate all the counties in the United States. Counties with the same color code were assigned the same weather conditions. Further, they were assigned the attributes of the cities closest to them. Data was used both from cities within Pennsylvania, as well as cities such as Wilmington and Youngstown. Appendix E describes the aggregation process in detail.
Pennsylvania's Vehicle Safety Inspection Program Effectiveness Study (070609)
Cambridge Systematics, Inc. 3-7
Fatality Valuation Information The U.S. Department of Transportation publishes 0
1 an official estimate of the value of a statistical life to be used in all of its analyses. We have used the latest published value, $5.8 Million, in the analysis in Section 4.0. Given the multiple years in the study data, we have not attempted to adjust this value.
Insurance Institute for Highway Safety The Insurance Institute for Highway Safety (IIHS) is an independent, nonprofit, scientific, and educational organization dedicated to reducing the losses – deaths, injuries, and property damage – from crashes on the nation’s highways. 1
2
IIHS ranks states based on the levels of enforcement of various safety laws in the states. The categories of laws were ranked based on a four-tier system (good, fair, marginal, and poor) although in some categories less tiers were defined. The enforcement levels of the following laws were included in the analysis to distinguish between states:
• Young driver laws;
• Driving under the influence (DUI) laws;
• Red light camera laws;
• Safety belt laws; and
• Child safety seat laws.
1 Obtained from the web site http://ostpxweb.dot.gov/policy/reports/080205.htm. 2 Obtained from the web site http://www.iihs.org/.

Pennsylvania's Vehicle Safety Inspection Program Effectiveness Study (070609)
Cambridge Systematics, Inc. 4-1
4.0 Quantitative Analysis
The quantitative analysis tasks were geared towards uncovering systematic dif-ferences in crash rates between states with vehicle safety inspection programs and those without. While studying the effectiveness of such programs, the analysis controlled for the effects of other variables that also could impact crash rates. A critical step in the analysis, therefore, was to identify these control vari-ables and to obtain corresponding data from the sources described already in Section 3.0. Another key component of the methodology was to identify an analysis technique that is simple yet powerful in capturing the effects of a num-ber of variables at the same time. Once such a methodology was identified, the analysis results were tabulated and interpreted to identify implications for policy and decision-making.
4.1 ANALYSIS METHODOLOGY Step 1: Formulation of General Hypotheses Figure 4.1 illustrates the step-by-step methodology followed during the study. The first step was to formulate a hypothesis about the effectiveness of the vehicle safety inspection programs, keeping in mind that the hypothesis must be testable using the data at hand. The formulation process started with a rather general and qualitative statement about the vehicle safety inspection programs, namely:
The next issue is how to quantify what “safer” means and to restate the hypothesis. For example, one possible metric for safety was the number of total crashes, including fatal, injury, and property damage incidents. A nationwide data source of all crashes is unavailable, however. Instead, we defined “safer” to be reflective of the incidence of the most severe type of crashes, namely, fatal crashes.
“States with Vehicle Safety Inspection Programs are safer than states without them.”
Pennsylvania's Vehicle Safety Inspection Program Effectiveness Study (070609)
4-2 Cambridge Systematics, Inc.
Figure 4.1 Research Methodology for Quantitative Analysis
Identify Data Sources
Formulate Research Hypothesis
Obtain Crash DataObtain VSIP
Characteristics from Each State
Identify Control Variables
Obtain Supplementary Data Sources
Control Variables Crash Data VSIP Data
Assemble Data
Test Hypothesis Using Multiple
Linear Regression
Summarize and Interpret Findings
Using the number of fatal crashes as a measure of safety, the qualitative hypothe-sis can be reworded as follows:
We also can create a variant of this hypothesis:
“States with Vehicle Safety Inspection Programs have fewer vehicle-failure-related fatal crashes than states without them,
everything else being equal.”
“States with Vehicle Safety Inspection Programs have fewer fatal crashes than states without them,
everything else being equal.”
Pennsylvania's Vehicle Safety Inspection Program Effectiveness Study (070609)
Cambridge Systematics, Inc. 4-3
Again, we must consider how to qualify the phrases in italics. We assert the following clarifying assumptions:
• We will rely on the first responders at the scene of each fatal crash to identify whether the crash may have related to a vehicle failure, based on their coding of the crash record as transmitted to FARS; and
• We will utilize the national data sources from Section 3.4 (and detailed in Appendix C) to control for “everything else being equal.”
Given these assumptions, we now have a defined set of hypotheses suitable for analysis.
As part of “everything else being equal,” it must be noted that the vehicle inspection programs themselves vary in their implementation from state to state. It is therefore possible to test the relative safety performance of states with differ-ent program characteristics. One such example is the safety performance of states with compulsory annual inspection programs with the performance of states that require less regular inspections. The corresponding hypothesis would be as follows:
Finally, it is often useful to segment the information available into smaller data sets based on one or more control variables. An example of this approach might be to consider the population of a state, and exploring whether the models changes depending on the size of the state. This type of model would be represented by the following type of hypothesis:
Step 2: Data Compilation The second step in the study was to obtain data from multiple sources to enable detailed hypothesis testing. The data compilation process has been previously summarized in Section 3.0 of this report.
“States with annual Vehicle Safety Inspection Programs have fewer (vehicle-related) fatal crashes for a particular segment
than states with Inspections at a lesser frequency have for that segment, everything else being equal.”
“States with annual Vehicle Safety Inspection Programs have fewer (vehicle-related) fatal crashes than states with
Inspections at a lesser frequency, everything else being equal.”
Pennsylvania's Vehicle Safety Inspection Program Effectiveness Study (070609)
4-4 Cambridge Systematics, Inc.
Step 3: Data Assembly The third step in the analysis process was data assembly. Given that there were multiple data sources with varying levels of detail, it was essential to bring all the data to a common level of geographic resolution.
• The vehicle safety inspection program variables (when a program exists) apply at the state level;
• The control variables were available at the state and county level; but
• The FARS data on the other hand were available at the person or vehicle-level.
Therefore, these data were summarized to both the state and county levels to enable analysis at both of these levels. The inspection program characteristics were, by design, available at the state level. A single database consisting of all the three sets of data was then created and prepared for analysis.
Step 4: Technique Identification The fourth step in the analysis methodology was to identify an analytical tech-nique that could uncover relationships between crash rates and program char-acteristics while controlling for other variables. The multiple linear regression technique was identified as being the most appropriate for the current study. In the multiple linear regression procedure, a variable of interest is expressed as a simple linear combination of a set of explanatory variables, in a formula such as:
The linear regression procedure estimates values for a, b, c, etc. The linear regression procedure clearly identifies variables that are less explanatory than the others and also quantifies the impact of each variable on the variable of inter-est, by calculating the probability that each coefficient is actually zero.
Therefore, for this study, the number of fatal crashes was expressed as a linear combination of control variables as well as the program characteristics. Applied to our hypotheses, the output of the linear regression procedure provides two very important results:
1. Whether or not the presence of a vehicle safety inspection program reduced the number of fatal crashes; and
2. The level of reduction in fatal crashes if a state without a current program were to institute a program.
Reviewing and interpreting the results of the linear regression constitute the final step in the analysis methodology. This step also will yield the policy implica-tions of the analysis and will inform decision-making.
Interest = a + b*Explanatory1 + c*Explanatory2 + d* ….
Pennsylvania's Vehicle Safety Inspection Program Effectiveness Study (070609)
Cambridge Systematics, Inc. 4-5
Step 5: Model Development In the final step, we build specific instances of models based on the above hypotheses. These instances build both a variety of specifications for the dependent variable (fatal crashes) as well as utilize multiple sets of potential explanatory variables.
4.2 ANALYSIS RESULTS A wide variety of combinations of controlling variables, in addition to the pro-gram characteristics, were tested at two geographic levels – county and state-wide. During the course of the modeling process, different combinations of variables described in Section 3.2 were included in the models and evaluated based on their statistical performance as well as logical reasoning. The models indicate that the existence of a vehicle safety inspection program lowers fatal crashes in a state significantly. In the absence of a program, depending on the type of model used, total fatal crashes in Pennsylvania could be expected to increase between 127 and 169 per year.
This section presents the results from the most significant models. A full roster of models tested during the analysis, as well as some additional descriptive sta-tistics, is available as reference in Appendix F.
The rest of the section is divided as follows:
• Descriptive results from analyzing the FARS database are discussed first;
• The results from the statewide models are then presented;
• The results from the county-level models are presented; and
• Finally, we present results of one of the more interesting segmentations of the data, vehicle age.
Descriptive Analysis of FARS Data The average of fatal crashes for the years 2004 to 2007 was used in the analysis. A tabulation of the data at a state level by the research team provided the following summary results.
• There were an average total of over 35,000 fatal crashes in the United States:
– On average, there were 1.1 fatalities per fatal crash.
• Vehicle-failure-related crashes were approximately two percent of all fatal crashes (700 out of 35,000);
• California and Florida had the highest number of total fatal crashes;
• Vermont and the District of Columbia had the fewest crashes in the country. The District of Columbia reported no vehicle-failure-related crashes in the four year period between 2004 and 2007; and
Pennsylvania's Vehicle Safety Inspection Program Effectiveness Study (070609)
4-6 Cambridge Systematics, Inc.
• Vehicles registered in states with a vehicle safety inspection program were involved in:
– 12,627 fatal crashes, which corresponds to 36 percent of all fatal crashes in the country; and
– 221 vehicle-failure-related crashes, which corresponds to 32 percent of all fatal crashes in the country.
According to FARS, vehicles with Pennsylvania registration were involved in 1,379 fatal crashes and 46 vehicle-failure-related crashes.
Controlling for Exposure It is not coincidental that California and Florida have the most fatal crashes while Vermont and the District of Columbia have the lowest. The former two states exhibit high employment, population, and vehicle-miles traveled (activity variables). To account for this high correlation between activity variables and fatal crashes, we studied a variety of potential exposure rates to account for activity.
The most appropriate exposure approach identified was to represent fatal crashes per billion vehicle miles traveled (VMT). Table 4.1 provides a summary of crash rates per billion VMT, segmented by states with and without programs.
Table 4.1 Fatal Crashes per Billion VMT 2004 to 2007 Average
Group of States Weighted Evenly Weighted by State VMT Without a Program 12.6 12.0 With a Program 11.1 11.1 Pennsylvania 12.7 12.7
Source: Fatality Analysis Reporting System 2004 to 2007 data, stratified by state inspection program presence.
Quality of “Vehicle Failure” Field in FARS When controlling for exposure, the behavior of the field within FARS where vehicles involved in crashes have a vehicle failure identified is counterintuitive. Specifically, many states with programs, including Pennsylvania, tended to have higher amounts of reported vehicle failure, albeit in a greatly reduced number of observations compared to all crashes. From a total of less than 700 reported fail-ures, over one half of the failures reported were tire failure.
It is apparent that Pennsylvania has a disproportionate amount of such reported crashes. Because this field, however, is reported by first responders, and the first responders are state-specific, we cannot be certain that this variable is uniformly applied in every jurisdiction. For example, it may be possible that a combination of factors in states, such as enforcement protocols, awareness of the importance
Pennsylvania's Vehicle Safety Inspection Program Effectiveness Study (070609)
Cambridge Systematics, Inc. 4-7
of vehicle inspections, combined with variability among the responders, generates a variety of approaches for considering the relevant choices on the crash report form. The combination of the sample size and the potential lack of uniformity of specification cause a confounding effect in the ability to properly utilize this variable in the analysis.
As a result of this confounding effect, the majority of the statistical models presented below are based on all fatal crashes. A corresponding but smaller set of models were developed for the “vehicle-failure-related” crashes. These mod-els, however, were never statistically significant. We assert that these character-istics explain some of the variance in the literature found in Section 2.0.
Even though there are 19 possible choices for the vehicle failure field, over 50 percent of identified failures were for tire failure. We attempted to model tire failure, but the relatively small number of relevant records made development of a detailed and significant model impossible.
Statewide Models Two general sets of statewide models were developed as part of the analysis. The first set modeled total fatal crashes, while a second set modeled crashes as a rate statistic (crashes per billion vehicle miles traveled).
Each set of models was developed over time as a series of refinements. In each refined model, variables were added, subtracted, or recast in a structured man-ner, and model results noted.
The final model from each set is presented below. Additionally, Appendix F provides details of additional models attempted within each set.
Statewide Crash-Rate Model Table 4.2 presents model results obtained by modeling fatal crashes per billion vehicle miles traveled at a statewide level. Population (in millions) and the exis-tence of a vehicle safety inspection program were the only variables that proved to be statistically significant (at an 80 percent level). All other variables considered have been omitted from the final model.
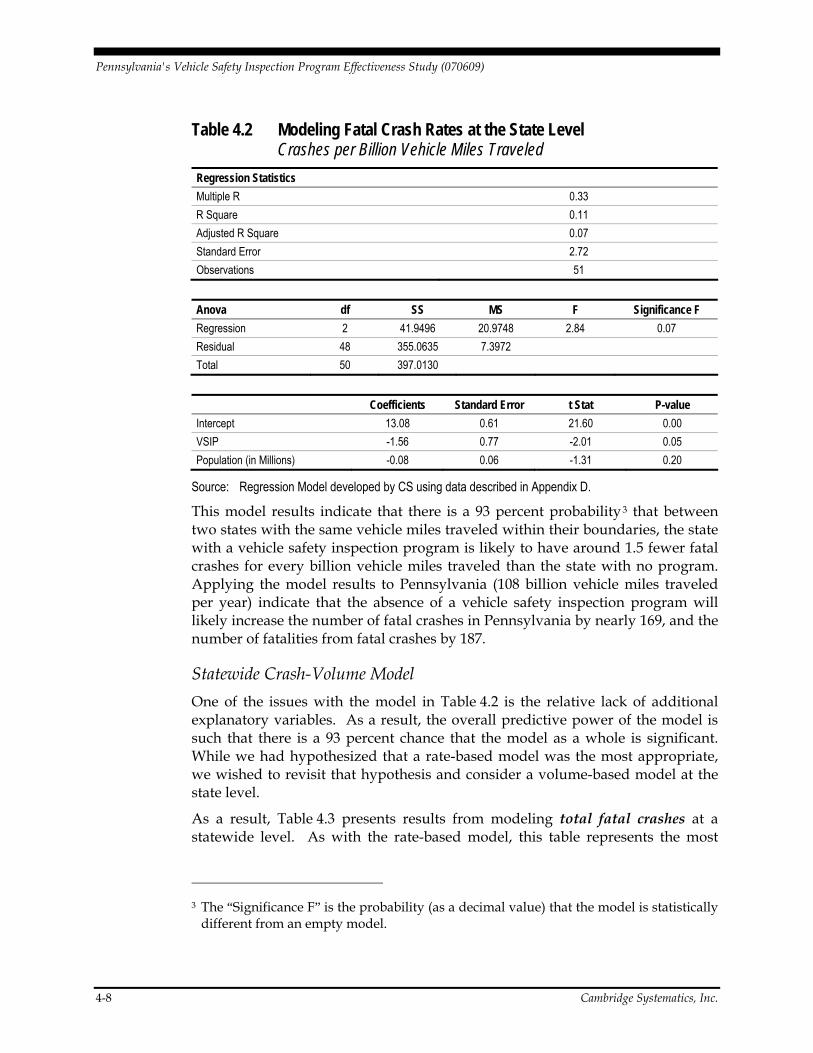
Pennsylvania's Vehicle Safety Inspection Program Effectiveness Study (070609)
4-8 Cambridge Systematics, Inc.
Table 4.2 Modeling Fatal Crash Rates at the State Level Crashes per Billion Vehicle Miles Traveled
Regression Statistics Multiple R 0.33 R Square 0.11 Adjusted R Square 0.07 Standard Error 2.72 Observations 51
Anova df SS MS F Significance F Regression 2 41.9496 20.9748 2.84 0.07 Residual 48 355.0635 7.3972 Total 50 397.0130
Coefficients Standard Error t Stat P-value
Intercept 13.08 0.61 21.60 0.00 VSIP -1.56 0.77 -2.01 0.05 Population (in Millions) -0.08 0.06 -1.31 0.20
Source: Regression Model developed by CS using data described in Appendix D.
This model results indicate that there is a 93 percent probability 2
3 that between two states with the same vehicle miles traveled within their boundaries, the state with a vehicle safety inspection program is likely to have around 1.5 fewer fatal crashes for every billion vehicle miles traveled than the state with no program. Applying the model results to Pennsylvania (108 billion vehicle miles traveled per year) indicate that the absence of a vehicle safety inspection program will likely increase the number of fatal crashes in Pennsylvania by nearly 169, and the number of fatalities from fatal crashes by 187.
Statewide Crash-Volume Model One of the issues with the model in Table 4.2 is the relative lack of additional explanatory variables. As a result, the overall predictive power of the model is such that there is a 93 percent chance that the model as a whole is significant. While we had hypothesized that a rate-based model was the most appropriate, we wished to revisit that hypothesis and consider a volume-based model at the state level.
As a result, Table 4.3 presents results from modeling total fatal crashes at a statewide level. As with the rate-based model, this table represents the most
3 The “Significance F” is the probability (as a decimal value) that the model is statistically
different from an empty model.
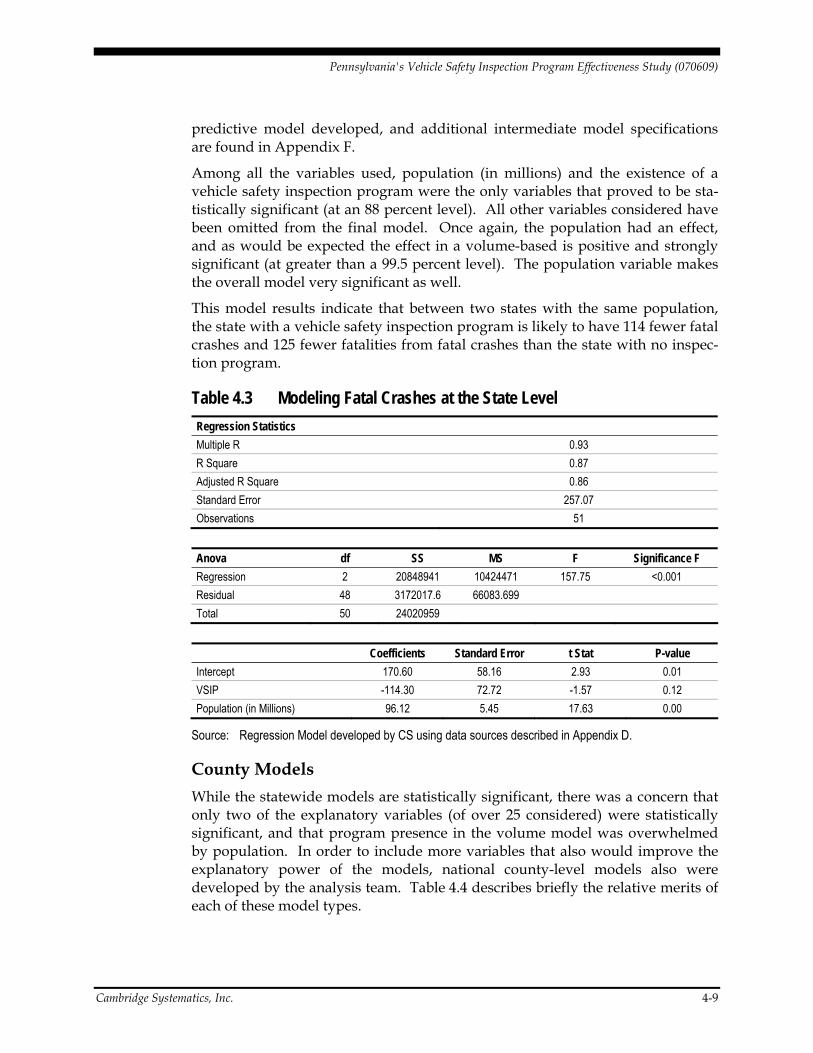
Pennsylvania's Vehicle Safety Inspection Program Effectiveness Study (070609)
Cambridge Systematics, Inc. 4-9
predictive model developed, and additional intermediate model specifications are found in Appendix F.
Among all the variables used, population (in millions) and the existence of a vehicle safety inspection program were the only variables that proved to be sta-tistically significant (at an 88 percent level). All other variables considered have been omitted from the final model. Once again, the population had an effect, and as would be expected the effect in a volume-based is positive and strongly significant (at greater than a 99.5 percent level). The population variable makes the overall model very significant as well.
This model results indicate that between two states with the same population, the state with a vehicle safety inspection program is likely to have 114 fewer fatal crashes and 125 fewer fatalities from fatal crashes than the state with no inspec-tion program.
Table 4.3 Modeling Fatal Crashes at the State Level Regression Statistics Multiple R 0.93 R Square 0.87 Adjusted R Square 0.86 Standard Error 257.07 Observations 51
Anova df SS MS F Significance F Regression 2 20848941 10424471 157.75 <0.001 Residual 48 3172017.6 66083.699 Total 50 24020959
Coefficients Standard Error t Stat P-value
Intercept 170.60 58.16 2.93 0.01 VSIP -114.30 72.72 -1.57 0.12 Population (in Millions) 96.12 5.45 17.63 0.00
Source: Regression Model developed by CS using data sources described in Appendix D.
County Models While the statewide models are statistically significant, there was a concern that only two of the explanatory variables (of over 25 considered) were statistically significant, and that program presence in the volume model was overwhelmed by population. In order to include more variables that also would improve the explanatory power of the models, national county-level models also were developed by the analysis team. Table 4.4 describes briefly the relative merits of each of these model types.
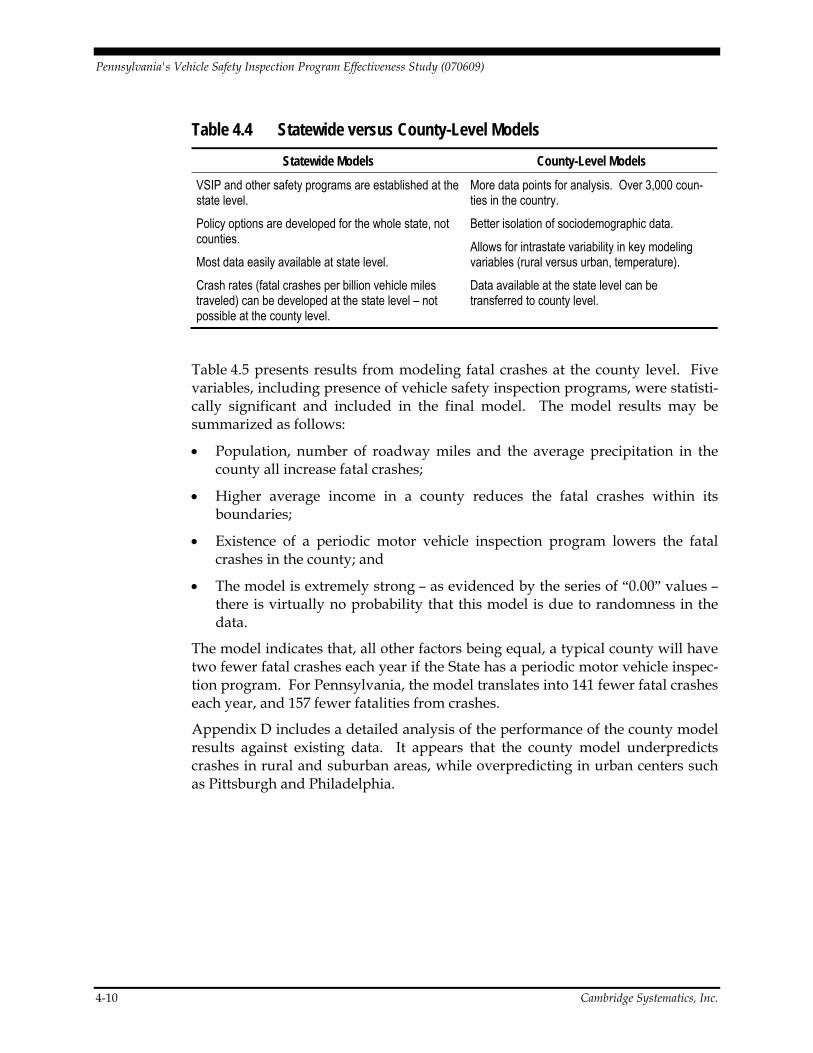
Pennsylvania's Vehicle Safety Inspection Program Effectiveness Study (070609)
4-10 Cambridge Systematics, Inc.
Table 4.4 Statewide versus County-Level Models Statewide Models County-Level Models
VSIP and other safety programs are established at the state level.
Policy options are developed for the whole state, not counties.
Most data easily available at state level.
Crash rates (fatal crashes per billion vehicle miles traveled) can be developed at the state level – not possible at the county level.
More data points for analysis. Over 3,000 coun-ties in the country.
Better isolation of sociodemographic data.
Allows for intrastate variability in key modeling variables (rural versus urban, temperature).
Data available at the state level can be transferred to county level.
Table 4.5 presents results from modeling fatal crashes at the county level. Five variables, including presence of vehicle safety inspection programs, were statisti-cally significant and included in the final model. The model results may be summarized as follows:
• Population, number of roadway miles and the average precipitation in the county all increase fatal crashes;
• Higher average income in a county reduces the fatal crashes within its boundaries;
• Existence of a periodic motor vehicle inspection program lowers the fatal crashes in the county; and
• The model is extremely strong – as evidenced by the series of “0.00” values – there is virtually no probability that this model is due to randomness in the data.
The model indicates that, all other factors being equal, a typical county will have two fewer fatal crashes each year if the State has a periodic motor vehicle inspec-tion program. For Pennsylvania, the model translates into 141 fewer fatal crashes each year, and 157 fewer fatalities from crashes.
Appendix D includes a detailed analysis of the performance of the county model results against existing data. It appears that the county model underpredicts crashes in rural and suburban areas, while overpredicting in urban centers such as Pittsburgh and Philadelphia.
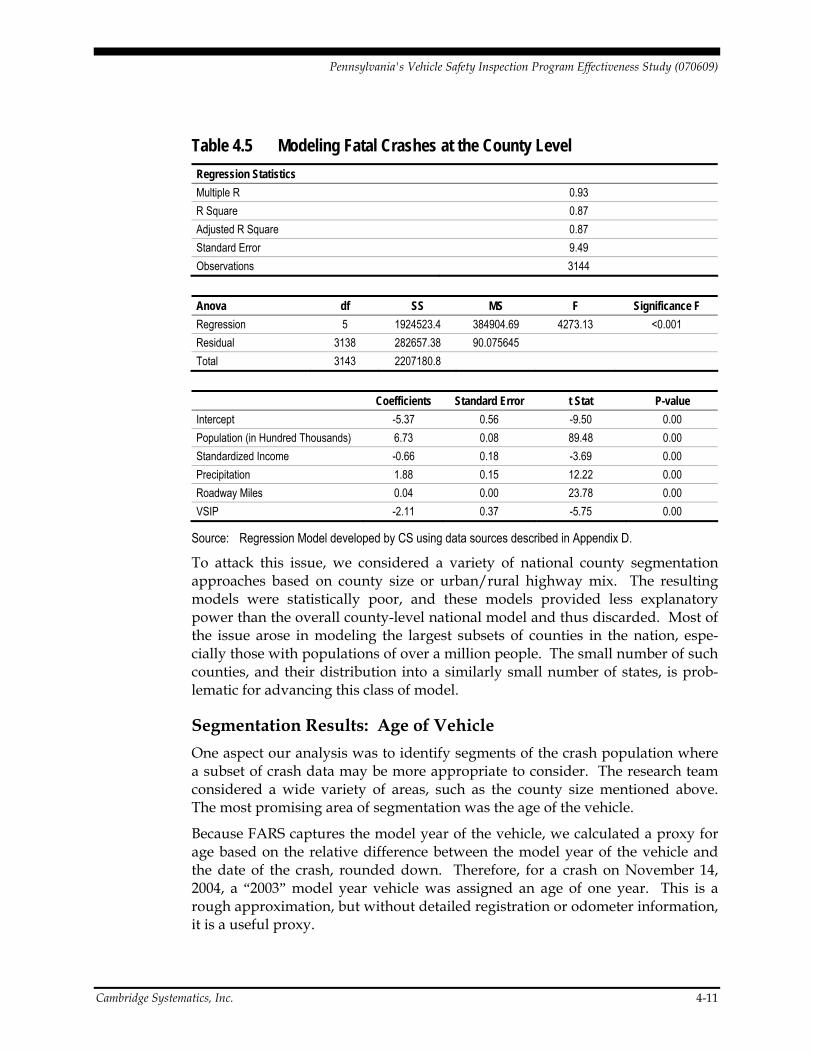
Pennsylvania's Vehicle Safety Inspection Program Effectiveness Study (070609)
Cambridge Systematics, Inc. 4-11
Table 4.5 Modeling Fatal Crashes at the County Level Regression Statistics Multiple R 0.93 R Square 0.87 Adjusted R Square 0.87 Standard Error 9.49 Observations 3144
Anova df SS MS F Significance F Regression 5 1924523.4 384904.69 4273.13 <0.001 Residual 3138 282657.38 90.075645 Total 3143 2207180.8
Coefficients Standard Error t Stat P-value
Intercept -5.37 0.56 -9.50 0.00 Population (in Hundred Thousands) 6.73 0.08 89.48 0.00 Standardized Income -0.66 0.18 -3.69 0.00 Precipitation 1.88 0.15 12.22 0.00 Roadway Miles 0.04 0.00 23.78 0.00 VSIP -2.11 0.37 -5.75 0.00
Source: Regression Model developed by CS using data sources described in Appendix D.
To attack this issue, we considered a variety of national county segmentation approaches based on county size or urban/rural highway mix. The resulting models were statistically poor, and these models provided less explanatory power than the overall county-level national model and thus discarded. Most of the issue arose in modeling the largest subsets of counties in the nation, espe-cially those with populations of over a million people. The small number of such counties, and their distribution into a similarly small number of states, is prob-lematic for advancing this class of model.
Segmentation Results: Age of Vehicle One aspect our analysis was to identify segments of the crash population where a subset of crash data may be more appropriate to consider. The research team considered a wide variety of areas, such as the county size mentioned above. The most promising area of segmentation was the age of the vehicle.
Because FARS captures the model year of the vehicle, we calculated a proxy for age based on the relative difference between the model year of the vehicle and the date of the crash, rounded down. Therefore, for a crash on November 14, 2004, a “2003” model year vehicle was assigned an age of one year. This is a rough approximation, but without detailed registration or odometer information, it is a useful proxy.
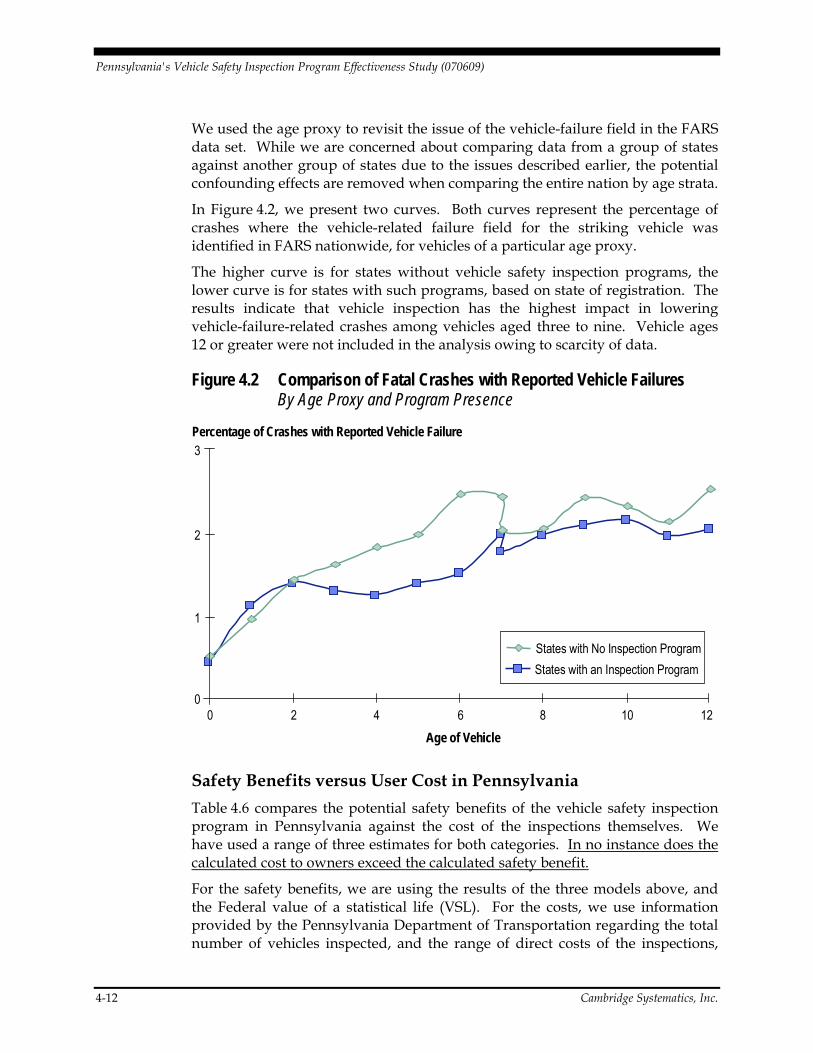
Pennsylvania's Vehicle Safety Inspection Program Effectiveness Study (070609)
4-12 Cambridge Systematics, Inc.
We used the age proxy to revisit the issue of the vehicle-failure field in the FARS data set. While we are concerned about comparing data from a group of states against another group of states due to the issues described earlier, the potential confounding effects are removed when comparing the entire nation by age strata.
In Figure 4.2, we present two curves. Both curves represent the percentage of crashes where the vehicle-related failure field for the striking vehicle was identified in FARS nationwide, for vehicles of a particular age proxy.
The higher curve is for states without vehicle safety inspection programs, the lower curve is for states with such programs, based on state of registration. The results indicate that vehicle inspection has the highest impact in lowering vehicle-failure-related crashes among vehicles aged three to nine. Vehicle ages 12 or greater were not included in the analysis owing to scarcity of data.
Figure 4.2 Comparison of Fatal Crashes with Reported Vehicle Failures By Age Proxy and Program Presence
States with No Inspection ProgramStates with an Inspection Program
Percentage of Crashes with Reported Vehicle Failure
0
1
2
3
Age of Vehicle0 2 4 6 8 10 12
Safety Benefits versus User Cost in Pennsylvania Table 4.6 compares the potential safety benefits of the vehicle safety inspection program in Pennsylvania against the cost of the inspections themselves. We have used a range of three estimates for both categories. In no instance does the calculated cost to owners exceed the calculated safety benefit.
For the safety benefits, we are using the results of the three models above, and the Federal value of a statistical life (VSL). For the costs, we use information provided by the Pennsylvania Department of Transportation regarding the total number of vehicles inspected, and the range of direct costs of the inspections,
Pennsylvania's Vehicle Safety Inspection Program Effectiveness Study (070609)
Cambridge Systematics, Inc. 4-13
from 2007. We do not account for any repairs performed, as those repairs bring the vehicle back up to a safe operating level.
To account for the inconvenience to the vehicle owner, we estimate that the aver-age inspection inconveniences the owner for one hour. We then divided the VSL savings figure by an expectation of hours of life remaining. Given an average life expectation of 75 to 80 years depending on gender, we have made the assump-tion that the average owner has 39 years of life remaining. Dividing the VSL savings figure by the number of remaining hours (39 * 365.25 * 24) and rounding to the closest dollar gives us an estimate of $17 worth of inconvenience to the typical owner. This value was both multiplied and divided by two to yield a high and low range.
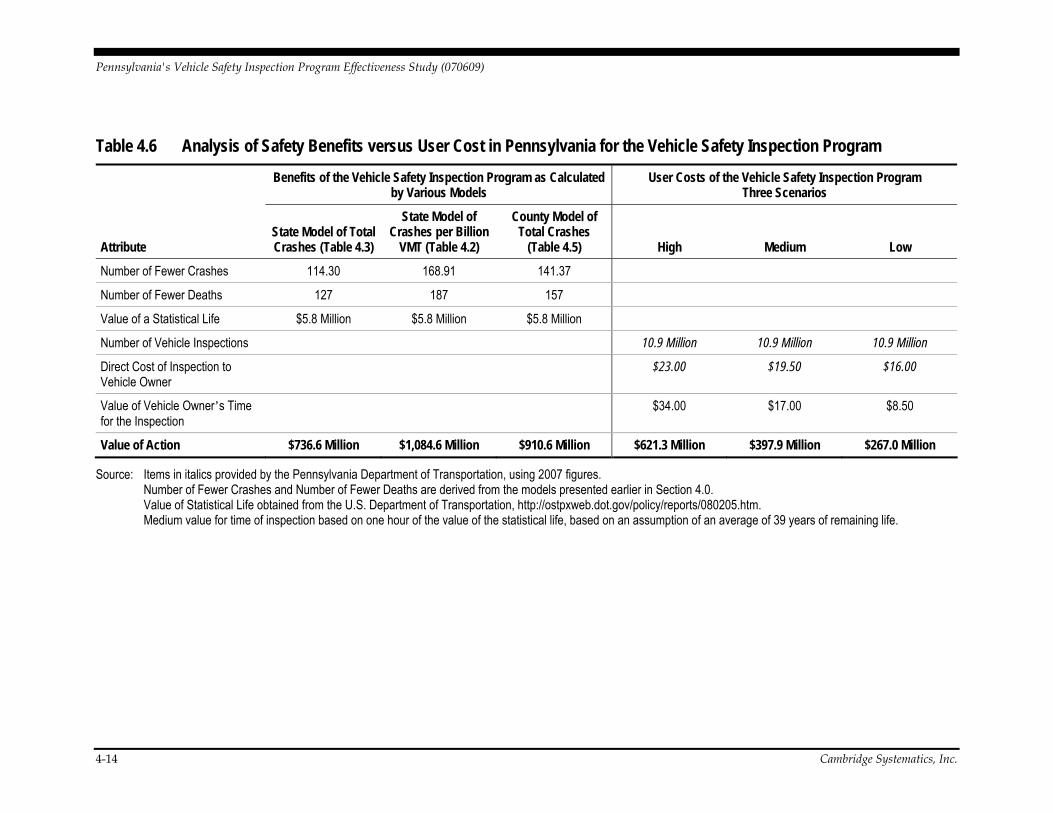
Pennsylvania's Vehicle Safety Inspection Program Effectiveness Study (070609)
4-14 Cambridge Systematics, Inc.
Table 4.6 Analysis of Safety Benefits versus User Cost in Pennsylvania for the Vehicle Safety Inspection Program
Benefits of the Vehicle Safety Inspection Program as Calculated
by Various Models User Costs of the Vehicle Safety Inspection Program
Three Scenarios
Attribute State Model of Total Crashes (Table 4.3)
State Model of Crashes per Billion
VMT (Table 4.2)
County Model of Total Crashes
(Table 4.5) High Medium Low
Number of Fewer Crashes 114.30 168.91 141.37
Number of Fewer Deaths 127 187 157
Value of a Statistical Life $5.8 Million $5.8 Million $5.8 Million
Number of Vehicle Inspections 10.9 Million 10.9 Million 10.9 Million
Direct Cost of Inspection to Vehicle Owner
$23.00 $19.50 $16.00
Value of Vehicle Owner’s Time for the Inspection
$34.00 $17.00 $8.50
Value of Action $736.6 Million $1,084.6 Million $910.6 Million $621.3 Million $397.9 Million $267.0 Million
Source: Items in italics provided by the Pennsylvania Department of Transportation, using 2007 figures. Number of Fewer Crashes and Number of Fewer Deaths are derived from the models presented earlier in Section 4.0. Value of Statistical Life obtained from the U.S. Department of Transportation, http://ostpxweb.dot.gov/policy/reports/080205.htm. Medium value for time of inspection based on one hour of the value of the statistical life, based on an assumption of an average of 39 years of remaining life.
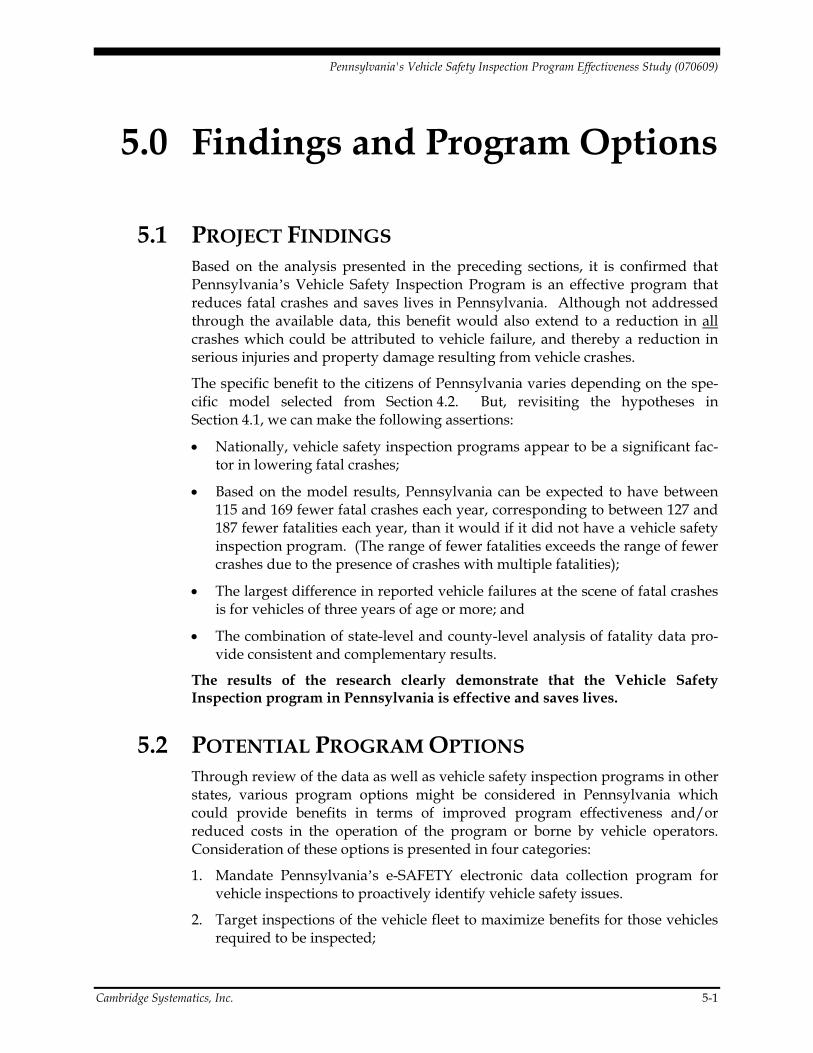
Pennsylvania's Vehicle Safety Inspection Program Effectiveness Study (070609)
Cambridge Systematics, Inc. 5-1
5.0 Findings and Program Options
5.1 PROJECT FINDINGS Based on the analysis presented in the preceding sections, it is confirmed that Pennsylvania’s Vehicle Safety Inspection Program is an effective program that reduces fatal crashes and saves lives in Pennsylvania. Although not addressed through the available data, this benefit would also extend to a reduction in all crashes which could be attributed to vehicle failure, and thereby a reduction in serious injuries and property damage resulting from vehicle crashes.
The specific benefit to the citizens of Pennsylvania varies depending on the spe-cific model selected from Section 4.2. But, revisiting the hypotheses in Section 4.1, we can make the following assertions:
• Nationally, vehicle safety inspection programs appear to be a significant fac-tor in lowering fatal crashes;
• Based on the model results, Pennsylvania can be expected to have between 115 and 169 fewer fatal crashes each year, corresponding to between 127 and 187 fewer fatalities each year, than it would if it did not have a vehicle safety inspection program. (The range of fewer fatalities exceeds the range of fewer crashes due to the presence of crashes with multiple fatalities);
• The largest difference in reported vehicle failures at the scene of fatal crashes is for vehicles of three years of age or more; and
• The combination of state-level and county-level analysis of fatality data pro-vide consistent and complementary results.
The results of the research clearly demonstrate that the Vehicle Safety Inspection program in Pennsylvania is effective and saves lives.
5.2 POTENTIAL PROGRAM OPTIONS Through review of the data as well as vehicle safety inspection programs in other states, various program options might be considered in Pennsylvania which could provide benefits in terms of improved program effectiveness and/or reduced costs in the operation of the program or borne by vehicle operators. Consideration of these options is presented in four categories:
1. Mandate Pennsylvania’s e-SAFETY electronic data collection program for vehicle inspections to proactively identify vehicle safety issues.
2. Target inspections of the vehicle fleet to maximize benefits for those vehicles required to be inspected;
Pennsylvania's Vehicle Safety Inspection Program Effectiveness Study (070609)
5-2 Cambridge Systematics, Inc.
3. Focus inspection criteria on those vehicle safety components most likely to contribute to vehicle failures and/or crashes;
4. Conduct Outreach and Expanded Public Information to Stakeholders; and
1. Mandate the e-SAFETY Electronic Inspection Data Collection Program In December 2007, PennDOT began a voluntary electronic data collection and storage program for participating inspection facilities. This program, called e-SAFETY, enables inspection facilities to enter information about each vehicle inspection, and have that information transmitted to PennDOT. In addition to administrative and auditing functionality, PennDOT staff can utilize the e-SAFETY data to perform analyses of the inspection process and the results of inspections statewide. The existing e-SAFETY data was not analyzed during this research, as the first year’s worth of full data was being reviewed by PennDOT concurrent to the research.
When analyzed over a period of years, the data collected in e-SAFETY about inspections will be of excellent value. Four examples of potential uses include:
1. Data regarding specific vehicle characteristics can be compiled and used as an educational tool to help inspection personnel and vehicle owners be more aware of potential issues that may occur within specific segments of the vehi-cle population.
2. Potential equipment and safety issues regarding vehicle aging may be identified; and
3. Fatalities from FARS can be compared to inspection data from e-SAFETY and a vehicle’s multiyear inspection history can be identified;
4. Data about inspection failures can be used to inform Federal agencies about Pennsylvania’s experiences, and affect future generations of FARS data coding procedures;
2. Target Inspections of the Vehicle Fleet to Maximize Benefits for Those Vehicles Required to be Inspected The age segmentation results in Section 4.2 point towards a finding that vehicle equipment failures reported in fatal crashes is insignificant of state of registration for the first two years of operation for a new vehicle. Appropriate caution must be given, however, to the very small sample size. Expansion of this finding, however, could have the following implications:
• There would be a vehicle operation cost savings to the owners of new vehi-cles who would be excluded from the inspection requirement. This would not impact the emissions inspection of those vehicles since they are still required to be tested in accordance with Pennsylvania’s Federally approved State Implementation Plan.
Pennsylvania's Vehicle Safety Inspection Program Effectiveness Study (070609)
Cambridge Systematics, Inc. 5-3
• Some vehicle defects which might be detected through the program would go undetected, thereby allowing some potentially unsafe vehicles to operate on public roads. However, based on available data, that number would be quite small.
3. Focus Vehicle Inspection Criteria on Those Safety Components Most Likely to Contribute to Vehicle Failures and Crashes It is apparent through a review of crash reports that the vehicle components that have the highest likelihood of contributing to a vehicle failure crash are limited to a few key elements: tires, brakes, and, to some extent, exterior lights (brake, headlights, turn indicators). The vehicle safety inspection program protocol could be modified to focus on the vehicle components which have a greater like-lihood of contributing to vehicle failure. This would have the following implications:
• Total time involved in conducting the inspection process could be reduced, (unless other portions of the inspection were enhanced) saving time for motorists and allowing inspection personnel to conduct more inspections per unit of time.
• Components which could contribute to vehicle failure crashes would not be inspected (e.g., horn, mirrors, and windshield wipers).
4. Conduct Outreach and Expanded Public Information to Stakeholders Although the public is generally well-informed regarding the requirement for the vehicle safety inspection program, additional public education and informa-tion could be provided at low-cost to publicize the benefits of the program and also encourage the driving public to be more cognizant of vehicle defects which could contribute to vehicle failure. Various opportunities are available to dis-seminate this information, such as PennDOT’s Driver and Vehicle Services Web Site (http://www.dmv.state.pa.us), posters and brochures that could be provided for distribution to garages and PennDOT facilities. More specific information and guidance regarding procedures for periodic self-inspection could be provided through drivers’ education curriculum and in the official Pennsylvania Driver’s Manual provided to all new drivers through PennDOT’s Driver and Vehicle Services. This would have the following implications:
• Vehicle operators would have a greater understanding of the benefits and importance of proper vehicle maintenance and the purpose of the inspection program; and
• Independent of the program, vehicle operators would be more likely to detect possible vehicle defects which could lead to vehicle failure and to take corrective actions.


Pennsylvania's Vehicle Safety Inspection Program Effectiveness Study (070609) Appendix A
Cambridge Systematics, Inc. A-1
A. Bibliography
AAA Foundation for Traffic Safety and Arizona State University. A Study of Motor Vehicle Inspection. 1967.
Crain, Mark. Vehicle Safety Inspection Systems. How Effective? Washington, D.C.: American Enterprise Institute, 1980.
Fazzalaro, James. Periodic Motor Vehicle Safety Inspections. Connecticut General Assembly Office of Legislative Research. October 2007.
Fosser, S. “An Experimental Evaluation of the Effects of Periodic Motor Vehicle Inspection on Accident Rates.” Accident Analysis and Prevention 24.6 (1992): pages 599 to 612.
General Accounting Office. Effectiveness of Vehicle Safety Inspections Neither Proven Nor Unproven. CED-78-18. 1977.
Loeb, Peter. “The Determinants of Motor Vehicle Accidents – A Specification Error Analysis.” Logistics and Transportation Review 24.1 (1988): 33.
Loeb, Peter. “The Efficacy and Cost-Effectiveness of Motor Vehicle Inspection Using Cross-Sectional Econometric Analysis.” Southern Economic Journal 52.2 (1985): pages 500 to 509.
Loeb, Peter and B. Gilad. “The Efficacy of Motor Vehicle Inspection: A State Specific Analysis Using Time Series Data.” Journal of Transport Economics and Policy May 1984.
McCuthcheon, R. and H. Sherman. The Influence of Periodic Motor Vehicle Inspection on Mechanical Condition. Highway Safety Research Institute, University of Michigan. Report PhR-1, July 1968.
Merrell, David and Daniel Sutter. “The Effectiveness of Vehicle Safety Inspections: An Analysis Using Panel Data.” Southern Economic Journal 65.3 (1999): 31.
Missouri State Highway Patrol Motor Vehicle Inspection Division and Statistical Analysis Center. Nationwide and Missouri Motor Vehicle Safety Inspection Program Fatal Crash Analysis. September 2003.
National Highway Traffic Safety Administration. Study of Effectiveness of State Motor Vehicle Inspection Programs: Final Report. Washington, D.C. August 1989.
North Carolina General Assembly Program Evaluation Division. Doubtful Return on the Public’s $141 Million Investment in Poorly Managed Vehicle Inspection Program – Final Report to the Joint Legislative Program Evaluation Oversight Committee. Report Number 2008-12-06. December 2008.
Pennsylvania's Vehicle Safety Inspection Program Effectiveness Study (070609) Appendix A
A-2 Cambridge Systematics, Inc.
Pennsylvania Department of Transportation Office of Budget and Administration Division of Program Planning and Evaluation. Motor Vehicle Inspection. January 1981.
Poitras, M., and D. Sutter. “Policy Ineffectiveness or Offsetting Behavior? An Analysis of Vehicle Safety Inspections.” Southern Economic Journal 68.4 (2002): pages 922 to 934.
Van Matre, Joseph G., and George Overstreet, Jr. “Motor Vehicle Inspection and Accident Mortality: A Reexaminination.” Journal of Risk and Insurance 49.3 (1982): pages 423 to 435.
Wolfe, A.C., and J. O’Day. Cost-Effectiveness of Periodic Motor Vehicle Inspection (PMVI): A Review of the Literature. University of Michigan Transportation Research Institute and National Highway Traffic Safety Administration. 1985.
Pennsylvania's Vehicle Safety Inspection Program Effectiveness Study (070609) Appendix B
Cambridge Systematics, Inc. B-1
B. Review of Assembled Literature
Seventeen research studies provided relevant data bearing on the benefits, costs, and effectiveness of periodic vehicle safety inspection programs (PMVI). The vehicle safety inspection program in Pennsylvania is one example of such a peri-odic program. The references are listed chronologically and summarized below.
A Study of Motor Vehicle Inspection. AAA Foundation for Traffic Safety and Arizona State University. 1967.
The AAA Foundation for Traffic Safety and the Arizona State University conducted a study to collect, analyze, and report on information related to the effectiveness of motor vehicle inspection. The study reviewed previous studies which have dealt with the question of whether motor vehicle inspection is effec-tive in reducing traffic accidents and fatalities. It was found that there is no fac-tual proof that motor vehicle inspection is effective in reducing accident or death rates. The data needed to establish measurable cause-effect relationships between motor vehicle inspection and accident reduction is lacking. Improve-ments must be made in accident investigation, accident data reporting and analysis, and in the area of accident research before the role played by motor vehicle inspection in highway safety can be accurately determined.
McCuthcheon, R. and H. Sherman. The Influence of Periodic Motor Vehicle Inspection on Mechanical Condition. Highway Safety Research Institute, University of Michigan. Report PhF-1, July 1968.
The purpose of the study is to determine whether, and to what extent, PMVI influences the mechanical condition of cars. The investigation measures the influence of selected PMVI programs on the mechanical condition of the vehicle populations subject to these inspection programs. Mechanical condition is equated with the inspection status of a vehicle (passed or failed). The data col-lection methodology was designed to collect information on the mechanical con-dition of vehicles in jurisdictions with PMVI programs and compare them to the mechanical condition of vehicles in jurisdictions with noninspected vehicle populations. This study collected data for a one-week period at inspection facili-ties in Cincinnati, Ohio, and Washington, D.C. A temporary safety inspection lane was set up in Ann Arbor, Michigan to satisfy the noninspected vehicle population requirements of the study. The data from this study show that PMVI significantly influences the overall mechanical condition of vehicle populations. In the vehicle populations examined, it was found that:
Pennsylvania's Vehicle Safety Inspection Program Effectiveness Study (070609) Appendix B
B-2 Cambridge Systematics, Inc.
• Vehicle populations subject to PMVI are in measurably better mechanical condition than vehicle populations not subject to PMVI;
• The mechanical condition of a vehicle population is measurably improved as the frequency of inspection increases; and
• The number of mechanical defects per rejected vehicle decreases as the fre-quency of inspection increases.
Effectiveness of Vehicle Safety Inspections Neither Proven Nor Unproven. General Accounting Office. CED-78-18. 1977.
The General Accounting Office (GAO) provided a report to Congress reviewing the effectiveness of vehicle safety inspections. The GAO recommended that Congress reject the Department’s recommendation to make compliance with the Federal vehicle safety inspection standards optional. The recommendations also urged Congress to modify Federal inspection standards to allow states flexibility in determining the specific type of inspection program best suited to their high-way needs.
Crain, Mark. Vehicle Safety Inspection Systems. How Effective? American Enterprise Institute. Washington, D.C. 1980. page 70.
This study uses a statistical analysis to compare death and accident rates in states with and without inspection programs. The basic hypothesis of this study is that, everything else being equal, accident rates will be significantly lower in states having vehicle inspection programs. Independent variables incorporated into the equations include the existence and nature of inspection systems, popu-lation density, median family income, fuel consumption, Federal highways, population age, procedure for driver’s license renewal, alcohol consumption, and minimum damage required for reporting an accident. The statistical tests revealed the strong conclusion that vehicle inspection programs have no detect-able impact on highway safety. More specific results suggest:
• States which employ mandatory periodic inspection programs do not have lower accident rates than those states without such requirements;
• Twice-yearly inspections do not appear to be any more effective than yearly inspections in reducing highway accidents;
• State ownership and operation of periodic inspection stations does not appear to be more effective than designating private inspection agents or having no inspection program at all; and
• Spot or random inspection systems appear to exhibit a negative influence on death rates and on nonfatal accident rates. These results are not entirely conclusive.
Pennsylvania's Vehicle Safety Inspection Program Effectiveness Study (070609) Appendix B
Cambridge Systematics, Inc. B-3
Motor Vehicle Inspection. January 1981. Pennsylvania Office of Budget and Administration Division of Program Planning and Evaluation.
This study reviews previous research on PMVI effectiveness and analyzes motor vehicle accident rates in states with annual, semiannual, and no PMVI programs. The literature review identified major approaches and findings of various studies on the effectiveness of PMVI programs. The Pennsylvania PMVI program is evaluated to determine whether the frequency of vehicle inspection and the rigor of the state inspection standards are justified given their accident reduction capabilities.
The study of motor vehicle inspection effectiveness employed a multivariate evaluation approach. The analysis focused on 1971 to 1973 annual data from 50 states and the District of Columbia. The stepwise multiple regression analysis identified important demographic, socioeconomic, environmental, and highway influences on motor vehicle accident rates. These influences were used as covariates in the second phase of the analysis which indicated that motor vehicle accident rates in states with annual, semiannual, and no PMVI programs were essentially equal. Thus, PMVI had no significant impact on the number of motor vehicle accidents occurring in those states with PMVI programs.
The third phase of the study examined the Pennsylvania PMVI program stan-dards. The major conclusion of the study is that semiannual motor vehicle inspection is not a cost-effective means of controlling motor vehicle accident rates.
Van Matre, Joseph G. and George Overstreet, Jr. Motor Vehicle Inspection and Accident Mortality: A Reexamination. The Journal of Risk and Insurance, Volume 49, Number 3, September 1982. pages 423 to 435.
This study examines the relationship of motor vehicle inspection to accident mortality using a multiple regression model. The fatality rate model considers three inspection schemes: periodic, random, and no inspection. The fatality rate model used in the study included vehicle usage, interstate mileage, rural mile-age, vehicle density, law enforcement, weather conditions, driver characteristics, vehicle speed, and vehicle inspection laws. The major conclusions are:
• Both PMVI and random inspection plans significantly reduce the fatality rate over states with no inspection;
• Random inspection is more effective than PMVI in reducing the fatality rate; and
• Preliminary estimates of cost-effectiveness suggest the random inspection is the preferable inspection system.
Pennsylvania's Vehicle Safety Inspection Program Effectiveness Study (070609) Appendix B
B-4 Cambridge Systematics, Inc.
Loeb, Peter and B. Gilad. The Efficacy of Motor Vehicle Inspection: A State Specific Analysis Using Time Series Data. Journal of Transport Economics and Policy. May 1984.
The State of New Jersey Department of Law and Public Safety Division of Motor Vehicles commissioned a time series analysis of the efficacy of inspection in reducing fatalities, injuries, and accidents using New Jersey data. The study develops an econometric model to evaluate inspection while accounting for various socioeconomic factors, as well as technology and driving-related vari-ables. Variables such as maximum highway speed, gasoline consumption, num-ber of licenses revoked for drunken driving, per capita personal income, population, number of motor vehicle registrations, number of drivers licensed, vehicle mileage, total number of accidents reported, and number of traffic deaths are incorporated into the model. The results of the study are used to evaluate a partial benefit/cost analysis of the system of motor vehicle inspection.
The analysis results indicate that vehicle inspection in New Jersey reduces high-way fatalities by 304 deaths per year. This result was obtained when other changes that also may affect fatalities are taken into account in the analysis. The analysis indicates that inspection in New Jersey significantly reduces the number of highway accidents. The model estimated a reduction of 37,910 accidents per year. However, the results did not indicate a significant reduction in the number of highway injuries. The author suggested that the insignificant effect of inspec-tion on injuries may be due to the inspection process discovering and correct major safety violations in vehicles, but not minor ones. Also, the inspection process may serve as an educational device affecting drivers’ attitudes towards maintenance of vital safety factors in their vehicles, thereby reducing fatal accidents.
The major problem with this study is that it shows too large an effect of PMVI to be credible. Studies show a very small percentage of accidents being caused by vehicle defects. The time series analysis has only nine baseline data points before PMVI began. One must conclude that some other significant variables were not included in the analysis.
Loeb, Peter. The Efficacy and Cost-Effectiveness of Motor Vehicle Inspection Using Cross-Sectional Econometric Analysis. Southern Economic Journal, Volume 52, Number 2, October 1985. pages 500 to 509.
This study develops an econometric model for the efficacy of inspection in reducing fatalities and injuries using cross-sectional data for the year 1979. The model accounts for the effects of various socioeconomic and driving-related vari-ables such as fuel consumption per capita, personal income per capita, percent of high school graduates, population density, average annual precipitation, total highway miles, eye exam requirement for license renewal, accident reporting requirement, and percent of arrests for alcohol-related offenses. A benefit/cost analysis also was conducted using New Jersey as the reference state and 1981 as the reference year.
Pennsylvania's Vehicle Safety Inspection Program Effectiveness Study (070609) Appendix B
Cambridge Systematics, Inc. B-5
The results indicate a significant reduction in motor vehicle fatalities and fatali-ties per capita when an inspection system is in effect. Based on the results of this investigation and the estimates of the value of loss of life and morbidity associated with motor vehicle-related accidents, motor vehicle inspection may provide an effective procedure to reduce the loss of life and injuries associated with these accidents.
Wolfe, A.C., J. O’Day. Cost-Effectiveness of Periodic Motor Vehicle Inspection (PMVI); A Review of the Literature. University of Michigan Transportation Research Institute and National Highway Traffic Safety Administration. 1985.
This study reviews 41 publications on the benefits and/or costs of PMVI pro-grams. The report concludes that while none of the publications was able to provide definitive evidence on the question of PMVI cost-effectiveness, many of them did provide some useful information bearing on the subject. The study concludes that there is a shortage of satisfactory research for determining the effectiveness of PMVI programs in reducing accidents. Useful research which could be carried out with existing accident data include:
• Comparing vehicle-defect rates in PMVI and non-PMVI states using Fatal Accident Reporting System and National Accident Sampling System data sets;
• Examine vehicle-defect accidents in relation to time since inspection using accident files from PMVI jurisdictions;
• Examine before-after vehicle-defect accident rates in states which have introduced PMVI but have maintained the same accident reporting proce-dures, utilizing time-series regression techniques; and
• Replicate the Loeb-Gilad type of time series analysis with general accident data in other PMVI states besides New Jersey.
Loeb, Peter. The Determinants of Motor Vehicle Accidents – A Specification Error Analysis. Logistics and Transportation Review, March 1988. Volume 24, Numer 1, page 33.
This study develops models of the determinants of motor vehicle fatality rates. The efficacy of the average speed of motor vehicles, motor vehicle inspection, and alcohol consumption are evaluated. The study evaluated the efficacy of the policy-related variables using a cross-sectional model and 1979 fatality data. Specification error tests and fragility analysis were used to detect specification errors of omission of variables, misspecified structural form of the regressors, simultaneity equation bias, heteroscedasticity, and non-normality of residuals. The explanatory variables considered in the models include minimum legal drinking age, per capita consumption of malt beverages, personal income per capita, fuel consumption per capita, population density, and percent of popula-tion in four age ranges.
The results indicate that the policy variables are effective in reducing fatality rates. The effect of inspection was consistently nonfragile across alternative
Pennsylvania's Vehicle Safety Inspection Program Effectiveness Study (070609) Appendix B
B-6 Cambridge Systematics, Inc.
specifications. The results provide an effective argument to impose or maintain motor vehicle inspection and not to increase speed limits.
National Highway Traffic Safety Administration. Study of Effectiveness of State Motor Vehicle Inspection Programs: Final Report. Washington, D.C. August 1989. page 9.
This publication contains the results of a Federally mandated evaluation by the National Highway Traffic Safety Administration (NHTSA) of the effectiveness of state motor vehicle safety inspection programs in: 1) reducing highway crashes that result in injuries and deaths; and 2) limiting the number of defective or unsafe motor vehicles on the highways. A NHTSA task force reviewed relevant literature, studied existing PMVI programs, conducted site visits to selected PMVI and non-PMVI states, and analyzed NHTSA’s crash data bases. In addi-tion, two public hearings were held and comments requested from the public through two separate notices published in the Federal Register.
It was found that there was no conclusive evidence in the literature that PMVI programs are, or are not, effective in reducing crashes. Analysis of the Fatal Accident Reporting System (FARS) data and state crash data files failed to show any evidence in the crash data examined which would suggest that PMVI pro-grams affect the crash involvement rates of older vehicles compared to newer vehicles. Analysis of data concerning vehicle component failures from the Crash Avoidance Research Data file (CARDfile) for four states indicated that non-PMVI states reported a higher percentage of old and new crash-involved vehicles with component failures. Tire failures accounted for the majority of the increased per-centage of component failures reported in the non-PMVI states. The task force found that PMVI was effective in limiting the number of poorly maintained vehi-cles on the highways. An attempt to correlate this with a reduction in crashes on the highways failed to show any significant effect of PMVI.
Fosser, S. An Experimental Evaluation of the Effects of Periodic Motor Vehicle Inspection on Accident Rates. Accident Analysis and Prevention Volume 24, Number 6, pages 599 to 612. 1992.
In this experimental study 204,000 cars in Norway were randomly assigned three different experimental conditions. A group of 46,000 cars were inspected annu-ally during a three-year period. Another group of 46,000 cars were inspected once during the three-year study period and 112,000 cars were not inspected. Accident rates for a four-year period were recorded to determine the effect of inspection on accident rates. The accident rate (risk of accident per car) estimated for each car is an annual average value. There were no statistically significant differences between the three groups in any of the three accident period. The study also concluded that periodic motor vehicle inspection does not affect accident severity.
Pennsylvania's Vehicle Safety Inspection Program Effectiveness Study (070609) Appendix B
Cambridge Systematics, Inc. B-7
Merrell, David and Daniel Sutter. The Effectiveness of Vehicle Safety Inspections: An Analysis Using Panel Data. Southern Economic Journal, Volume 65, 1999. 31. 1999. This study examines the effectiveness of state automobile safety inspections using panel data of the 50 states for the years 1981 to 1993. A fixed-effects model that incorporated state-specific shifts in casualty rates was used. The research found no evidence that inspections significantly reduce fatality or injury rates. The author speculates that inspections may induce an offsetting increase in driving intensity. Since most accidents do not involve mechanical failure, inspections can at best prevent only a small fraction of accidents. Poitras, M. and D. Sutter. Policy Ineffectiveness or Offsetting Behavior? An Analysis of Vehicle Safety Inspections. Southern Economic Journal, Volume 68, No. 4, April 2002. pages 922 to 934. This unique test of inspection effectiveness analyzes the policy’s impact on the number of old cars in use and on repair industry revenue. The study is based on the assumption that if inspection effectively increases the minimum level of maintenance, the operating costs of older vehicles rises relative to those of new vehicles. Older vehicles typically require more repairs to meet a given mechani-cal standard, and these expenditures represent a larger fraction of annual depre-ciation. The study examined the effect of inspection on registrations of old vehicles using a panel of annual observations on the 48 contiguous states and the District of Columbia. The results indicate that inspection has no significant impact on either old cars or repair industry revenue. Nationwide and Missouri Motor Vehicle Safety Inspection Program Fatal Crash Analysis. Motor Vehicle Inspection Division and the Statistical Analysis Center. September 2003. The Motor Vehicle Inspection Division and the Statistical Analysis Center of the Missouri State Highway Patrol conducted a study to determine if periodic motor vehicle safety inspection programs had an impact on reducing vehicle defect causation factors in traffic crashes. The analysis compared fatal traffic crash vehicle defect rates per registered vehicles in states having periodic motor vehi-cle inspection programs to defect rates per registered vehicles in other regions of the nation. Data used in the analysis were obtained from the National Highway Traffic Safety Administration (NHTSA), Fatal Accident Reporting System (FARS). Vehicles involved in fatal crashes from 2000 to 2002 were included. Fatal crashes involving automobiles, sport utility vehicles, motorcycles, vans, and light trucks were selected for the study.
The results indicated that newer vehicles have proportionately fewer vehicle defect causation factors than older vehicles involved in fatal traffic crashes. Vehicle defects as a causation factor increased in relation to the age of the vehicle. Vehicles registered in states having motor vehicle safety inspection programs had proportionately fewer defects as a causative factor than vehicles in states not having such programs. One of every 82.7 vehicles registered in states having
Pennsylvania's Vehicle Safety Inspection Program Effectiveness Study (070609) Appendix B
B-8 Cambridge Systematics, Inc.
periodic safety inspection programs had a vehicle defect compared to one in every 72.9 vehicles registered in states not having this type of program.
The study also included a Public Opinion Survey assessing Missouri’s motor vehicle safety inspection program. Close to two-thirds of the respondents favored continuation of the program. Approximately one-third opposed its continuation. Fazzalaro, James. Periodic Motor Vehicle Safety Inspections. Connecticut General Assembly Office of Legislative Research. October 2007. This report summarizes periodic motor vehicle safety inspection practices along the Atlantic seaboard. The report characterizes the frequency of vehicle-defect related crashes in the State of Connecticut. Connecticut does not require periodic motor vehicle safety inspections. Seven of the 15 states on the Atlantic Seaboard require annual safety inspections for passenger vehicles. Factors contributing to accidents in Connecticut appear to be overwhelmingly driver-related or environmental-related. Of the approximately 80,000 reported accidents that occur in Connecticut each year, mechanical failure of a vehicle is listed as a contributing factor in about 0.7 percent of accidents and 0.35 percent or less of fatal accidents. The most common vehicle defect factor was unsafe or failed vehicle tires. Doubtful Return on the Public’s $141 Million Investment in Poorly Managed Vehicle Inspection Program – Final Report to the Joint Legislative Program Evaluation Oversight Committee. Program Evaluation Division, North Carolina General Assembly. Report Number 2008-12-06. December 2008. The North Carolina Joint Legislative Program Evaluation Oversight Committee directed a study to determine if the State’s vehicle safety and emissions inspec-tion programs are effective and if the management and oversight of the pro-grams are efficient. The Program Evaluation Division collected and analyzed data from 6.3 million 2007 inspection records, vehicle registration data from the DMV, interviews with DMV and the Department of Environment and Natural Resource’s Division of Air Quality management and personnel, interviews with the state highway patrol and independent garage owners, observations of actual safety and emissions inspections, and reviews of other states’ safety and emis-sions inspection programs.
The study concluded that the safety inspection program is not effective because lower rates of traffic accidents, injuries, and deaths stemming from faulty vehicle equipment should be attributable to the existence of a valid and reliable safety inspection program. The data collected for the study showed that the number of cases in which a vehicle’s mechanical condition may have contributed to an acci-dent equaled one percent of all crashes statewide. The study also concluded that the shorter than recommended average inspection times indicate a lack of thor-oughness. The report concluded that the DMV’s oversight of the inspection pro-grams is insufficient because the stations are not inspected at the required frequency and the DMV does not use available data for program management. The study determined that older vehicles are more likely to fail inspection and other states exempt newer vehicles from inspections.
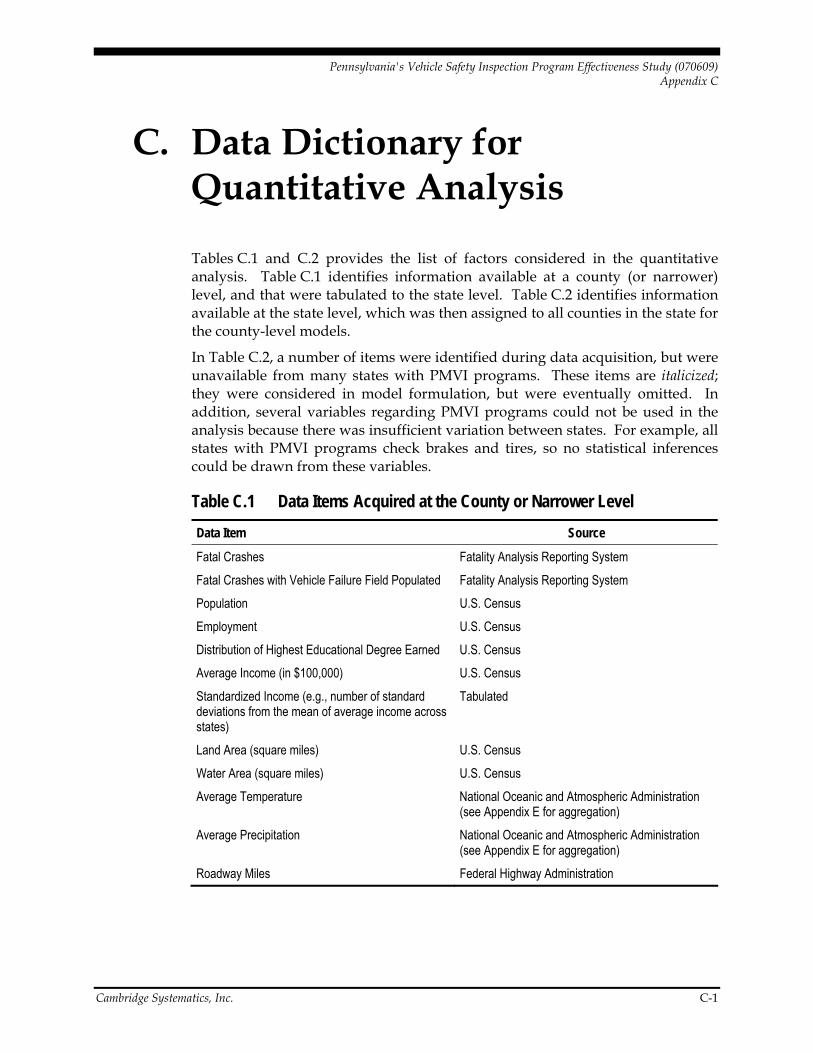
Pennsylvania's Vehicle Safety Inspection Program Effectiveness Study (070609) Appendix C
Cambridge Systematics, Inc. C-1
C. Data Dictionary for Quantitative Analysis
Tables C.1 and C.2 provides the list of factors considered in the quantitative analysis. Table C.1 identifies information available at a county (or narrower) level, and that were tabulated to the state level. Table C.2 identifies information available at the state level, which was then assigned to all counties in the state for the county-level models.
In Table C.2, a number of items were identified during data acquisition, but were unavailable from many states with PMVI programs. These items are italicized; they were considered in model formulation, but were eventually omitted. In addition, several variables regarding PMVI programs could not be used in the analysis because there was insufficient variation between states. For example, all states with PMVI programs check brakes and tires, so no statistical inferences could be drawn from these variables.
Table C.1 Data Items Acquired at the County or Narrower Level Data Item Source
Fatal Crashes Fatality Analysis Reporting System
Fatal Crashes with Vehicle Failure Field Populated Fatality Analysis Reporting System
Population U.S. Census
Employment U.S. Census
Distribution of Highest Educational Degree Earned U.S. Census
Average Income (in $100,000) U.S. Census
Standardized Income (e.g., number of standard deviations from the mean of average income across states)
Tabulated
Land Area (square miles) U.S. Census
Water Area (square miles) U.S. Census
Average Temperature National Oceanic and Atmospheric Administration (see Appendix E for aggregation)
Average Precipitation National Oceanic and Atmospheric Administration (see Appendix E for aggregation)
Roadway Miles Federal Highway Administration
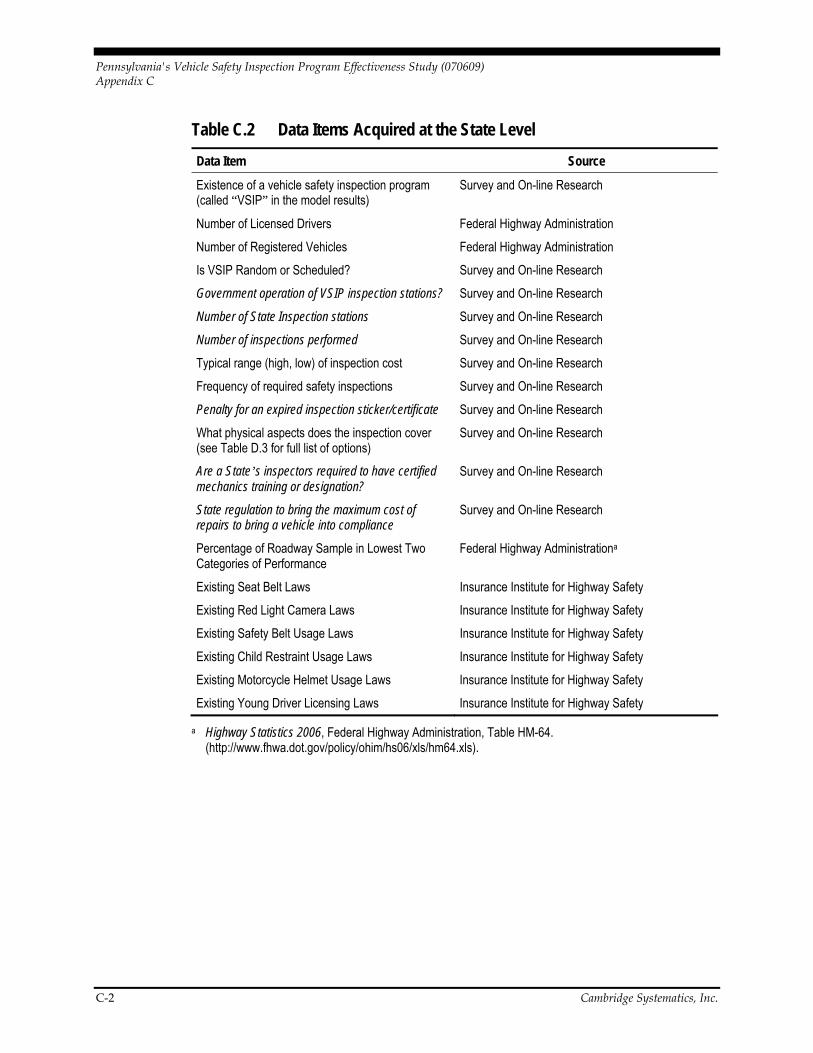
Pennsylvania's Vehicle Safety Inspection Program Effectiveness Study (070609) Appendix C
C-2 Cambridge Systematics, Inc.
Table C.2 Data Items Acquired at the State Level Data Item Source
Existence of a vehicle safety inspection program (called “VSIP” in the model results)
Survey and On-line Research
Number of Licensed Drivers Federal Highway Administration
Number of Registered Vehicles Federal Highway Administration
Is VSIP Random or Scheduled? Survey and On-line Research
Government operation of VSIP inspection stations? Survey and On-line Research
Number of State Inspection stations Survey and On-line Research
Number of inspections performed Survey and On-line Research
Typical range (high, low) of inspection cost Survey and On-line Research
Frequency of required safety inspections Survey and On-line Research
Penalty for an expired inspection sticker/certificate Survey and On-line Research
What physical aspects does the inspection cover (see Table D.3 for full list of options)
Survey and On-line Research
Are a State’s inspectors required to have certified mechanics training or designation?
Survey and On-line Research
State regulation to bring the maximum cost of repairs to bring a vehicle into compliance
Survey and On-line Research
Percentage of Roadway Sample in Lowest Two Categories of Performance
Federal Highway Administrationa
Existing Seat Belt Laws Insurance Institute for Highway Safety
Existing Red Light Camera Laws Insurance Institute for Highway Safety
Existing Safety Belt Usage Laws Insurance Institute for Highway Safety
Existing Child Restraint Usage Laws Insurance Institute for Highway Safety
Existing Motorcycle Helmet Usage Laws Insurance Institute for Highway Safety
Existing Young Driver Licensing Laws Insurance Institute for Highway Safety
a Highway Statistics 2006, Federal Highway Administration, Table HM-64. (http://www.fhwa.dot.gov/policy/ohim/hs06/xls/hm64.xls).
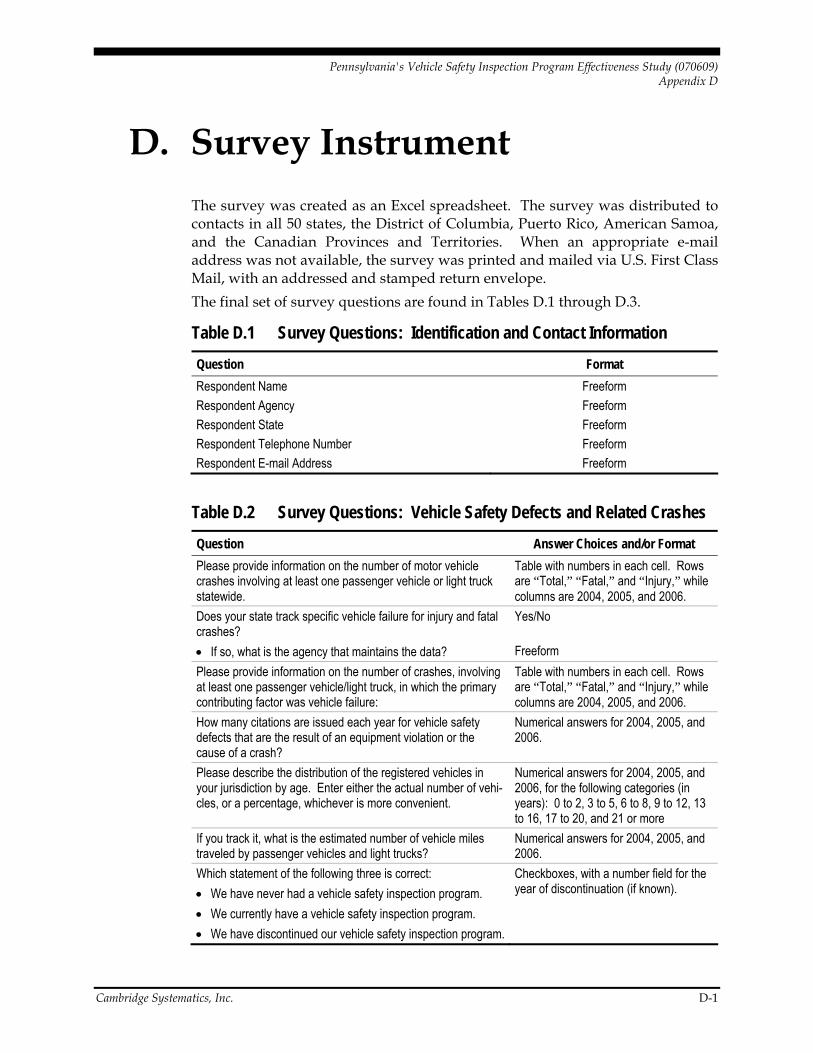
Pennsylvania's Vehicle Safety Inspection Program Effectiveness Study (070609) Appendix D
Cambridge Systematics, Inc. D-1
D. Survey Instrument The survey was created as an Excel spreadsheet. The survey was distributed to contacts in all 50 states, the District of Columbia, Puerto Rico, American Samoa, and the Canadian Provinces and Territories. When an appropriate e-mail address was not available, the survey was printed and mailed via U.S. First Class Mail, with an addressed and stamped return envelope. The final set of survey questions are found in Tables D.1 through D.3.
Table D.1 Survey Questions: Identification and Contact Information Question Format Respondent Name Freeform Respondent Agency Freeform Respondent State Freeform Respondent Telephone Number Freeform Respondent E-mail Address Freeform
Table D.2 Survey Questions: Vehicle Safety Defects and Related Crashes Question Answer Choices and/or Format Please provide information on the number of motor vehicle crashes involving at least one passenger vehicle or light truck statewide.
Table with numbers in each cell. Rows are “Total,” “Fatal,” and “Injury,” while columns are 2004, 2005, and 2006.
Does your state track specific vehicle failure for injury and fatal crashes?
Yes/No
• If so, what is the agency that maintains the data? Freeform Please provide information on the number of crashes, involving at least one passenger vehicle/light truck, in which the primary contributing factor was vehicle failure:
Table with numbers in each cell. Rows are “Total,” “Fatal,” and “Injury,” while columns are 2004, 2005, and 2006.
How many citations are issued each year for vehicle safety defects that are the result of an equipment violation or the cause of a crash?
Numerical answers for 2004, 2005, and 2006.
Please describe the distribution of the registered vehicles in your jurisdiction by age. Enter either the actual number of vehi-cles, or a percentage, whichever is more convenient.
Numerical answers for 2004, 2005, and 2006, for the following categories (in years): 0 to 2, 3 to 5, 6 to 8, 9 to 12, 13 to 16, 17 to 20, and 21 or more
If you track it, what is the estimated number of vehicle miles traveled by passenger vehicles and light trucks?
Numerical answers for 2004, 2005, and 2006.
Which statement of the following three is correct: • We have never had a vehicle safety inspection program. • We currently have a vehicle safety inspection program. • We have discontinued our vehicle safety inspection program.
Checkboxes, with a number field for the year of discontinuation (if known).
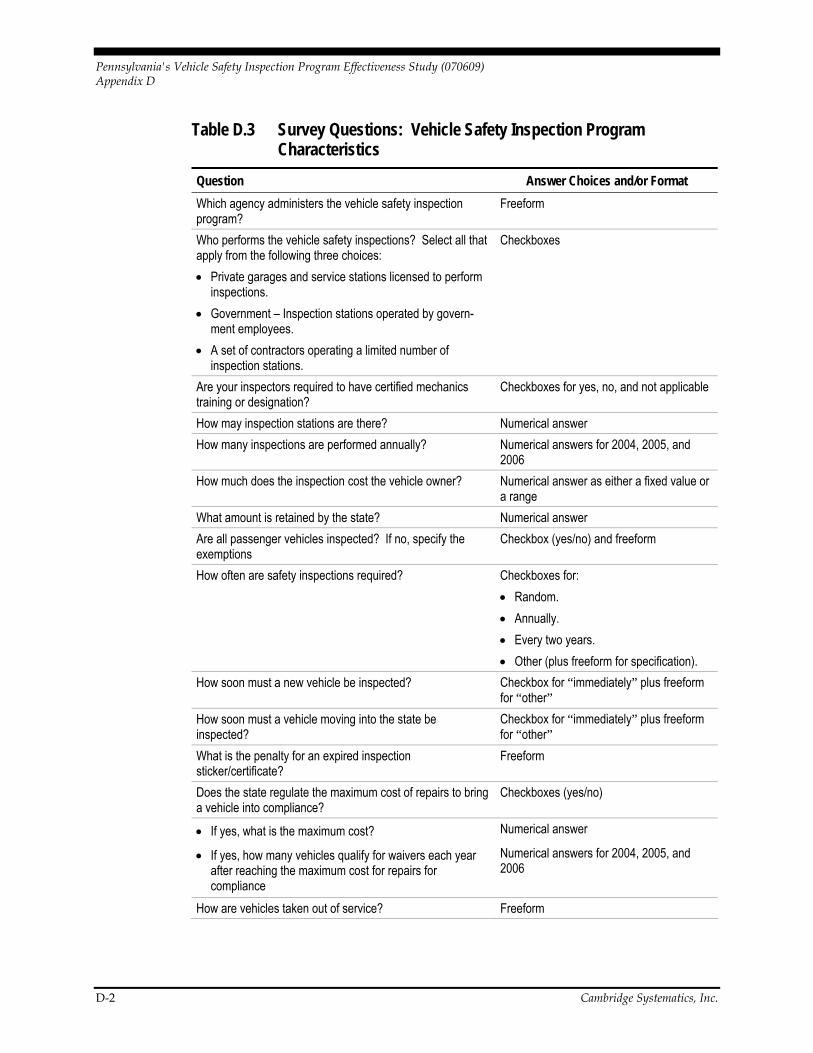
Pennsylvania's Vehicle Safety Inspection Program Effectiveness Study (070609) Appendix D
D-2 Cambridge Systematics, Inc.
Table D.3 Survey Questions: Vehicle Safety Inspection Program Characteristics
Question Answer Choices and/or Format Which agency administers the vehicle safety inspection program?
Freeform
Who performs the vehicle safety inspections? Select all that apply from the following three choices: • Private garages and service stations licensed to perform
inspections. • Government – Inspection stations operated by govern-
ment employees. • A set of contractors operating a limited number of
inspection stations.
Checkboxes
Are your inspectors required to have certified mechanics training or designation?
Checkboxes for yes, no, and not applicable
How may inspection stations are there? Numerical answer How many inspections are performed annually? Numerical answers for 2004, 2005, and
2006 How much does the inspection cost the vehicle owner? Numerical answer as either a fixed value or
a range What amount is retained by the state? Numerical answer Are all passenger vehicles inspected? If no, specify the exemptions
Checkbox (yes/no) and freeform
How often are safety inspections required? Checkboxes for: • Random. • Annually. • Every two years. • Other (plus freeform for specification).
How soon must a new vehicle be inspected? Checkbox for “immediately” plus freeform for “other”
How soon must a vehicle moving into the state be inspected?
Checkbox for “immediately” plus freeform for “other”
What is the penalty for an expired inspection sticker/certificate?
Freeform
Does the state regulate the maximum cost of repairs to bring a vehicle into compliance?
Checkboxes (yes/no)
• If yes, what is the maximum cost? Numerical answer
• If yes, how many vehicles qualify for waivers each year after reaching the maximum cost for repairs for compliance
Numerical answers for 2004, 2005, and 2006
How are vehicles taken out of service? Freeform
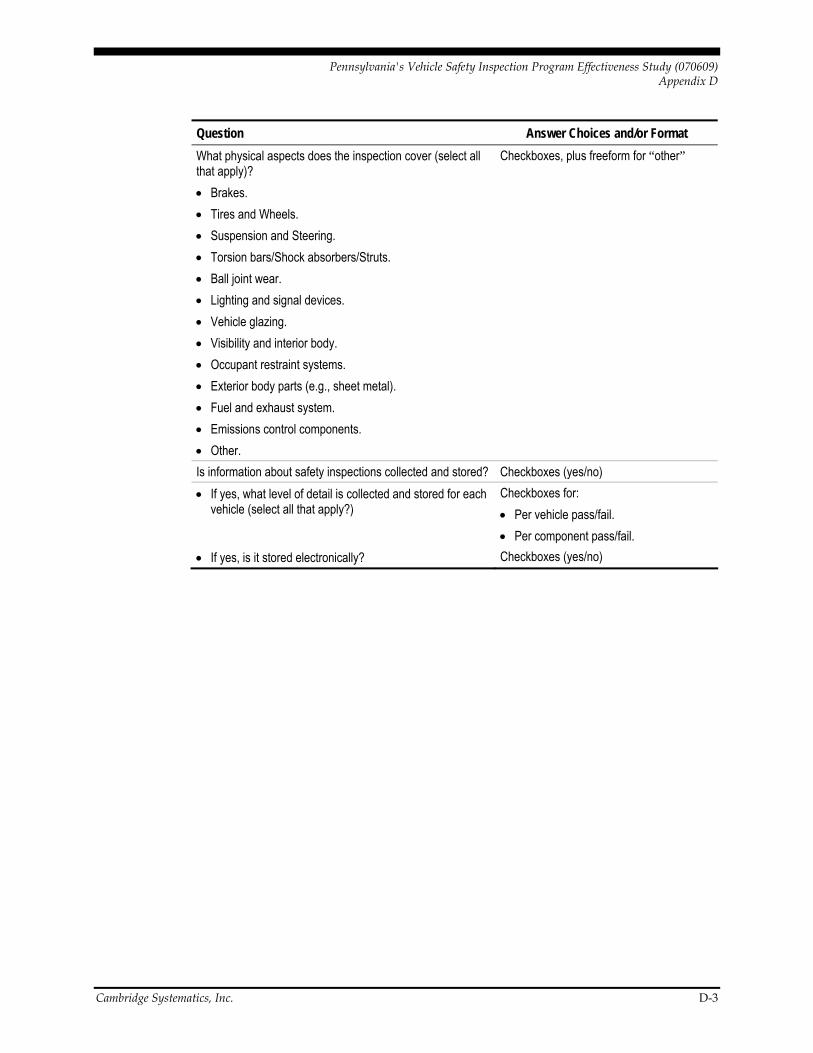
Pennsylvania's Vehicle Safety Inspection Program Effectiveness Study (070609) Appendix D
Cambridge Systematics, Inc. D-3
Question Answer Choices and/or Format What physical aspects does the inspection cover (select all that apply)?
Checkboxes, plus freeform for “other”
• Brakes. • Tires and Wheels. • Suspension and Steering. • Torsion bars/Shock absorbers/Struts. • Ball joint wear. • Lighting and signal devices. • Vehicle glazing. • Visibility and interior body. • Occupant restraint systems. • Exterior body parts (e.g., sheet metal). • Fuel and exhaust system. • Emissions control components. • Other.
Is information about safety inspections collected and stored? Checkboxes (yes/no) • If yes, what level of detail is collected and stored for each
vehicle (select all that apply?) Checkboxes for: • Per vehicle pass/fail. • Per component pass/fail.
• If yes, is it stored electronically? Checkboxes (yes/no)

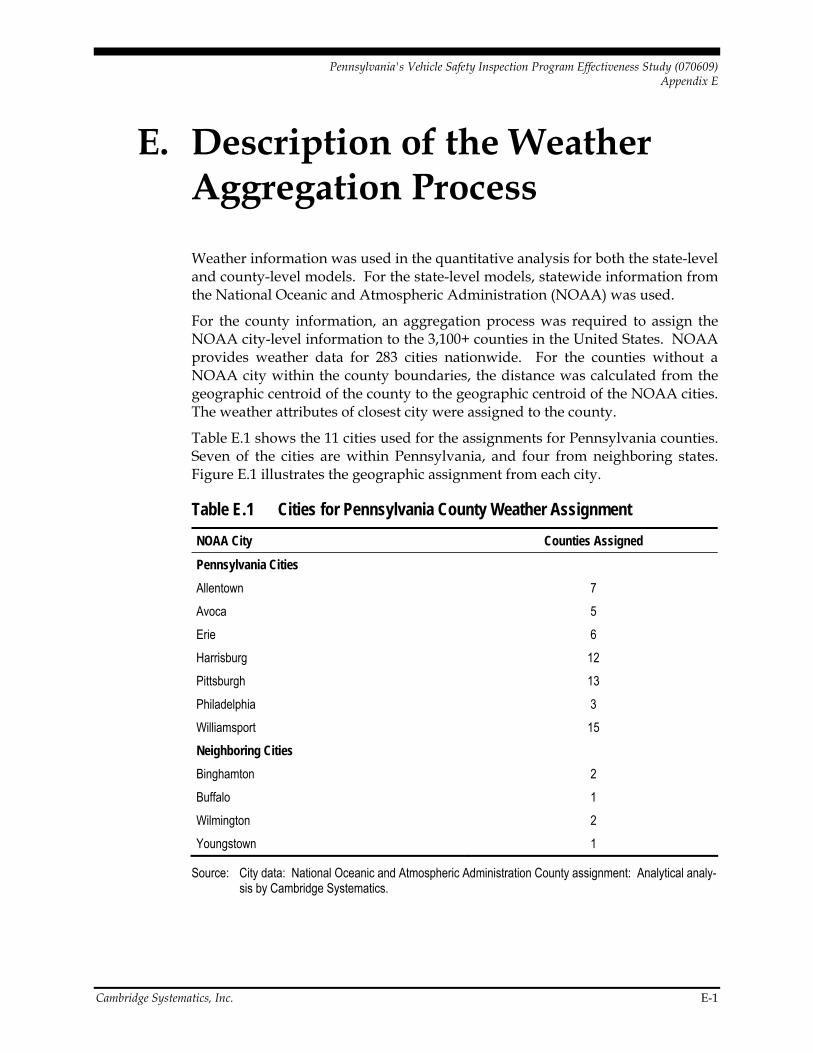
Pennsylvania's Vehicle Safety Inspection Program Effectiveness Study (070609) Appendix E
Cambridge Systematics, Inc. E-1
E. Description of the Weather Aggregation Process
Weather information was used in the quantitative analysis for both the state-level and county-level models. For the state-level models, statewide information from the National Oceanic and Atmospheric Administration (NOAA) was used.
For the county information, an aggregation process was required to assign the NOAA city-level information to the 3,100+ counties in the United States. NOAA provides weather data for 283 cities nationwide. For the counties without a NOAA city within the county boundaries, the distance was calculated from the geographic centroid of the county to the geographic centroid of the NOAA cities. The weather attributes of closest city were assigned to the county.
Table E.1 shows the 11 cities used for the assignments for Pennsylvania counties. Seven of the cities are within Pennsylvania, and four from neighboring states. Figure E.1 illustrates the geographic assignment from each city.
Table E.1 Cities for Pennsylvania County Weather Assignment NOAA City Counties Assigned
Pennsylvania Cities
Allentown 7
Avoca 5
Erie 6
Harrisburg 12
Pittsburgh 13
Philadelphia 3
Williamsport 15
Neighboring Cities
Binghamton 2
Buffalo 1
Wilmington 2
Youngstown 1
Source: City data: National Oceanic and Atmospheric Administration County assignment: Analytical analy-sis by Cambridge Systematics.

Pennsylvania's Vehicle Safety Inspection Program Effectiveness Study (070609) Appendix E
E-2 Cambridge Systematics, Inc.
Figure E.1 Assignment of Pennsylvania Counties to NOAA Cities for Weather Characteristics
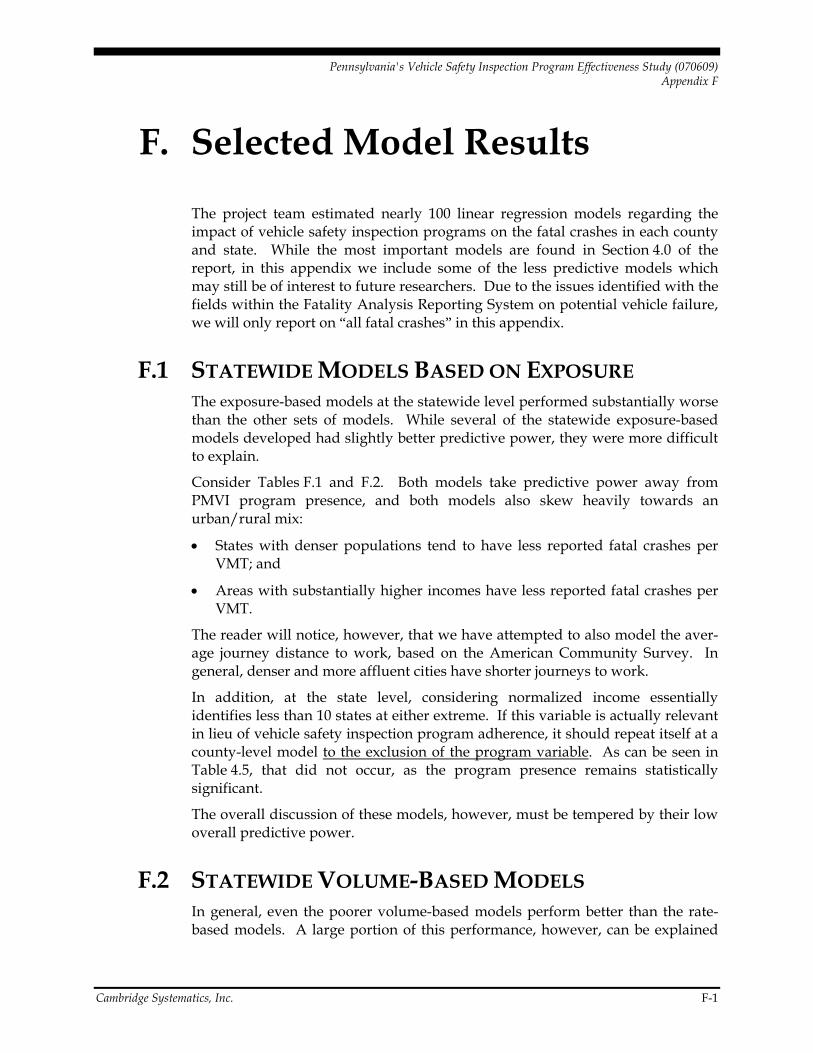
Pennsylvania's Vehicle Safety Inspection Program Effectiveness Study (070609) Appendix F
Cambridge Systematics, Inc. F-1
F. Selected Model Results
The project team estimated nearly 100 linear regression models regarding the impact of vehicle safety inspection programs on the fatal crashes in each county and state. While the most important models are found in Section 4.0 of the report, in this appendix we include some of the less predictive models which may still be of interest to future researchers. Due to the issues identified with the fields within the Fatality Analysis Reporting System on potential vehicle failure, we will only report on “all fatal crashes” in this appendix.
F.1 STATEWIDE MODELS BASED ON EXPOSURE The exposure-based models at the statewide level performed substantially worse than the other sets of models. While several of the statewide exposure-based models developed had slightly better predictive power, they were more difficult to explain.
Consider Tables F.1 and F.2. Both models take predictive power away from PMVI program presence, and both models also skew heavily towards an urban/rural mix:
• States with denser populations tend to have less reported fatal crashes per VMT; and
• Areas with substantially higher incomes have less reported fatal crashes per VMT.
The reader will notice, however, that we have attempted to also model the aver-age journey distance to work, based on the American Community Survey. In general, denser and more affluent cities have shorter journeys to work.
In addition, at the state level, considering normalized income essentially identifies less than 10 states at either extreme. If this variable is actually relevant in lieu of vehicle safety inspection program adherence, it should repeat itself at a county-level model to the exclusion of the program variable. As can be seen in Table 4.5, that did not occur, as the program presence remains statistically significant.
The overall discussion of these models, however, must be tempered by their low overall predictive power.
F.2 STATEWIDE VOLUME-BASED MODELS In general, even the poorer volume-based models perform better than the rate-based models. A large portion of this performance, however, can be explained
Pennsylvania's Vehicle Safety Inspection Program Effectiveness Study (070609) Appendix F
F-2 Cambridge Systematics, Inc.
through the natural correlations found which motivated us to consider rate-based models at the outset.
Returning to the normalized income variable, we can see that the resulting volume-based model (Table F.3), including this variable is approximately the same level of predictive power as Table 4.3. Furthermore, the vehicle safety inspection program variable gains in importance in Table F.3, with the coefficient increasing (with negative sign). This result causes us great concern for the model in Table F.2, and leads us to reject it in favor of the model in Table 4.2.
As far as selecting between the model in Table F.3 versus Table 4.3, both models are roughly similar in overall predictive power when looking at measures of overall model comparison. Since it is likely that there is no substantial difference between the models, we took the more conservative path and selected the sim-pler model with the lower coefficient for the program variable. The model in Table F.3 is, however, the genesis of the final county-level model developed as Table 4.5.
Table F.4 shows that annual precipitation at the state level also is a significant variable. This is intuitive, as statewide precipitation is a poor variable for large-volume states such as Pennsylvania. But the results help lead to our conclusion that the county model is appropriate to consider. Again, adding precipitation also strengthened the coefficient and significance of the program variable. As a result, we rejected this model as the final state volume, and again chose to err conservatively with the lower coefficient of vehicle safety inspection presence found in the model of Table 4.3.
F.3 COUNTY-LEVEL MODELS In these models, we are using volume-based models with approximately 60 times as many observations, and can include variables such as population. These factors cause the overall predictive quality of these models to increase dramati-cally. We evaluated the widest range of models at this level, with over 20 varia-tions of models having strong statistical results. Some of the intermediate models, however, provided counter-intuitive results.
For example, consider Table F.5, which takes into account the presence of state-wide DUI laws. The model identifies that counties in states with “fair” laws (relative to excellent or good ratings) have less fatal crashes than other states. This is a counter-intuitive result, most likely based on the limited information available to formulate the variable. At a county level, we can expect that other formulations of DUI laws and their enforcement would be more appropriate.
Finally, an example of why a county-level rate-based model will be of value in the future is Table F.6, a simple model demonstrating the power of the popula-tion variable. With this model in place, one can envision the transformation to a rate-based model using county VMT as a measure of exposure.
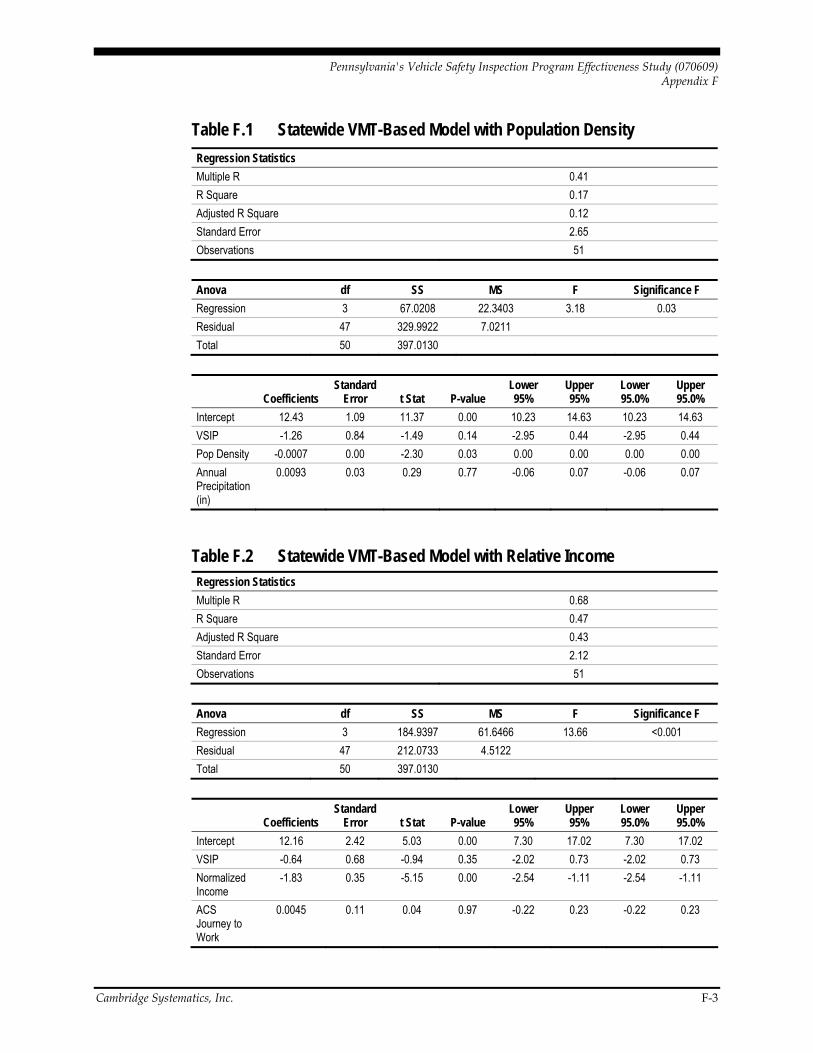
Pennsylvania's Vehicle Safety Inspection Program Effectiveness Study (070609) Appendix F
Cambridge Systematics, Inc. F-3
Table F.1 Statewide VMT-Based Model with Population Density Regression Statistics Multiple R 0.41 R Square 0.17 Adjusted R Square 0.12 Standard Error 2.65 Observations 51
Anova df SS MS F Significance F Regression 3 67.0208 22.3403 3.18 0.03 Residual 47 329.9922 7.0211 Total 50 397.0130
Coefficients Standard
Error t Stat P-value Lower 95%
Upper 95%
Lower 95.0%
Upper 95.0%
Intercept 12.43 1.09 11.37 0.00 10.23 14.63 10.23 14.63 VSIP -1.26 0.84 -1.49 0.14 -2.95 0.44 -2.95 0.44 Pop Density -0.0007 0.00 -2.30 0.03 0.00 0.00 0.00 0.00 Annual Precipitation (in)
0.0093 0.03 0.29 0.77 -0.06 0.07 -0.06 0.07
Table F.2 Statewide VMT-Based Model with Relative Income Regression Statistics Multiple R 0.68 R Square 0.47 Adjusted R Square 0.43 Standard Error 2.12 Observations 51
Anova df SS MS F Significance F Regression 3 184.9397 61.6466 13.66 <0.001 Residual 47 212.0733 4.5122 Total 50 397.0130
Coefficients Standard
Error t Stat P-value Lower 95%
Upper 95%
Lower 95.0%
Upper 95.0%
Intercept 12.16 2.42 5.03 0.00 7.30 17.02 7.30 17.02 VSIP -0.64 0.68 -0.94 0.35 -2.02 0.73 -2.02 0.73 Normalized Income
-1.83 0.35 -5.15 0.00 -2.54 -1.11 -2.54 -1.11
ACS Journey to Work
0.0045 0.11 0.04 0.97 -0.22 0.23 -0.22 0.23
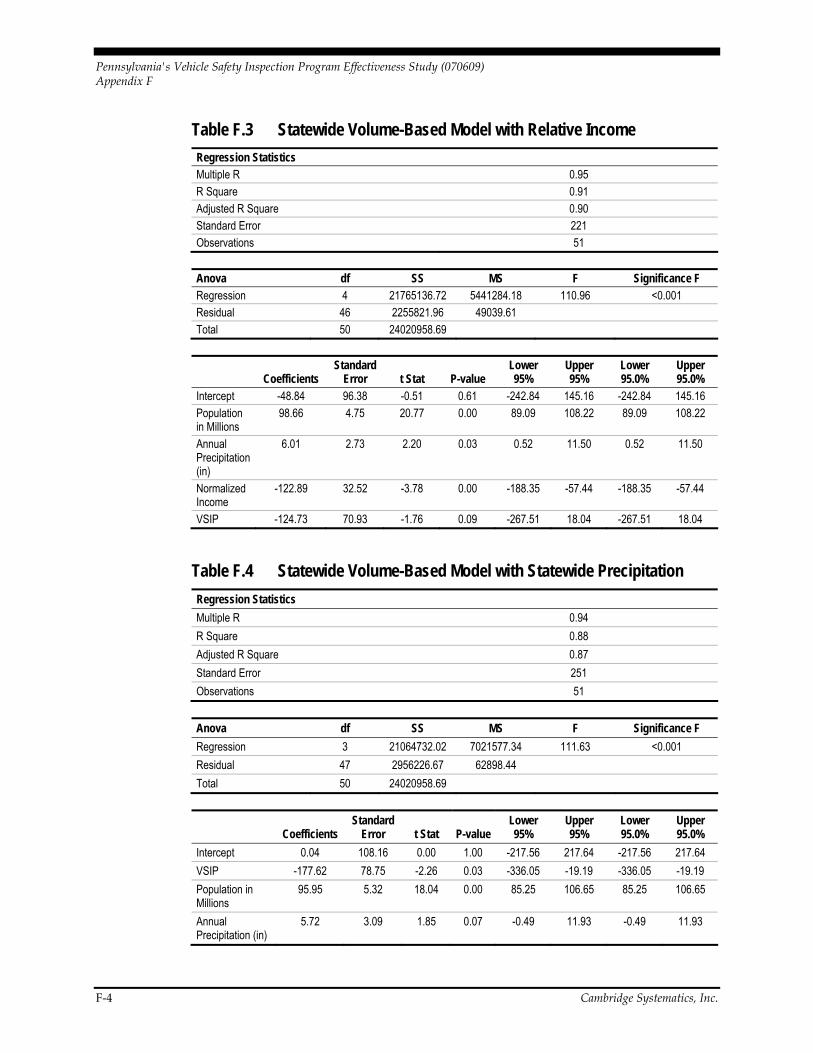
Pennsylvania's Vehicle Safety Inspection Program Effectiveness Study (070609) Appendix F
F-4 Cambridge Systematics, Inc.
Table F.3 Statewide Volume-Based Model with Relative Income Regression Statistics Multiple R 0.95 R Square 0.91 Adjusted R Square 0.90 Standard Error 221 Observations 51
Anova df SS MS F Significance F Regression 4 21765136.72 5441284.18 110.96 <0.001 Residual 46 2255821.96 49039.61 Total 50 24020958.69
Coefficients Standard
Error t Stat P-value Lower 95%
Upper 95%
Lower 95.0%
Upper 95.0%
Intercept -48.84 96.38 -0.51 0.61 -242.84 145.16 -242.84 145.16 Population in Millions
98.66 4.75 20.77 0.00 89.09 108.22 89.09 108.22
Annual Precipitation (in)
6.01 2.73 2.20 0.03 0.52 11.50 0.52 11.50
Normalized Income
-122.89 32.52 -3.78 0.00 -188.35 -57.44 -188.35 -57.44
VSIP -124.73 70.93 -1.76 0.09 -267.51 18.04 -267.51 18.04
Table F.4 Statewide Volume-Based Model with Statewide Precipitation Regression Statistics Multiple R 0.94 R Square 0.88 Adjusted R Square 0.87 Standard Error 251 Observations 51
Anova df SS MS F Significance F Regression 3 21064732.02 7021577.34 111.63 <0.001 Residual 47 2956226.67 62898.44 Total 50 24020958.69
Coefficients Standard
Error t Stat P-value Lower 95%
Upper 95%
Lower 95.0%
Upper 95.0%
Intercept 0.04 108.16 0.00 1.00 -217.56 217.64 -217.56 217.64 VSIP -177.62 78.75 -2.26 0.03 -336.05 -19.19 -336.05 -19.19 Population in Millions
95.95 5.32 18.04 0.00 85.25 106.65 85.25 106.65
Annual Precipitation (in)
5.72 3.09 1.85 0.07 -0.49 11.93 -0.49 11.93
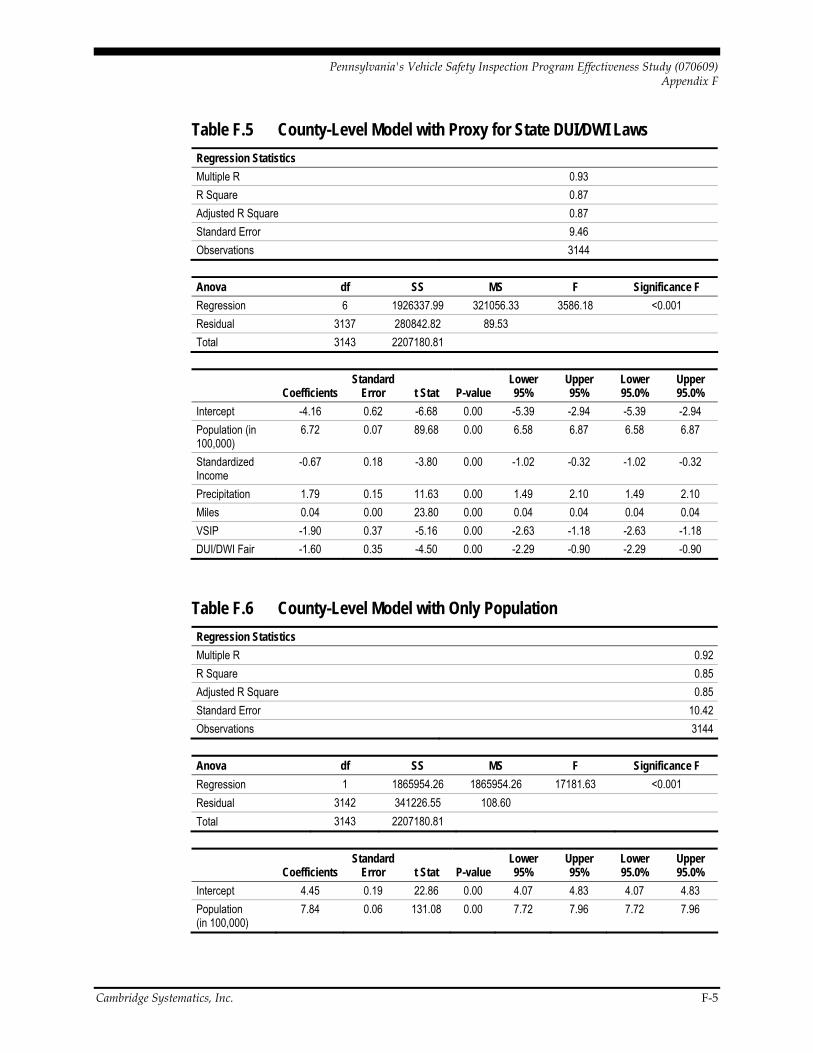
Pennsylvania's Vehicle Safety Inspection Program Effectiveness Study (070609) Appendix F
Cambridge Systematics, Inc. F-5
Table F.5 County-Level Model with Proxy for State DUI/DWI Laws Regression Statistics Multiple R 0.93 R Square 0.87 Adjusted R Square 0.87 Standard Error 9.46 Observations 3144
Anova df SS MS F Significance F Regression 6 1926337.99 321056.33 3586.18 <0.001 Residual 3137 280842.82 89.53 Total 3143 2207180.81
Coefficients Standard
Error t Stat P-value Lower 95%
Upper 95%
Lower 95.0%
Upper 95.0%
Intercept -4.16 0.62 -6.68 0.00 -5.39 -2.94 -5.39 -2.94 Population (in 100,000)
6.72 0.07 89.68 0.00 6.58 6.87 6.58 6.87
Standardized Income
-0.67 0.18 -3.80 0.00 -1.02 -0.32 -1.02 -0.32
Precipitation 1.79 0.15 11.63 0.00 1.49 2.10 1.49 2.10 Miles 0.04 0.00 23.80 0.00 0.04 0.04 0.04 0.04 VSIP -1.90 0.37 -5.16 0.00 -2.63 -1.18 -2.63 -1.18 DUI/DWI Fair -1.60 0.35 -4.50 0.00 -2.29 -0.90 -2.29 -0.90
Table F.6 County-Level Model with Only Population Regression Statistics Multiple R 0.92 R Square 0.85 Adjusted R Square 0.85 Standard Error 10.42 Observations 3144
Anova df SS MS F Significance F Regression 1 1865954.26 1865954.26 17181.63 <0.001 Residual 3142 341226.55 108.60 Total 3143 2207180.81
Coefficients Standard
Error t Stat P-value Lower 95%
Upper 95%
Lower 95.0%
Upper 95.0%
Intercept 4.45 0.19 22.86 0.00 4.07 4.83 4.07 4.83 Population (in 100,000)
7.84 0.06 131.08 0.00 7.72 7.96 7.72 7.96