pem & alkaline electrolyzers bottom-up manufacturing cost ...austinpowereng.com/fuel...
TRANSCRIPT

Austin Power Engineering LLC1 Cameron St
Wellesley, MA 02482USA
© 2017 Austin Power Engineering LLC
PEM & Alkaline Electrolyzers Bottom-up Manufacturing Cost Analysis
Yong Yang
Austin Power
November 8, 2017
David Hart
E4tech

12017 YY/DH
Water electrolysis could play a significant role in the future energy system …
Introduction Market Overview
Roadmap for electrolyser deployment by application. Source: 2014 FCH-JU study on water electrolysis
Consolidated views on rollout potential
Germany is considering to support roll-out of ~1GW
of electrolysers in the 2020ies timeframe
Multi MW demo projects in industry
A 2017 study commissioned by the FCHJU found that by 2025, an estimated cumulative electrolyser capacity of 2.8 GW could be installed in Europe
0
500
1,000
1,500
2,000
2,500
3,000
2010 2015 2020 2025 2030
[EUR/kW] Capital cost for Alkaline systems
Alkaline (all data)Central caseRange
0
500
1,000
1,500
2,000
2,500
3,000
2010 2015 2020 2025 2030
[EUR/kW] Capital cost for PEM systems
PEM (all data)Central caseRange
22017 YY/DH
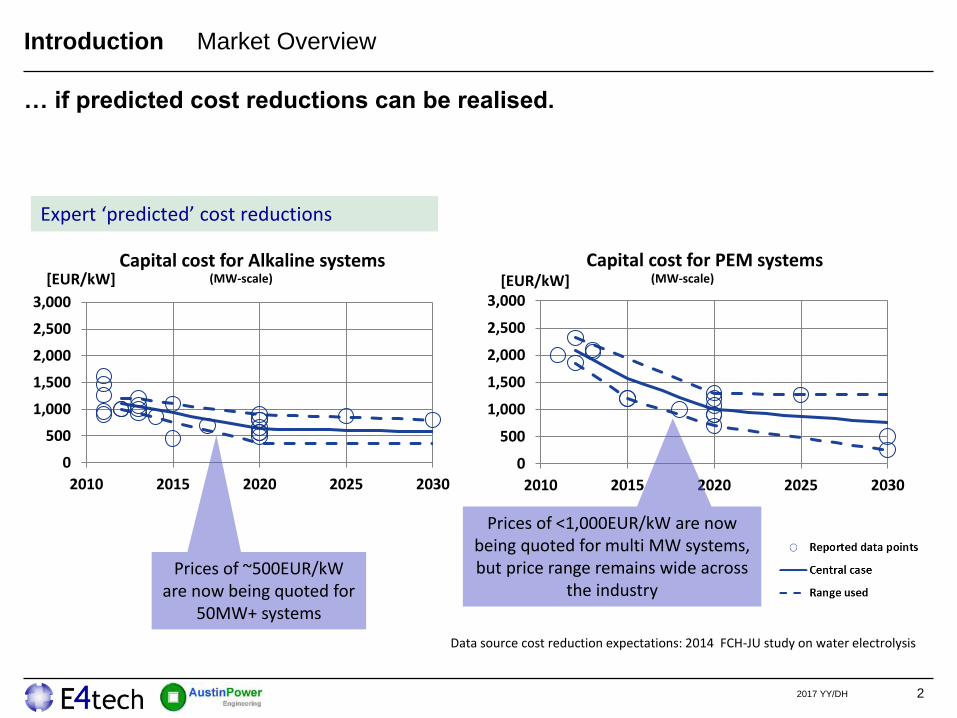
… if predicted cost reductions can be realised.
Introduction Market Overview
Data source cost reduction expectations: 2014 FCH-JU study on water electrolysis
Expert ‘predicted’ cost reductions
Prices of ~500EUR/kW are now being quoted for
50MW+ systems
(MW-scale) (MW-scale)
Prices of <1,000EUR/kW are now being quoted for multi MW systems, but price range remains wide across
the industry

32017 YY/DH
Today’s electrolyser market is comparatively small, the industry landscape is highly fragmented and no single design dominates
Introduction Market Overview
• Perhaps 4% of global hydrogen supply is
produced via electrolysis (incl. Chlor-Alkali)
• Larger (> 50 kW) water electrolysis systems
are typically deployed for continuous operation.
Examples are fertilisers and methanol
production, fats & oils, float glass, …
• The industry is highly fragmented, with a few
established players and many start-ups / new
entrants – and cost reduction potential
18%
4%
48%
30%
Coal gasification
Electrolysis
Natural gas reforming
Refinery/Chemical off-gases
18%
4%
48%
30%
Coal gasification
Electrolysis
Natural gas reforming
Refinery/Chemical off-gases
Source: IEA (2007)
18%
4%
48%
30%
Coal gasification
Electrolysis
Natural gas reforming
Refinery/Chemical off-gases
18%
4%
48%
30%
Coal gasification
Electrolysis
Natural gas reforming
Refinery/Chemical off-gases
Source: IEA (2007)
Chemistry Manufacturing Capacity
(MW/year)
Revenue
(million USD/year)
Alkaline ~300 MW ~100
PEM ~ 50 MW ~50
Total ~350 MW ~150
Rough estimates – revenue varies year-
on-year dependent on individual projects.
Current manufacturing capacities are
underutilised, but could be scaled up
quickly if demand rises.
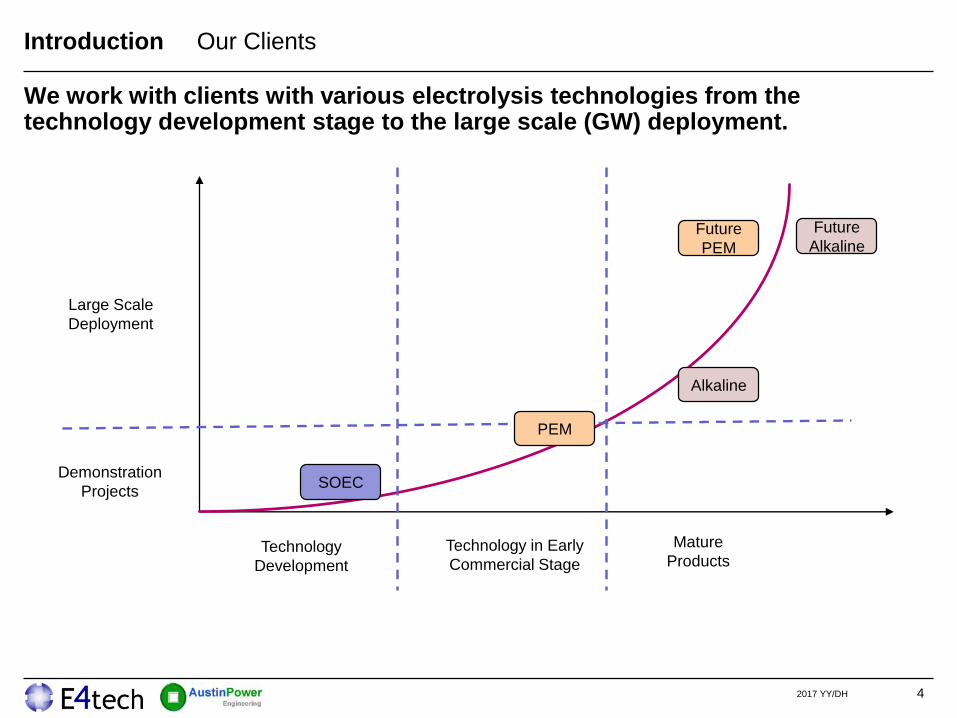
We work with clients with various electrolysis technologies from the technology development stage to the large scale (GW) deployment.
42017 YY/DH
Technology
Development
Technology in Early
Commercial Stage
Mature
Products
Demonstration
Projects
Large Scale
Deployment
PEM
SOEC
Alkaline
Future
AlkalineFuture
PEM
Introduction Our Clients

5
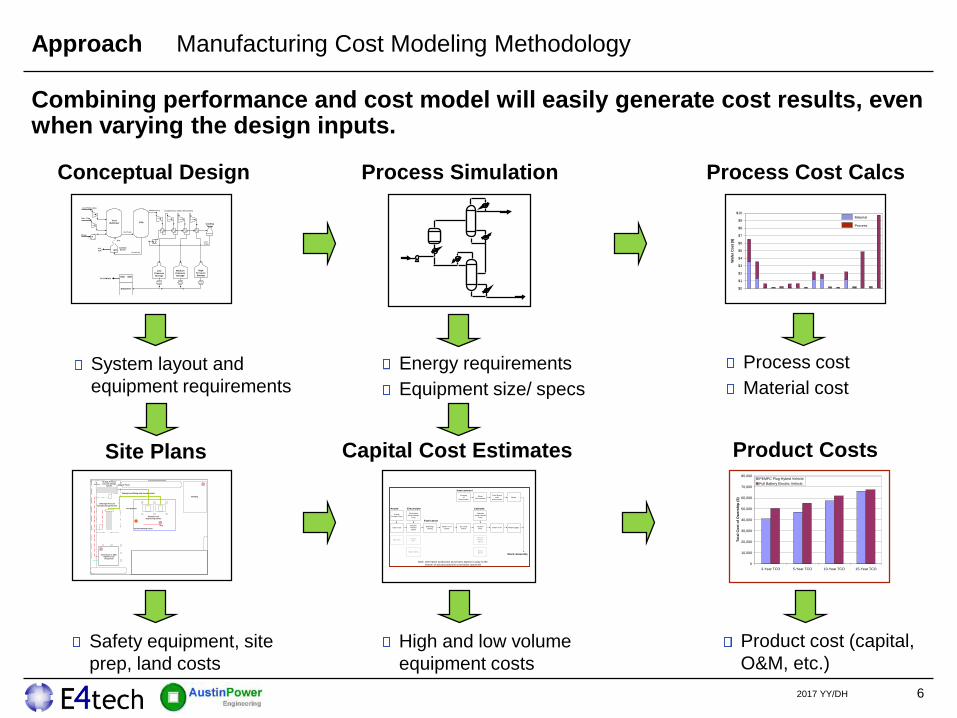
Approach Manufacturing Cost Modeling Methodology
This approach has been used successfully for estimating the cost of various technologies for commercial clients and the DOE.
Technology
Assessment
Manufacturing
Cost Model
Scenario
Analyses
Verification &
Validation
• Literature research• Definition of system and component diagrams• Size components• Develop bill-of-materials (BOM)
• Define system value chain• Quote off-shelve parts and materials• Select materials• Develop processes• Assembly bottom-up cost model •Develop baseline costs
• Technology scenarios• Sensitivity analysis • Economies of Scale• Supply chain & manufacturing system optimization• Life cycle cost analysis
• Cost model internal verification reviews• Discussion with technical developers• Presentations to project and industrial partners• Audition by independent reviewers
Membrane
8.0%
Stack
Conditioning
2.7%
Seal
8.4%
Balance of Stack
2.4%
Bipolar Plate
26.1%
GDL
5.1%
Electrode
41.0%
Stack Assembly
6.3%
2017 YY/DH
Anode Ink
Anode Side
Catalyst Layer
Membrane
Processes
Cathode Side
Catalyst Layer
Cathode Ink
Hot Press
Lamination
Purchased GDL
Purchased GDL
Pt
Pt
Nafion®
Ionomer
99.9% 98.5%
99.9% 98.5%
99% 98.5%
100% 98.5%99% 98.5%
99% 98.5%
100% 100%
100% 100%
100% 100%
100% 100%
100% 100%
0
10,000
20,000
30,000
40,000
50,000
60,000
70,000
80,000
3-Year TCO 5-Year TCO 10-Year TCO 15-Year TCO
To
tal
Co
st
of
Ow
ers
hip
($
)
PEMFC Plug Hybrid Vehicle
Full Battery Electric Vehicle
6
Combining performance and cost model will easily generate cost results, even when varying the design inputs.
2017 YY/DH
Process Simulation
Energy requirements
Equipment size/ specs
Product Costs
Product cost (capital,
O&M, etc.)
Conceptual Design
System layout and
equipment requirements
Capital Cost EstimatesSite Plans
Safety equipment, site
prep, land costs
High and low volume
equipment costs
Air (POX only)
Nat. Gas
Water
Fuel
Reformer PSA
H2-rich gas
H2-poor gas
Catalytic
Burner
HeatCold
Water
99.99% pure H2
Low
Pressure
Storage
Medium
Pressure
Storage
High
Pressure
Storage
Flow
cntrlr
Flow
cntrlrFlow
cntrlr
Dispenser
To Vehicle
CO2
H2O
Compressor with intercoolers
Cooling
Tower
Process cost
Material cost
Tape Cast
Anode
Powder Prep
Vacuum
Plasma
Spray
Electrolyte
Small Powder
Prep
Screen
Cathode
Small Powder
Prep
Sinter in Air
1400CSinter in Air
Forming
of
Interconnect
Shear
Interconnect
Vacuum
Plasma
Spray
Slurry
Spray
Screen
Slurry Spray
Slip Cast
Finish Edges
Note: Alternative production processes appear in gray to the
bottom of actual production processes assumed
Braze
Paint Braze
onto
Interconnect
Blanking /
Slicing
QC Leak
Check
Interconnect
Fabrication
Electrolyte CathodeAnode
Stack Assembly
Fuel Station Perimeter
Electrolyzer or SMR,
High-Pressure
Compressor
H2 High Pressure
Cascade Storage
System
Gaseous Fuel
Dispensing Islands
Underground Piping with shared conduit
Vent
Building
Covered Fueling Island
CNG High Pressure
Cascade Storage System
Fire Detector
Walls with minimum fire rating of 2 hours
Wall openings (doors & windows)
Building intake vents
Adjoining property that can be built on
Public sidewalks, parked vehicles
Streets
Railroad tracks
Other flammable gas storage
5 ft
25 ft
50 ft
10 ft
15 ft
10 ft
15 ft
10 ft
Minimum set-back distances for hydrogen and/or natural gas
storage (more stringent gas noted if relevant)
Property of:
TIAX LLC
1061 De Anza Blvd.
Cupertino, CA 95014
Task 5 CNG/Hydrogen Fueling
Site Plan - Fueling Station
Hydrogen and CNG fueling station
SIZE DWG BY DWG NO REV
A Stefan Unnasch B0228 - S0022 1
SCALE 1" = 8 ft 5 Jan 2004 SHEET 1 OF 110 ft
Security FenceNG line in
ft
ft
ft
ft
ft
ft
ft
ft
Process Cost Calcs
Material
Process
$0
$1
$2
$3
$4
$5
$6
$7
$8
$9
$10
Lapp
ing
CM
P
Wet
ther
mal
Oxida
tion
Spin
Coa
ting
Wet
Etc
hing
SiO
2
DC S
putte
ring
Ni
RF S
putte
ring
E
Spin
Coa
ting
Stepp
er
DC S
putte
ring
Ag
Stripp
ing
Spin
Coa
ting
Stepp
er
Dry
Etc
hing
SiO
2
DRIE
Si
Wet
Etc
hing
SiO
2
Dry
Etc
hing
NI
Wafe
r C
ost
($)
Approach Manufacturing Cost Modeling Methodology
0
10,000
20,000
30,000
40,000
50,000
60,000
70,000
80,000
3-Year TCO 5-Year TCO 10-Year TCO 15-Year TCO
To
tal
Co
st
of
Ow
ers
hip
($
)
PEMFC Plug Hybrid Vehicle
Full Battery Electric Vehicle

7
Austin Power Engineering’s manufacturing cost models can be used to determine a fully loaded selling price to consumers at high or low volumes.
DirectLabor
DirectMaterials
FactoryExpense
GeneralExpense
SalesExpense
Profit
Consumer
Selling Price
Fixed Costs
• Equipment and Plant
Depreciation
• Tooling Amortization
• Equipment Maintenance
• Utilities
• Building
• Indirect Labor
• Cost of capital
• Overhead Labor
Variable Costs
• Manufactured Materials
• Purchased Materials
• Fabrication Labor
• Assembly Labor
• Indirect Materials
Corporate Expenses
• Research and Development
• Sales and Marketing
• General & Administration
• Warranty
• Taxes
Approach Manufacturing Cost Structure
Manufacturing
Cost
We assume 100% financing with an annual discount rate of 10%, a 10-year equipment life, a 25-year building life, and three months working capital.
2012 YY
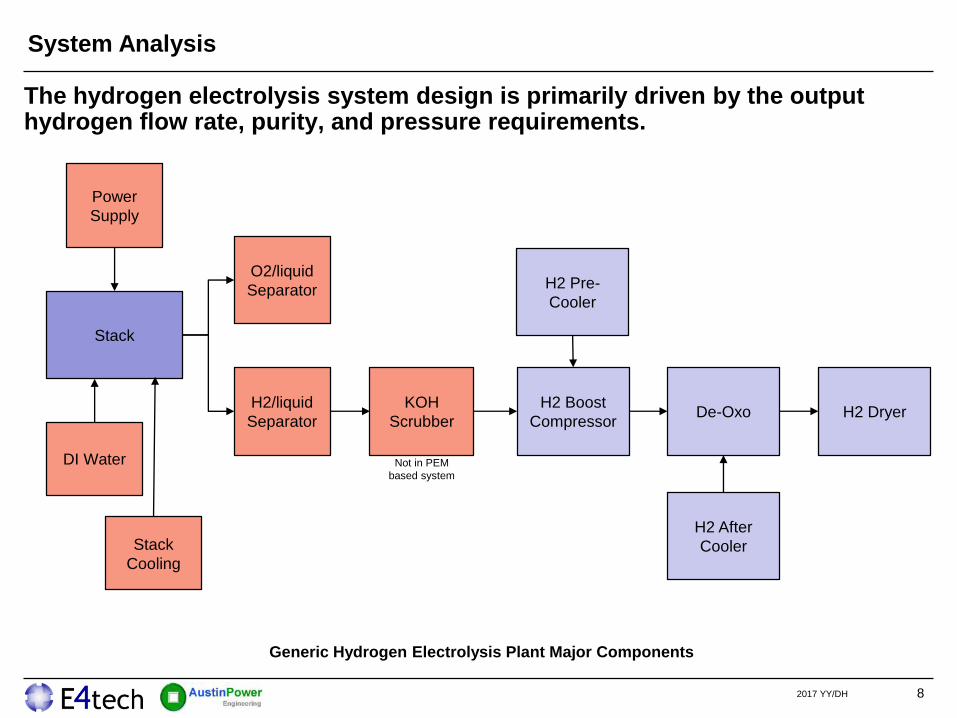
The hydrogen electrolysis system design is primarily driven by the output hydrogen flow rate, purity, and pressure requirements.
System Analysis
82017 YY/DH
Stack
Power
Supply
DI Water
O2/liquid
Separator
H2/liquid
Separator
KOH
Scrubber
H2 Boost
CompressorDe-Oxo H2 Dryer
Stack
Cooling
H2 Pre-
Cooler
H2 After
Cooler
Generic Hydrogen Electrolysis Plant Major Components
Not in PEM
based system

9
Different Alkaline system and stack designs can be tested in in different scenarios
Alkaline System Stack Specifications
2017 YY/DH
Alkaline Unit Current Future
System size MW <120 MW GW
Stack size Nm3/h 0.5 ~1,500 10,000
Stack power MW ~6 ~50
System pressure Barg 0.02 ~ 30 0.02 ~ 30
System H2 purity % 99.999% 99.999%
Active cell area m² ~ 3 ~ 3
Cell voltage V 1.8 1.8
Current density A/cm² 0.2 0.6 ~ 0.8
Membrane material Zirfon type Zirfon type
Anode / cathode material Ni, NiAl, Ni, NiAl, NiMoAl, etc
Cell frame material Carbon steel with coating Carbon steel with coating / Ni
Bipolar plate material Ni coated carbon steel Ni coated carbon steel / Ni

10
In Alkaline stacks, higher current densities are key to reducing costs, but all options are subject to fundamental limits.
Alkaline System Stack Cost Analysis
2017 YY/DH
Cost contributors Pathways to cost reduction Identified limits
Membrane and
electrodes
Increase current density and
reduce materials use through
innovative component design and
advanced electrode materials
Industry reports 0.6 to 0.8 A/cm² as
a long term target. Limitation is
acceptable efficiency at high
currents. (Current density today
typically: 0.2 A/cm²)
Cell frame Reduce material use through
large cell concepts with a better
ratio between active area and
frame area
Mechanical stability of cell
components, depending on stack
pressure level
Cell frame material Replace by (cheaper) injection
moulded thermal plastic, though
mechanical stability at pressure
may be limited
Mechanical stability of thermal
plastic

11
Different PEM system and stack characteristics for current and future designs can be tested in in different scenarios
PEM System Stack Specifications
2017 YY/DH
PEM Unit Current Future
System size MW <5 MW GW
Stack size kW <5MW >10MW
System Pressure Barg 10~30 10 ~30
H2 Purity % 99.999% 99.999%
Active cell area cm² ~ 0.2 > 1
Current density A/cm² 1 ~2 > 2
Membrane material Nafion 200µm Nafion 200µm
Catalyst Ir, Pt Ir, Pt
Catalyst loading mg/cm² ~ 5 < 1
Conductive porous layer Ti foam Ti foam
Screen pack plates Ti meshFunction replaced by flow field
plates
Bipolar plate Ti foil Ti foil; or SS316 with Ti coating
Cell frame material Ti or polymer based Polymer based with metal inlay

12
PEM cost reduction opportunities are strongly related to the reduced use of high price materials, though other components contribute.
PEM System Cost Analysis
2017 YY/DH
Cost contributors Pathways to cost reduction Identified limits
Components made of
titanium
(cell frame, screen pack,
porous plate)
Reduce use of titanium in
components. Make bi-polar
plates of steel plus titanium
coating instead of full titanium.
Increase current density.
Titanium (high material and
processing cost)
expected to remain as the
material of choice for ‘acidic’
electrolysers
Electrode catalysts Material changes using
advanced catalyst support
structures, mixed metal oxides
and nano-structured catalysts.
Precious metal cost and
catalyst activity for acceptable
efficiency. Goals are:
- 0.3mg/cm² Iridium - Anode
- 0.1mg/cm² Pt - Cathode
Supplied membrane High volume orders and/or
dedicated production
Costly fluorine chemistry in
Nafion production

13
At the GW scale electrolysis plant, centralized BOP system might lead to a lower system cost.
System BOP Cost Analysis
2017 YY/DH
Cost contributors Pathways to cost reduction
Power supply 100MW+ electrolyzers mean lower engineering cost for
each individual rectifier. ~20 MW rectifier units are
common in other industries (aluminium smelters, chlor-
alkali electrolysis)
Gas/liquid separator
/ KOH Scrubber
Integrated KOH scrubber with gas/liquid separator will
reduce the overall cost
H2 booster compressor Pressurized stack design will eliminate the H2 booster
compressor
Deoxo unit Select low temperature catalyst will help reduce the vessel
material cost as well as reduce the H2 gas cooling unit
cost. Differential pressure PEM design can eliminate need
for de-oxo unit
H2 dryer Thermal swing adsorption dryer will have higher H2 gas
output (not consume H2 in regeneration step) which is
more important in the large scale applications
14
‘Expert-predicted’ cost reductions seem plausible and could make electrolysis much more competitive
Conclusions
2017 YY/DH
• Alkaline system and PEM system have broadly similar system costs at the high capacity
applications
• Alkaline cost reduction is quite sensitive to volume production (reduce the process
costs) and increased current density
• PEM routes to cost reduction include volume production, system scale-up,
reduction of expensive materials, and increased current density
• PEM could ultimately be lower cost than Alkaline, but PEM is less mature so future cost
is sensitive to a number of uncertain technology development assumptions
• BoP costs (mainly power supply) start to dominate system cost at high production
volumes, when other cost components have been compressed already
• Other technology may be interesting to analyse, for example SOEC

15
Thank You!
2017 YY/DH
Contact: Yong YangAustin Power Engineering LLC
1 Cameron StWellesley MA 02482
USA
Tel: +1 [email protected]
www.austinpowereng.com
Contact: David Hart E4tech
Av. Juste-Olivier 2 1006 Lausanne
Switzerland
Tel: +41 21 331 [email protected]
www.e4tech.com