pelagic fishes trends - calfed science program - home … · 2010-06-25 · the 2005 pelagic...
TRANSCRIPT

1
2005 Status and Trends of Four Pelagic Fishes of the upper San Francisco Estuary
Kathryn Hieb, Marade Bryant, Michael Dege, Tom Greiner, Steven Slater, and Kelly Souza (DFG), [email protected] Introduction The 2005 Pelagic Organism Decline Fishes Status and Trends report includes data from 4 of IEP’s long-term monitoring surveys in the San Francisco Estuary: 1) the Summer Townet Survey (TNS), 2) the Fall Midwater Trawl Survey (FMWT), 3) the San Francisco Bay Study (Bay Study), and 4) the Delta Smelt 20-mm Survey (20-mm Survey). The most recent abundance indices, long-term abundance trends, and distributional information are presented for delta smelt, longfin smelt, striped bass, and threadfin shad. All 4 species spawn and rear in the upper estuary and have undergone severe declines in recent years. Abundance indices through 2005 are presented for all surveys except the FMWT, which will not complete 2005 sampling until mid-December; FMWT trends through 2004 are discussed. Methods The TNS has been conducted annually since 1959, except for 1966, 1983, and 2002. It produces annual abundance indices for age-0 striped bass (= the 38-mm index) and age-0 delta smelt. The TNS begins in June and samples 32 sites from eastern San Pablo Bay to Rio Vista on the Sacramento River and Stockton on the San Joaquin River. Historically the number of surveys ranged from 2 to 5 each year; as of 2003, it was standardized to 6 surveys per year. The striped bass index is interpolated between the 2 surveys that bracket the mean size of 38.1-mm fork length (FL) (Chadwick 1964, Turner and Chadwick 1972). The delta smelt index is the average of the first 2 survey indices. The 2005 TNS completed 6 surveys at 2 week intervals from June 13 to August 26, 2005. The FMWT has sampled annually since 1967, with the exception of 1974 and 1979. It was designed to determine the relative abundance and distribution of age-0 striped bass in the estuary, but data is also used for other upper estuary pelagic species. The FMWT survey currently samples 116 stations monthly from September to December in an area ranging from San Pablo Bay to Stockton on the San Joaquin River and Hood on the Sacramento River. The index calculation (Stevens 1977) uses catch data from 100 of the 116 stations; the remaining 16 stations increase spatial coverage for delta smelt. The 2005 survey will not be completed until mid-December, so only data through 2004 are included. The Bay Study has sampled from South San Francisco Bay to the western delta monthly with an otter trawl and midwater trawl since 1980. There are a few data gaps, most significantly limited sampling with the midwater trawl in 1994 and no winter sampling from 1989 to 1997. Abundance indices are routinely calculated for 35+ pelagic and demersal fishes and several species of crabs and caridean shrimp from the lower to the upper estuary. The Bay Study samples 52 stations, of which 35 have been consistently sampled since 1980 and are used for the
This is a draft work in progress subject to review and revision as information becomes available.

2
abundance indices. Additional information about the study, including index calculation, can be found in IEP Technical Report 63 (Baxter et al. 1999).
The 20-mm Survey monitors larval and juvenile delta smelt distribution and relative abundance throughout their historical spring range, which includes the entire delta downstream to San Pablo Bay and the Napa River. This survey gets its name from the size (20 mm) at which delta smelt are retained and readily identifiable at the Central Valley Project and State Water Project fish salvage facilities and the target size for efficiency of the survey sampling net. Surveys have been conducted every other week from early March through July since 1995. Three tows are completed at each of the 48 stations with a 1,600 µm mesh net (Dege and Brown 2004). The 2005 20-mm Survey completed 9 surveys at 2 week intervals from March 14 to July 9. The 20-mm delta smelt index is the geometric mean of station CPUE (catch/10,000 cubic meters) per survey. These monthly geometric means are summed over the 4 surveys that bracket the average delta smelt size of 20 mm FL, the size at which the gear is most efficient.
Physical Setting Winter 2004-05 delta outflow was the lowest since winter 2000-01, but March 2005 outflow was the second highest for 2001-05, April 2005 outflow was the highest since 1999, and May 2005 outflow was the highest since 1998 (Figure 1). The outflow pattern in 2005 was very different from recent years, with a modest peak of 843 cms (mean daily outflow at Chipps Island) in January, a second peak of 1046 cms in March, and the largest peak of 1404 cms in May. Delta smelt The delta smelt (Hypomesus transpacificus) is a small (55-70 mm) species endemic to the upper San Francisco Estuary. This osmerid was listed as a state and federal threatened species in 1993. Historically one of the most common species in the estuary, the population declined dramatically in the early 1980s. Delta smelt is considered environmentally sensitive because it typically lives for 1 year, has a limited diet, and resides primarily in the interface between salt and fresh water. In addition, females produce only 1,000 to 3,000 eggs and the planktonic larvae have a low survival rate. Possible reasons for the delta smelt's decline include reductions in fresh water outflow, extremely high fresh water outflows (which push them too far down the estuary), entrainment losses at water diversions, changes in food type and abundance, toxic substances, disease, competition, and predation.
The 2005 20-mm Survey delta smelt index was 15.5 (Figure 2A), a modest increase from 2004. Initial catch results indicated no strong spawning events through April, but unlike the past several years, the early larval distribution was centered downstream of the confluence. Later surveys (May and June) never detected a strong cohort and overall abundance remained low. Unlike 2004, the 2005 spawning window (ca. 14-18˚C) extended into early June. This was most likely due to high flows moderating water temperatures into June.
Over much of spring and early summer, delta smelt were scattered throughout the Suisun area and upstream to the confluence of the Sacramento and San Joaquin rivers. This distribution pattern is believed to be favorable to young delta smelt because of higher productivity of the
This is a draft work in progress subject to review and revision as information becomes available.
3
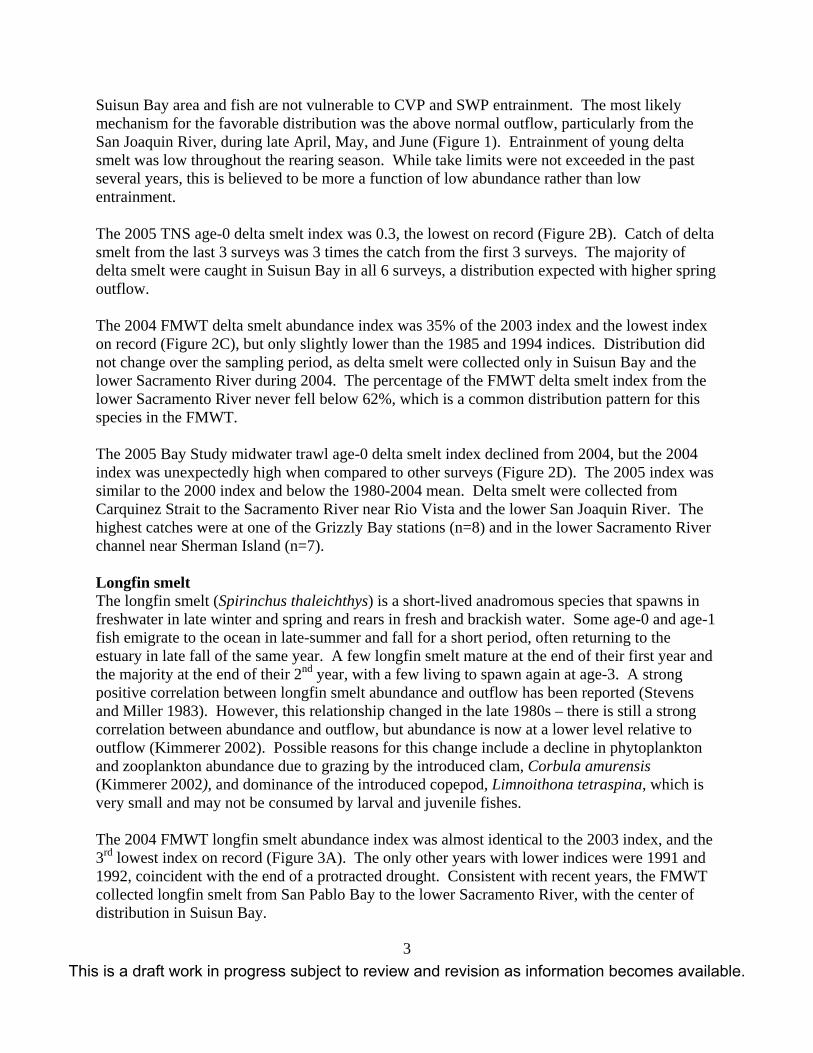
Suisun Bay area and fish are not vulnerable to CVP and SWP entrainment. The most likely mechanism for the favorable distribution was the above normal outflow, particularly from the San Joaquin River, during late April, May, and June (Figure 1). Entrainment of young delta smelt was low throughout the rearing season. While take limits were not exceeded in the past several years, this is believed to be more a function of low abundance rather than low entrainment.
The 2005 TNS age-0 delta smelt index was 0.3, the lowest on record (Figure 2B). Catch of delta smelt from the last 3 surveys was 3 times the catch from the first 3 surveys. The majority of delta smelt were caught in Suisun Bay in all 6 surveys, a distribution expected with higher spring outflow. The 2004 FMWT delta smelt abundance index was 35% of the 2003 index and the lowest index on record (Figure 2C), but only slightly lower than the 1985 and 1994 indices. Distribution did not change over the sampling period, as delta smelt were collected only in Suisun Bay and the lower Sacramento River during 2004. The percentage of the FMWT delta smelt index from the lower Sacramento River never fell below 62%, which is a common distribution pattern for this species in the FMWT. The 2005 Bay Study midwater trawl age-0 delta smelt index declined from 2004, but the 2004 index was unexpectedly high when compared to other surveys (Figure 2D). The 2005 index was similar to the 2000 index and below the 1980-2004 mean. Delta smelt were collected from Carquinez Strait to the Sacramento River near Rio Vista and the lower San Joaquin River. The highest catches were at one of the Grizzly Bay stations (n=8) and in the lower Sacramento River channel near Sherman Island (n=7). Longfin smelt The longfin smelt (Spirinchus thaleichthys) is a short-lived anadromous species that spawns in freshwater in late winter and spring and rears in fresh and brackish water. Some age-0 and age-1 fish emigrate to the ocean in late-summer and fall for a short period, often returning to the estuary in late fall of the same year. A few longfin smelt mature at the end of their first year and the majority at the end of their 2nd year, with a few living to spawn again at age-3. A strong positive correlation between longfin smelt abundance and outflow has been reported (Stevens and Miller 1983). However, this relationship changed in the late 1980s – there is still a strong correlation between abundance and outflow, but abundance is now at a lower level relative to outflow (Kimmerer 2002). Possible reasons for this change include a decline in phytoplankton and zooplankton abundance due to grazing by the introduced clam, Corbula amurensis (Kimmerer 2002), and dominance of the introduced copepod, Limnoithona tetraspina, which is very small and may not be consumed by larval and juvenile fishes. The 2004 FMWT longfin smelt abundance index was almost identical to the 2003 index, and the 3rd lowest index on record (Figure 3A). The only other years with lower indices were 1991 and 1992, coincident with the end of a protracted drought. Consistent with recent years, the FMWT collected longfin smelt from San Pablo Bay to the lower Sacramento River, with the center of distribution in Suisun Bay.
This is a draft work in progress subject to review and revision as information becomes available.
4
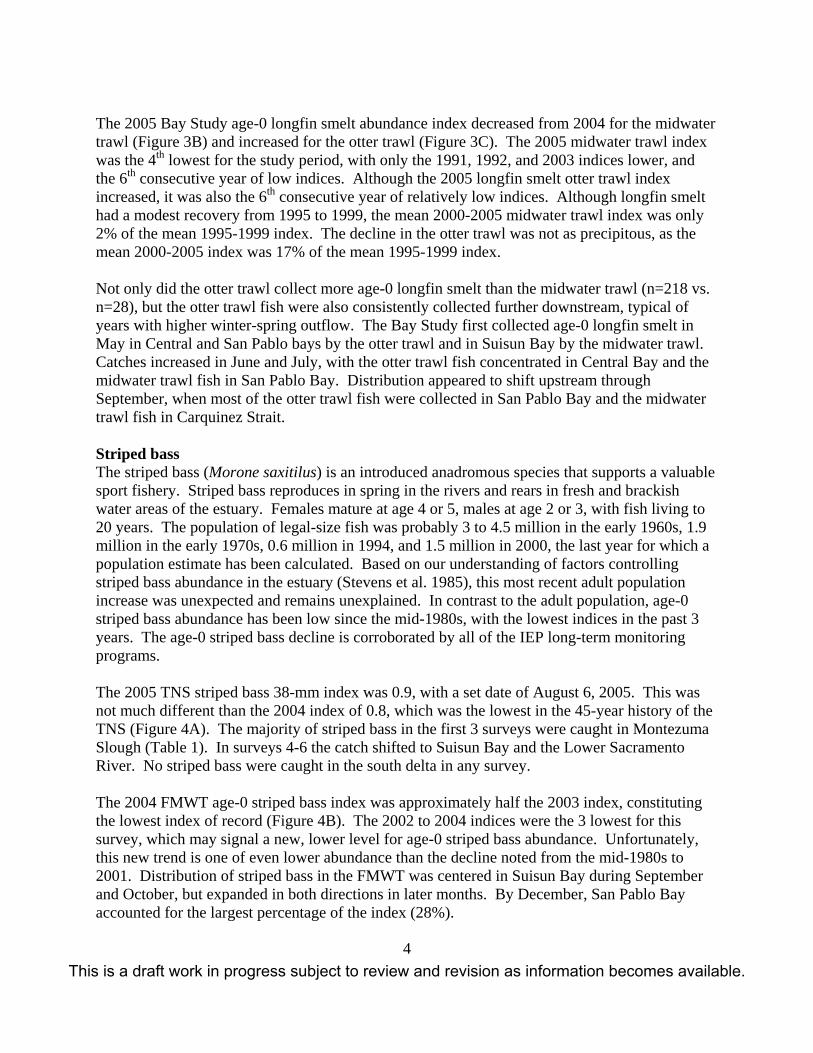
The 2005 Bay Study age-0 longfin smelt abundance index decreased from 2004 for the midwater trawl (Figure 3B) and increased for the otter trawl (Figure 3C). The 2005 midwater trawl index was the 4th lowest for the study period, with only the 1991, 1992, and 2003 indices lower, and the 6th consecutive year of low indices. Although the 2005 longfin smelt otter trawl index increased, it was also the 6th consecutive year of relatively low indices. Although longfin smelt had a modest recovery from 1995 to 1999, the mean 2000-2005 midwater trawl index was only 2% of the mean 1995-1999 index. The decline in the otter trawl was not as precipitous, as the mean 2000-2005 index was 17% of the mean 1995-1999 index. Not only did the otter trawl collect more age-0 longfin smelt than the midwater trawl (n=218 vs. n=28), but the otter trawl fish were also consistently collected further downstream, typical of years with higher winter-spring outflow. The Bay Study first collected age-0 longfin smelt in May in Central and San Pablo bays by the otter trawl and in Suisun Bay by the midwater trawl. Catches increased in June and July, with the otter trawl fish concentrated in Central Bay and the midwater trawl fish in San Pablo Bay. Distribution appeared to shift upstream through September, when most of the otter trawl fish were collected in San Pablo Bay and the midwater trawl fish in Carquinez Strait. Striped bass The striped bass (Morone saxitilus) is an introduced anadromous species that supports a valuable sport fishery. Striped bass reproduces in spring in the rivers and rears in fresh and brackish water areas of the estuary. Females mature at age 4 or 5, males at age 2 or 3, with fish living to 20 years. The population of legal-size fish was probably 3 to 4.5 million in the early 1960s, 1.9 million in the early 1970s, 0.6 million in 1994, and 1.5 million in 2000, the last year for which a population estimate has been calculated. Based on our understanding of factors controlling striped bass abundance in the estuary (Stevens et al. 1985), this most recent adult population increase was unexpected and remains unexplained. In contrast to the adult population, age-0 striped bass abundance has been low since the mid-1980s, with the lowest indices in the past 3 years. The age-0 striped bass decline is corroborated by all of the IEP long-term monitoring programs. The 2005 TNS striped bass 38-mm index was 0.9, with a set date of August 6, 2005. This was not much different than the 2004 index of 0.8, which was the lowest in the 45-year history of the TNS (Figure 4A). The majority of striped bass in the first 3 surveys were caught in Montezuma Slough (Table 1). In surveys 4-6 the catch shifted to Suisun Bay and the Lower Sacramento River. No striped bass were caught in the south delta in any survey. The 2004 FMWT age-0 striped bass index was approximately half the 2003 index, constituting the lowest index of record (Figure 4B). The 2002 to 2004 indices were the 3 lowest for this survey, which may signal a new, lower level for age-0 striped bass abundance. Unfortunately, this new trend is one of even lower abundance than the decline noted from the mid-1980s to 2001. Distribution of striped bass in the FMWT was centered in Suisun Bay during September and October, but expanded in both directions in later months. By December, San Pablo Bay accounted for the largest percentage of the index (28%).
This is a draft work in progress subject to review and revision as information becomes available.

5
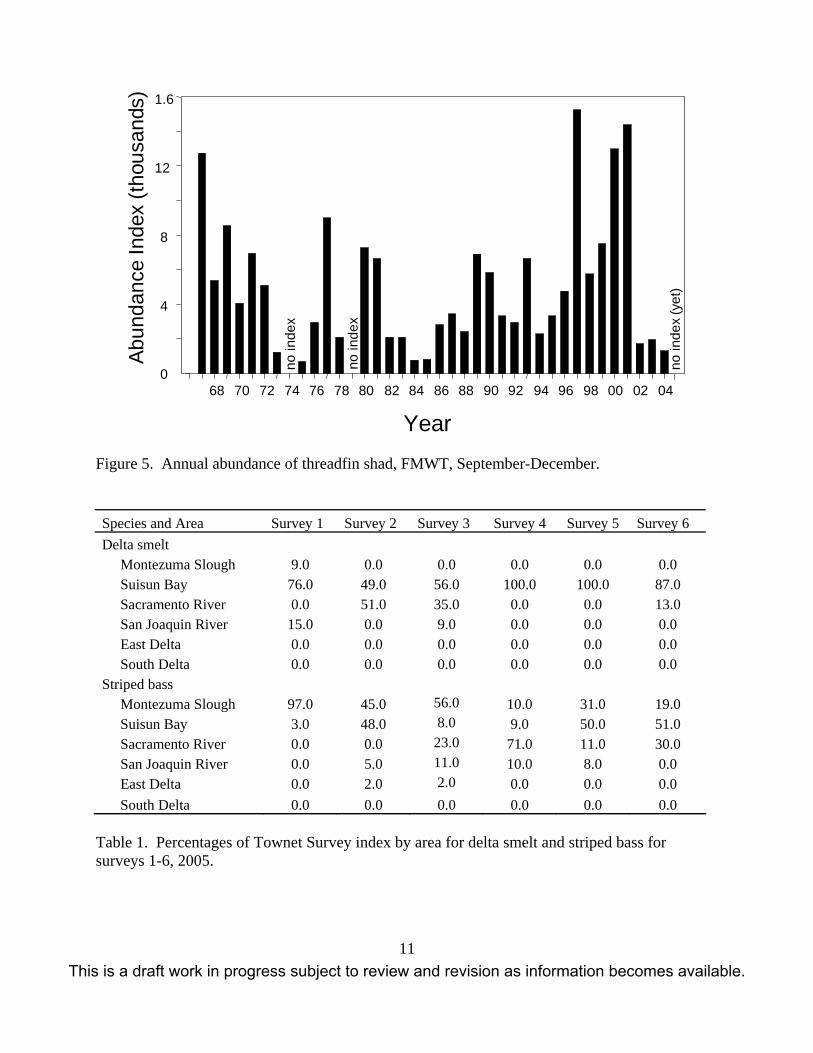
Both the 2005 Bay Study otter trawl and midwater trawl age-0 striped bass abundance indices increased from 2004 (Figures 4C and 4D), as expected with the higher late spring outflow, but they remained the 6th lowest for the study period. Similar to the TNS and FMWT indices, Bay Study age-0 striped bass indices have been low since the mid-1980s, with the past 4 years at record lows. The mean 2002-2005 annual midwater trawl index was only 19% of the mean 1995-2001 index while the mean 2002-2005 otter trawl index was 36% of the mean 1995-2001 index. Overall, the otter trawl collects far more age-0 striped bass than the midwater trawl; from May-October 2005, the otter trawl collected 590 age-0 bass while the midwater trawl collected only 90. The Bay Study otter trawl also collected a larger portion of age-0 striped bass in the San Joaquin River in 2005, specifically at the Santa Clara Shoal (n=137) and Old River Flats (n=111) stations. The first age-0 fish were collected in June, with most from Carquinez Strait and Suisun Bay and a few from the Honker Bay and the lower Sacramento and San Joaquin rivers. Catches increased in July, especially at the San Joaquin River shoal stations - 44% of the age-0 striped bass were collected from the San Joaquin River, 53% from downstream of the confluence, and the remainder from the Sacramento River. Distribution slowly shifted upstream through summer and fall: in October, 62% were collected from the lower San Joaquin River, 24% from the lower Sacramento River, and the remaining 14% downstream of the confluence. Threadfin shad The threadfin shad (Dorosoma petenense) is a small, short-lived introduced species that is a planktivore at all life stages. It reproduces in freshwater but can be found throughout the upper estuary. In river systems it is most common in slower moving waters, such as dead-end sloughs. Due to its primarily freshwater distribution and summer-fall spawning period, only the FMWT captures this species well. The 2004 FMWT threadfin shad index was very low for the 3rd consecutive year (Figure 5). This is a drastic change from recent years, as 3 of the 5 years prior to 2002 had record high indices. In all months the majority of threadfin shad was collected in the lower San Joaquin River and the eastern Delta, especially in the Stockton Deep Water Channel between the Calaveras River and Fourteenmile Slough. However, distribution expanded westward in December, when 45% of the index was from stations in San Pablo Bay, Carquinez Strait, and Suisun Bay.
This is a draft work in progress subject to review and revision as information becomes available.

6
References
Baxter, R., K. Hieb, S. DeLeón, K. Fleming, and J. Orsi. 1999. Report on the 1980-1995 fish,
shrimp, and crab sampling in the San Francisco Estuary, California. J. Orsi, editor. IEP Technical Report 63, 503 pp.
Chadwick, H.K. 1964. Annual abundance of young striped bass, Roccus saxatilis, in the
Sacramento-San Joaquin Delta, California. California Fish and Game. 50(2):69-99. Dege, M. and L.R. Brown. 2004. Effect of outflow on spring and summertime distribution and
abundance of larval and juvenile fishes in the upper San Francisco Estuary. In: Early Life History of Fishes in the San Francisco Estuary and Watershed, F. Feyrer, L.R. Brown, R.L. Brown, and J.J. Orsi, editors. American Fisheries Society, Symposium 39, Bethesda, Maryland, pp 49-65.
Kimmerer, W.J. 2002. Effects of freshwater flow on abundance of estuarine organisms: physical
effects or trophic linkages? Marine Ecology Progress Series 243:39-55. Stevens, D.E. 1977. Striped bass (Morone saxatilis) monitoring techniques in the Sacramento-
San Joaquin Estuary. In: Proceedings of the conference on assessing the effects of power-plant-induced mortality on fish populations. W.Van Winkle, editor, pp. 91-109. Pergamon Press, New York, New York, USA.
Stevens, D.E. and L.W. Miller. 1983. Effects of river flow on abundance of young Chinook
salmon, American shad, longfin smelt, and delta smelt in the Sacramento-San Joaquin River System. North American Journal of Fisheries Management 3(4):425-437.
Stevens, D.E., D.W. Kohlhorst, L.W. Miller, and D.W. Kelley. 1985. The decline of striped
bass in the Sacramento-San Joaquin Estuary, California. Transactions of the American Fisheries Society 114:12-30.
Turner, J.L. and H.K. Chadwick. 1972. Distribution and abundance of young-of-the-year
striped bass, Morone saxatilis, in relation to river flow in the Sacramento-San Joaquin Estuary. Transactions of the American Fisheries Society. 101(3):442-52.
This is a draft work in progress subject to review and revision as information becomes available.

7
0
1
2
3
4
5
6
7
8
Year
Del
ta O
utflo
w (c
ms
x100
0)
1995 1996 1997 1998 1999 2000 2001 2002 2003 2004 2005
Figure 1. Mean daily outflow at Chipps Island by month, January 1995-September 2005, cms. Dashed vertical lines are between December and January.
This is a draft work in progress subject to review and revision as information becomes available.

8
Abun
danc
e In
dex
Year
Fall MWT
60 62 64 66 68 70 72 74 76 78 80 82 84 86 88 90 92 94 96 98 00 02 040
600
1200
1800
no in
dex
no in
dex
no in
dex
(yet
)
TNS
0
10
20
30
40
50
60
70
60 62 64 66 68 70 72 74 76 78 80 82 84 86 88 90 92 94 96 98 00 02 04
no in
dex
no in
dex
no in
dex
Bay Study MWT
60 62 64 66 68 70 72 74 76 78 80 82 84 86 88 90 92 94 96 98 00 02 040
1000
2000
3000
no in
dex
20-mm Survey
0
10
20
30
40
50
60 62 64 66 68 70 72 74 76 78 80 82 84 86 88 90 92 94 96 98 00 02 04
A
B
C
D
Figure 2. Annual abundance of delta smelt: A. 20-mm Survey larvae and juveniles B. TNS age-0 C. FMWT, all sizes, September-December D. Bay Study midwater trawl age-0, June-October
This is a draft work in progress subject to review and revision as information becomes available.

9
Abun
danc
e In
dex
(thou
sand
s)
Year
Fall MWT
Bay Study MWT
82 60 31 63
68 70 72 74 76 78 80 82 84 86 88 90 92 94 96 98 00 02 040
6
12
18
191 299 555 63
0
20
40
60
68 70 72 74 76 78 80 82 84 86 88 90 92 94 96 98 00 02 04no
inde
x
Bay Study OT
0
20
40
60
68 70 72 74 76 78 80 82 84 86 88 90 92 94 96 98 00 02 04
128 258 153
no in
dex
no in
dex
no in
dex
(yet
)
A
B
C
Figure 3. Annual abundance of longfin smelt: A. FMWT, all sizes, September-December B. Bay Study midwater trawl age-0, May-October C. Bay Study otter trawl age-0, May-October
This is a draft work in progress subject to review and revision as information becomes available.

10
Abun
danc
e In
dex
Year
Fall MWT
0
5
10
15
20
25
60 62 64 66 68 70 72 74 76 78 80 82 84 86 88 90 92 94 96 98 00 02 04
(thou
sand
s)
no in
dex
no in
dex
no in
dex
(yet
)
TNS
0
40
80
120
60 62 64 66 68 70 72 74 76 78 80 82 84 86 88 90 92 94 96 98 00 02 04
no in
dex
no in
dex
no in
dex
Bay Study MWT
0
20
40
60
80
60 62 64 66 68 70 72 74 76 78 80 82 84 86 88 90 92 94 96 98 00 02 04
(thou
sand
s)
no in
dex
Bay Study OT80
0
20
40
60
60 62 64 66 68 70 72 74 76 78 80 82 84 86 88 90 92 94 96 98 00 02 04
(thou
sand
s)
A
B
C
D
Figure 4. Annual abundance of age-0 striped bass: A. TNS 38-mm index B. FMWT, September-December C. Bay Study midwater trawl, June-October D. Bay Study otter trawl, June-October
This is a draft work in progress subject to review and revision as information becomes available.
11
Abun
danc
e In
dex
(thou
sand
s)
Year
0
4
8
12
1.6
68 70 72 74 76 78 80 82 84 86 88 90 92 94 96 98 00 02 04
no in
dex
no in
dex
no in
dex
(yet
)
Figure 5. Annual abundance of threadfin shad, FMWT, September-December. Species and Area Survey 1 Survey 2 Survey 3 Survey 4 Survey 5 Survey 6 Delta smelt Montezuma Slough 9.0 0.0 0.0 0.0 0.0 0.0 Suisun Bay 76.0 49.0 56.0 100.0 100.0 87.0 Sacramento River 0.0 51.0 35.0 0.0 0.0 13.0 San Joaquin River 15.0 0.0 9.0 0.0 0.0 0.0 East Delta 0.0 0.0 0.0 0.0 0.0 0.0 South Delta 0.0 0.0 0.0 0.0 0.0 0.0 Striped bass Montezuma Slough 97.0 45.0 56.0 10.0 31.0 19.0 Suisun Bay 3.0 48.0 8.0 9.0 50.0 51.0 Sacramento River 0.0 0.0 23.0 71.0 11.0 30.0 San Joaquin River 0.0 5.0 11.0 10.0 8.0 0.0 East Delta 0.0 2.0 2.0 0.0 0.0 0.0 South Delta 0.0 0.0 0.0 0.0 0.0 0.0
Table 1. Percentages of Townet Survey index by area for delta smelt and striped bass for surveys 1-6, 2005.
This is a draft work in progress subject to review and revision as information becomes available.