peeling the onion: the real cost of mail. report number ... · peeling the onion: the real cost of...
TRANSCRIPT
Cover
Peeling the Onion: The Real Cost of Mail
RARC ReportReport Number RARC-WP-16-009
April 18, 2016

Executive Summary
When Congress passed the Postal Accountability and Enhancement Act (PAEA) in 2006, it established a new set of regulatory incentives designed to increase the U.S. Postal Service’s efficiency. As PAEA’s 10th anniversary approaches, we revisit postal cost trends to evaluate how well the Postal Service has been managing its costs.1
Our study compares costs, mail volumes, and work hours, highlighting notable changes that have taken place since 2006. The Postal Service’s financial problems are well known and widely reported. Our research shows that these problems stem less from a failure of cost management and more from mandated contributions to future retiree health benefits. The Postal Service has managed to control its costs in the face of declining volume and revenue. Our analysis of cost data since 2006 shows that the Postal Service has reduced its labor cost by over $10 billion during the last 9 years, when adjusting for inflation and removing prefunding. It reduced the number of career employees, increased its use of non-career employees, significantly reduced work hours, downsized and restructured its network, reduced the use of expensive air transportation, and reduced the number of its delivery routes. However, it also reduced both its service quality and capital expenditures, trends that could undercut its long-term performance.
If the Postal Service is to act like a business, it must balance cost saving efforts with adequate service levels and modernizing its infrastructure.
1 This is the second paper the U.S. Postal Service Office of Inspector General (OIG) has published on the subject of Postal Service costs. The first paper examined the Postal Service cost structure for FY 2010. The Cost Structure of the Postal Service: Facts, Trends, and Policy Implications, Report No. RARC-WP-11-007. http://www.uspsoig.gov/sites/default/files/document-library-files/2015/rarc-wp-11-007_0_0.pdf.
Highlights
Between 2006 to 2015, the Postal Service handled 1.8 trillion pieces of mail. The Postal Service would have broken even with 3.1 cents in cost savings, or additional revenue or a combination of both. Of the 3.1 cents in Postal Service losses, 2.8 cents is due to Retiree Health Benefits (RHB).
The number and cost of workhours are down, even with the increase in delivery points. The less expensive non-career employees have increased by 3 percent each year on average since 2006.
Prefunding of future RHB can cause labor cost to appear as a disproportionally high percentage of the Postal Service’s total cost. The Postal Service has actually decreased its labor expenditures by about $10 billion since FY 2006, when adjusting for inflation and removing prefunding.
Future Postal Service success hinges upon providing excellent service and making needed capital expenditures to modernize its existing network’s capabilities to support 21st Century postal demands.
Peeling the Onion: The Real Cost of Mail Report Number RARC-WP-16-009 1

The following are the key findings of this paper:
■ During the 2006 to 2015 timeframe, the Postal Service reduced its network costs by consolidating plants, reducing work hours, and keeping average real wage rates relatively flat. In fact, total factor productivity made greater gains following the Great Recession of 2008, a period characterized with steep volume declines, than it did in the previous era of increasing volume. It is generally more difficult to increase productivity when volume is falling.
■ Adjusting the cost data for both inflation and prefunding reveals that the Postal Service has decreased its total expenditures by about $13.7 billion since FY 2006.
■ Labor reductions account for $10.2 billion of these savings, but prefunding has obscured this achievement. Excluding prefunding, the Postal Service reduced its labor cost by nearly 21 percent from 2006 to 2015. With prefunding, labor expense, as a proportion of total expenditures, remained essentially unchanged.
■ Delivery costs have been falling by about 1.5 percent annually since 2006. This declining trend is significant given that both population and delivery points are increasing and a high proportion of delivery costs are fixed.
Peeling the Onion: The Real Cost of Mail Report Number RARC-WP-16-009 2
■ The Postal Service’s capital spending pales in comparison to that of its competitors. The Postal Service’s total revenue, when adjusted for inflation, was 115 percent higher than FedEx and 46 percent higher than that of UPS for the period of 2006 to 2014. Yet, Postal Service’s total capital expenditures summed to slightly above $13 billion, adjusted for inflation, over the same time-period. Conversely, FedEx and UPS capital expenditures summed to approximately $25.5 billion and $18.5 billion, respectively.
■ Postal Service capital spending did not even keep pace with its own depreciation and amortization. Even if the Postal Service were not to modernize its infrastructure, it would still need to invest to maintain its capital assets.
■ Between 2006 and 2015, the Postal Service handled 1.8 trillion pieces of mail. The Postal Service would have broken even with 3.1 additional cents per mail piece in cost savings, or additional revenue, or a combination of both, including prefunding. When comparing the per-piece losses suffered by the Postal Service to the average per-piece prefunding cost (2.8 cents), it is clear that prefunding is the primary driver of the losses. Eliminating retiree health benefits payments would have reduced the Postal Service’s total losses by 90 percent.
Table of Contents
CoverExecutive Summary......................................................................................1Observations ................................................................................................4
Introduction ..............................................................................................4A Significant Shift in Productivity .......................................................4Cost Trends: 2006 to 2015 .................................................................6Peeling the Onion: A Better Representation of Postal Service Expenses ...................................................................7
Slicing the Cost Pie .................................................................................8The Labor Cost Slice ..........................................................................8Labor Cost Trends ....................................................................10Operating Costs — At a Glance .....................................................12Capital Spending .............................................................................14
It’s the Prefunding .................................................................................16Conclusion .............................................................................................17Summary of Management’s Comments ................................................17Evaluation of Management’s Comments ...............................................17
Appendices .................................................................................................19Appendix A: References ........................................................................20Appendix B: Management’s Comments ................................................22
Contact Information ....................................................................................24
Peeling the Onion: The Real Cost of Mail Report Number RARC-WP-16-009 3
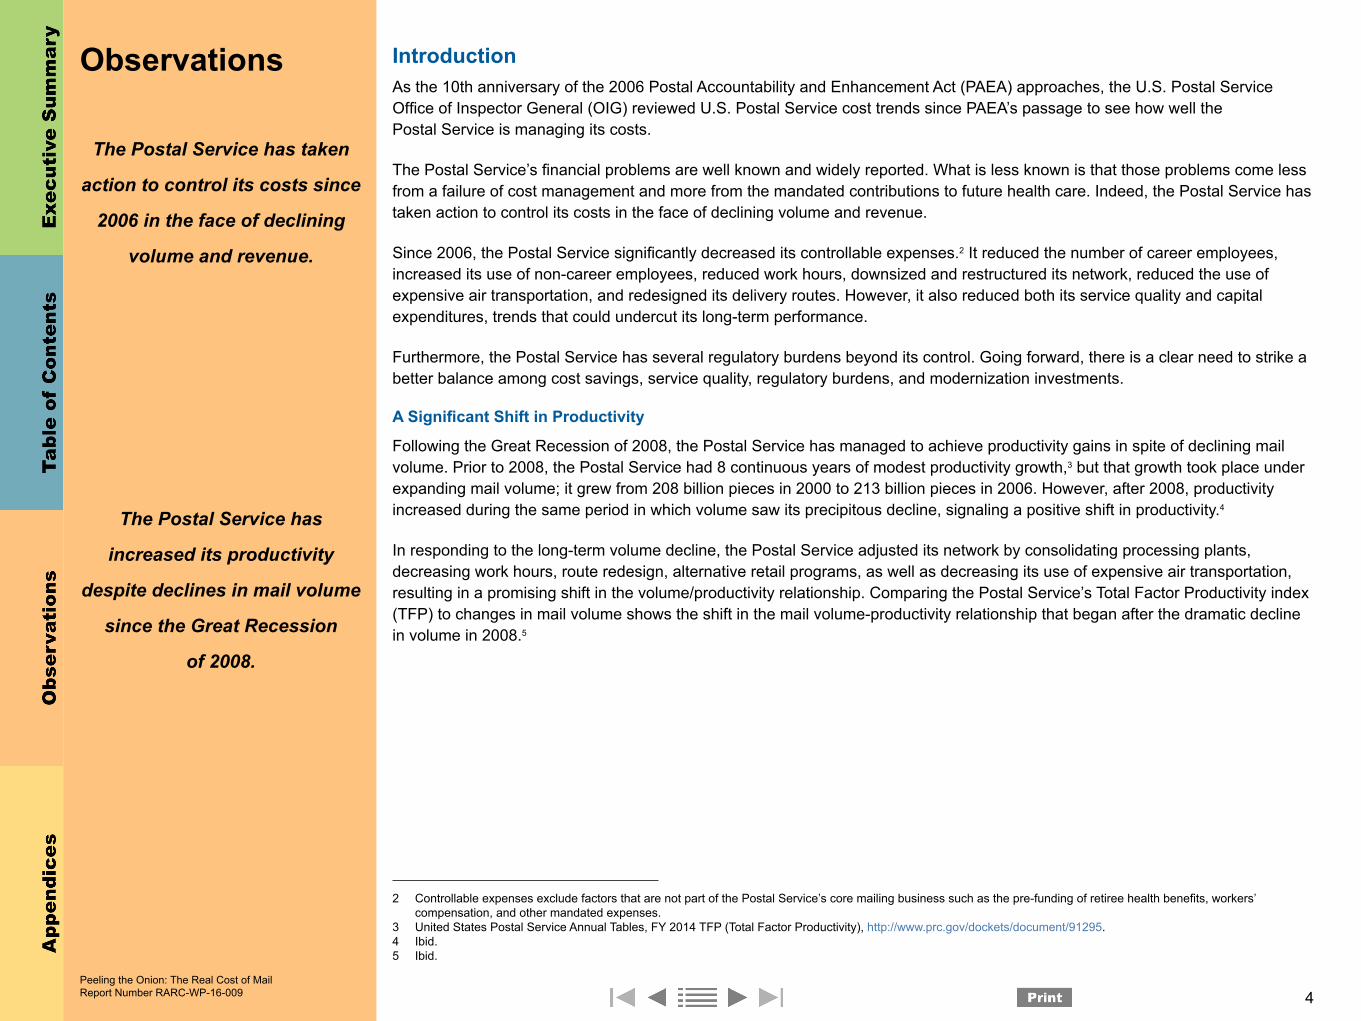
Observations IntroductionAs the 10th anniversary of the 2006 Postal Accountability and Enhancement Act (PAEA) approaches, the U.S. Postal Service Office of Inspector General (OIG) reviewed U.S. Postal Service cost trends since PAEA’s passage to see how well the Postal Service is managing its costs.
The Postal Service’s financial problems are well known and widely reported. What is less known is that those problems come less from a failure of cost management and more from the mandated contributions to future health care. Indeed, the Postal Service has taken action to control its costs in the face of declining volume and revenue.
Since 2006, the Postal Service significantly decreased its controllable expenses.2 It reduced the number of career employees, increased its use of non-career employees, reduced work hours, downsized and restructured its network, reduced the use of expensive air transportation, and redesigned its delivery routes. However, it also reduced both its service quality and capital expenditures, trends that could undercut its long-term performance.
Furthermore, the Postal Service has several regulatory burdens beyond its control. Going forward, there is a clear need to strike a better balance among cost savings, service quality, regulatory burdens, and modernization investments.
A Significant Shift in Productivity
Following the Great Recession of 2008, the Postal Service has managed to achieve productivity gains in spite of declining mail volume. Prior to 2008, the Postal Service had 8 continuous years of modest productivity growth,3 but that growth took place under expanding mail volume; it grew from 208 billion pieces in 2000 to 213 billion pieces in 2006. However, after 2008, productivity increased during the same period in which volume saw its precipitous decline, signaling a positive shift in productivity.4
In responding to the long-term volume decline, the Postal Service adjusted its network by consolidating processing plants, decreasing work hours, route redesign, alternative retail programs, as well as decreasing its use of expensive air transportation, resulting in a promising shift in the volume/productivity relationship. Comparing the Postal Service’s Total Factor Productivity index (TFP) to changes in mail volume shows the shift in the mail volume-productivity relationship that began after the dramatic decline in volume in 2008.5
2 Controllable expenses exclude factors that are not part of the Postal Service’s core mailing business such as the pre-funding of retiree health benefits, workers’ compensation, and other mandated expenses.
3 United States Postal Service Annual Tables, FY 2014 TFP (Total Factor Productivity), http://www.prc.gov/dockets/document/91295. 4 Ibid.5 Ibid.
The Postal Service has taken
action to control its costs since
2006 in the face of declining
volume and revenue.
The Postal Service has
increased its productivity
despite declines in mail volume
since the Great Recession
of 2008.
Peeling the Onion: The Real Cost of Mail Report Number RARC-WP-16-009 4

Figure 1: Mail Volume and Total Factor Productivity, 1972-2014
Sources: OIG Analysis of U.S. Postal Service Annual Report Data and USPS Annual TFP Tables, 1972-2014.
Overall, the Postal Service took about 6 years to adjust its operations to reflect lower mail volumes, thereby increasing productivity and keeping cost per piece low. However, the Postal Service cost reductions have had implications for service quality.
The tradeoffs among cost control, service quality, and modernization remain a concern for the Postal Service. As the Postal Service reduces its costs, it should not ignore the impact this has on service and the need to modernize.
There are two aspects to managing service quality: 1) setting service standards, and 2) meeting those standards. The Postal Service eliminated the overnight service standard for single-piece First-Class Mail in January 2015,6 and did not reach its stated performance goals for any First-Class Mail category in fiscal year (FY) 2015.7
It is unclear whether service complaints resulted from the lowered service standards, or the erratic service performance in meeting those standards.8 What is clear is that the impact of cost reductions on customer service has been considerable. A recent OIG
6 In addition to eliminating the overnight service standard for single-piece First-Class Mail, the Postal Service also relaxed service standards for Standard Mail as part of its load leveling effort. See U.S. Postal Service 2015 10-K, http://about.usps.com/who-we-are/financials/10k-reports/fy2015.pdf, p. 18 and 46.
7 U.S. Postal Service, “Annual Report on Service Performance for Market Dominant Products,” http://www.prc.gov/dockets/document/94402, p. 8. 8 Service performance concerns were raised in recent Congressional hearings on Postal Service issues. U.S. Senate Committee on Homeland Security and Governmental
Affairs, Full Committee Hearing video: “Laying Out the Reality of the United States Postal Service,” January 21, 2016, http://www.hsgac.senate.gov/hearings/laying-out-the-reality-of-the-united-states-postal-service.
As the Postal Service reduces
its costs, it should not ignore
service quality.
Peeling the Onion: The Real Cost of Mail Report Number RARC-WP-16-009 5

report found that External First Class Measurement (EXFC) scores for single piece First-Class Mail declined by as much as 6.71 percent for 2-day service right after the service standard revisions as compared to the same period last year (SPLY). Likewise, scores declined by as much as 38.60 percent for 3-day service right after the service standard revisions as compared to the SPLY.9 Overall, FY 2015 service performance was worse than the previous year in most mail classes and product categories, perhaps in part due to network operational changes.10
Cost Trends: 2006 to 2015
There were two significant changes in the Postal Service major cost categories between 2006 and 2015: 1) declining labor cost and 2) increasing obligations for retiree health benefits (RHB).11 Figure 2 shows the compound average growth rate (CAGR)12 for each major Postal Service cost category.13 All three Postal Service categories have decreased on average since 2006.
Figure 2: Annual Change in Postal Service Expenses, Adjusted for Inflation 2006-2015
Sources: OIG Analysis of U.S. Postal Service Annual Reports and Bureau of Labor Statistics CPI Data, 2006-2015.
9 U.S. Postal Service Office of Inspector General, Management Alert – Substantial Increase in Delayed Mail, Report No. NO-MA-15-004, August 13, 2015, http://www.uspsoig.gov/sites/default/files/document-library-files/2015/no-ma-15-004.pdf, p. 3.
10 U.S. Postal Service, “Annual Report on Service Performance for Market Dominant Products,” http://www.prc.gov/dockets/document/94402.11 In order to be consistent with real volume, real labor hour data, and other such real physical resource data, we adjust the nominal dollar cost of such items for inflation.
In other words, inflation can obscure efficiency gains by giving a false appearance of real increases in real resource use. Unless noted otherwise, our analysis expresses financial values in constant 2006 dollars to make “apples-to-apples” cost comparisons.
12 Compound annual growth rate (CAGR): The average growth rate over a period of time, typically a year. Compound annual return = [(Ending Value / Beginning Value)^(1 / n)] - 1 where n is the length of time of the investment in years.
13 Labor cost is calculated as the sum of compensation and benefits, RHB premiums, and workers’ compensation. Non-Labor refers to all expenditures not dealing with labor or capital such as materials, services, and transportation costs. Lastly, capital refers to depreciation and amortization.
Peeling the Onion: The Real Cost of Mail Report Number RARC-WP-16-009 6
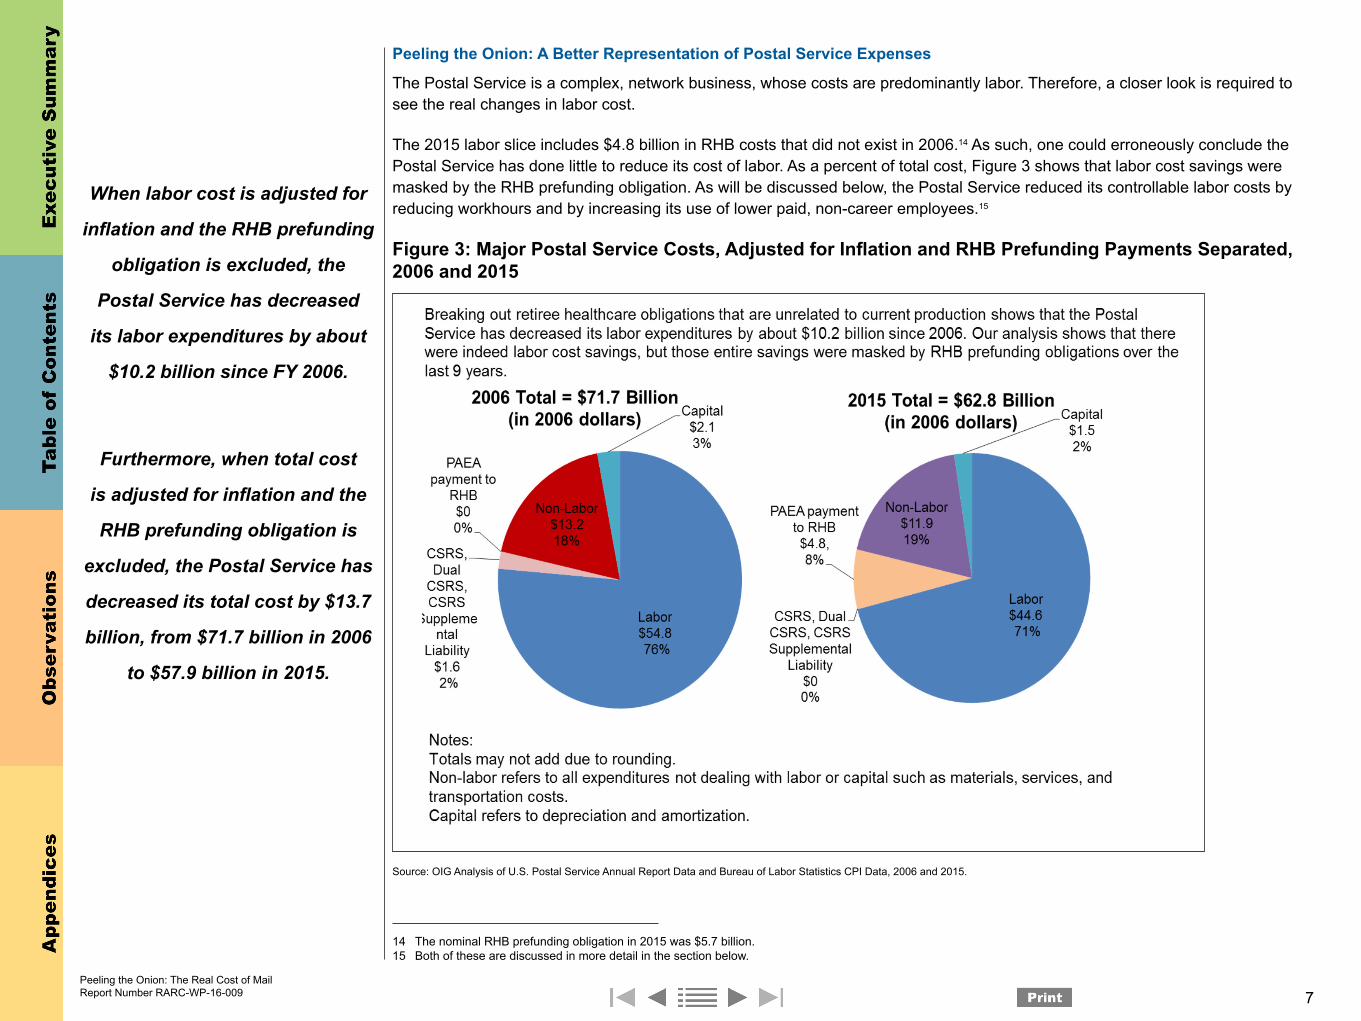
Peeling the Onion: A Better Representation of Postal Service Expenses
The Postal Service is a complex, network business, whose costs are predominantly labor. Therefore, a closer look is required to see the real changes in labor cost.
The 2015 labor slice includes $4.8 billion in RHB costs that did not exist in 2006.14 As such, one could erroneously conclude the Postal Service has done little to reduce its cost of labor. As a percent of total cost, Figure 3 shows that labor cost savings were masked by the RHB prefunding obligation. As will be discussed below, the Postal Service reduced its controllable labor costs by reducing workhours and by increasing its use of lower paid, non-career employees.15
Figure 3: Major Postal Service Costs, Adjusted for Inflation and RHB Prefunding Payments Separated, 2006 and 2015
Source: OIG Analysis of U.S. Postal Service Annual Report Data and Bureau of Labor Statistics CPI Data, 2006 and 2015.
14 The nominal RHB prefunding obligation in 2015 was $5.7 billion.15 Both of these are discussed in more detail in the section below.
When labor cost is adjusted for
inflation and the RHB prefunding
obligation is excluded, the
Postal Service has decreased
its labor expenditures by about
$10.2 billion since FY 2006.
Furthermore, when total cost
is adjusted for inflation and the
RHB prefunding obligation is
excluded, the Postal Service has
decreased its total cost by $13.7
billion, from $71.7 billion in 2006
to $57.9 billion in 2015.
Peeling the Onion: The Real Cost of Mail Report Number RARC-WP-16-009 7

Some cost categories have remained the same and others changed dramatically since 2006. Retiree health benefit premiums, for example, were paid in 2006 and continue as an expense in 2015 — they are classified as labor costs and have increased on average 5.5 percent annually.16 Beginning in 2007, PAEA required the Postal Service to prefund its future obligation of retiree health benefits, specifically including future retirement expenditures to Postal Service costs. Therefore, RHB prefunding payments were not present in 2006. Including them as part of the labor cost in 2015, without making note of this added obligation, can mask the genuine labor savings achieved by the Postal Service.
Note that while it is true that the Postal Service’s labor cost is approximately 80 percent labor in both 2006 and 2015,17 the Postal Service has actually made significant reductions in labor cost in the interim. However, the labor savings over the last 9 years have been masked by the RHB prefunding obligations. The pie chart on the right of Figure 3 separates RHB impact from current labor expenses. Treating the PAEA slice as labor - on the left side of the 2015 pie - disguises the labor savings achieved since 2006 because it brings the proportion of total cost that is labor back up to approximately 80 percent.
To make an “apples-to-apples” comparison, we excluded these expenditures from total cost in 2015. As a result, the Postal Service is shown to have decreased its total cost by $13.7 billion since 2006.
Slicing the Cost PieThe Labor Cost Slice
Labor costs include wages, retiree health benefits, retiree pension payments, health benefits of current employees, and workers’ compensation. There were shifts in each of these categories between 2006 and 2015.
The largest component of labor costs is wages. This cost category has seen the largest decrease annually during the last 9 years for two main reasons. First, the Postal Service decreased workhours on average by 2.8 percent annually.18 Second, the Postal Service began substituting non-career employees for more expensive career employees, by about 3.0 percent on average per year since 2006.19
The left side of Figure 4 compares the Postal Service’s labor expenses between FY 2006 and FY 2015, in constant 2006 dollars. The right side shows the CAGR for each labor category over the same time-period.
16 We recognize that much of the premiums in 2006 (or in any given year) are due to past hiring decisions and not hiring done in 2006.17 The proportion of costs related to labor depends on how RHB prefunding obligation in 2015 is treated. If RHB prefunding obligation cost is included in the total cost for
2015 and is counted as labor, the proportion of costs related to labor of postal operations in 2015 is 79 percent. In addition, the proportion of costs related to labor also depends on how Civil Service Retirement Service (CSRS), Dual CSRS, and CSRS ‘Supplemental Liability’ are treated in 2006. If these retirement expenses are included in the total cost for 2006 and are counted as labor, the proportion of costs related to labor of postal operations in 2006 is approximately 79 percent.
18 OIG analysis based on workhours data from the U.S. Postal Service historical annual reports.19 The number of career employees has decreased on average by 3.8 percent every year since 2006. In 2015, the Postal Service employed about 622,000 workers,
including part-time and seasonal employees. The number of career employees declined to 492,000 in 2015 from 696,138 career employees in 2006. OIG Analysis based on U.S. Postal Service historical annual reports.
Peeling the Onion: The Real Cost of Mail Report Number RARC-WP-16-009 8

Figure 4: Postal Service Labor Expenses, in Constant 2006 Dollars
Source: OIG Analysis of U.S. Postal Service Annual Report Data and Bureau of Labor Statistics CPI Data, 2006 and 2015.
When adjusted for inflation and RHB prefunding obligations, both wages and health benefits for current employees have decreased around 3 percent, while total labor expenses have declined 2.6 percent annually on average.20 The cost reduction is not proportional to the volume decline of 3.5 percent on average since 2006,21 primarily because of significant fixed costs in delivery.22
Workers’ compensation expenses in Figure 4 above are also notable. These expenses are both cash and non-cash — cash expenses that are related to payout for claims, and non-cash expenses that are related to changes to workers’ compensation future liability estimates.23 However, actual annual payouts to Department of Labor (DOL) made in October of each year, for workers’ compensation have been relatively stable, averaging around $1.1 billion for the 2009 to 2015 time-period.24
Figure 5 shows workers’ compensation expenses compared to actual payments to DOL, in constant 2006 dollars for the last 7 years. As can be seen, workers’ compensation expenses often vary significantly from year to year because the Postal Service estimates these costs based on changes in the discount and inflation rates and on the actuarial re-evaluation of existing cases.
20 The labor expenses here include health benefit premiums because the Postal Service made these payments both in 2006 and 2015.21 OIG analysis based on volume data from the U.S. Postal Service historical annual reports.22 “Appendix C. Fixed versus volume variable costs,” http://about.usps.com/strategic-planning/stp2006-2010/appc.htm. 23 Workers’ compensation expenses are based on the measurement of future liability, which is extremely sensitive to changes in economic assumptions. 24 We use end-of-year current liability figures documented in the Postal Service annual reports. These end-of-year figures may not exactly match the actual amounts paid to
DOL because they include an estimated quarter. The U.S. Postal Service annual reports do not report annual payout for workers’ compensation for the years 2006 to 2008.
Postal Service operating labor
expenses have fallen on average
2.6 percent annually since 2006.
Peeling the Onion: The Real Cost of Mail Report Number RARC-WP-16-009 9

Figure 5: Workers’ Compensation Expenses in Constant 2006 Dollars
Source: OIG Analysis of U.S. Postal Service Annual Report Data and Bureau of Labor Statistics CPI Data, 2006 and 2015.
Labor Cost Trends
Since 2006, the Postal Service has responded to the loss of volume and the decline in revenue by reducing workhours and negotiating new contracts with its bargaining employees. This meant that as existing career employees retired, the Postal Service replaced them with both lower paid career employees, as well as non-career ones. For the Postal Service, this has meant that since 2006, total wages in constant 2006 dollars, have been falling 3.1 percent annually on average.25 Similarly, the Postal Service has reduced workhours on average 2.8 percent annually, which also has translated into cost savings. Figure 6 shows both of these declining trends for the last 9 years.
As Figure 6 shows, the greatest impact on the total wage bill comes from the decline in workhours. The decline in wage per workhour is significant but smaller. However, this is to be expected, as wages are typically less responsive than workhours to volume decline.
25 Wages include straight-time pay, as well as overtime pay, vacation pay, sick pay, and other forms of compensation, other than health benefits and workers’ compensation. For a detailed description, see U.S. Postal Service Notice of Filing National Payroll Hours Summary Report Pay Period 26-FY 2014, http://www.prc.gov/content/united-states-postal-service-notice-filing-national-payroll-hours-summary-report-pay-perio-0.
The actual annual payouts
to Department of Labor for
workers’ compensation have
been relatively stable, averaging
$1.1 billion for the last
seven years.
Peeling the Onion: The Real Cost of Mail Report Number RARC-WP-16-009 10

Figure 6: Postal Service Workhours and Wages Trends, 2006-2015
Source: OIG Analysis of U.S. Postal Service Annual Report Data and Bureau of Labor Statistics CPI Data, 2006-2015.
Lowering wages has important cost ramifications beyond simple wage reduction. Historically the Postal Service has had a low turnover rate. According to a recent OIG paper, the Postal Service career employees have had extraordinarily low turnover for career unionized employees — less than 1.3 percent per year since 2008, while the quit rate among private sector employees has varied between 18.7 percent and 23.7 percent since 2008.26
The Postal Service’s quit rate has increased to 29 percent for non-career employees for the fiscal year 2014, perhaps due to low wages and low benefits. This is problematic for the Postal Service because it raises training costs.27 More importantly, it also raises the question of whether the Postal Service can continue to increase its productivity if it has to deal with training and recruiting new employees constantly. Furthermore, the impact on service quality of increased use of non-career employees is unclear.
26 Flexibility at Work: Human Resource Strategies to Help the Postal Service, Report No. RARC-WP-15-004, 2015, http://www.uspsoig.gov/sites/default/files/document-library-files/2015/rarc-wp-15-004_flexibility_at_work-_human_resource_strategies_0.pdf, Pages 12 and 13.
27 Ibid.
Peeling the Onion: The Real Cost of Mail Report Number RARC-WP-16-009 11

Operating Costs — At a Glance
The Postal Service operating costs include significant non-labor and capital costs. In our analysis, we separated these costs into three categories: mail processing costs, delivery costs, and transportation costs. Mail processing and delivery are mostly labor, while purchased transportation is almost all contracted out.
Generally speaking, mail-processing costs are falling, as mail volume declines. Of the $12.2 billion in inflation-adjusted labor costs for clerks and mail handlers, mail processing accounts for the largest share in 2015: $9.3 billion. This category has seen the sharpest decline annually, at 5.5 percent for the period of 2006 to 2015.
Delivery
Delivery costs are also decreasing, but at a slower rate than mail processing. Delivery costs are falling because the Postal Service restructured its delivery operations. In response to falling mail volume, the Postal Service began to eliminate routes in 2008. It eliminated 22,135 routes between 2008 and 2014.28 In 2012, the Postal Service pointed out that it is beginning to reach the limits of the reductions that can be accomplished within the existing network structure and service standards. During 2015, the total number of routes increased by 2,412, absorbing about 1.1 million additional delivery points.29
Delivery costs can be expected to fall at a slower rate owing to the nature of the delivery activity. A certain proportion of delivery costs are inherently unresponsive to volume changes. The network must be traversed each day, by foot or vehicle, without regard to the volume of mail pieces to be delivered. However, the Postal Service has reduced the number of carriers covering this fixed network by reconfiguring routes in order to deliver mail on fewer, longer routes.30 Further, the network has grown since 2006. Delivery points have increased by about 6 percent from 146 million in 2006 to 155 million in 2015.31
Transportation
Purchased transportation is the largest Postal Service expense after compensation. In 2015, the Postal Service spent about $5.6 billion moving mail between cities with contracted highway, air, rail, and water transportation. The Postal Service has actively controlled costs by shifting mail volume from higher cost air transportation to lower cost highway transportation.32
Ground transportation costs have also decreased, partly because Standard Mail is increasingly drop shipped due to workshare discounts.33
Figure 7 shows that all three cost categories have declined over the last 9 years, albeit at different annual rates.
28 Elimination of routes for 2008 to 2013 was calculated using United States Postal Service 2015 Annual Report to Congress, http://about.usps.com/who-we-are/financials/annual-reports/fy2015.pdf. Routes eliminated in 2014 number was calculated using data that comes from U.S. Postal Service electronic data warehouse (EDW).
29 Routes eliminated in 2015 number was calculated using data from U.S. Postal Service EDW database. With respect to delivery points, in 2014, the Postal Service had 153.9 delivery points. In 2015, delivery points increased to 155.0, an increase of about 1.1 million.
30 The Postal Service reduced costs by restructuring its delivery network. Eliminating routes means longer routes and carriers spend more time in the street.31 U.S. Postal Service 2006 and 2015 annual reports.32 The primary driver behind the increase in highway transportation expense resulted from the movement of 281 originating-destinating pairs from air transportation to
ground transportation in 2014. Network and Transportation Operations, http://about.usps.com/publications/annual-report-comprehensive-statement-2014/ar2014/annualreport2014_tech_053.htm.
33 In 2006, the Postal Service transported approximately 2.3 billion pounds of Standard Mail to the carrier station. Because dropshipping has increased, this number dropped to approximately 797 million pounds by 2015. For this data, see Postal Service billing determinants for 2006 and 2015 filed with the PRC, http://www.prc.gov/dockets/search.
Delivery costs have been falling
on average by about 1.5 percent
annually since 2006. This
declining trend is significant
given that both population and
delivery points are increasing,
and a higher proportion of
delivery costs is fixed.
Peeling the Onion: The Real Cost of Mail Report Number RARC-WP-16-009 12

Mail volume is down on average
by almost 4 percent annually,
more mail is being deposited
closer to destination, ground
transportation has increased
as a proportion, and the
Postal Service is moving away
from the more expensive air
transportation.
Yet, transportation costs have
only declined by 0.9 percent
annually since 2006. There
may be room for additional
transportation optimization in
response to volume declines.
Figure 7: Delivery, Mail Processing, and Transportation Costs, Adjusted for Inflation, 2006 to 2015
Source: OIG Analysis of U.S. Postal Service Annual Cost Segments and Components Reports, and Bureau of Labor Statistics CPI Data, 2006 and 2015.
Yet, transportation costs have only declined by 0.9 percent annually since 2006. There may be room for additional transportation optimization in response to volume declines.
Through 2006, Postal Service annual reports often noted increases in highway contract miles resulting from increasing mail volumes. However, from 2007 through 2010, mail volume precipitously declined, yet highway miles continued to increase. It is likely that plant consolidations have led to more highway miles, and thus more ground transportation costs. However, the Postal Service’s annual reports did not provide adequate explanation of this result. There may have been a missed opportunity to adjust its highway contracts and lower transportation spending as mail volume declined. To support transparency and a greater understanding of what the Postal Service is doing regarding highway contracts, we encourage the Postal Service to more fully and consistently address mail volume, highway miles, and transportation costs in its future annual reports.34
It is also noteworthy that rail transportation decreased by more than 50 percent between 2006 and 2015. The OIG has advocated moving more mail by rail. In a previous report, the OIG found that by increasing its use of intermodal rail the Postal Service could save transportation costs, gain long-term strategic advantages, and still continue to meet existing service standards. Furthermore, the OIG found that competitors such as UPS and FedEx have become major users of rail over the last decade just as the Postal Service has moved away from it. In fact, UPS is now the single largest user of intermodal rail service in the United States.35
34 Annual report data shows that between 2006 and 2008, highway miles increased. In 2009, highway miles decreased slightly (by 0.8 percent). In 2010, highway miles increased again by 2.2 percent. Between 2011 and 2013, highway miles finally began to decline (by 5.4 percent, 3.8 percent, and 1.4 percent respectively). Highway miles increased again in 2014 (3.4 percent) and in 2015 (3.5 percent) based on Postal Service data.
35 Strategic Advantages of Moving Mail by Rail, Report No. RARC-WP-12-013, 2012, http://www.uspsoig.gov/sites/default/files/document-library-files/2015/rarc-wp-12-013_0.pdf. Suitability of Rail Transportation – New Jersey Network Distribution Center, Report No. NO-AR-14-013, 2014, http://www.uspsoig.gov/sites/default/files/document-library-files/2015/no-ar-14-013.pdf.
Peeling the Onion: The Real Cost of Mail Report Number RARC-WP-16-009 13

Figure 8 shows a breakdown of Postal Service transportation costs for 2015 and compares them to 2006.
Figure 8: Transportation: Air, Highway, Rail, and Water, Adjusted for Inflation, 2006 and 2015
Source: OIG Analysis of U.S. Postal Service Annual Report Data, 2006 and 2015 and Bureau of Labor Statistics CPI Data, 2006 and 2015.
Capital Spending
A lack of capital spending can raise long-term costs. Adjusted for inflation, Postal Service’s total capital expenditures have consistently been below its competitors, UPS and FedEx. On average, the Postal Service has decreased its annual capital expenditures to the tune of almost 16 percent annually the last 8 years. UPS has also decreased its annual capital investments but at a much smaller pace, while FedEx has continually increased its capital spending 2.3 percent annually on average. Figure 9 compares Postal Service’s inflation adjusted capital expenditures with those of UPS and FedEx. Furthermore, the right side of Figure 9 shows the annual percentage change on capital expenditures by each company.36
36 The time-period for this analysis is 2006 to 2014 because the 2015 UPS annual report was not published at the time this white paper was written.
A lack of capital spending
can raise long-term
costs. Stakeholders need to
develop a strategy to ensure
adequate long-term investment.
Peeling the Onion: The Real Cost of Mail Report Number RARC-WP-16-009 14

Figure 9: Annual Capital Spending: Postal Service, UPS, and FedEx, Adjusted for Inflation 2006-2014
Sources: OIG Analysis of U.S. Postal Service, UPS, and FedEx Annual Report Data, Bureau of Labor Statistics, CPI Data 2006-2014.
The Postal Service has a large network of workers, vehicles, and facilities to provide 6-day-a-week service to all addresses, while UPS and FedEx deploys their capital assets, such as cargo jets, to concentrate on targeting profitable customers.37 There are keen differences in missions, and therefore capital requirements between these private sector corporations and those of the Postal Service.38 Nevertheless, the Postal Service must now compete against the private sector, which uses the latest technologies for parcel mail volume to keep its average cost per piece low.39 Insufficient capital spending can raise Postal Service’s long-term costs. A better stakeholder strategy would include modernization investments. The OIG has presented a number of suggestions, such as through growth, diversification, new pricing strategy, or a combination of all three.
Even more concerning is that the Postal Service’s capital expenditures are less than its existing amortization and depreciation over the 2006 to 2015 time-period as is shown in Figure 10. The Postal Service needs to go above its historical capital expenditure levels given current and pending modernization and innovation needs, as well as future package handling demands.40
37 To keep things in perspective, if we just look at fiscal year (FY) 2014, the Postal Service employed 76 percent more employees than UPS. Due to FedEx’s legal disputes regarding misclassification of contractors and employees, we are unable to make a clear comparison between the Postal Service employment numbers and those of FedEx.
38 Unlike private sector firms, the Postal Service, by law, can only borrow from the U.S. Treasury. Treasury interest rates are obviously advantageous but the Postal Service’s statutory borrowing authority is capped at $15 billion. Borrowing to fund the PAEA RHB prepayments caused the Postal Service to reach this limit in September 2012. Thus, the Postal Service currently can only fund capital projects using cash on hand. UPS and FedEx can borrow from private sector financial institutions and issue stock to raise capital funds. Unlike the Postal Service, they have no statutory limitations to their borrowing.
39 “Amazon Tests Drones to Deliver Packages in Less Than 30 Minutes,” de zeen, http://www.dezeen.com/2013/12/02/amazon-tests-drones-that-could-deliver-packages-in-less-than-30-minutes/. “Skype Creators Launch Robotic Delivery Service,” Information Week, 12/02/2015, http://www.informationweek.com/mobile/mobile-devices/skype-creators-launch-robotic-delivery-service/d/d-id/1322954.
40 Of course there could be reasons other than under investment for depreciation and capital expenditures not to be equal in a given year. However, the overall trend shows a substantial gap between capital stock deterioration and investment. This is not sustainable for the long-term.
As America’s postal
communication and mail
delivery needs grow, the
Postal Service will require
additional investments in
buildings and equipment if it
is to adapt and modernize
its operations to meet growing
and changing demands.
Peeling the Onion: The Real Cost of Mail Report Number RARC-WP-16-009 15

Figure 10: Amortization and Depreciation versus Capital Spending, Trend Line Comparison, Inflation Adjusted, 2006 to 2015
Source: OIG Analysis of U.S. Postal Service Annual Report Data and Bureau of Labor Statistics CPI Data, 2006-2015.
As can be seen, capital spending exceeded depreciation and amortization expenses in 2006 and 2007. Capital expenditures then rapidly declined, until an uptick in 2015. Even so, the 2015 capital expenditures are still less than one-half of what it was in either 2006 or 2007. Such long-term trends can be harmful. One clear and obvious example of the lack of Postal Service capital investment, is the deterioration of postal owned delivery vehicles. This aging vehicle fleet has caused an uneconomic increase in maintenance costs.41
Given its mission to meet the future postal needs of citizens and businesses, this lack in investment should be a concern. Declining capital expenditures raises fundamental questions about future efficiency and service improvements. It seems unlikely the Postal Service can transform and modernize if it continues to decrease the amount it spends on basic upkeep and network modernization.
It’s the PrefundingPAEA’s prefunding payment to RHB costs are a primary source of the Postal Service’s financial difficulties. The Postal Service’s stakeholders have widely debated RHB’s complex issues and the details are beyond the scope of this paper.42 Here we ask the
41 U.S. Postal Service 2015 Annual Report, http://about.usps.com/who-we-are/financials/10k-reports/fy2015.pdf, p. 29. 42 U.S. Postal Service Office of Inspector General: OPM’s Long History of Miscalculations Involving Usps Benefit Funds, http://www.postal-reporter.com/blog/usps-oig-opms-
long-history-of-miscalculations-involving-usps-benefit-funds/.
Peeling the Onion: The Real Cost of Mail Report Number RARC-WP-16-009 16

question, how much would the Postal Service have had to charge on average in order to meet the nominal RHB payments due for the period? RHB costs are indeed large, amounting to about $49 billion for the period of FY 2006 to FY 2015.43 This is a difficult figure to keep in perspective. Yet it amounts to 2.8 cents per mail piece when placed in the context of the 1.8 trillion pieces of mail the Postal Service processed and delivered during the same period.44
To keep things in perspective, how does the RHB payment due per piece compare with what the Postal Service would have had to charge on average each year to break even in total? The Postal Service would have broken even with 3.1 cents in cost savings, or additional revenue (if the Postal Service were not constrained by the price cap), or a combination of both.45 It is interesting to note the similarity to the loss per piece, (3.1 cents) highlighting that it is the mandated RHB prefunding (2.8 cents) that accounts for Postal Service losses over the period. In other words, of the 3.1 cents in Postal Service losses, 2.8 cents is due to RHB.46
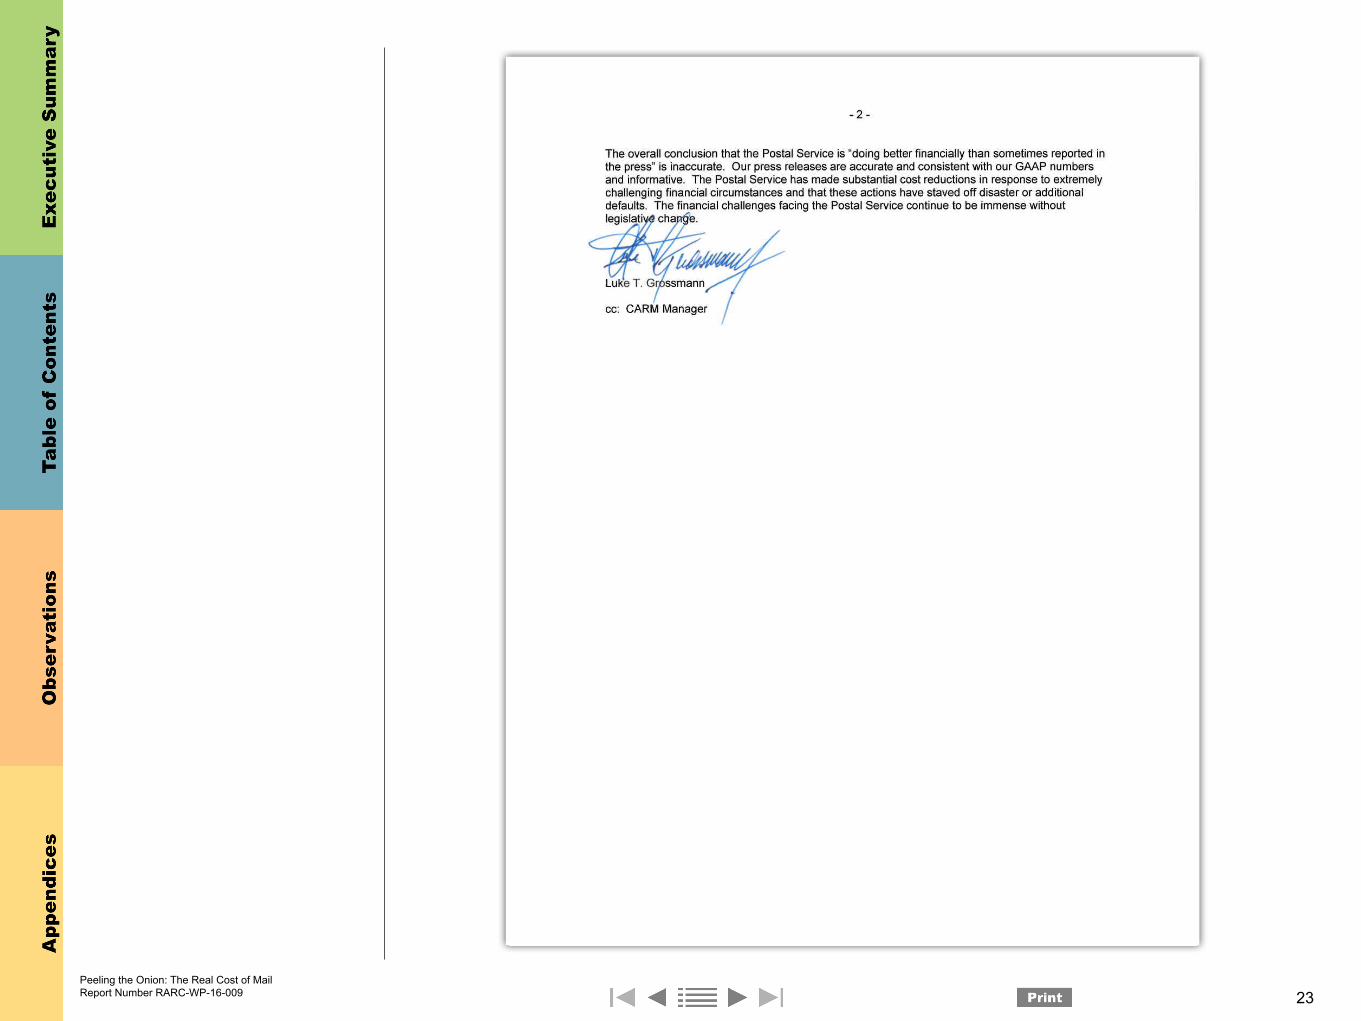
ConclusionOverall, the Postal Service is doing better financially than sometimes reported in the press. Since the passage of PAEA in 2006, the Postal Service has redesigned its network of processing plants, retail locations, delivery routes, and transportation systems, as well as modernized some of its workforce labor practices. However, some financial improvements came from pure cost cutting which may have affected service quality. The Postal Service also has defaulted on several RHB prefunding payments. These are not sustainable strategies. If the Postal Service is to meet the commercial and universal service needs of America’s growing population, it must continually seek to improve customer service and be allowed to make appropriate capital investments to fully integrate its network with the digital world. Postal stakeholders and management need to develop ways and means for generating adequate revenue so that the Postal Service can build for the future.
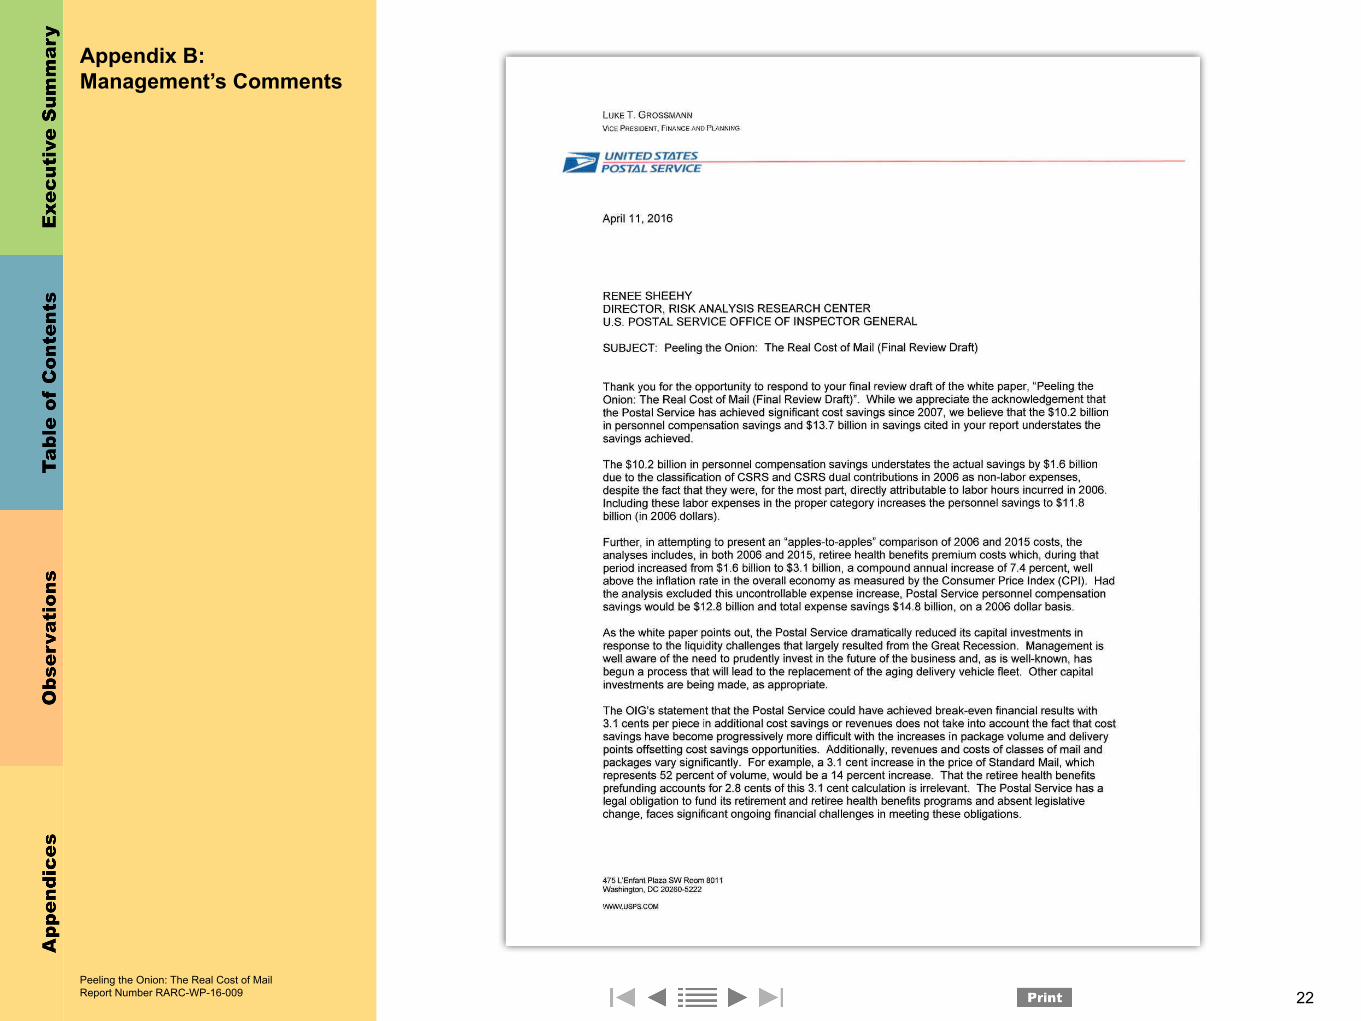
Summary of Management’s CommentsManagement expressed concern regarding the OIG’s classification of Civil Service Retirement Service (CSRS), Dual CSRS, and CSRS supplemental liability as non-labor expenses, claiming this approach understates labor savings by $1.6 billion. In addition, management argues that the OIG’s analysis understates total savings by including uncontrollable retiree health benefit premiums both in 2006 and 2015.
See Appendix B for management’s comments in their entirety.
Evaluation of Management’s CommentsThe OIG disagrees that the analysis understates labor savings. We excluded the Postal Service’s 2006 CSRS payments from the Postal Service’s labor costs to provide better comparability between 2015 and 2006. The Postal Service made no CSRS payments in 2015. When PAEA returned the CSRS costs for military service back to the federal government, it terminated the Postal Service’s regular CSRS employer contributions and suspended supplemental liability payments. As a result, the $1.6 billion
43 OIG analysis of historical U.S. Postal Service annual reports, 2006-2015.44 If the base year is chosen to be 2007, instead of 2006, the RHB loss per piece changes to 3.1 cents and the total loss per piece changes to 3.6 cents. We acknowledge
that RHB obligations began in FY 2007 however, our choice of the base year of 2006 reflects the mail volume within the time frame of our analysis, and it does not materially change our conclusions.
45 The loss per piece of 3.1 cents is calculated by subtracting total cost per piece from total revenue per piece and dividing the loss by the total number of mail pieces for the period of 2006 to 2015.
46 As this paper shows, analysis of cost per piece can lead to important insights, but it can also be complex. Interesting future analyses might include the impact of mix changes over time, the impact of volume changes on cost and other items not considered in this paper.
All else equal, 3.1 cents per
mail piece in cost savings,
or additional revenue, or a
combination of both would have
allowed the Postal Service to
break even. Of the 3.1 cents in
Postal Service losses, 2.8 cents
is due to RHB.
Peeling the Onion: The Real Cost of Mail Report Number RARC-WP-16-009 17

in cost savings from CSRS was outside the Postal Service’s control. In addition, the RHB prefunding payments in PAEA were structured to reduce the total budget effects of the legislation, including the effect of ending CSRS payments. Excluding the RHB payments while including the CSRS payments would not give an accurate picture of the change in labor costs.
Regarding retiree health benefit premiums, there are several reasonable ways to treat these costs. In our analysis, we chose to include them in both 2006 and 2015 because the Postal Service paid those payments pre- and post-PAEA. The effect of including or excluding the premiums does not change our general conclusion that the Postal Service has achieved significant savings since 2006.
Peeling the Onion: The Real Cost of Mail Report Number RARC-WP-16-009 18
Appendices
Click on the appendix title
to the right to navigate to
the section content
Appendix A: References ........................................................................20Appendix B: Management’s Comments ................................................22
Peeling the Onion: The Real Cost of Mail Report Number RARC-WP-16-009 19

Appendix A: References
“Amazon Tests Drones to Deliver Packages in Less Than 30 Minutes.” de zeen, 2013.
“Analyzing the Postal Service’s Retail Network.” U.S. Postal Service - OIG, RARC-WP-10-004, 2004.
Consumer Price Index: First Quarter 2011. Washington, DC: United States Bureau of Labor Statistics, 2011.
“Mobile Opportunities: Smart Service’s for Connected Customers.” U.S. Postal Service - OIG, RARC-WP-15-015, 2015.
“Number of Postal Employees since 1926.” U.S. Postal Service, 2015.
“Projecting U.S. Mail Volumes to 2020.” Boston Consulting Group, 2010.
“Rate Adjustment Due to Extraordinary Circumstances.” Postal Regulatory Commission (PRC), 2013.
“Resilience, UPS 2008 Annual Report.” Atlanta, GA: United Parcel Service, 2008.
“Retail Opportunities for the U.S. Postal Service.” Arlington VA, 2002.
“Skype Creators Launch Robotic Delivery Service.” Information Week, 12/02/2015 2015.
“Status of Workforce Reductions and Related Planning Efforts.” United States Government Accountability Office, 2014.
“Synchronizing Global Commerce, UPS 2006 Annual Report.” Atlanta, GA: United Parcel Service, 2006.
“Strategic Advantages of Moving Mail by Rail.” U.S. Postal Service - OIG, RARC-WP-12-013, 2012.
“Suitability of Rail Transportation – New Jersey Network Distribution Center.” U.S. Postal Service – OIG, NO-AR-14-013, 2014.
“U.S. Postal Service Annual Report on Form 10-K.” Washington, DC: United States Postal Service, 2006-2015.
“U.S. Postal Service - Office of Inspector General: OPM’s Long History of Miscalculations Involving USPS Benefit Funds.” Postal Reporter.Com, 2011.
“U.S. Postal Service - Status, Financial Outlook, and Alternative Approaches to Fund Retiree Health Benefits.” Edited by Government Accountability Office. Washington, DC, 2012.
“We’re All Part of Something Bigger, FedEx Annual Report 2006.” Memphis, TN: FedEx Corporation, 2006.
“We Help Others See Reach Thrive, FedEx Annual Report 2008.” Memphis, TN: FedEx Corporation, 2008.
“Management Alert – Substantial Increase in Delayed Mail.” U.S. Postal Service - OIG, NO-MA-15-004, 2015.
Steven Greenhouse. “Postal Service Is Nearing Default as Losses Mount.” New York Times, September 2011.
Gerald Perrins and Diane Nilsen. “Math Calculations to Better Utilize CPI Data.” edited by Department of Labor, 6.
Ron Nixon. “Post Office Says It Lost $1.9 Billion in Quarter.” The New York Times, May 9, 2015.
Daniel J. Richardson. “The U.S. Postal Service’s Financial Condition: A Primer.” Washington, DC: Congressional Research Service, 2014.
Ron Steel. “Trying to Stem Losses, Post Office Seeks to End Saturday Letter Delivery.” New York Times, February 6, 2013.
Robert Cohn and John Waller. “The Postal Service Variability Ratio and Some Implications.” Postal Regulatory Commission, 2014.
Peeling the Onion: The Real Cost of Mail Report Number RARC-WP-16-009 20

Jake Williams. “Postal Service Strives to Innovate Despite 4th Straight Treasury Default.” Fed Scoop, 2014.
Katelin P. Isaacs. “Federal Employees’ Retirement System: Benefits and Financing.” Congressional Research Service, 2015.
“Ensuring a Viable Postal Service for America. An Action Plan for the Future.” U.S. Postal Service, 2010.
“Financial Analysis of U.S. Postal Service Financial Results and 10-K Statement.” Postal Regulatory Commission, 2015.
“Analysis of Postal Price Elasticities.” U.S. Postal Service - OIG, RARC-WP-13-008, 2013.
Statement of Chief Human Resources Office and Vice President Jeffrey C. Williamson Before the Subcommittee on Federal Workforce, U.S. Postal Service and the Census United States House of Representatives. U.S. Postal Service, March 13, 2014.
“U.S. Postal Service Action Needed to Address Unfunded Benefit Liabilities.” Statement of Frank Todisco, United States Government Accountability Office, GAO-14-398T, 2014.
“The Cost Structure of the Postal Service: Facts, Trends, and Policy Implications.” U.S. Postal Service - OIG, RARC-WP-11-007, 2011.
“A Primer on Postal Costing Issues.” U.S. Postal Service - OIG, RARC-WP-12-008, 2012.
“The Internet of Postal things.” U.S. Postal Service - OIG, RARC-WP-15-013, 2015.
“Semiannual Fact Sheet.” U.S. Postal Service - OIG, 2015.
“United States Postal Service 2015 Annual Report to Congress.” U.S. Postal Service, 2015.
“Considerations in Structuring Estimated Liabilities.” U.S. Postal Service - OIG, FT-WP-15-003, 2015.
Kathryn A. Francis. “U.S. Postal Service Workforce Size and Employment Categories, FY1995-FY2014.” Congressional Research Service, 2015.
Eric Katz. “New Bill Puts Focus on Improving Postal Workforce Morale.” Government Executive, 2015.
“Five-Year Business Plan.” U.S. Postal Service, 2013.
Peeling the Onion: The Real Cost of Mail Report Number RARC-WP-16-009 21
Appendix B: Management’s Comments
Peeling the Onion: The Real Cost of Mail Report Number RARC-WP-16-009 22
Peeling the Onion: The Real Cost of Mail Report Number RARC-WP-16-009 23

Contact us via our Hotline and FOIA forms. Follow us on social networks.
Stay informed.
For media inquiries, contact Agapi DoulaverisTelephone: [email protected]
Contact Information
Peeling the Onion: The Real Cost of Mail Report Number RARC-WP-16-009 24