pedro francke ballvé
TRANSCRIPT

Pedro Francke BallvéMinister of Economy and Finance
September 2021

COVID StatusI
2
Table of Contents
Public Finance StatusIIPublic and Private InvestmentsIIIFiscal Strategy IVBudget, Indebtedness and Finance BalanceVESG Framework VI

COVID StatusI
3
Table of Contents
Public Finance StatusIIPublic and Private InvestmentsIIIFiscal Strategy IVBudget, Indebtedness and Finance BalanceVESG Framework VI

4
Health indicators have improved in the last few months
Cumulative evolution of COVID-19 vaccine doses administered and received2
Peru: excess deaths1
(Number of people, weekly cumulative)
1/ To Sep.15, 2021. 2/ Updated to Sep. 15, 2021.Source: Minsa..
Deaths in 20190
200
400
600
800
1,000
1,200
1,400
Feb-20 Aug-20 Feb-21 Sep-21
33,134,220
0
5,000,000
10,000,000
15,000,000
20,000,000
25,000,000
30,000,000
35,000,000
Feb-21 Apr-21 Jun-21 Aug-21
Administered doses
Total doses received
Sep-21

5
Gradual reduction of new cases By COVID-19
World: new cases per million1
(7-day moving average)
1/ Updated to Sep. 17, 2021.Source: Our World in Data.
0
200
400
600
800
1000
Jan-20 Apr-20 Jul-20 Oct-20 Dec-20 Mar-21 Jun-21 Sep-21
FranceUnited KingdomUnited StatesIndiaJapanThailandTurkeyMexicoPeru

6
Vaccination rate versus other countries in the region and the world
1/ Updated to Sep. 17, 2021.Source: Our World in Data.
World: Population vaccinated against COVID-19¹ (Percentage of total population by country)
27.019.0
13.731.431.831.3
54.554.4
42.253.1
62.236.1
65.264.963.7
69.573.273.676.3
37.539.8
42.243.2
47.848.6
60.663.763.965.466.467.9
71.472.973.6
75.676.578.1
79.9
PeruThailand
IndiaWorld
MexicoColombiaEcuador
United StatesArgentina
JapanGermany
BrazilUnited Kingdom
ItalyFrance
CanadaChile
UruguaySpain
Fully vaccinated
Partially vaccinated

Loreto
Ucayali
Junín
Lima
Ancash
Cusco
Madre de Dios
Puno
Arequipa
Piura
Huánuco
Pasco
SanMartín
La Libertad
Tacna
Moquegua
Ica
TumbesAmazonas
CajamarcaLambayeque
ApurímacAyacucho
Huancavelica
7
Advances in the vaccination process
Vaccination progress
34% of the total target population (27.4 million people) has been vaccinated with the two doses.
To date, more than 24 million doses have been applied nationwide. 2 million doses last week
More than 12 million doses of vaccines will arrive in September, a record number of arrivals in one month.
In Metropolitan Lima and Callao we are movingforward with the vaccination of over 23-year-olds,and in other regions, we are even moving forward withthe vaccination of over 16-year-olds.
The Vacunafests made it possible to achievesignificant levels of vaccinated population.
30292523201816
Vaccination by age groups1
1/ Updated to Sep. 17, 2021.Source: Minsa.

8
Perú has implemented an important economic plan against COVID-19
Economic measures against COVID-19, 2020-2021(% of GDP)
Between March 2020 and September 2021, Economic measures' Perú are equivalent to 21.6% of GDP (up toSeptember 17th, 2021).
Tax and public spending measures are equivalent to 7.8% of GDP (up to September 17th, 2021).
21.6
0
5
10
15
20
25
30
Advancedeconomies
Perú World Similar creditrating
Emerging Low incomes1
Note: The information for country groups corresponds to the updated data as of June 5th, 2021 published by the IMF.1/ For 2020, it considers the execution of public expenditure and revenue measures. For 2021, it considers the measures approved until September 17th.Source: IMF, MEF.

9Source: MEF.
The current administration has implemented measures to face the effects of the pandemic, but under fiscal responsibility guidelines
Family grants (Yanapay Perú)
• Cash transfers of S/ 350 (USD 85) that will strengthen the national economy and support family incomes.
Trabaja Perú
• Public spending program (mainly public investment) to create temporary jobs.
• “Bono Familiar Habitacional”: subsidies for housingconstruction.
• Acceleration of public investment through resource transfers
Capital transfers
The short-term objective is to reactivate the economy and employment.

COVID StatusI
10
Table of Contents
Public Finance StatusIIPublic and Private InvestmentsIIIFiscal Strategy IVBudget, Indebtedness and Finance BalanceVESG Framework VI

Source: BCRP. 11
Strong external fundamentals
Trade balance(Accumulated last 12 months, million US$)
12,517
0
2,000
4,000
6,000
8,000
10,000
12,000
14,000
Jan-19 Jun-19 Nov-19 Apr-20 Sep-20 Feb-20 Jul-21

Source: Central Bank 12
Terms of trade and export prices(Annual percent change)
5.4 5.30.7
-0.9
1.85.3 6.3
12.9 15.1 16.020.8 20.3 17.9 19.7 21.8
18.222.4
18.1
9.6
-10.2
47.6
31.9
-20
-10
0
10
20
30
40
50
60
Jan-20 Mar-20 May-20 Jul-20 Sep-20 Nov-20 Jan-21 Mar-21 May-21 Jul-21
Terms of trade
Export prices
Strong external fundamentals

Copper1
(¢US$/lb.)
131/ To Sep.16, 2021Source: Bloomberg.
Gold1
(US$/oz.tr.)Zinc1
(¢US$/lb.)
Strong Commodity Prices
4271 755
138
0
100
200
300
400
500
Jan-90 Jul-00 Feb-11 Sep-210
500
1,000
1,500
2,000
2,500
Jan-90 Jul-00 Feb-11 Sep-210
50
100
150
200
250
Jan-90 Jul-00 Feb-11 Sep-21

141/ To Sep.17, 2021Source: Central Bank
Exchange rate1
(Index, Dec-08=100)
50
100
150
200
250
300
Ene-07 Set-08 May-10 Ene-12 Set-13 May-15 Ene-17 Set-18 May-20
Brazil Chile Colombia Mexico Peru
The exchange rate was one of the most stable compared to other regional peers in the last decades

International Reserves, September 20211
(% of GDP)
1/ Considers the September advance for Mexico, Brazil, Chile and Peru, and the August result for Colombia. The percentage of GDP is calculated with information on Central Banks international reserves divided by the LatinFocus GDP projection for 2021, and in the case of Peru by the MEF GDP projection.Source: Central Banks. 15
The external position remains strong due to the accumulation of International Reserves
35.1
23.019.5
17.1 15.7
0
5
10
15
20
25
30
35
40
Peru Brazil Colombia Chile Mexico

16
Inflation(Annual percent change)
Interest rate(Percentage)
(*) Central Bank: macroeconomic expectations survey, Aug-21.Source: Central Bank
1.0
-2.07
-3
-1
1
3
5
Aug-17 Jun-18 Apr-19 Feb-20 Dec-20
Nominal interest rateReal interest rate
Sep-21
Prudent monetary policy management
Inflation target2.9
2.21.9 2.0
3.7
2.6
0.0
1.0
2.0
3.0
4.0
5.0
2010-19 2018 2019 2020 2021* 2022*

Source: Central Banks 17
Strong and fast recovery in LATAM
Mexico: IGAEColombia: ISE Chile: Imacec
85.1
104.4
80
85
90
95
100
105
110
Jan-19 Jun-19 Nov-19 Apr-20 Sep-20 Feb-21 Jul-21
86.7
101.8
85
90
95
100
105
Jan-19 Jun-19 Nov-19 Apr-20 Sep-20 Feb-21 Jul-21
77.0
102.1
75
80
85
90
95
100
105
Jan-19 Jun-19 Nov-19 Apr-20 Sep-20 Feb-21 Jul-21
74.4
97.9
70
75
80
85
90
95
100
105
110
Jan-19 Jun-19 Nov-19 Apr-20 Sep-20 Feb-21 Jun-21
78.9
97.5
75
80
85
90
95
100
105
Jan-19 Jun-19 Nov-19 Apr-20 Sep-20 Feb-21 Jun-21
59.0
99.4
50
60
70
80
90
100
110
Jan-19 Jun-19 Nov-19 Apr-20 Sep-20 Feb-21 Jul-21
Argentina: EmeaBrazil: IBCPeru: BCRP
Seasonally adjusted indices of economic activity in the region(Jan-20=100)

18
Latin America’s GDP(Annual percent change)
2021¹
1/ MEF forecast for Peru are considered. LAC: Latin America and the Caribbean.Source: IMF, Latinfocus (september 2021), MEF forecast
The Peruvian economy will continue to lead Latin America's economic growth in the next years
2022-2025¹
2.8
3.3
4.2
5.0
5.9
6.0
6.9
6.9
9.0
10.5
Uruguay
Ecuador
Paraguay
Brazil
Mexico
LAC
Colombia
Argentina
Chile
Peru
2.2
2.3
2.5
2.5
2.6
2.8
2.9
3.4
3.7
4.3
Brazil
Ecuador
Argentina
Mexico
LAC
Chile
Uruguay
Colombia
Paraguay
Peru

Peru’s GDP(Annual percent change)
Source: BCRP, INEI. 19
Economic activity continues to grow at significant rates and has already surpassed pre-COVID-19 levels
2.9 4.0
-17.7
-39.1-32.5
-18.1-11.1 -9.1 -6.0 -3.2 -2.1
1.0
-0.8 -3.5
20.0
59.4
48.3
23.412.9
2.1 0.4
-1.3 -2.9
0.1 1.1 0.4
Jan-20 Apr-20 Jul-20 Oct-20 Jan-21 Apr-21 Jul-21
Percentage change compared to 2019

20
GDP(Annual percent change)
Source: Central Reserve Bank of Peru (BCRP), MEF forecast
Peruvian economy will grow 10.5% in 2021 and will gradually converge to its potential level in the next years
5.9
2.4 3.3 4.02.5
4.02.2
-11.0
10.5
4.8 4.5 4.2 3.6
2013 2014 2015 2016 2017 2018 2019 2020 2021 2022 2023 2024 2025

21
Between 2022-2025, GDP will be supported by the improved operativity of sectors most affected, mining production, and a boost to productivity
GDP contributing activities1
(Percentage point contribution to GDP)
1/ The activities most affected by COVID-19 are commerce, lodging and restaurants, transportation, and business services.Source: BCRP, INEI, MEF forecast.
Boosting competitiveness and productivity
PNIC portfolio: 52 projects (S/ 114 billion)
The PNCP has an advance of34,5%
There are ten Executive Roundtables (ER)
ER with a sector development approach.
The last ones to be created were the ER for the reactivation of
gastronomy and supply markets.
PPP portfolio 2021: 20 projects(US$ 6,3 billion)
Between public –private
Public sector
Private sector
Public sector
Private sector
Between public - public
1.1 1.1 1.00.8
1.0
0.50.4
0.2
2.1
1.61.4
1.0
2022 2023 2024 2025
MiningActivities most affected by COVID-19

COVID StatusI
22
Table of Contents
Public Finance StatusIIPublic and Private InvestmentsIIIFiscal Strategy IVBudget, Indebtedness and Finance BalanceVESG Framework VI

23
Peru: credit to private business(Annual percent change)
Credit to private business, July1
(Annual percent change)
13.6 11.7 11.0
5.6 5.12.9 2.7 2.3 2.3 1.6 0.0
-11.6
Braz
il
Rus
ia
Chi
na
Peru
Uni
ted
Stat
esN
ewZe
alan
d
Aust
ralia
Fran
ce
Chi
le
Arge
ntin
a
Col
ombi
a
Mex
ico
1/ For Mexico, June data is considered.Source: Central Banks.
6.84.3
9.2
24.6
16.8
8.27.8
5.6
0
5
10
15
20
25
30
Jan-19 Jun-19 Nov-19 Apr-20 Sep-20 Feb-21 Jul-21
Favorable credit dynamics continue

241/ Economically active population.Source: INEI
Employment(Million of people)
16.8 17.0 17.2 17.4 16.5
11.0
14.516.4 16.3 16.8
19Q1 19Q2 19Q3 19Q4 20Q1 20Q2 20Q3 20Q4 21Q1 21Q2
Unemployment(% of labor force1)
5.2
3.6 3.5 3.6
5.2
9.3 9.5
7.3 7.5
5.5
19Q1 19Q2 19Q3 19Q4 20Q1 20Q2 20Q3 20Q4 21Q1 21Q2
In 2Q2021 employment has reached 99% of the 2Q2019 level (period without pandemic shock)
The labor market has been gradually recovering

Source: Minem, Ositran, Osiptel, Proinversion, MEF forecasts. 25
Major infrastructure and mining projects will contribute to boosting private investment and sustaining economic growth
Main infrastructure projects 2021-2025 Main mining projects 2021-2025
Project Investment(US$ million)
Situation
Muelle Sur Port Terminal 627
Line 2 of the Metro ofLima and Callao 5 346 Construction
Jorge Chavez Airport 1 200 Construction
Sol Highway 493 Construction
Salaverry Port Terminal 270 Construction
Chancay Port Terminal 3 000 Construction
To start
Project Investment(US$ million)
Situation
Michiquillay 2 500
Quellaveco and theToromocho Extension 6 655 Construction
Yanacocha Sulfuros 2 100
Magistral 490
Zafranal 1 263
Los Chancas 2 600
In addition, there is a PPP portfolio to be awarded between 2021-2022 for around US$ 6 billion
Expected in 2022
Expected in 2022
Expected in 2023
Expected in 2024
Expected in 2025

We are working on an agenda to boost investment, competitiveness and productivity
Boosting investments
Mining portfolio: 46 projects(US$ 56 billion), of which 28 of
them are at different development stages and could be viable
Boosting competitiveness and productivity
26
The PNCP has an advance of34,8%
Between public –private
Public sector
Private sector
Public sector
Private sector
Between public - public
There are ten Executive Roundtables (ER)
ER with a sector development approach.
The last ones to be created were the ER for the reactivation of
gastronomy and supply markets.
PNIC portfolio: 52 projects (S/ 114 billion)
PPP portfolio 2021: 20 projects(US$ 6,3 billion)
Source: BCRP, Iproinversion, Minem, MEF.

27Source: BCRP 27
Private and public investments have recovered rapidly
Private investment(Annual percent change)
Public investment(Annual percent change)
-8.0
9.9
-0.3 -6.1
15.1
-70.7
-24.9
14.923.9
251.2
42.7
2.8
19Q1 19Q2 19Q3 19Q4 20Q1 20Q2 20Q3 20Q4 21Q1 21Q2
Percentage change compared to 2019
3.0 5.8 9.2 0.5
-14.4
-57.0
-7.5
11.336.8
162.0
17.2 12.6
19Q1 19Q2 19Q3 19Q4 20Q1 20Q2 20Q3 20Q4 21Q1 21Q2
Percentage change compared to 2019

1/ Non-mining investment is calculated as the remainder between total and mining investment. Source: BCRP, Minem, Perupetro, Ositran, Osinergmin, Osiptel, Proinversion, MEF forecast.
Non-mining investment1
(86% of the total)
28
Progressive moderation of private investment in coming years
In 1H2021, private investment had a significant dynamism, grew 80.2% annual and exceeded 1H2019 levels by 14.8%.
Private investment(Annual percent change)
Mining investment(14% of the total)
In 2021, non-mining investment: Housing market dynamism (formal and self-
construction) Execution of large infrastructure projects: Metro
Line 2, J. Chavez Airport and Chancay Port.
2022-2025: execution of PNIC projects and the PPPportfolio.
In 2021, partial recovery due to the completion of MinaJusta and the absence of new large projects.
2022-2025: start of medium-sized projects: 2022: Yanacocha Sulfuros and Magistral 2023-2025: Zafranal, Los Chancas and Michiquillay
-4.2 -5.2
0.14.1 4.5
-16.5
20.0
5.5 4.8 4.0 4.0
2015 2017 2019 2021* 2023* 2025*

Leading indicators continue to grow above pre COVID-19 levels
29
Capital goods imports (Annual percent change)
32.6
5.3
-60
-30
0
30
60
90
120
Jan-20 May-20 Sep-20 Jan-21 May-21
Percentage change compared to 2019
Aug-21
Source: COES, BCRP, Sunat
Electricity production(Annual percent change)
7.13.6
-40
-20
0
20
40
60
Jan-20 May-20 Sep-20 Jan-21 May-21 Aug-21
Percentage change compared to 2019

COVID StatusI
30
Table of Contents
Public Finance StatusIIPublic and Private InvestmentsIIIFiscal Strategy IVBudget, Indebtedness and Finance BalanceVESG Framework VI

10.811.7
9.88.8
4.6
7.6 7.3
8.99.210.4
7.7
5.7
3.4
8.87.1
4.7
0.9
3.72.8
4.93.6
2.52.0
1.0
World Advancedeconomies
Emergingmarkets
LatinAmerica
Mexico Colombia Chile Peru
2019 2020 2021 2022 2023 2024 2025 2026
31
Fiscal policy challenges around the world – Gradual Normalization
Fiscal deficit(% of GDP)
Note: Chile's fiscal deficit from 2022 onwards correspond to their structural fiscal deficit.Source: IMF, Ministries of Finance of Chile and Colombia.
In 2021, we are observing a generalized reduction in fiscal deficits. Such process of fiscal consolidation will gainstrength in 2022 and continue for the following years. Countries will gradually withdraw their fiscal impulse in order tomaintain the sustainability of its public finances.

21.619.9 19.2 19.9
23.4 23.9 24.9 25.8 26.8
34.7 35.3
2011 2012 2013 2014 2015 2016 2017 2018 2019 2020 2021
2.1 2.3
0.9
-0.2
-1.9 -2.3-3.0
-2.3-1.6
-8.9
-4.7
2011 2012 2013 2014 2015 2016 2017 2018 2019 2020 2021
32
Short-term fiscal strategy: fiscal policy will focus on expenditures related to the pandemic and support the process of economic recovery
Overall balance(% of GDP)
Public debt(% of GDP)
Source: BCRP, MEF forecast.

33
Medium-term fiscal strategy: execute a gradual and orderly withdrawal of fiscal impulse that strengthens the fiscal accounts without generating imbalances in the economy
Source: BCRP, MEF forecast.
For 2022, the fiscal rules for the overall balance (fiscal deficit no greater than 3.7% of GDP) and public debt (no greater than 38% ofGDP) were established through Emergency Decree No. 079-2021.
For the following years, the fiscal rules will be regulated by a Law.
Overall balance(% of GDP)
Public debt(% of GDP)
-1.6
-8.9
-4.7
-3.7
-2.7
-1.7-1.0 -1.0 -1.0 -1.0 -1.0 -1.0
2019 2020 2021 2022 2023 2024 2025 2026 2027 2028 2029 2030
26,8
34,7 35,336,6
37,4 36,735,8
34,934,1
33,332,5
31,7
2019 2020 2021 2022 2023 2024 2025 2026 2027 2028 2029 2030

54.7
73.2
55.6
72.268.4
75.8
53.3
60.8
28.2
38.5
26.8
34.9
20
30
40
50
60
70
80
2019 2020 2021 2022 2023 2024 2025 2026
Peru
Chile
Mexico
Colombia
Latin America
Emerging markets
34
Peru will maintain sound fiscal accounts: the country's public debt will continue to be one of the lowest in the emerging markets
Source: IMF, BCRP, MEF forecasts.
Public debt(% of GDP)

35
A favorable credit rating allows the Government and private companies to access financing at low interest rates to promote investments that boost the economic growth and citizens’ well-being
1/ Measured through the EMBI+, which is one of the main country risk indicators and is calculated by JP Morgan. It corresponds to the difference in the interest rate paid by the bonds denominated in dollars, issued by the emerging country and theTreasury Bonds of the United States.Source: Bloomberg, BCRP.
Country risk1
(Percentage points)
Lower levels of country risk allow the Government to obtain competitive interest rates in the capital markets. Thisreduces interest payments, providing space for productive public spending.
NFPS’s interest payments of public debt(% of GDP)
9.1
4.7
2.8 2.5 2.3 2.11.7
1.2 1.1 1.21.6
1990 1993 1996 1999 2002 2005 2008 2011 2014 2017 2020
50
150
250
350
450
550
650
750
Jan
-16
Apr
-16
Aug
-16
Dec
-16
Apr
-17
Aug
-17
Dec
-17
Apr
-18
Aug
-18
Dec
-18
Apr
-19
Aug
-19
Dec
-19
Apr
-20
Aug
-20
Dec
-20
Apr
-21
Aug
-21
Latin America Emerging marketsColombia MexicoChile Peru

36
Amortization payments on public debt are concentrated in the medium and long term
Source: MEF.
Amortization payments on public debt(USD billion)
0,6 1,0 1,3
2,9 2,6
6,2
2,0
5,0 4,8
2,6
7,5
5,9
3,3 2,9
0,8 0,5
4,0
2,2
1,2 1,1
0,2
2,0 2,5
1,0 0,1
0,6
2,0
1,0
0
1
2
3
4
5
6
7
8
2021
2022
2023
2024
2025
2026
2027
2028
2029
2030
2031
2032
2033
2034
2035
2036
2037
2040
2041
2042
2046
2047
2050
2051
2054
2055
2060
2121

Peru (2020)
Peru (2014)
Chile (2017)
Colombia (2015)
Mexico (2016)
VAT CIT
38.1 49.5
29.0 44.1
20.0 31.0
16.4 19.2
20.1 34.4
37
There is scope of action to increase permanent revenues given the low levels of collection compared to other countries in the region and the OECD, and the high levels of non-compliance
Tax non-compliance by country(VAT and third category CIT non-compliance2 3 - % of
potential collection)
For this reason, it will seek to work on administration and tax policy measures that cover the following aspects:o Raise the progressivity of the tax systemo Simplification and harmonization of the tax systemo Improvement of consumption taxes
o Increase the efficiency of tax exemptionso Reduce high levels of tax evasion: cost of 8% of GDP.o Reduce informality: more than 70% of the EAP.
Latin America and OECD: relationship between revenues and non-financial expenditure of the general government1
(% of GDP)
OECD: Organization for Economic Cooperation and Development.1/ Information for the year 2019. 2/ Tax non-compliance is calculated as the difference between taxes that government could collect (potential collection) and what it collects. 3/ For Peru it corresponds to the ratio between the estimated non-complianceand the potential determined tax, net of the effect of tax expenditures, while for the rest of the countries it refers to corporate income tax non-compliance. In the case of Colombia, Chile and Peru, corporate income tax non-compliance corresponds to 2012,2009 and 2019, respectively. Source: BCRP, Cepal, Ministry of Economy and Tax Administrations of the countries, OECD, Sunat, MEF.
Peru
Chile
Colombia
Brazil
MexicoLatin America
Emerging countries
Advanced countries
OECD
15
20
25
30
35
40
45
19 24 29 34 39 44
Non
-fina
ncia
l ex
pend
iture
General government revenues

19.9
23.6 23.626.3 27.1
29.431.4
33.2 33.9
39.9
Peru CHL MEX EMDE LAC COL BRA ECU ARG OECD1 2
38
In the medium term, one of the objectives of fiscal policy will be to draw closer tax collection levels to the one of regional peers in order to reduce existing gaps in public services
General government revenue, 2019(% of GDP)
1/ Emerging markets and developing economies.2/ Represents the non-weighted average of 37 OECD member countries.Source: OECD, WEO-IMF, BCRP.
General government non-financial expenditure, 2019(% of GDP)
20.022.2
25.927.5
29.2 29.432.3 33.7 34.3
40.0
PER MEX CHL LAC EMDE COL BRA ECU ARG OECD1 2

Average ratingAAAAA+AAAA-
A+
A ChileA-
BBB+ PeruBBB Mexico UruguayBBB-
BB+ Colombia ParaguayBB
BB- BrazilB+
B BoliviaB- Ecuador
CCC+
CCC ArgentinaCCC-
CC
C
SD Venezuela
Country
Inve
stm
ent g
rade
Spec
ulat
ive g
rade
39
Sound fiscal accounts support a favorable credit rating: Peru has the second-best credit rating among LAC countries
Source: S&P, Moody’s, Fitch.

COVID StatusI
40
Table of Contents
Public Finance StatusIIPublic and Private InvestmentsIIIFiscal Strategy IVBudget, Indebtedness and Finance BalanceVESG Framework VI

41
The 2022 budget is consistent with a 3.7% fiscal deficit
Public budget1
(Billions of S/)
1/ Initial Opening Budget. Source: MEF forecast.
In 2022, public budget amounts to S/ 197 billion (USD 50 billion). The public budget is consistent with a fiscal deficit of 3.7% of GDP, allowing an expansion of public investment.
119131
138 142
157168
177183
197
27 2627 27
28
33 34
4042
20
25
30
35
40
45
50
55
60
60
80
100
120
140
160
180
200
220
2014 2015 2016 2017 2018 2019 2020 2021 2022
Public budget Public investment (right axis)

42
The 2022 budget allows the financing of 5 priorities
Health and Sanitary Emergency
attentionEducation
Strengthening agricultural
competitiveness
1 2 3
Social ProtectionPromotion of
employment and productivity
54
43
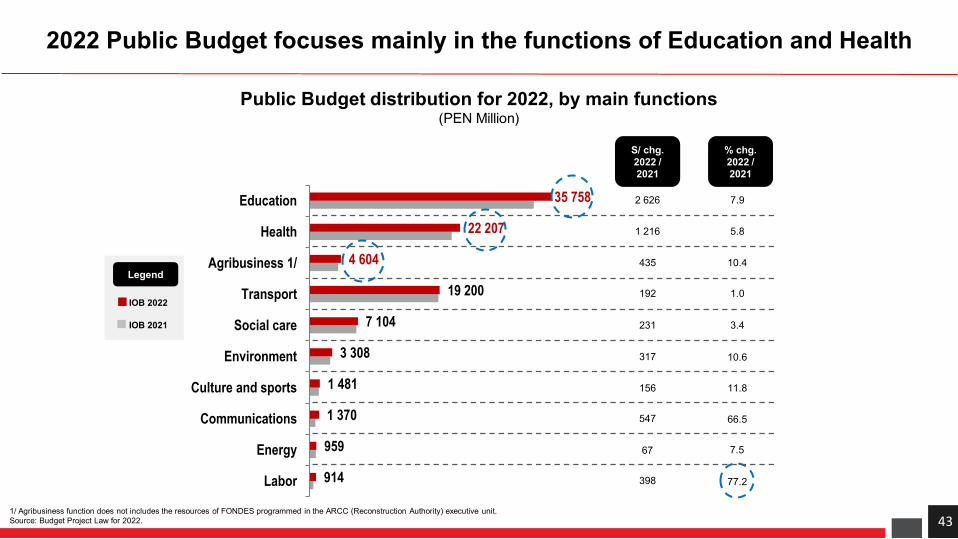
2022 Public Budget focuses mainly in the functions of Education and Health
Public Budget distribution for 2022, by main functions(PEN Million)
IOB 2022
IOB 2021
Legend
914
959
1 370
1 481
3 308
7 104
19 200
4 604
22 207
35 758
Labor
Energy
Communications
Culture and sports
Environment
Social care
Transport
Agribusiness 1/
Health
Education
S/ chg.2022 / 2021
2 626
1 216
435
192
231
156
547
317
67
398
% chg.2022 / 2021
7.9
5.8
10.4
1.0
3.4
10.6
11.8
66.5
7.5
77.2
1/ Agribusiness function does not includes the resources of FONDES programmed in the ARCC (Reconstruction Authority) executive unit.Source: Budget Project Law for 2022.

44
Composition of 2022 Indebtedness Project Law
Maximum amounts of public indebtedness for 2022(USD million and PEN Million)
This law approves the issuance of sovereign bonds up to PEN 30.6 billion (around USD 7.6 billion) for the payment of debt service andthe financing of projects in many sectors.
Additionally, approves debt management operations up to USD 6 billion (in the framework of the Asset and Liability ManagementStrategy).
Also, this law authorizes the implementation of an ETF (according to the program “Issuer-Driven ETF” with the World Bank).
1/ ONP bonds and national defense.Source: 2022 Indebtedness Project Law.
External public debt
USD million PEN million Equivalent in USD million
Economic and social sectors 1 200 15 000 3 722Public debt service 445 19 708 4 890Others¹ 409 101
Total 1 645 35 116 8 714
ItemInternal public debt

45
Composition of 2022 Indebtedness Project Law
Source: 2022 Indebtedness Project Law.
2022 public indebtedness(% of total)
2022 public indebtedness by item(% of total)
External public debt16%
Internal public debt84%
Economic and social sectors
48%Public debt service
51%
Others1%

COVID StatusI
46
Table of Contents
Public Finance StatusIIPublic and Private InvestmentsIIIFiscal Strategy IVBudget, Indebtedness and Finance BalanceVESG Framework VI

47
The Republic of Peru has made significant progress in relation to the Sustainable Development Goals (SDG)
Source: Sachs, J., Kroll, C., Lafortune, G., Fuller, G., Woelm, F. (2021) – “The Decade of Action for the Sustainable Development Goals: Sustainable Development Report 2021”.
Ranking Country Score1 Chile 77.1 2 Uruguay 74.5 3 Cuba 73.7 4 Costa Rica 73.6 5 Argentina 72.8 6 Ecuador 72.5 7 Brazil 71.3 8 Peru 71.1 9 Dominican Republic 70.8 10 Colombia 70.6 11 México 69.1 12 Jamaica 69.0 13 Barbados 68.4 14 Panama 68.0 15 El Salvador 67.9 16 Bolivia 67.6 17 Suriname 67.0 18 Paraguay 66.9 19 Nicaragua 66.3 20 Belize 64.4 21 Trinidad and Tobago 63.5 22 Honduras 62.8 23 Guatemala 59.9 24 Venezuela, RB 59.3 25 Guyana 57.9 26 Haiti 51.4
SDG Index (Score)
LAC Average: 68.5
SDG Index - LAC 2021(Score)
71,1
77,1
70,6 69,1
71,3
60
62
64
66
68
70
72
74
76
78
80
2000 2003 2006 2009 2012 2015 2018 2021
Peru
Chile
MexicoColombia
Brazil

48
Peru Sustainable Bond Framework
Public Policies
National Development and Social Inclusion Policy
National Gender Equality Policy
National Policy on Older Adults
National Environmental Policy
National Environmental Education Policy
National Financial Inclusion Policy -PNIF.
National Competitiveness and Productivity Policy
Second Party OpinionSustainalytics is of the opinion that the Peru Sustainable Bond Frameworkis credible and impactful and aligns with the Sustainability Bond Guidelines2021, Green Bond Principles 2021, and Social Bond Principles 2021. Thisassessment is based on the following: Use of proceeds Project evaluation / selection Management of proceeds Reporting
International Environmental Commitments Paris Agreement Aarhus Convention Minamata Market Convention
Agreement on Environmental Cooperation (Perú-Chile)
Marrakesh Agreement
1
Elegible Social Categories
Elegible Green Categories
Support for vulnerable groups and people in vulnerable situations
Aceess to affordable housing, education and essential health services
Support for MSMEs and social programs to
alleviate and/or prevent unemployment
Green buildings
Efficient and resilient wáter and wastewater
management
Energy efficienccy
Sustainable Agriculture
Renewable Energy
Sustainable management of natural resources, land use and marine protected areas
Low carbon
transport
Sustainable waste management
As member of the United Nations, Peru has a comprehensive visión of development that aims to achieve
the SDGs

Pedro Francke BallvéMinister of Economy and Finance
September 2021