pedaling analysis - elite cycling · pedaling analysis pedaling analysis is a new and exclusive...
TRANSCRIPT

PEDALING ANALYSIS
Pedaling Analysis is a new and exclusive DIRETO feature developed by Elite to monitor the rider’s power output throughout each pedal stroke.
The rider can monitor the power output variations of each pedal stroke, and will better understand the coordinated action of extensors and flexors muscles, the smoothness of the pedaling and the mechanical efficiency of the movement itself.
This translates into real improvement in the rider’s performance, for both amateurs and pros alike, by a more efficient application of power throughout the pedal stroke.
DIRETO features a highly accurate power monitor that reads power output with +/- 2,5% accuracy by utilizing optical sensor technology that measures the torsion of the hometrainer’s axis.
PEDALING ANALYSIS
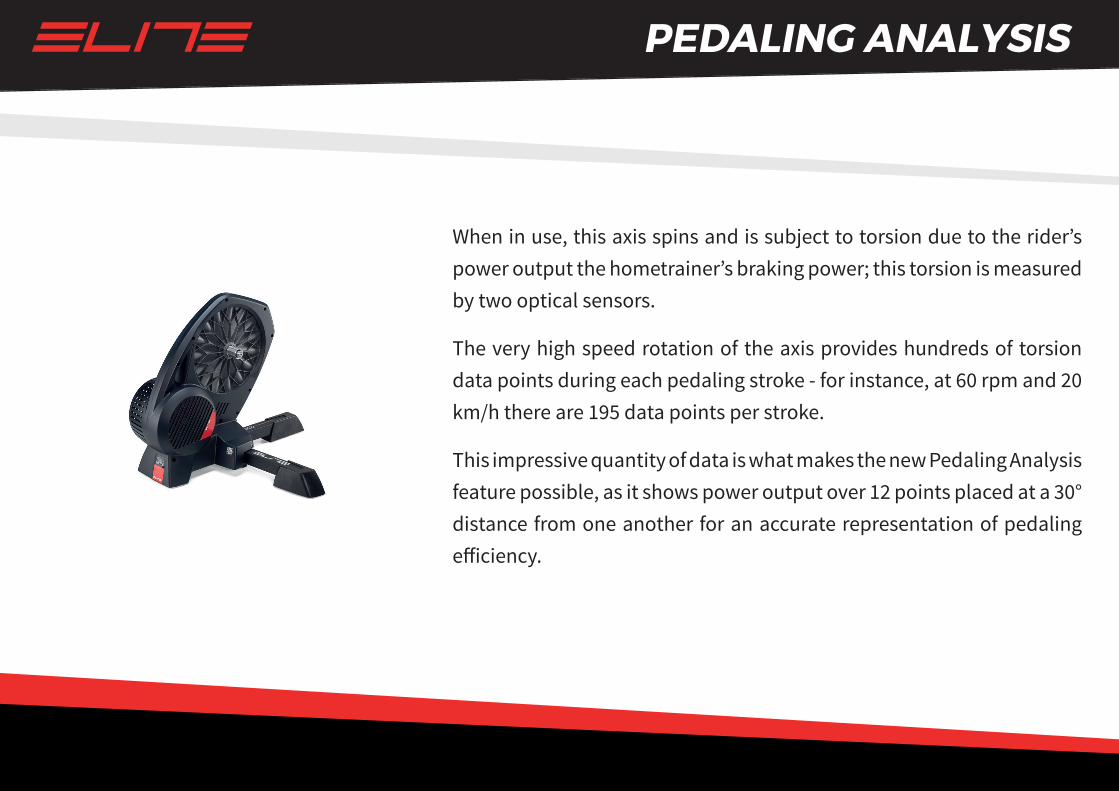
When in use, this axis spins and is subject to torsion due to the rider’s power output the hometrainer’s braking power; this torsion is measured by two optical sensors.
The very high speed rotation of the axis provides hundreds of torsion data points during each pedaling stroke - for instance, at 60 rpm and 20 km/h there are 195 data points per stroke.
This impressive quantity of data is what makes the new Pedaling Analysis feature possible, as it shows power output over 12 points placed at a 30° distance from one another for an accurate representation of pedaling efficiency.
PEDALING ANALYSIS
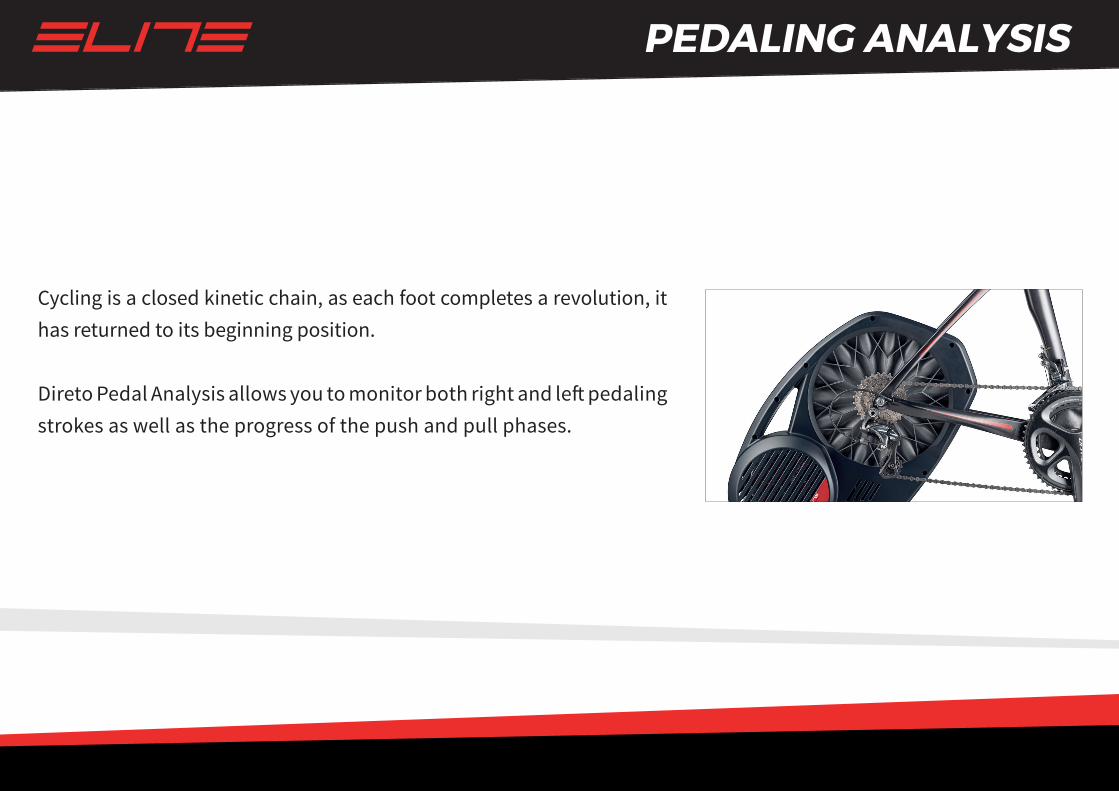
Cycling is a closed kinetic chain, as each foot completes a revolution, it has returned to its beginning position.
Direto Pedal Analysis allows you to monitor both right and left pedaling strokes as well as the progress of the push and pull phases.
PEDALING ANALYSIS
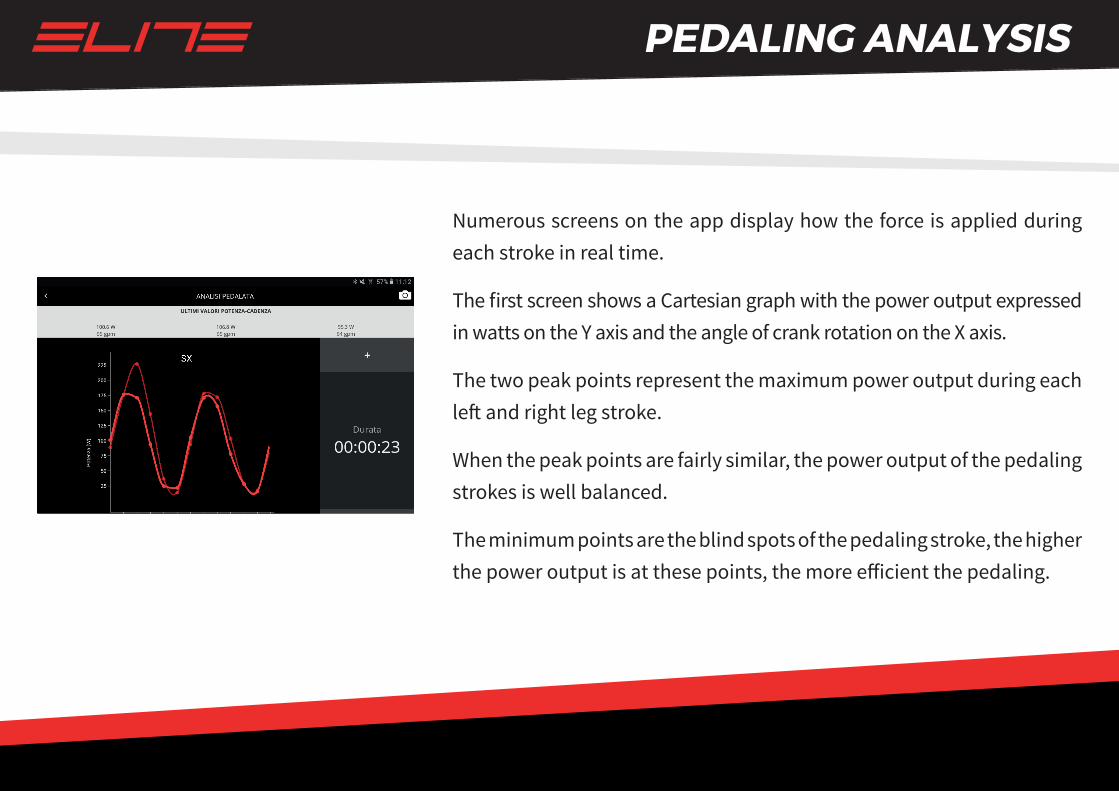
Numerous screens on the app display how the force is applied during each stroke in real time.
The first screen shows a Cartesian graph with the power output expressed in watts on the Y axis and the angle of crank rotation on the X axis.
The two peak points represent the maximum power output during each left and right leg stroke.
When the peak points are fairly similar, the power output of the pedaling strokes is well balanced.
The minimum points are the blind spots of the pedaling stroke, the higher the power output is at these points, the more efficient the pedaling.
PEDALING ANALYSIS
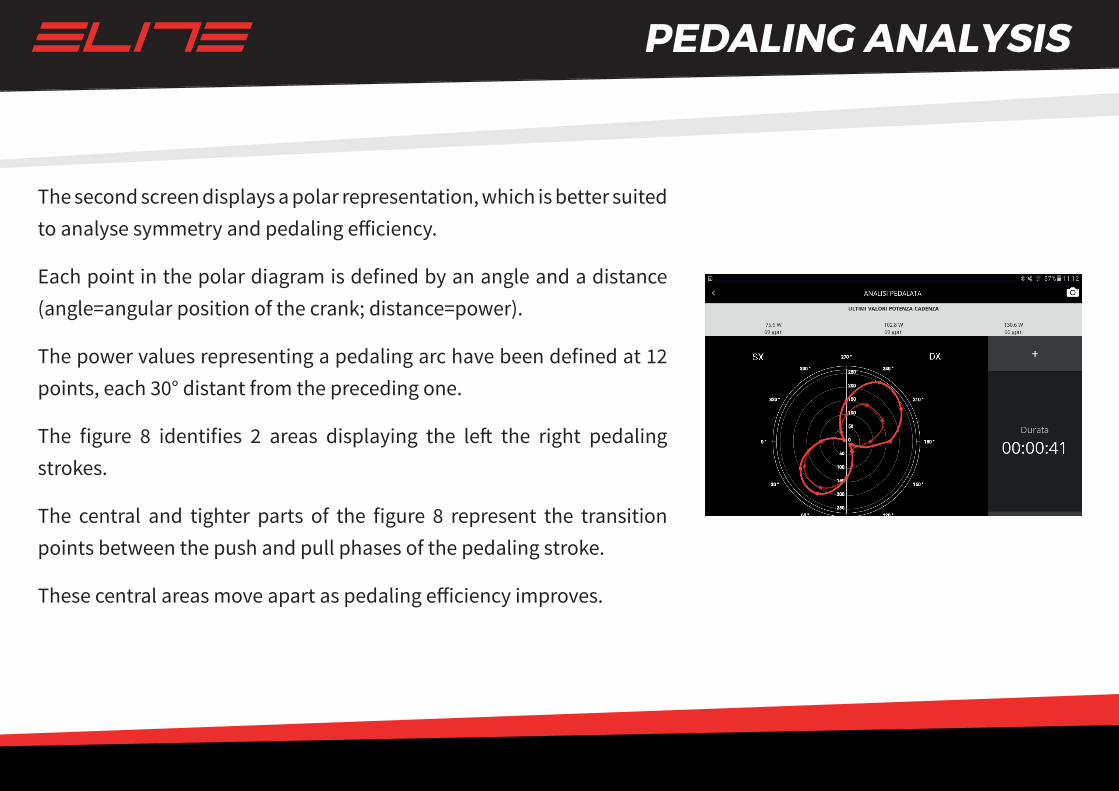
The second screen displays a polar representation, which is better suited to analyse symmetry and pedaling efficiency.
Each point in the polar diagram is defined by an angle and a distance (angle=angular position of the crank; distance=power).
The power values representing a pedaling arc have been defined at 12 points, each 30° distant from the preceding one.
The figure 8 identifies 2 areas displaying the left the right pedaling strokes.
The central and tighter parts of the figure 8 represent the transition points between the push and pull phases of the pedaling stroke.
These central areas move apart as pedaling efficiency improves.
PEDALING ANALYSIS
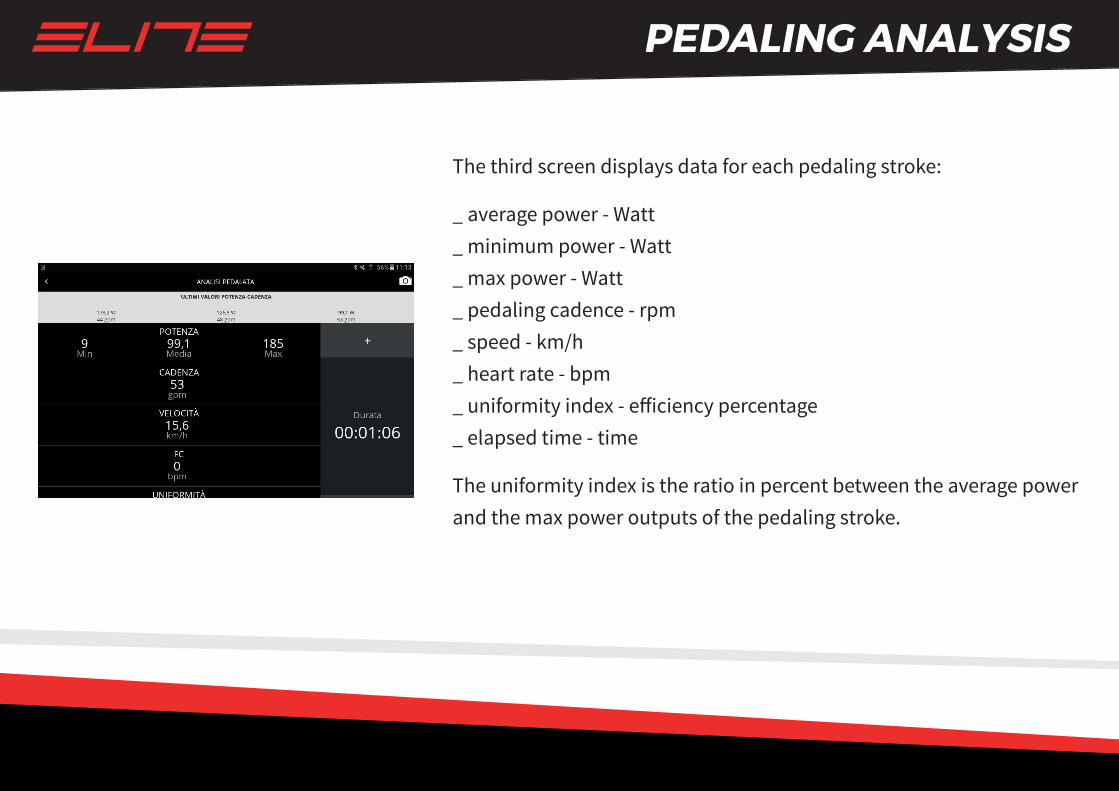
The third screen displays data for each pedaling stroke:
_ average power - Watt_ minimum power - Watt_ max power - Watt_ pedaling cadence - rpm _ speed - km/h _ heart rate - bpm _ uniformity index - efficiency percentage_ elapsed time - time
The uniformity index is the ratio in percent between the average power and the max power outputs of the pedaling stroke.
PEDALING ANALYSIS
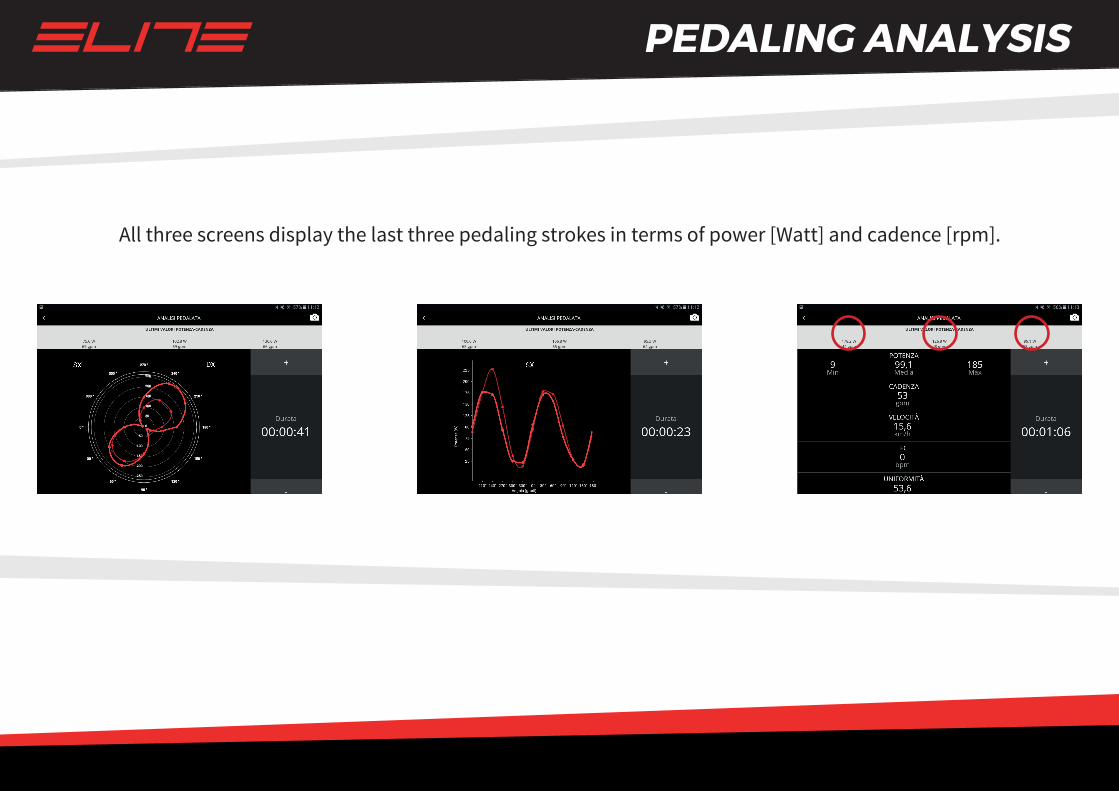
All three screens display the last three pedaling strokes in terms of power [Watt] and cadence [rpm].
PEDALING ANALYSIS
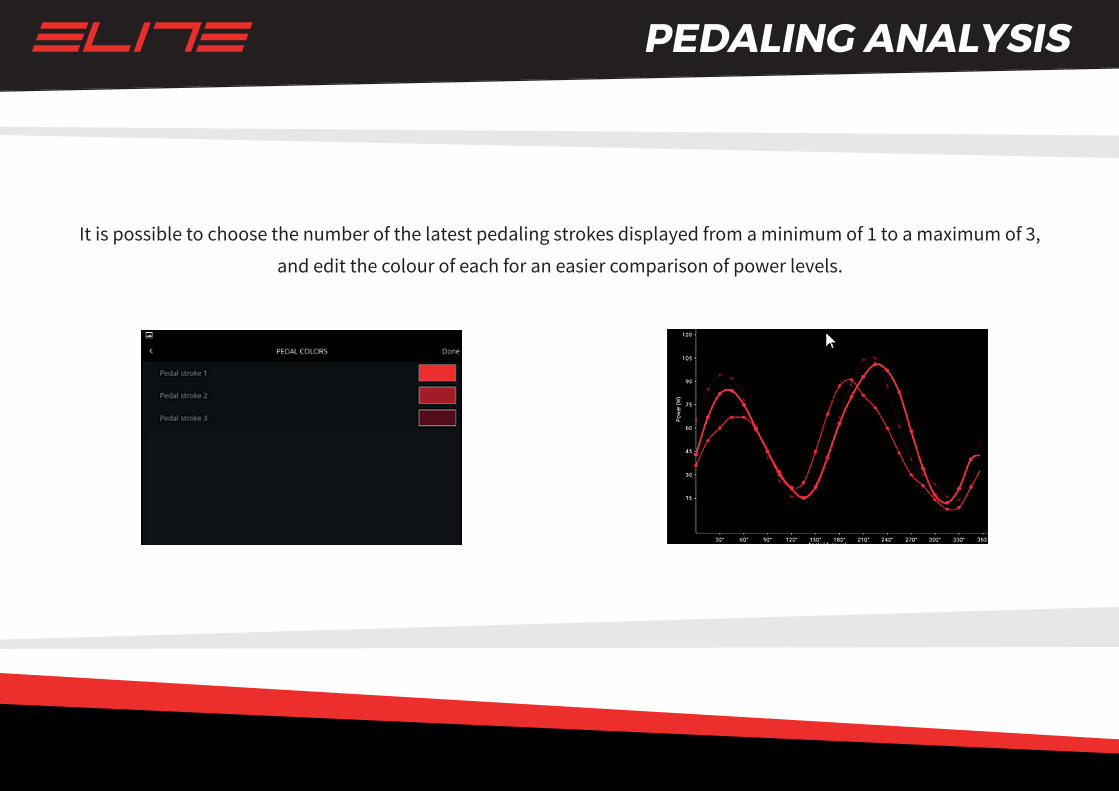
It is possible to choose the number of the latest pedaling strokes displayed from a minimum of 1 to a maximum of 3,
and edit the colour of each for an easier comparison of power levels.
α°
-α°
PEDALING ANALYSIS
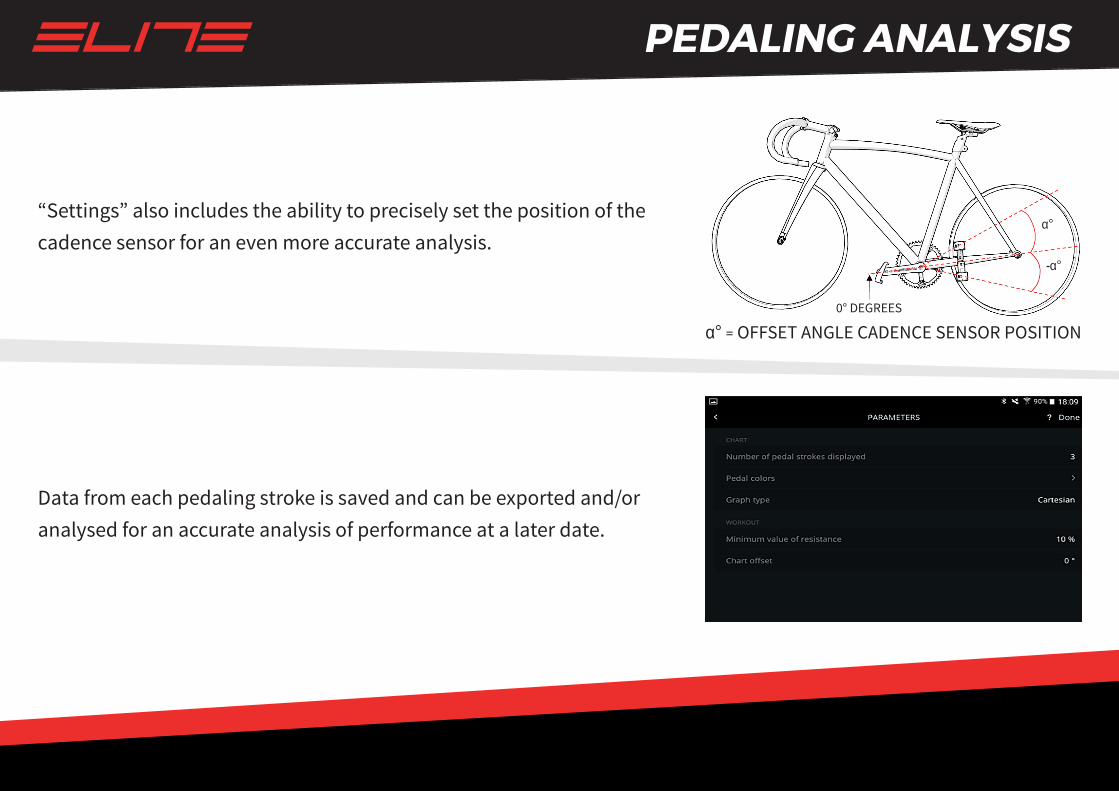
“Settings” also includes the ability to precisely set the position of the cadence sensor for an even more accurate analysis.
Data from each pedaling stroke is saved and can be exported and/or analysed for an accurate analysis of performance at a later date.
α° = OFFSET ANGLE CADENCE SENSOR POSITION0° DEGREES
PEDALING ANALYSIS
Pedaling analysis is available on the My E-Training Software - Mobile & Desktop
In-App purchases :